Research on Temperature Variation during Coal and Gas Outbursts: Implications for Outburst Prediction in Coal Mines


Abstract
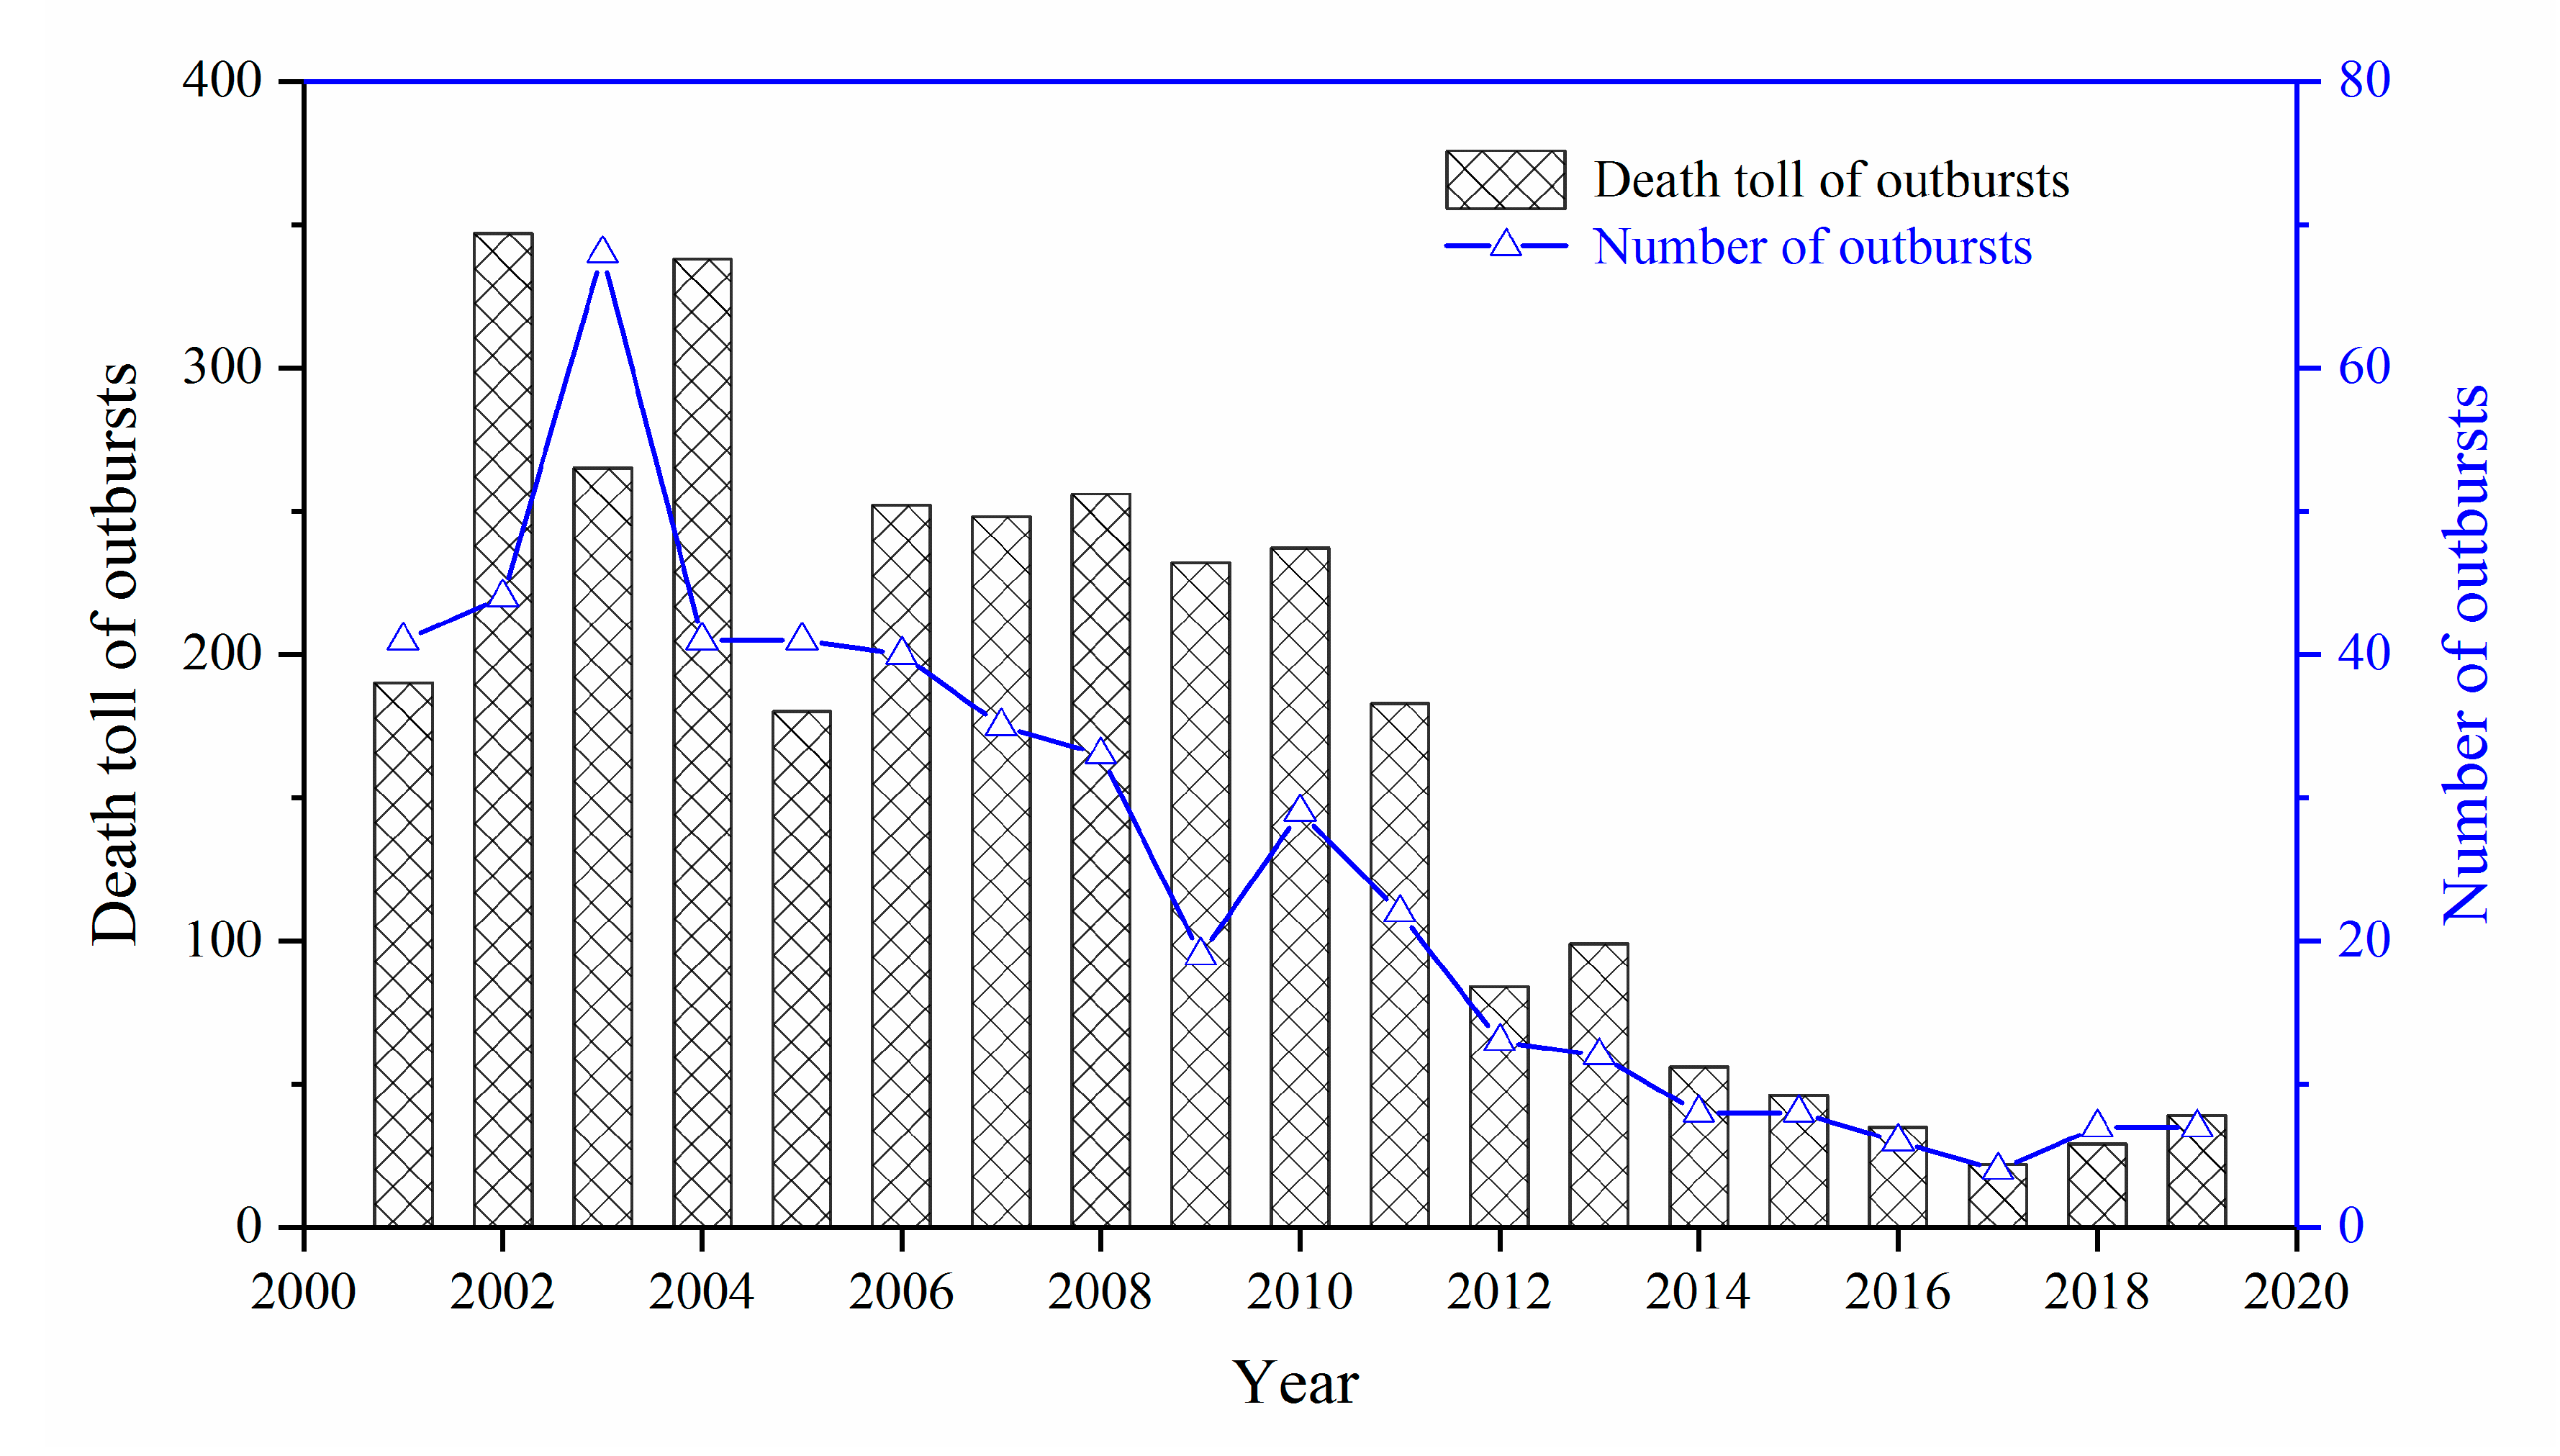
1. Introduction
2. Experimental Method
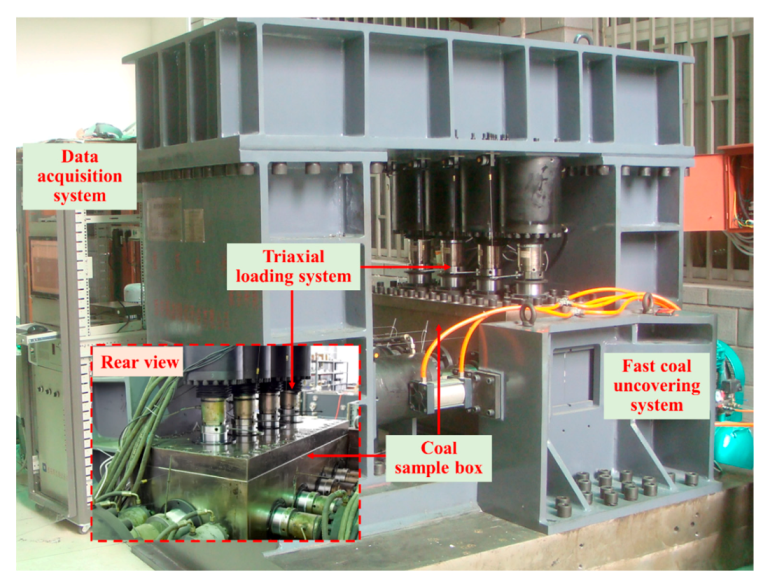
2.1. Test Equipment
2.2. Test Scheme
2.3. Test Procedure
3. Results and Discussion
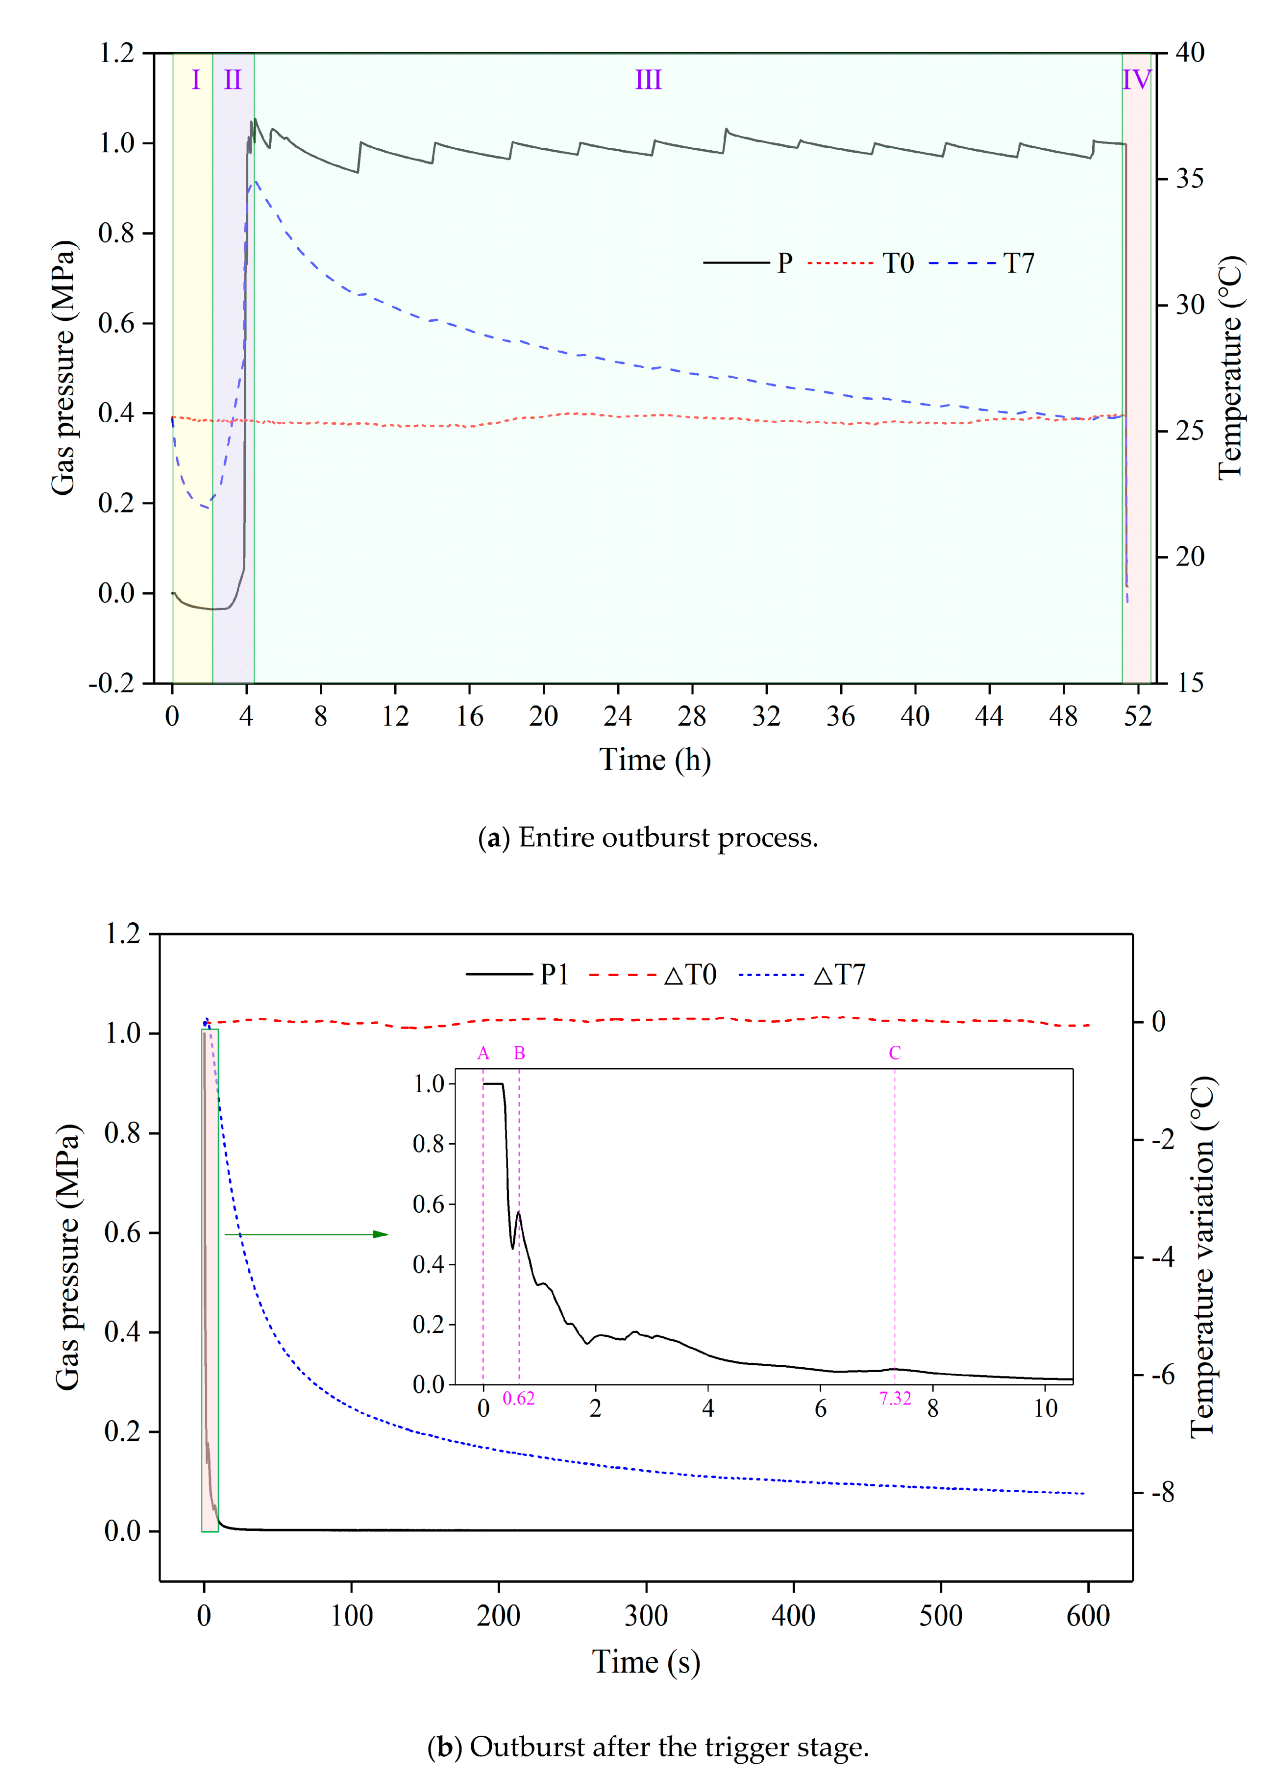
3.1. Dynamic Evolution of the Outburst Process
- Sub-process Ⅰ was the vacuuming step, lasting two hours. The gas pressure in the coal dropped from 0 to −0.035 MPa (the atmospheric pressure was defined as 0 MPa). The coal temperature decreased from 25.51 to 21.93 °C, and the ambient temperature fluctuated between 25.45 and 25.51 °C.
- Sub-process Ⅱ was the gas injection step, lasting approximately two hours. The gas pressure in the coal rebounded to 1.048 MPa. The coal temperature rebounded to 34.815 °C, and the ambient temperature fluctuated between 25.40 and 25.45 °C.
- Sub-process Ⅲ was the cyclic gas injection-adsorption step, and it lasted about 48 h [35,36]. The coal sample was circularly injected with gas in a total of 12 cycles, and each cycle lasted approximately four hours. The equilibrium pressure gradually stabilized to 1 MPa, and the coal temperature dropped to the constant ambient temperature of 25.66 °C.
- Sub-process Ⅳ was the outburst step, lasting approximately a few minutes. The gas pressure sharply dropped to 0.002 MPa. The coal temperature decreased to approximately 18 °C, and the ambient temperature remained almost constant.
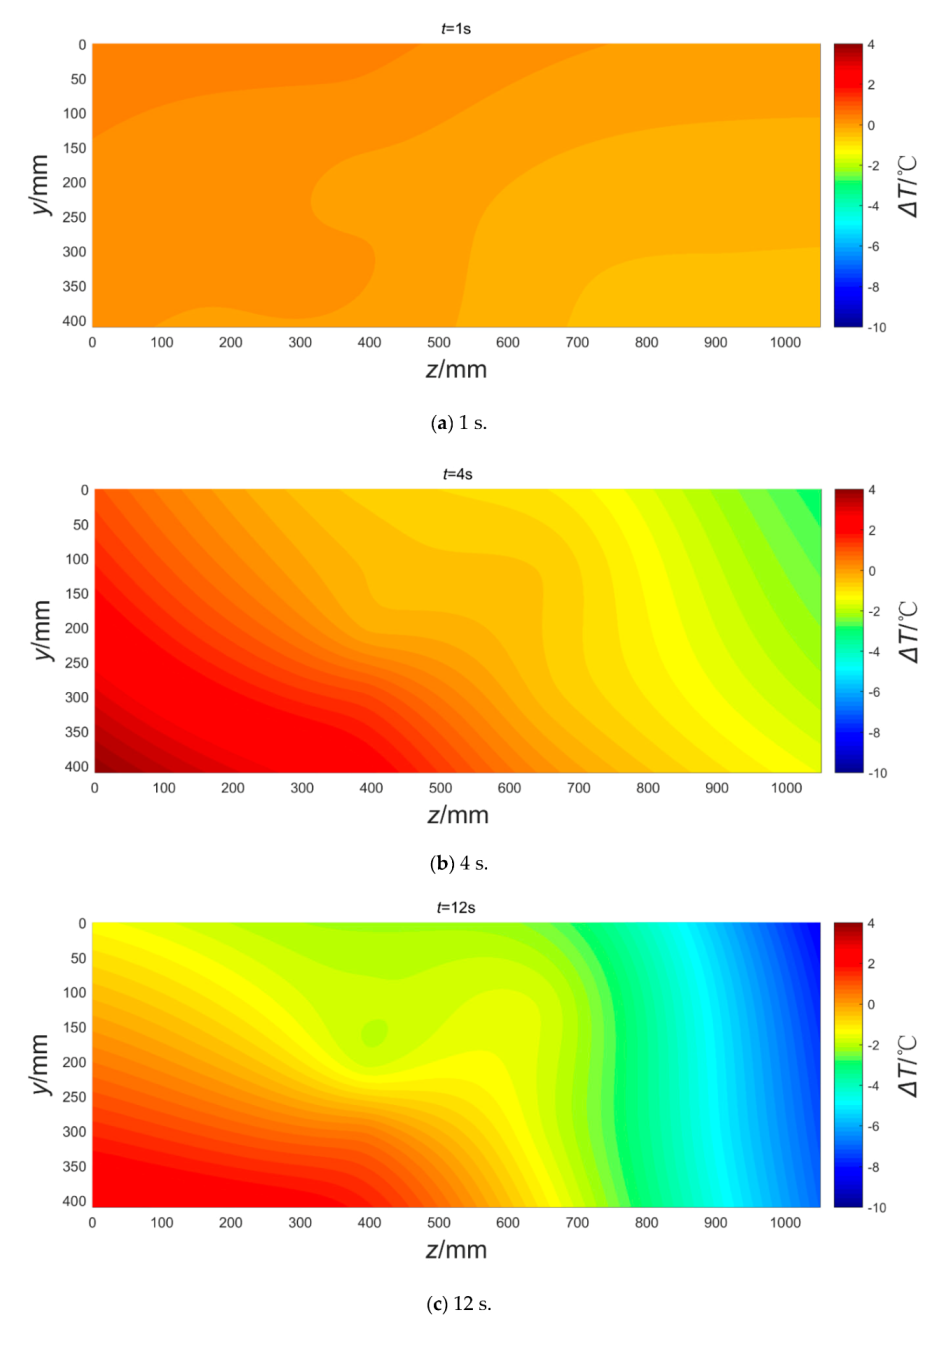
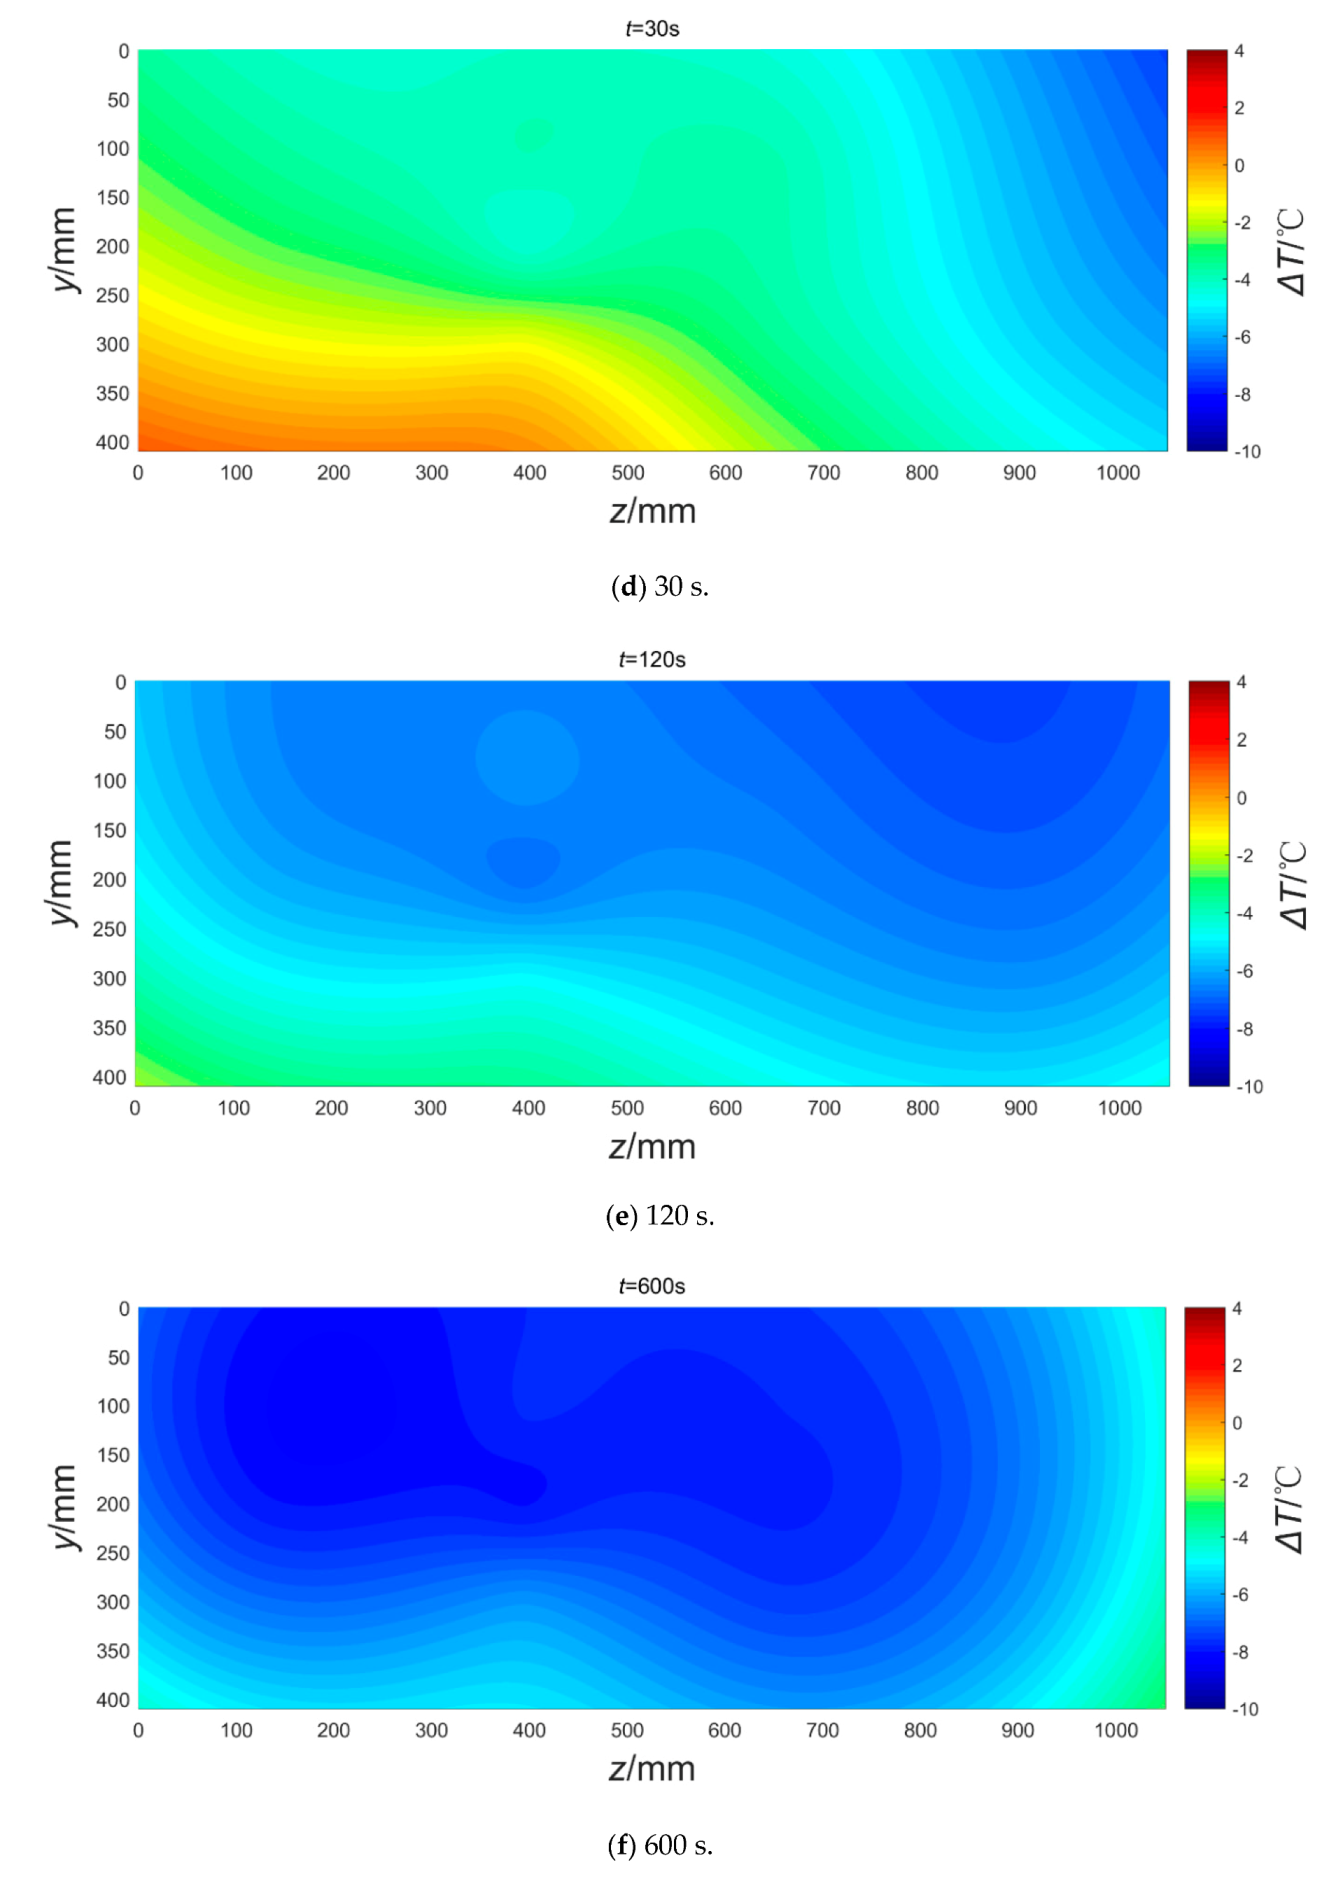
3.2. Spatio-Temporal Variation in Coal Temperature
3.3. Causal Analysis of Abnormal Temperature Rise
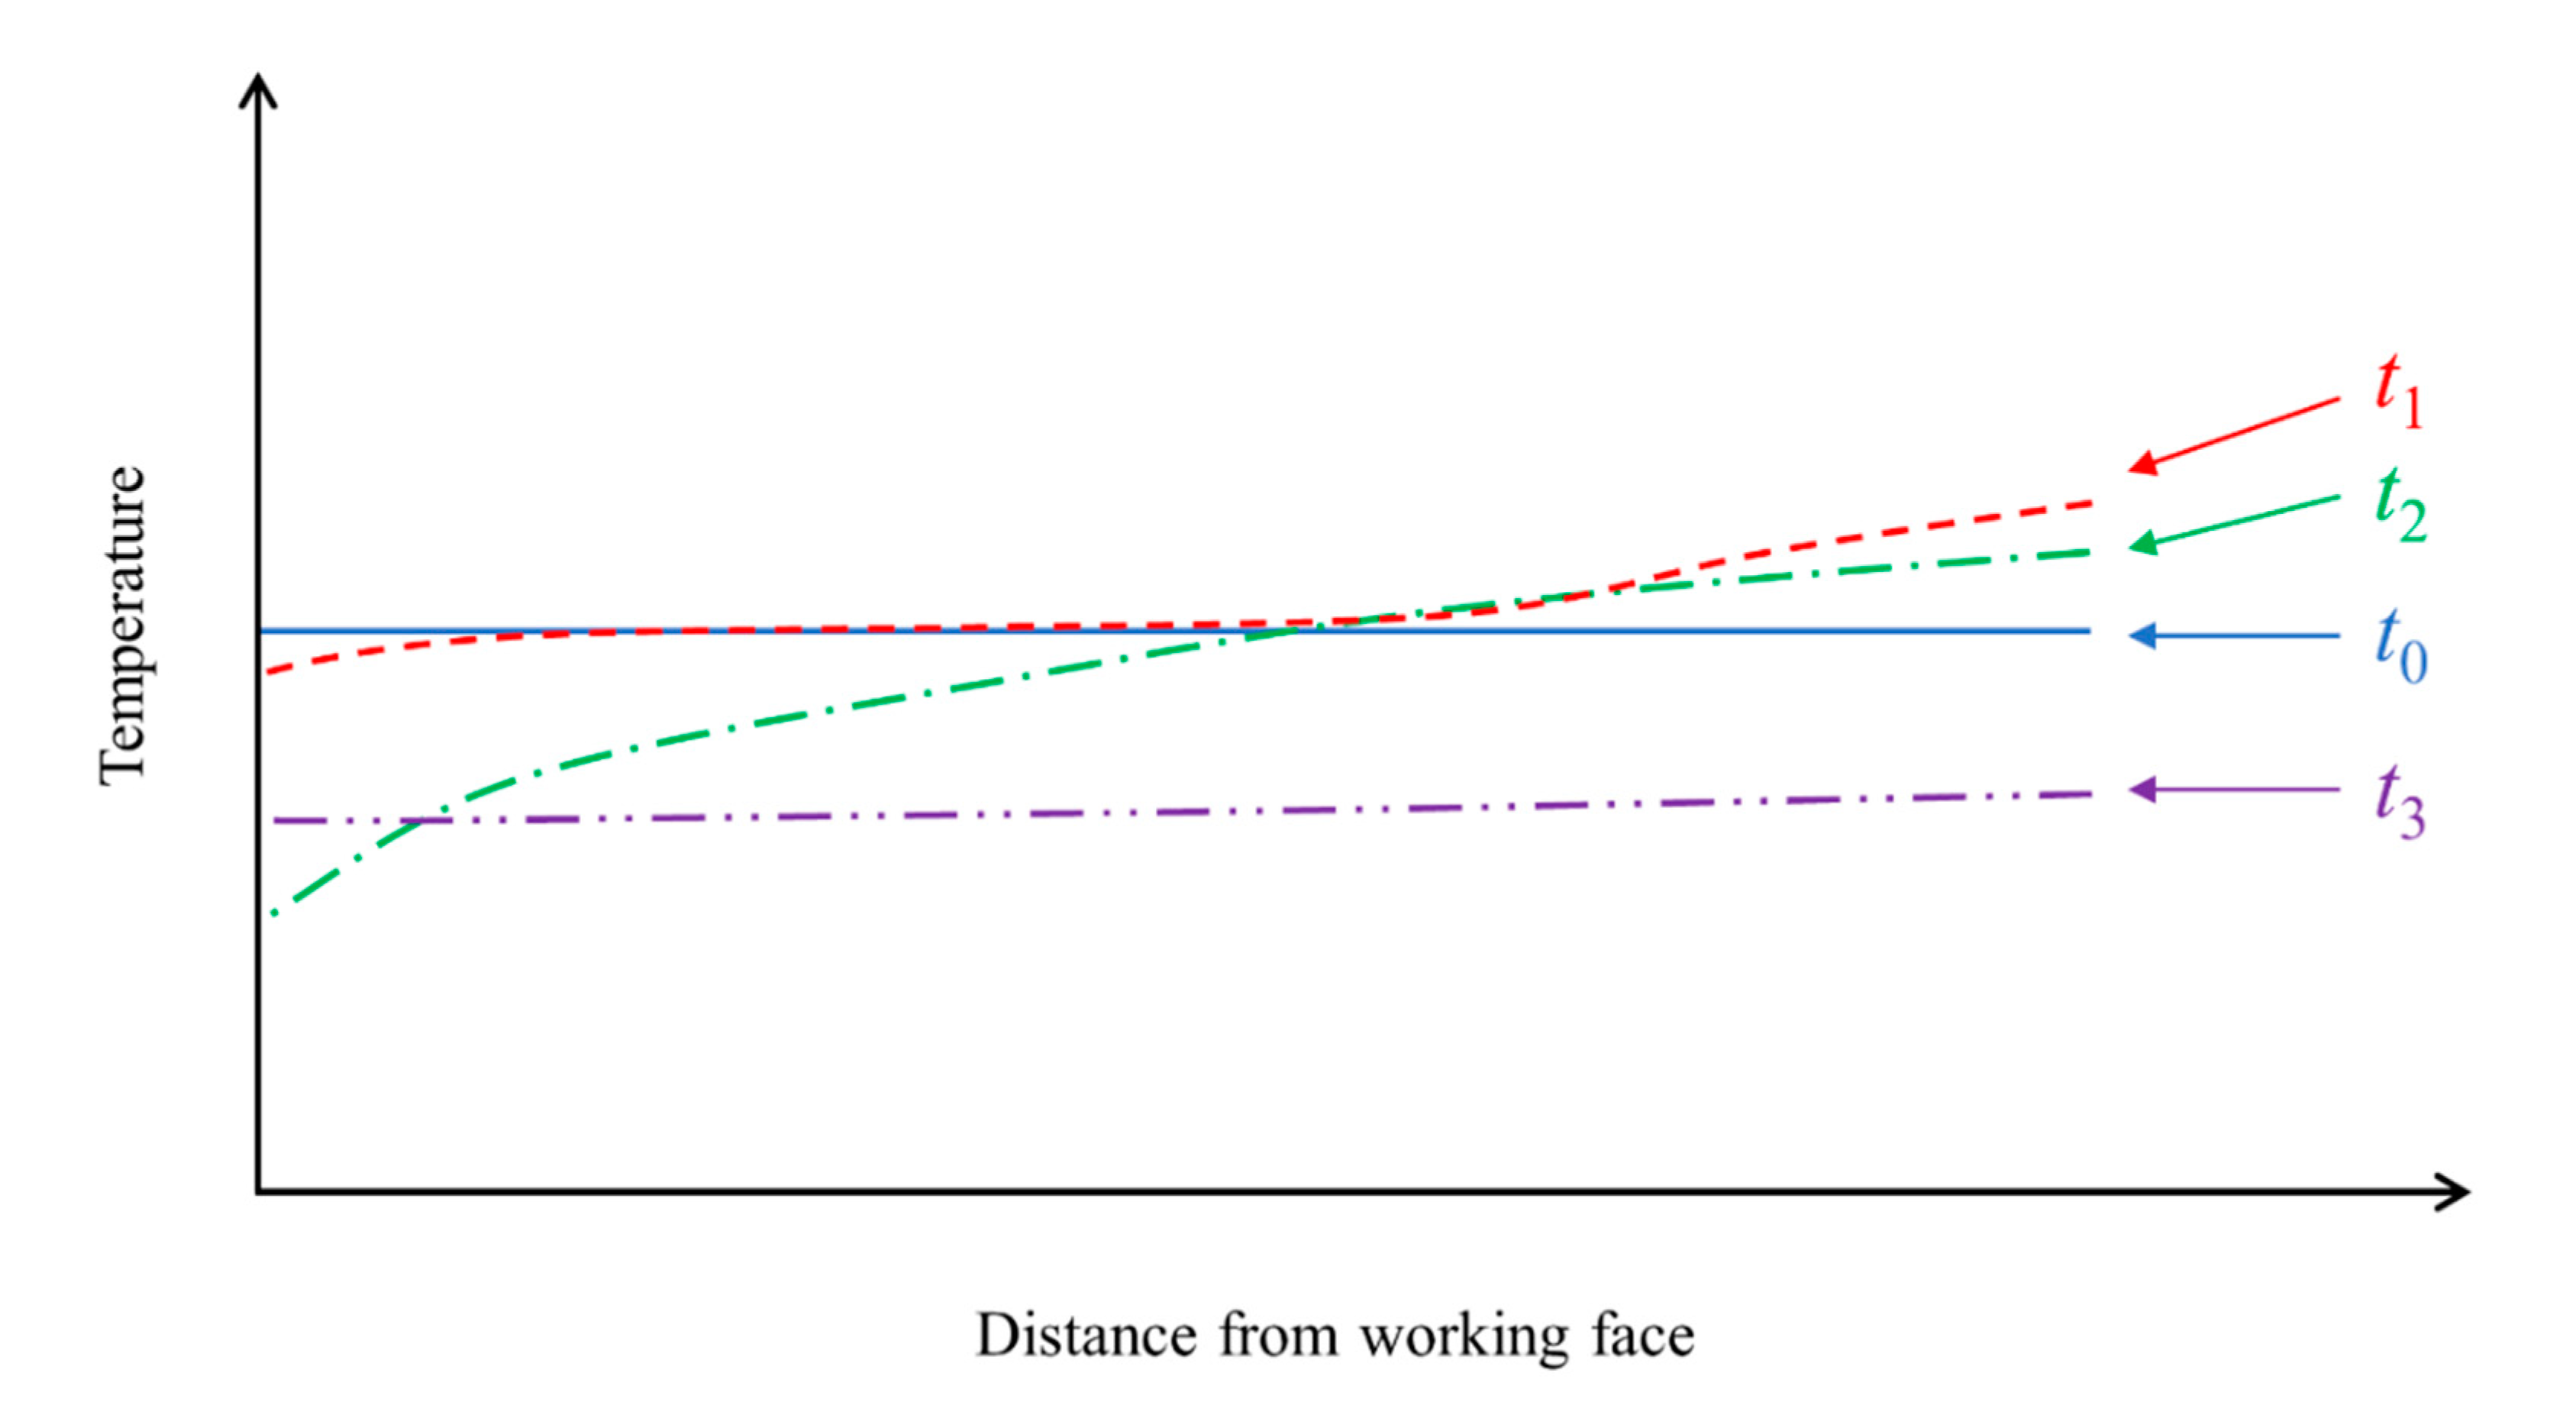
3.4. Implications for Outburst Prediction in Coal Mines
- Stage t0. The stress and gas are both in equilibrium before the coal mining activities begin. The coal temperatures at different locations are similar, and there is no obvious temperature gradient.
- Stage t1. The coal mining activities deform and break coal under a large stress concentration. In the area close to the working face, the gas thermal effect is dominant (|ΔT1| < |ΔT2|), and the coal temperature drops initially. However, in the area far from the working face, the stress thermal effect is dominant (|ΔT1| > |ΔT2|), as the gas has not yet been desorbed, and the coal temperature rises initially.
- Stage t2. The outburst will be triggered if mining activities continue, and the energy reaches the critical value. Then, an increasing amount of gas is desorbed, leading to a temperature drop closer to the working face (|ΔT1| << |ΔT2|), and a large amount of coal particles and gas are ejected.
- Stage t3. After a period of outburst, the coal temperature reaches a new equilibrium state, and there is no significant temperature gradient.
4. Conclusions
- (1)
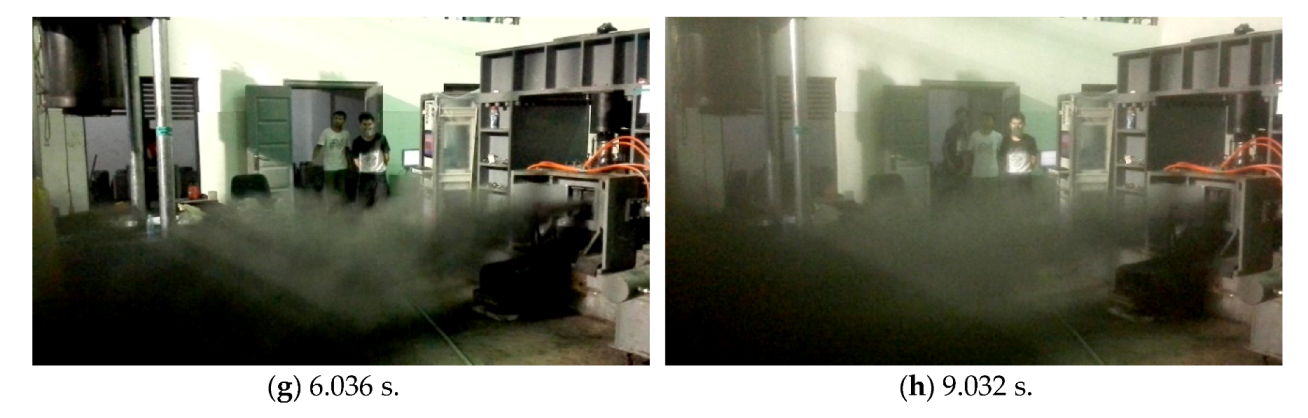
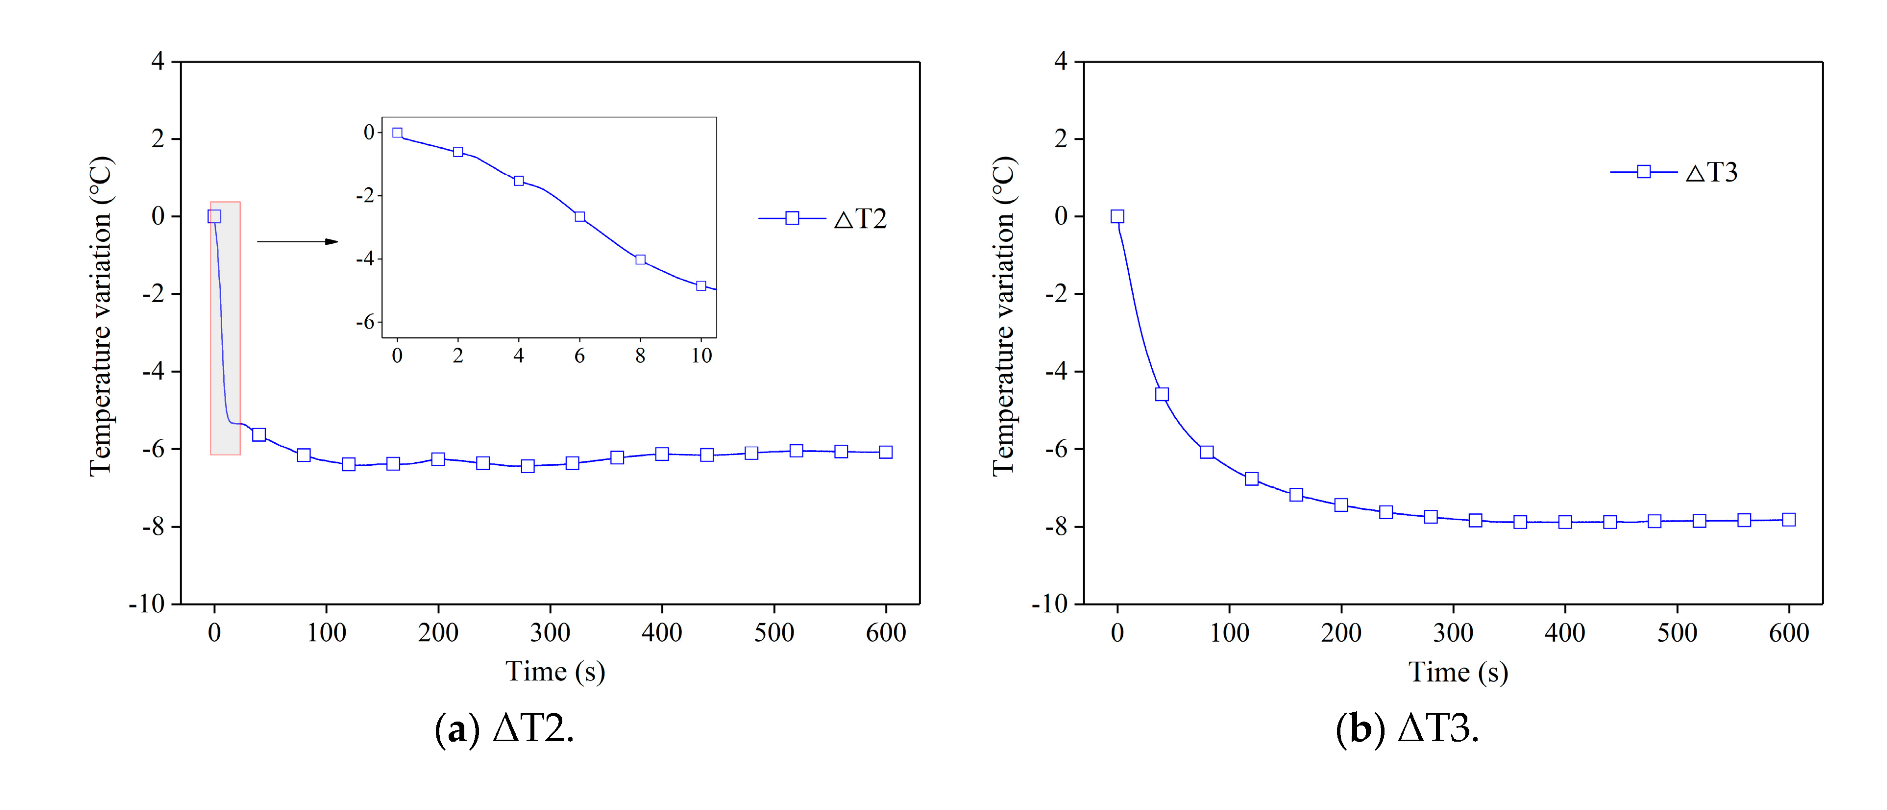
- After an outburst trigger, the coal particles and gas are ejected from the outburst mouth at high speeds (50–60 m/s) in a process lasting approximately 10 s. The coal temperature and gas pressure decrease rapidly during this process. However, the coal temperature far from the outburst mouth increases first and subsequently decreases, which is an unusual phenomenon.
- (2)
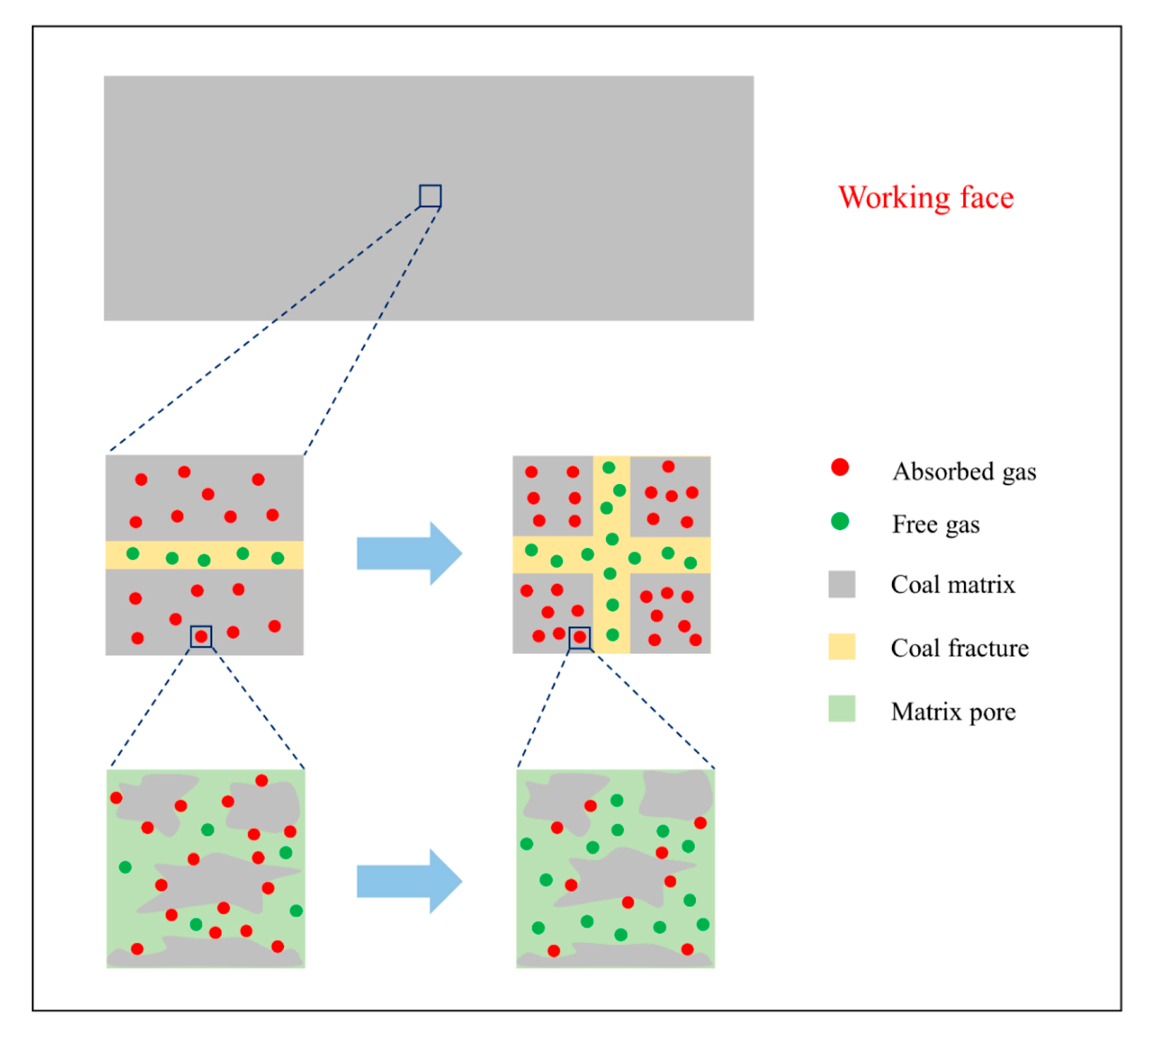
- The factors of coal temperature variation include three quantities: concentrated stress work, adsorbed and free gas, and coal oxidation. The temperature rise is caused by the coal broken under the stress concentration state, whereas the main reason behind the temperature decrease is the absorbed gas, which is desorbed from the coal matrix, and the free gas that expands into the fracture. The effect of coal oxidation on the temperature may be ignored.
- (3)
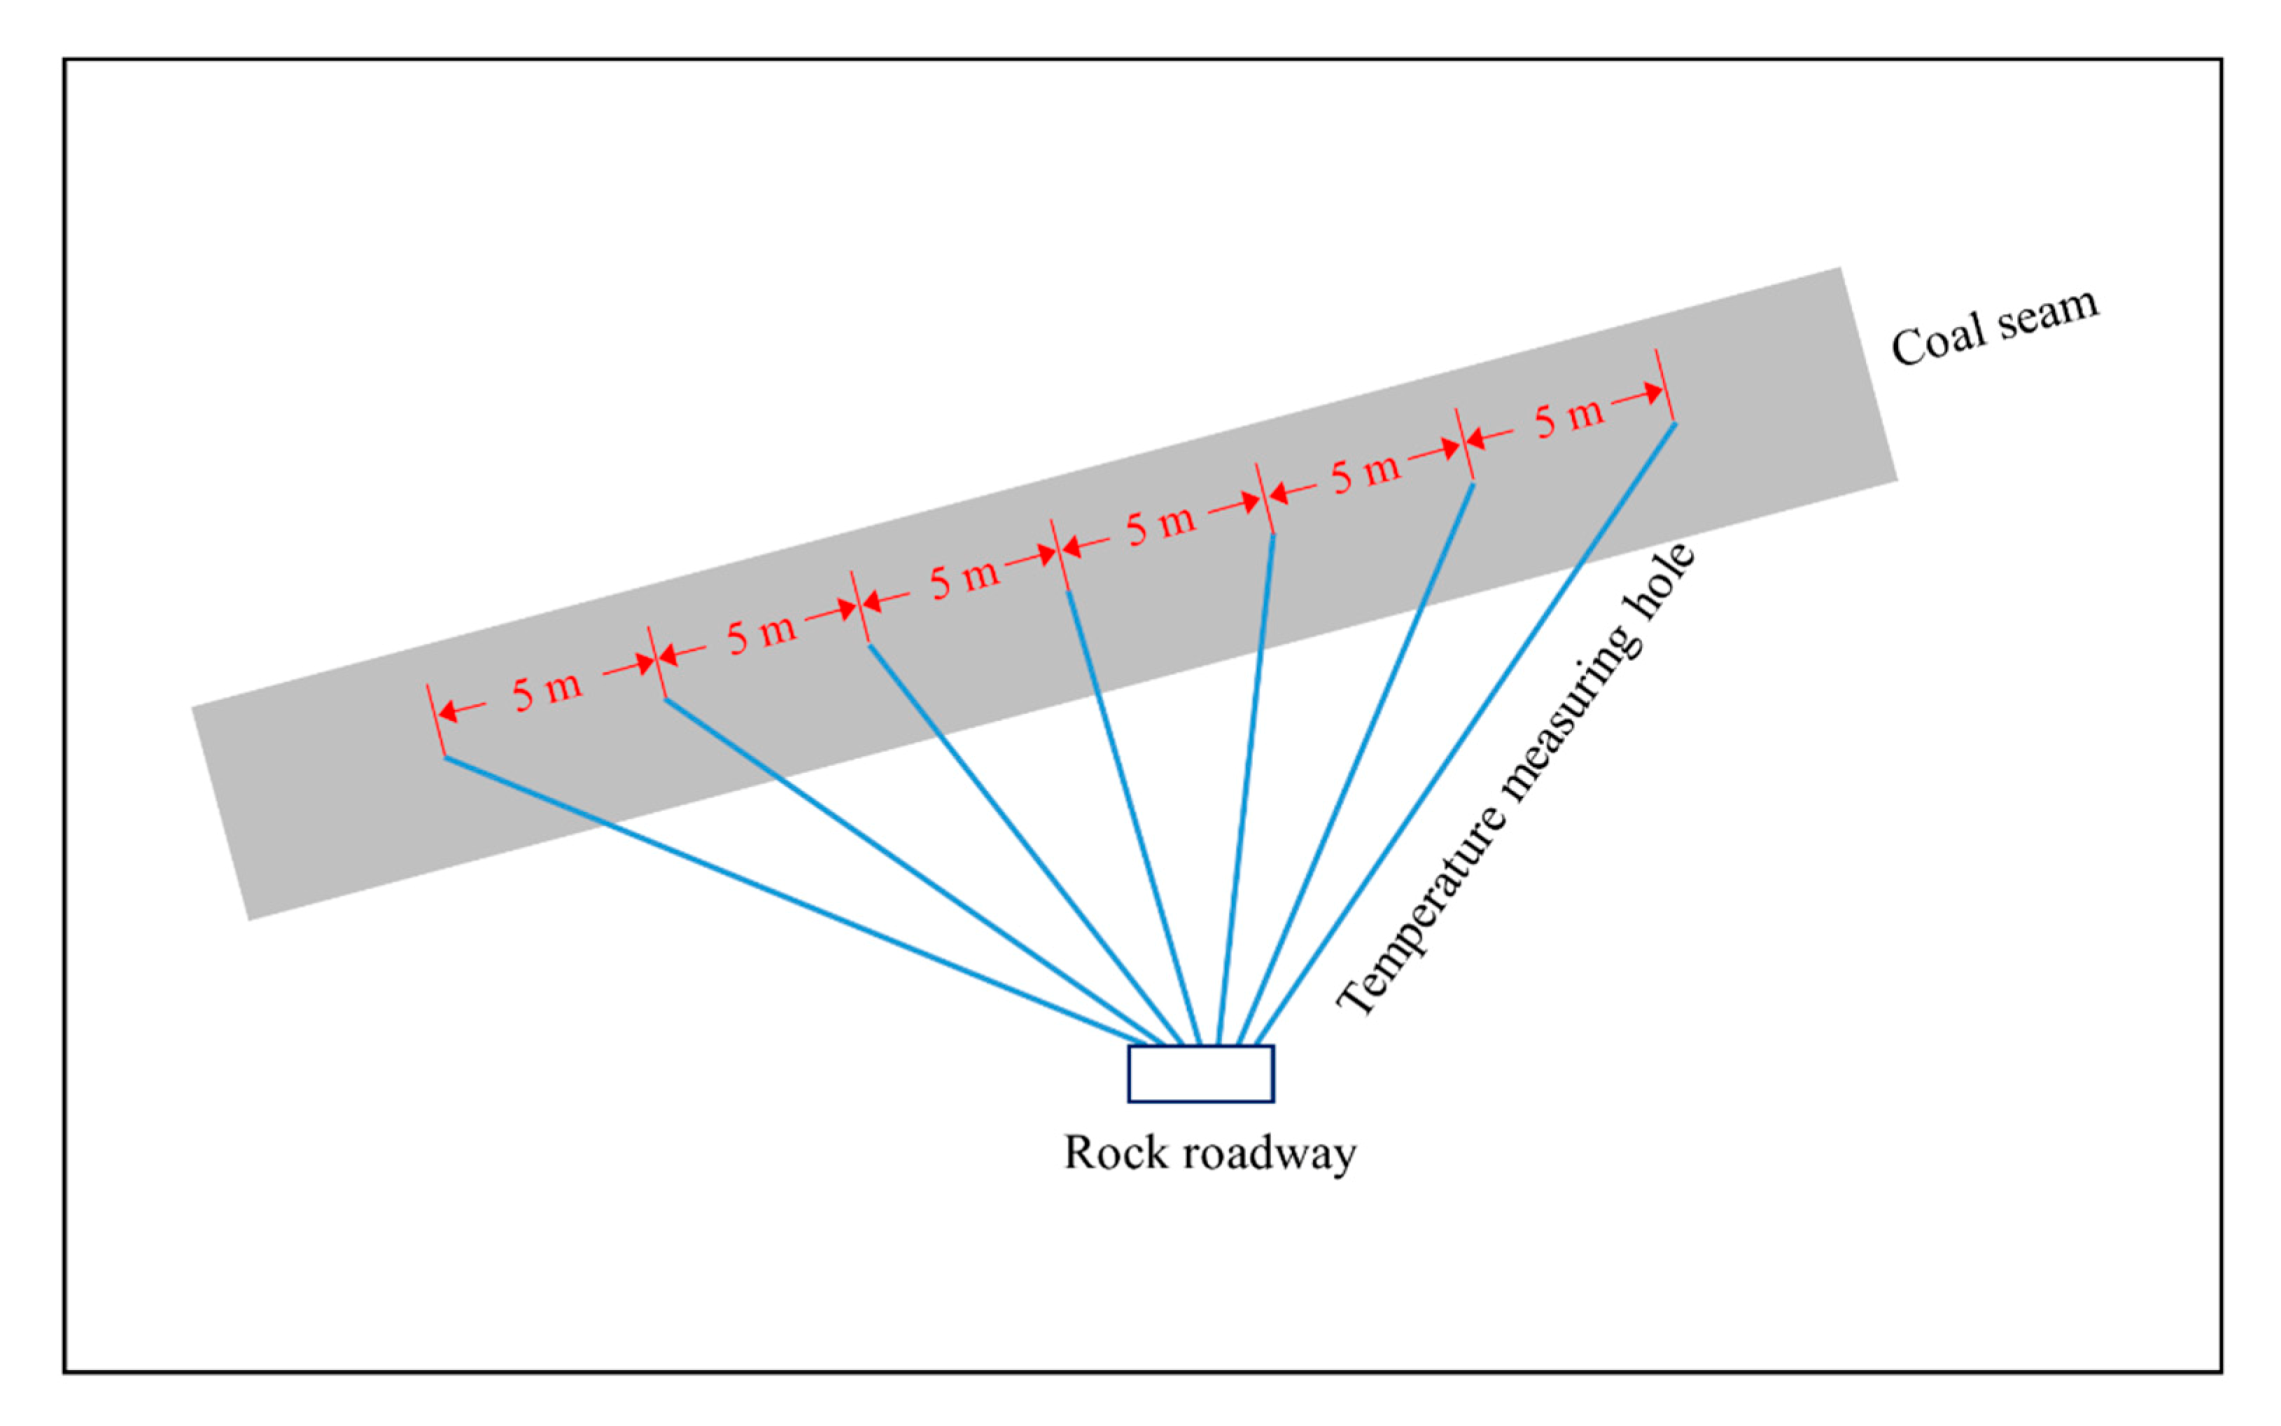
- The key to outburst control is preventing stage t1 from developing into stage t2. Thus, a novel outburst prediction method based on coal temperature monitoring is proposed, where both the coal temperature and its gradient are obtained in real time. Mining activities must be stopped immediately if the coal temperature rise or temperature gradient exceed the critical values.
- (4)
- The outburst prediction method based on the coal temperature proposed in this study has many advantages compared to the traditional prediction methods. Future studies will investigate how to verify its validity in the field, and combine other methods, both contact and non-contact, to achieve more accurate and efficient outburst predictions.
Author Contributions
Funding
Acknowledgments
Conflicts of Interest
References
- Hudecek, V. Analysis of safety precautions for coal and gas outburst-hazardous strata. J. Min. Sci. 2008, 44, 464–472. [Google Scholar] [CrossRef]
- Jin, K.; Cheng, Y.; Ren, T.; Zhao, W.; Tu, Q.; Dong, J.; Wang, Z.; Hu, B. Experimental investigation on the formation and transport mechanism of outburst coal-gas flow: Implications for the role of gas desorption in the development stage of outburst. Int. J. Coal Geol. 2018, 194, 45–58. [Google Scholar] [CrossRef]
- Dennis, J. Review of coal and gas outburst in Australian underground coal mines. Int. J. Min. Sci. Technol. 2019, 29, 815–824. [Google Scholar]
- Goran, V.; Maja, K.; Milivoj, V. Study of coal burst source locations in the Velenje colliery. Energies 2016, 9, 507. [Google Scholar]
- Busch, A.; Gensterblum, Y.; Krooss, B. Methane and CO2 sorption and desorption measurements on dry Argonne premium coals: Pure components and mixtures. Int. J. Coal Geol. 2003, 55, 205–224. [Google Scholar] [CrossRef]
- Wold, M.; Connell, L.; Choi, S. The role of spatial variability in coal seam parameters on gas outburst behavior during coal mining. Int. J. Coal Geol. 2008, 75, 1–14. [Google Scholar] [CrossRef]
- Lu, S.; Wang, C.; Liu, Q.; Zhang, Y.; Liu, J.; Sa, Z.; Wang, L. Numerical assessment of the energy instability of gas outburst of deformed and normal coal combinations during mining. Process Saf. Environ. Prot. 2019, 132, 351–366. [Google Scholar] [CrossRef]
- Lama, R.; Bodziony, J. Management of outburst in underground coal mines. Int. J. Coal Geol. 1998, 35, 83–115. [Google Scholar] [CrossRef]
- Sobczyk, J. A comparison of the influence of adsorbed gases on gas stresses leading to coal and gas outburst. Fuel 2014, 115, 288–294. [Google Scholar] [CrossRef]
- Nilufer, K.; Mustafa, O. Application of structural equation modeling to evaluate coal and gas outbursts. Tunn. Undergr. Space Technol. 2019, 88, 63–72. [Google Scholar]
- Fu, G.; Xie, X.; Jia, Q.; Tong, W.; Ge, Y. Accidents analysis and prevention of coal and gas outburst: Understanding human errors in accidents. Process Saf. Environ. Prot. 2020, 134, 1–23. [Google Scholar] [CrossRef]
- Fan, C.; Li, S.; Luo, M.; Du, W.; Yang, Z. Coal and gas outburst dynamic system. Int. J. Min. Sci. Technol. 2017, 27, 49–55. [Google Scholar] [CrossRef]
- Ye, Q.; Wang, G.; Jia, Z.; Zheng, C.; Wang, W. Similarity simulation of mining crack-evolution characteristics of overburden strata in deep coal mining with large dip. J. Pet. Sci. Eng. 2018, 165, 477–487. [Google Scholar] [CrossRef]
- Dmytro, R.; Valeriy, S. A mathematical model of gas flow during coal outburst initiation. Int. J. Min. Sci. Technol. 2019, 29, 791–796. [Google Scholar]
- Chao, J.; Dai, L.; Sun, T.; Wang, B.; Zhao, B.; Yang, X.; Zhao, X.; Guo, P. Experimental study of the impact of gas adsorption on coal and outburst dynamics effects. Process Saf. Environ. Prot. 2019, 128, 158–166. [Google Scholar]
- Zhou, B.; Xu, J.; Peng, S.; Yan, F.; Yang, W.; Cheng, L.; Ni, G. Experimental Analysis of the Dynamic Effects of Coal–Gas Outburst and a Protean Contraction and Expansion Flow Model. Nat. Resour. Res. 2020, 29, 1617–1637. [Google Scholar] [CrossRef]
- Choi, S.; Wold, M. A coupled geomechanical-reservoir model for the modelling of coal and gas outbursts. In Coupled Thermo-Hydro-Mechanical-Chemical Processes in Geo-Systems: Fundamentals, Modelling, Experiments and Applications; Elsevier Geo-Engineering Book Series; Stephanson, O., Ed.; Elsevier: Melbourne, Australia, 2004; Volume 2, pp. 629–634. [Google Scholar]
- Xie, X.; Fu, G.; Xue, Y.; Zhao, Z.; Chen, P.; Lu, B.; Song, J. Risk prediction and factors risk analysis based on IFOA-GRNN and apriori algorithms: Aapplication of artificial intelligence in accident prevention. Process Saf. Environ. Prot. 2019, 122, 169–184. [Google Scholar] [CrossRef]
- Gui, X.; Xu, Y.; Meng, X.; Yu, Z. Application of the value of drilling cuttings weight and desorption index for drill cuttings to preventing coal and gas outburst. J. Univ. Sci. Technol. Beijing 2009, 31, 285–289. [Google Scholar]
- Li, D.; Cheng, Y.; Wang, L.; Wang, H.; Wang, L.; Zhou, H. Prediction method for risks of coal and gas outbursts based on spatial chaos theory using gas desorption index of drill cuttings. Min. Sci. Technol. 2011, 21, 439–443. [Google Scholar] [CrossRef]
- State Administration of Work Safety. Specification of Coal and Gas Outburst Prevention in China; Emergency Management Press: Beijing, China, 2019.
- Wang, C.; Li, X.; Xu, C.; Niu, Y.; Cheng, Y.; Yang, S.; Zhou, B.; Jiang, C. Study on factors influencing and the critical value of the drilling cuttings weight: An index for outburst risk prediction. Process Saf. Environ. Prot. 2020, 140, 356–366. [Google Scholar] [CrossRef]
- Marta, K. Ultrasonic studies of outburst-prone coals. Int. J. Rock Mech. Min. 1997, 34, 167–171. [Google Scholar]
- Lu, C.; Dou, L.; Liu, H.; Liu, H.; Liu, B.; Du, B. Case study on microseismic effect of coal and gas outburst process. Int. J. Rock Mech. Min. Sci. 2012, 53, 101–110. [Google Scholar] [CrossRef]
- Qiu, L.; Song, D.; Li, Z.; Li, B.; Liu, J. Research on AE and EMR response law of the driving face passing through the fault. Saf. Sci. 2019, 17, 184–193. [Google Scholar] [CrossRef]
- Dennis, J. Investigations into the identification and control of outburst risk in Australian underground coal mines. Int. J. Min. Sci. Technol. 2017, 27, 749–753. [Google Scholar]
- Alexandr, S.; Artyom, K. Spectral-acoustic method for outburst danger prediction considering in-situ gas pressure. Vth Int. Innov. Min. Symp. 2020, 174, 01023. [Google Scholar]
- Qiu, L.; Li, Z.; Wang, E.; Liu, Z.; Ou, J.; Li, X.; Ali, M.; Zhang, Y.; Xia, S. Characteristics and precursor information of electromagnetic signals of mining-induced coal and gas outburst. J. Loss Prevent. Proc. 2018, 54, 206–215. [Google Scholar] [CrossRef]
- Zhang, C.; Xu, J.; Yin, G.; Peng, S.; Li, Q.; Chen, Y. A novel large-scale multifunctional apparatus to study the disaster dynamics and gas flow mechanism in coal mines. Rock Mech. Rock Eng. 2019, 52, 2889–2898. [Google Scholar] [CrossRef]
- Shepeleva, S.; Dyrdin, V. Gas emission under coal and gas outbursts. J. Min. Sci. 2011, 47, 660–663. [Google Scholar] [CrossRef]
- Hu, Q.; Liang, Y.; Wang, H.; Zou, Q.; Sun, H. Intelligent and integrated techniques for coalbed methane (CBM) recovery and reduction of greenhouse gas emission. Environ. Sci. Pollut. Res. 2017, 24, 17651–17668. [Google Scholar]
- Feng, T.; Xie, X.; Liu, H. Experimental study of freezing temperature field in uncovering outburst coal seam in cross-cut. J. China Coal Soc. 2011, 36, 1884–1890. [Google Scholar]
- Barla, G.; Bonini, M.; Semeraro, M. Analysis of the behaviour of a yield-control support system in squeezing rock. Tunn. Undergr. Space Technol. 2011, 26, 146–154. [Google Scholar] [CrossRef]
- Xie, H.; Xie, J.; Gao, M.; Zhang, R.; Zhou, H.; Gao, F.; Zhang, Z. Theoretical and experimental validation of mining-enhanced permeability for simultaneous exploitation of coal and gas. Environ. Earth Sci. 2015, 73, 5951–5962. [Google Scholar] [CrossRef]
- Sobczyk, J. The influence of sorption processes on gas stresses leading to the coal and gas outburst in the laboratory conditions. Fuel 2011, 90, 1018–1023. [Google Scholar] [CrossRef]
- Dutka, B.; Kudasik, M.; Topolnicki, J. Pore pressure changes accompanying exchange sorption of CO2/CH4 in a coal briquette. Fuel Process Technol. 2012, 100, 30–34. [Google Scholar] [CrossRef]
- Yin, G.; Li, M.; Jiang, C.; Xu, J.; Li, W. Mechanical behavior and permeability evolution of gas infiltrated coals during protective layer mining. Int. J. Rock Mech. Min. 2015, 80, 292–301. [Google Scholar] [CrossRef]
- Zhang, C.; Tu, S.; Zhang, L. Pressure-relief and methane production performance of pressure relief gas extraction technology in the longwall mining. J. Geophys. Eng. 2017, 14, 77–89. [Google Scholar] [CrossRef]
- Yang, W.; Lin, M.; Walton, G.; Lin, B.; Sinha, S.; Lu, C.; Li, G. Blasting-enhanced water injection for coal and gas out-burst control. Process Saf. Environ. Prot. 2020, 140, 233–243. [Google Scholar] [CrossRef]


| Stress Zones | OSZ | SCZ | SRZ |
|---|---|---|---|
| σ1/MPa | 2.0 | 3.0 | 1.0 |
| σ2/MPa | 2.0 | 2.0 | 2.0 |
| σ3/MPa | 1.2 | 1.8 | 0.6 |
| Particle Size/mm | 0–0.15 | 0.15–0.18 | 0.18–0.25 | 0.25–0.425 | 0.425–0.85 | 0.55–2.0 |
|---|---|---|---|---|---|---|
| Particle mass ratio/% | 27 | 3 | 5 | 11 | 19 | 35 |
© 2020 by the authors. Licensee MDPI, Basel, Switzerland. This article is an open access article distributed under the terms and conditions of the Creative Commons Attribution (CC BY) license (http://creativecommons.org/licenses/by/4.0/).
Share and Cite
Zhang, C.; Wang, E.; Xu, J.; Peng, S. Research on Temperature Variation during Coal and Gas Outbursts: Implications for Outburst Prediction in Coal Mines. Sensors 2020, 20, 5526. https://doi.org/10.3390/s20195526
Zhang C, Wang E, Xu J, Peng S. Research on Temperature Variation during Coal and Gas Outbursts: Implications for Outburst Prediction in Coal Mines. Sensors. 2020; 20(19):5526. https://doi.org/10.3390/s20195526
Chicago/Turabian StyleZhang, Chaolin, Enyuan Wang, Jiang Xu, and Shoujian Peng. 2020. "Research on Temperature Variation during Coal and Gas Outbursts: Implications for Outburst Prediction in Coal Mines" Sensors 20, no. 19: 5526. https://doi.org/10.3390/s20195526
APA StyleZhang, C., Wang, E., Xu, J., & Peng, S. (2020). Research on Temperature Variation during Coal and Gas Outbursts: Implications for Outburst Prediction in Coal Mines. Sensors, 20(19), 5526. https://doi.org/10.3390/s20195526