Article

Multimodal Non-Contact Luminescence Thermometry with Cr-Doped Oxides

1
Diamond Light Source, Harwell Campus, Didcot OX11 0DE, UK
2
Denys Wilkinson Building, Department of Physics, University of Oxford, Oxford OX1 3RH, UK
3
Institute of Physics, Polish Academy of Sciences, Al. Lotników 32/46, 02-668 Warsaw, Poland
4
Lviv Polytechnic National University, 12 Bandera, Lviv 79646, Ukraine
5
Ivan Franko National University of Lviv, Tarnavskogo Str. 107, 79017 Lviv, Ukraine
6
Institute of Physics, University of Bydgoszcz, Weyssenhoffa 11, 85-072 Bydgoszcz, Poland
*
Author to whom correspondence should be addressed.
Sensors 2020, 20(18), 5259; https://doi.org/10.3390/s20185259
Submission received: 18 August 2020 / Revised: 8 September 2020 / Accepted: 11 September 2020 / Published: 15 September 2020
(This article belongs to the Section Remote Sensors)

Abstract

:
Luminescence methods for non-contact temperature monitoring have evolved through improvements of hardware and sensor materials. Future advances in this field rely on the development of multimodal sensing capabilities of temperature probes and extend the temperature range across which they operate. The family of Cr-doped oxides appears particularly promising and we review their luminescence characteristics in light of their application in non-contact measurements of temperature over the 5–300 K range. Multimodal sensing utilizes the intensity ratio of emission lines, their wavelength shift, and the scintillation decay time constant. We carried out systematic studies of the temperature-induced changes in the luminescence of the Cr3+-doped oxides Al2O3, Ga2O3, Y3Al5O12, and YAlO3. The mechanism responsible for the temperature-dependent luminescence characteristic is discussed in terms of relevant models. It is shown that the thermally-induced processes of particle exchange, governing the dynamics of Cr3+ ion excited state populations, require low activation energy. This then translates into tangible changes of a luminescence parameter with temperature. We compare different schemes of temperature sensing and demonstrate that Ga2O3-Cr is a promising material for non-contact measurements at cryogenic temperatures. A temperature resolution better than ±1 K can be achieved by monitoring the luminescence intensity ratio (40–140 K) and decay time constant (80–300 K range).

1. Introduction

Luminescence thermometry is a non-contact temperature measurement technique that utilizes emission characteristics that exhibit a temperature dependence [1]. Temperature can influence a number of different luminescence characteristics, such as shapes of emission spectra, intensity, or luminescence decay time constants. This makes a range of suitable luminescence parameters available for use in temperature monitoring [2,3]. When compared with other techniques, luminescence thermometry offers the capability of remote temperature sensing, which is a crucial advantage in comparison with conventional contact thermometers. Accurate temperature sensing in a way that does not interfere with the system is a key feature, which enables applications of micro thermometry for measurements of intracellular temperature fluctuations and temperature mapping of microcircuits or microfluids (see review [4,5] and references). Additionally, it is an essential requirement for measurements on objects in harsh environments (i.e., very hot or cold, aggressive chemicals, strong electromagnetic field) where direct contact with the object is limited due to it requiring isolation, shielding, or a lack of immobility. Therefore, luminescence thermometry has become an important part of metrology and is evolving rapidly. Evidence for that is the fact that more than 100 luminescence materials for this application have already been identified and reported (see reviews [6,7,8] and references therein) while new prospective compounds are emerging on a regular basis [9,10,11,12,13,14,15].
The materials typically used in luminescence thermometry (often referred to as thermographic phosphors) are rare-earth-doped, transition-metal-doped compounds [16,17,18] or transition metal oxides exhibiting intrinsic emission [19]. In these materials, the luminescence characteristics with sensitivity to temperature changes are emission peak energy, intensity, and lifetimes of excited states. The thermally-induced change of the emission peak is due to the interaction of electronic states with phonons. The effect is pronounced in materials doped with transition metals where the peak wavelength of luminescence due to transitions within d-shells exhibits a noticeable shift with temperature [20]. The intensity-based method normally identifies two transitions and compares the ratio of their emission intensities. The intensity of each transition is proportional to the population of an excited state, which obeys Boltzmann statistics and, therefore, is temperature-dependent. In this way, the temperature variation of the luminescence intensity ratio can be used to measure absolute temperature [21]. The advantage of this approach is that the luminescence intensity ratio is not affected by variation in the emission intensity in contrast to intensity-based methods. An alternative technique that offers additional benefit is based on luminescence lifetime measurements, which utilizes the temperature dependence of the luminescence decay time constant [22]. These measurements are virtually not affected by scattered light, background emission, or intensity fluctuations, which translates into better accuracy and enables the possibility of obtaining temperature mapping with high spatial resolution [23,24].
Altogether, luminescence non-contact methods offer reliable and accurate measurements of temperature with high spatial and temporal resolution over a wide temperature range from cryogenic temperatures up to almost 2000 K [6,18]. Nonetheless, non-contact luminescence thermometry is used primarily for measurements around or above ambient temperature. Application to measurements at cryogenic temperatures has been rather infrequent, even though it offers an important advantage over conventional techniques, i.e., the response of a luminescence sensor is not affected by heat leaks and thermal contacts, which are the main causes of poor accuracy at cryogenic temperatures. Thus, this provides a reliable estimate of the true temperature. A number of feasibility studies of luminescence lifetime thermometry demonstrated the suitability of La2O2S-Eu [25], Mg4FGeO6:Mn [24], Yb-doped CaF2, and SrF2 [26] as well as lanthanide compounds [27] for measurements in cryogenic environments.
Strong interest in this application of the technique emerged recently, driven by the necessity of having to monitor the temperature of biological samples in experiments that use strong ionizing radiation from synchrotron light sources to study properties of matter. To protect the samples from radiation damage, they need to be kept frozen below the temperature of the phase transition from vitreous to crystalline ice, typically occurring above 130 K [28]. When heated above this temperature, trapped radicals produced by X-ray absorption become mobile and damage the biological samples. Furthermore, there is increasing evidence that, with some experiments, the energy deposited by the synchrotron beam can cause a significant increase of temperature in samples of microscopic size [29,30,31,32]. As technology at synchrotron rings and beamlines evolves, radiation-induced heating of experimental samples is a concern, and research began monitoring and quantifying this effect.
Luminescence thermometry is well suited for this, and investigations in this direction have started a few years ago at the Diamond Light Source. A first dedicated luminescence thermometry system for non-contact temperature monitoring in a vacuum environment was developed and deployed at the I23 beamline [33,34]. The temperature is derived from changes in the luminescence decay characteristics of a Bi4Ge3O12 (BGO) scintillation sensor. Results from extensive testing demonstrated the reliability and accuracy as well as the advantages of the technique. The uncertainty of temperature determination over the 10–270 K temperature range was shown to be ±1.6 K. A complementary approach has been adopted at the I24 beamline where the effect of radiation-induced heating was investigated by monitoring the shift of the emission wavelengths in a ruby (Al2O3-Cr) crystal [35]. The maximum temperature increase of the ruby sensor during exposure to an X-ray beam was found to be 58 K. More recently, the promising concept of fast luminescence decay thermometry was tested using ultrafast scintillations of PbI2 [36]. It was shown that changes in the decay time of PbI2 can be measured by using the pulsed structure of synchrotron radiation and permitting temperature monitoring at a sampling rate of megahertz. All these examples demonstrate that the non-contact luminescence method of temperature monitoring is developing rapidly, which adds to the toolset commonly used with synchrotron instrumentation.

2. Background

There is a strong case for identifying additional materials with luminescence properties suitable for temperature sensing at cryogenic temperatures. Application in the low-temperature range focuses the search onto systems with thermally induced processes, where processes of reorganization of population of excited states and thermal quenching require a low activation energy. This can then translate into changes of a luminescence parameter with temperature, as observed for the luminescence lifetime in tungstates and molybdates [37], intensity ratio of emission lines in rare earth RE3+ doped Y2O3 [21], or emission line shift in Ga-doped ZnO [38]. Among many materials used for non-contact luminescence thermometry, Cr3+-doped compounds are particularly interesting since luminescence of Cr3+ exhibits a variety of temperature-dependent effects. The reason for this is due to the energy structure of the Cr3+ ion and its sensitivity to the crystal field. The ground state of Cr3+ is 4A2 while the lowest excited levels are split by the crystal field into 4T2 and 2E levels. In materials with a strong crystal field, the emission is dominated by the transition from the 2E state, which is split further into E ¯ and 2 A ¯ levels to the ground state. These transitions give rise to two sharp emission lines, R1 ( E ¯ 4A2) and R2 ( 2 A ¯ 4A2), observed in the deep red spectral range with the exact wavelength being material-dependent [39]. The emission characteristics of Cr3+ ions are strongly influenced by the strength of the crystal field and thermal quenching effects [40,41]. In particular, the effect of temperature manifests itself explicitly in energy shifts of the R-lines, changes to their intensities, and luminescence decay time [39].
Due to these clearly identifiable features of the luminescence that change with temperature, Cr3+-based materials received significant attention for thermometric application. Among them, Al2O3-Cr is the most comprehensively examined and widely used material in a number of optical sensor schemes. The prospect of this material for temperature sensing has been recognised by following studies of the temperature-induced changes of R-lines in Cr-doped Al2O3 [42]. This prompted the development of luminescence thermometry based on a wavelength shift [43,44] and intensity ratio [45,46] of R-lines. Research into ruby-based luminescence lifetime thermometry resulted in good precision and reliability [47] and, thus, the method is used for temperature monitoring over a relatively wide range [48,49,50,51,52]. The feasibility of other Cr-doped luminescence sensors for luminescence thermometry has been shown in many other materials, including garnets Y3Al5O12 [53], Gd3Al5O12 [54], perovskites YAlO3 [55], GdAlO3 [56], alexandrite BeAl2O4, [57], spinel MgAl2O4 [58], borates YAl3(BO3)4 [59], gallates Bi2Ga4O9 [60], aluminates LiAl5O8 [61], etc.
Although the main emphasis of research and development so far was on materials for non-contact thermometry in the high-temperature domain, there are some earlier studies in which the feasibility of Al2O3-Cr luminescence sensors for measurements below 100 K has been investigated [45,49,62]. In these works, different temperature-sensing scenarios were explored. It has been found that the sensitivity of the methods based on an energy shift and luminescence decay time of R-lines in Al2O3-Cr reduces dramatically below 100 K since both parameters exhibit little or no change at further cooling. At low temperatures, the mechanisms responsible for changes of the energy position of the emitting level and its decay time, such as electron-phonon interaction and thermal depopulation of 2E emitting levels, respectively, are suppressed in the crystal. The intensity ratio of R-lines, however, exhibits a strong change with temperature below 100 K. The population of the emitting states described in thermal equilibrium by the Boltzmann statistics changes prominently at low temperatures due to the small energy splitting of the levels (a few meV). Evidently, because of high sensitivity, this is a very attractive method for monitoring at cryogenic temperatures.
It has become clear that, when considering these fundamental properties of the Cr3+ emission together, the possibility for multimodal temperature sensing is clear. Different luminescence characteristics of materials can be monitored with each providing a measure of temperature in the temperature domain where its sensitivity is high. This approach should pave the way for the application of a Cr-doped luminescence material for non-contact temperature monitoring over a wider low-temperature range. An important advantage of the multimodal sensor is the possibility of cross-referencing, which improves the reliability and accuracy of the measurements [8]. In this work, by focusing on Cr-doped materials, we carried out a systematic investigation of luminescence characteristics in Al2O3-Cr, Ga2O3-Cr, YAlO3-Cr, and Y3Al5O12-Cr as a function of temperature over the 4–300 K range. Ruby is a well-known standard and, therefore, serves as a benchmark in temperature sensing while Ga2O3-Cr and YAlO3-Cr and Y3Al5O12-Cr were selected based on results from prior tests that indicated their potential for application as multimode sensors at cryogenic temperatures.

3. Methods

All samples of Al2O3-Cr, Ga2O3-Cr, YAlO3-Cr, and Y3Al5O12-Cr had a nominal concentration of Cr3+ ions of 0.05% with respect to the substituted (Al or Ga) ions. A low concentration was chosen to minimize the impact of energy transfer and reabsorption processes. This ensures that a single-exponential model for the decay can be used while avoiding the complexity and uncertainty that multi-exponential models bring with them. α-Al2O3-Cr and β-Ga2O3-Cr were in the form of bulk single crystals, grown by the Czochralski technique or the floating zone technique with radiation heating, respectively. For the spectroscopic measurements, these single-crystalline materials were prepared in the form of slices of about 100-μm thickness. Two other materials (YAlO3-Cr and Y3Al5O12-Cr) were prepared in the form of microcrystalline powders synthesized by the sol−gel technique and, subsequently, calcined at 1600 °C.
The photoluminescence and excitation spectra were measured using a Horiba/Jobin-Yvon Fluorolog-3 spectrofluorometer with a 450 W continuous spectrum xenon lamp for excitation and optical detection with a Hamamatsu R928P photomultiplier operating in the photon counting mode. The measured photoluminescence excitation (PLE) spectra were corrected with the xenon lamp emission spectrum. The luminescence spectra were corrected for the spectral response of the spectrometer system used. The luminescence spectra in the region of R-lines were measured with 0.3-nm spectral resolution and a 0.05-nm increment. The luminescence decay kinetics were measured using the same Fluorolog-3 spectrofluorometer with the excitation light modulated either by a mechanical (chopper) or an electro-magnetic (shutter) modulator. The spectroscopic measurements in the temperature range between about 4 and 325 K were carried out in a Janis continuous-flow liquid-helium cryostat using a Lake Shore 331 temperature controller.

4. Results and Discussion

The use of Cr3+ luminescence of doped oxides for temperature monitoring relies on the possibility to achieve good responsivity of the measured emission characteristic to thermal changes. The temperature influences the position and relative occupation probabilities of the levels. These, in turn, are governed by the energy separation of the levels involved. The impact of the crystal field on the energy structure of d3-type ions is characterized by the separation of the 2E and 4T2g levels. This is typically measured by taking into account the difference between the positions of the zero-phonon lines of the 4T2g electronic level and the 2E level. Thus, it is large for YAlO3 and Al2O3 (around 3100 cm−1 and 2350 cm−1, respectively), intermediate for Y3Al5O12 (around 1100 cm−1), and relatively small, while still positive for Ga2O3 (around 650 cm−1), as can be seen from our measurements presented in Figure 1 and Figure 2. Consequently, dissimilar temperature dependencies are expected in these crystals. In this section, we present the results of our measurements of luminescence and decay time characteristics of Al2O3-Cr, Ga2O3-Cr, YAlO3-Cr, and Y3Al5O12-Cr as a function of temperature over the 4–300 K range. It should be noted that the extent to which these characteristics are investigated and discussed is determined by the potential for application in non-contact luminescence cryothermometry. A more comprehensive discussion of the optical properties in question can be found elsewhere (see References [39,41,63,64] and also the papers quoted throughout this work).
The luminescence excitation and emission spectra of the crystals under study are shown in Figure 1a,b. The peak positions of the main excitation and emission transitions of Cr3+ are summarised in Table 1.
A simplified energy diagram of Cr3+ transitions [39], displayed in Figure 3, explains the main features of the emission. The luminescence of Cr3+ consists of very intense peaks superimposed with a broadband emission in the 650–750 nm spectral range. The two sharp peaks due to spin-forbidden transitions E ¯ 4A2 and 2 A ¯ 4A2 of Cr3+ are referred to as the R1-lines and R2-lines. The broad band is assigned to the phonon-assisted 4T24A2 transitions. The luminescence excitation spectra consist of two broad excitation bands assigned to the 4A24T1g (Y-band) and 4A24T2g (U-band) transitions of Cr3+ in the 350–500 nm and 500–650 nm wavelength range, respectively. The excitation spectra measured at low temperature exhibit a sharp line structure at the low-energy side of the main bands attributed to the zero-phonon transitions to the 4T1g, 4T2g levels of Cr3+, and/or appropriate doublet 2T1g,2g levels [63]. The position of these bands is defined by the strength of the crystal field and Racah parameters B and C. The excitation band emerging below 350 nm in Ga2O3-Cr is due to charge transfer transitions from O2− to Cr3+ [65]. Once the photon energy exceeds the band gap energy of the crystal, these are superimposed with the band-to-band transitions, which results in the steep increase in excitation spectra at 260 nm. It should be highlighted that the values of the energy gap between the E ¯ and 2 A ¯ levels on one side and between the 2E and 4T2g levels on the other define the temperature range in which the luminescence properties of the crystals exhibit a significant change with temperature and, hence, can be used for temperature monitoring. The spectroscopic data indicate that Ga2O3-Cr is a special case since both values are very different from those observed in other compounds and, hence, one should expect a distinctively different thermometric characteristic at a low temperature.

4.1. Temperature Dependence of the Intensity Ratio of Cr3+R-lines

The main interest in this study is the change of the emission spectra temperature, specifically changes seen for the R-lines. Figure 3 shows the relevant section of the luminescence spectra of Al2O3-Cr, Ga2O3-Cr, YAlO3-Cr, and Y3Al5O12-Cr, measured between 4 and 300 K. In all the crystals under study, the Cr3+ ion replaces the Al3+ or Ga3+ in distorted octahedral sites. Due to the distorted octahedral crystal field [39], the lowest excited 2E level splits into two levels ( E ¯ and 2 A ¯ ), which gives rise to sharp R-lines in the emission spectra of the crystals. The corresponding states are metastable since the transitions to the ground state are spin forbidden. They are partially allowed due to the admixture of the wavefunction of the 4T2g state to that of the 2E state and exhibit a long decay time constant (~10−3 s). The amount of admixture depends on the magnitude of the spin-orbit interaction and the energy gap between the 2E and the 4T2g levels, which is proportional to the strength of the crystal field [41,66]. At low temperatures, the metastable levels are populated via a fast relaxation process from the upper-lying 4T2g state. The population of the two emitting levels is controlled by processes of electron-phonon interaction between the impurity states and the host lattice. Therefore, in thermal equilibrium, the magnitude of this splitting is the main factor governing the temperature dependence of the luminescence intensity ratio of the two R lines. Due to the small energy gap between the two levels, the effect is particularly noticeable at low temperatures when the intensity of the R1-lines drastically increases while it decreases for R2, as shown in Figure 4. This effect is visualised in Figure 5 where the temperature variation of the intensity ratio of the two lines in the crystals under study is displayed.
The position of the emission spectra of the crystals reveals two distinct features, which is a significant shift of the R-lines toward the red in YAlO3-Cr and a much larger split between R-lines in Ga2O3-Cr in comparison with Al2O3-Cr. The variation of position of the R-line in different hosts is readily explained by the nephelauxetic effect [67]. Delocalization of the d-orbitals of Cr3+ due to the formation of chemical bonds with ligands decreases the energy of the 2E states. In perovskite-type YAlO3 crystals with orthorhombic structure, the Cr3+ substitute Al3+ in the slightly distorted octahedra AlO6, is compressed along the c-axis and stretched along the b-axis [68]. This causes a strong nephelauxetic effect and a shift of the R-lines in YAlO3-Cr toward lower energies [69,70]. Lastly, the emission of Cr3+ in Y3Al5O12 exhibits the smallest split and low-energy shift of R-lines. This is indicative of a weaker distortion from ideal octahedral symmetry.
The greater energy separation between the E ¯ and 2 A ¯ levels in Ga2O3 is explained by lower site symmetry of the Cr3+ ion in the host compared with Al2O3 [70,71,72]. This is consistent with the results of electron paramagnetic resonance (EPR) studies of Ga2O3-Cr [73], which demonstrates a larger energy splitting of the ground 4A2 level of Cr3+ in Ga2O3 (1.16 cm−1) when compared with that of Al2O3 (0.38 cm−1) due to a lowering of the local symmetry from trigonal to monoclinic. This translates to a visibly dissimilar temperature dependence of the emission properties. On the one hand, because of the larger energy gap, the phonon-induced population of the upper 2 A ¯ level in Ga2O3-Cr ceases at T < 50 K, which is at a much higher temperature in comparison with Al2O3-Cr. On the other hand, thermal quenching of the Cr3+ emission in Ga2O3 starts at much lower temperatures (ca. 200 K). This causes a more pronounced variation of the intensity ratio of the two lines over a narrower temperature range, which is displayed in Figure 4. Both effects eventually lead to the higher temperature sensitivity of Ga2O3-Cr over this temperature range.
The population process of the two levels in thermal equilibrium obeys Boltzmann statistics, which gives the following expression for the luminescence intensity ratio.
F ( T ) = A e x p ( D k T ) + B
In this case, A is the fitting parameter dependent on the spontaneous emission rate, its frequency and degeneracy of two levels, D is the energy difference between two emitting levels, k is the Boltzmann constant, T is the absolute temperature, and B is a constant offset. The latter accounts for the background contribution to the signal originating from other emission processes [74]. The important advantage of using the intensity ratio as a measure for temperature of a thermally coupled system is that the population of the individual levels is directly proportional to the total population. The change in total population due to a variation of excitation affects the population of the individual level to the same extent, which renders the luminescence intensity ratio independent of excitation intensity. Formula (1) was used to fit the experimental results and derive the calibration curve (see Figure 5). The values of the fitting parameters are summarised in Table 2.
It can be seen that, for Cr-doped Al2O3, YAlO3, and Y3Al5O12, the value for the energy gap between the two levels derived from the fitting correlates very well with the results of spectroscopic studies (Table 1). For Ga2O3-Cr, this is not the case. In this case, the fitted value is ca. 50% higher. This is indicative of energy transfer between two thermalized levels and another state [21]. To understand this discrepancy, one needs to bear in mind the quantitative difference in the energy structure of Cr3+ in this host leading to such changes. The energy gap between the E ¯ and 2 A ¯ levels in Ga2O3 is only by about a factor 4 less than the energy difference between the 2E and 4T2 [71,75] whereas, in other crystals of this study, this ratio is more than 25. Because of this, the E ¯ and 2 A ¯ levels of Cr3+ in Ga2O3 cannot be treated as an isolated system at low temperatures. Basically, at temperatures above ca. 50 K, when the upper 2 A ¯ level is sufficiently populated to give measurable luminescence (see Figure 4b) the probability of the depopulation through 2E→4T2 transitions is not negligible again. This additional channel is the reason for the observed overestimated value of the energy gap D in the crystal, as obtained from fitting.

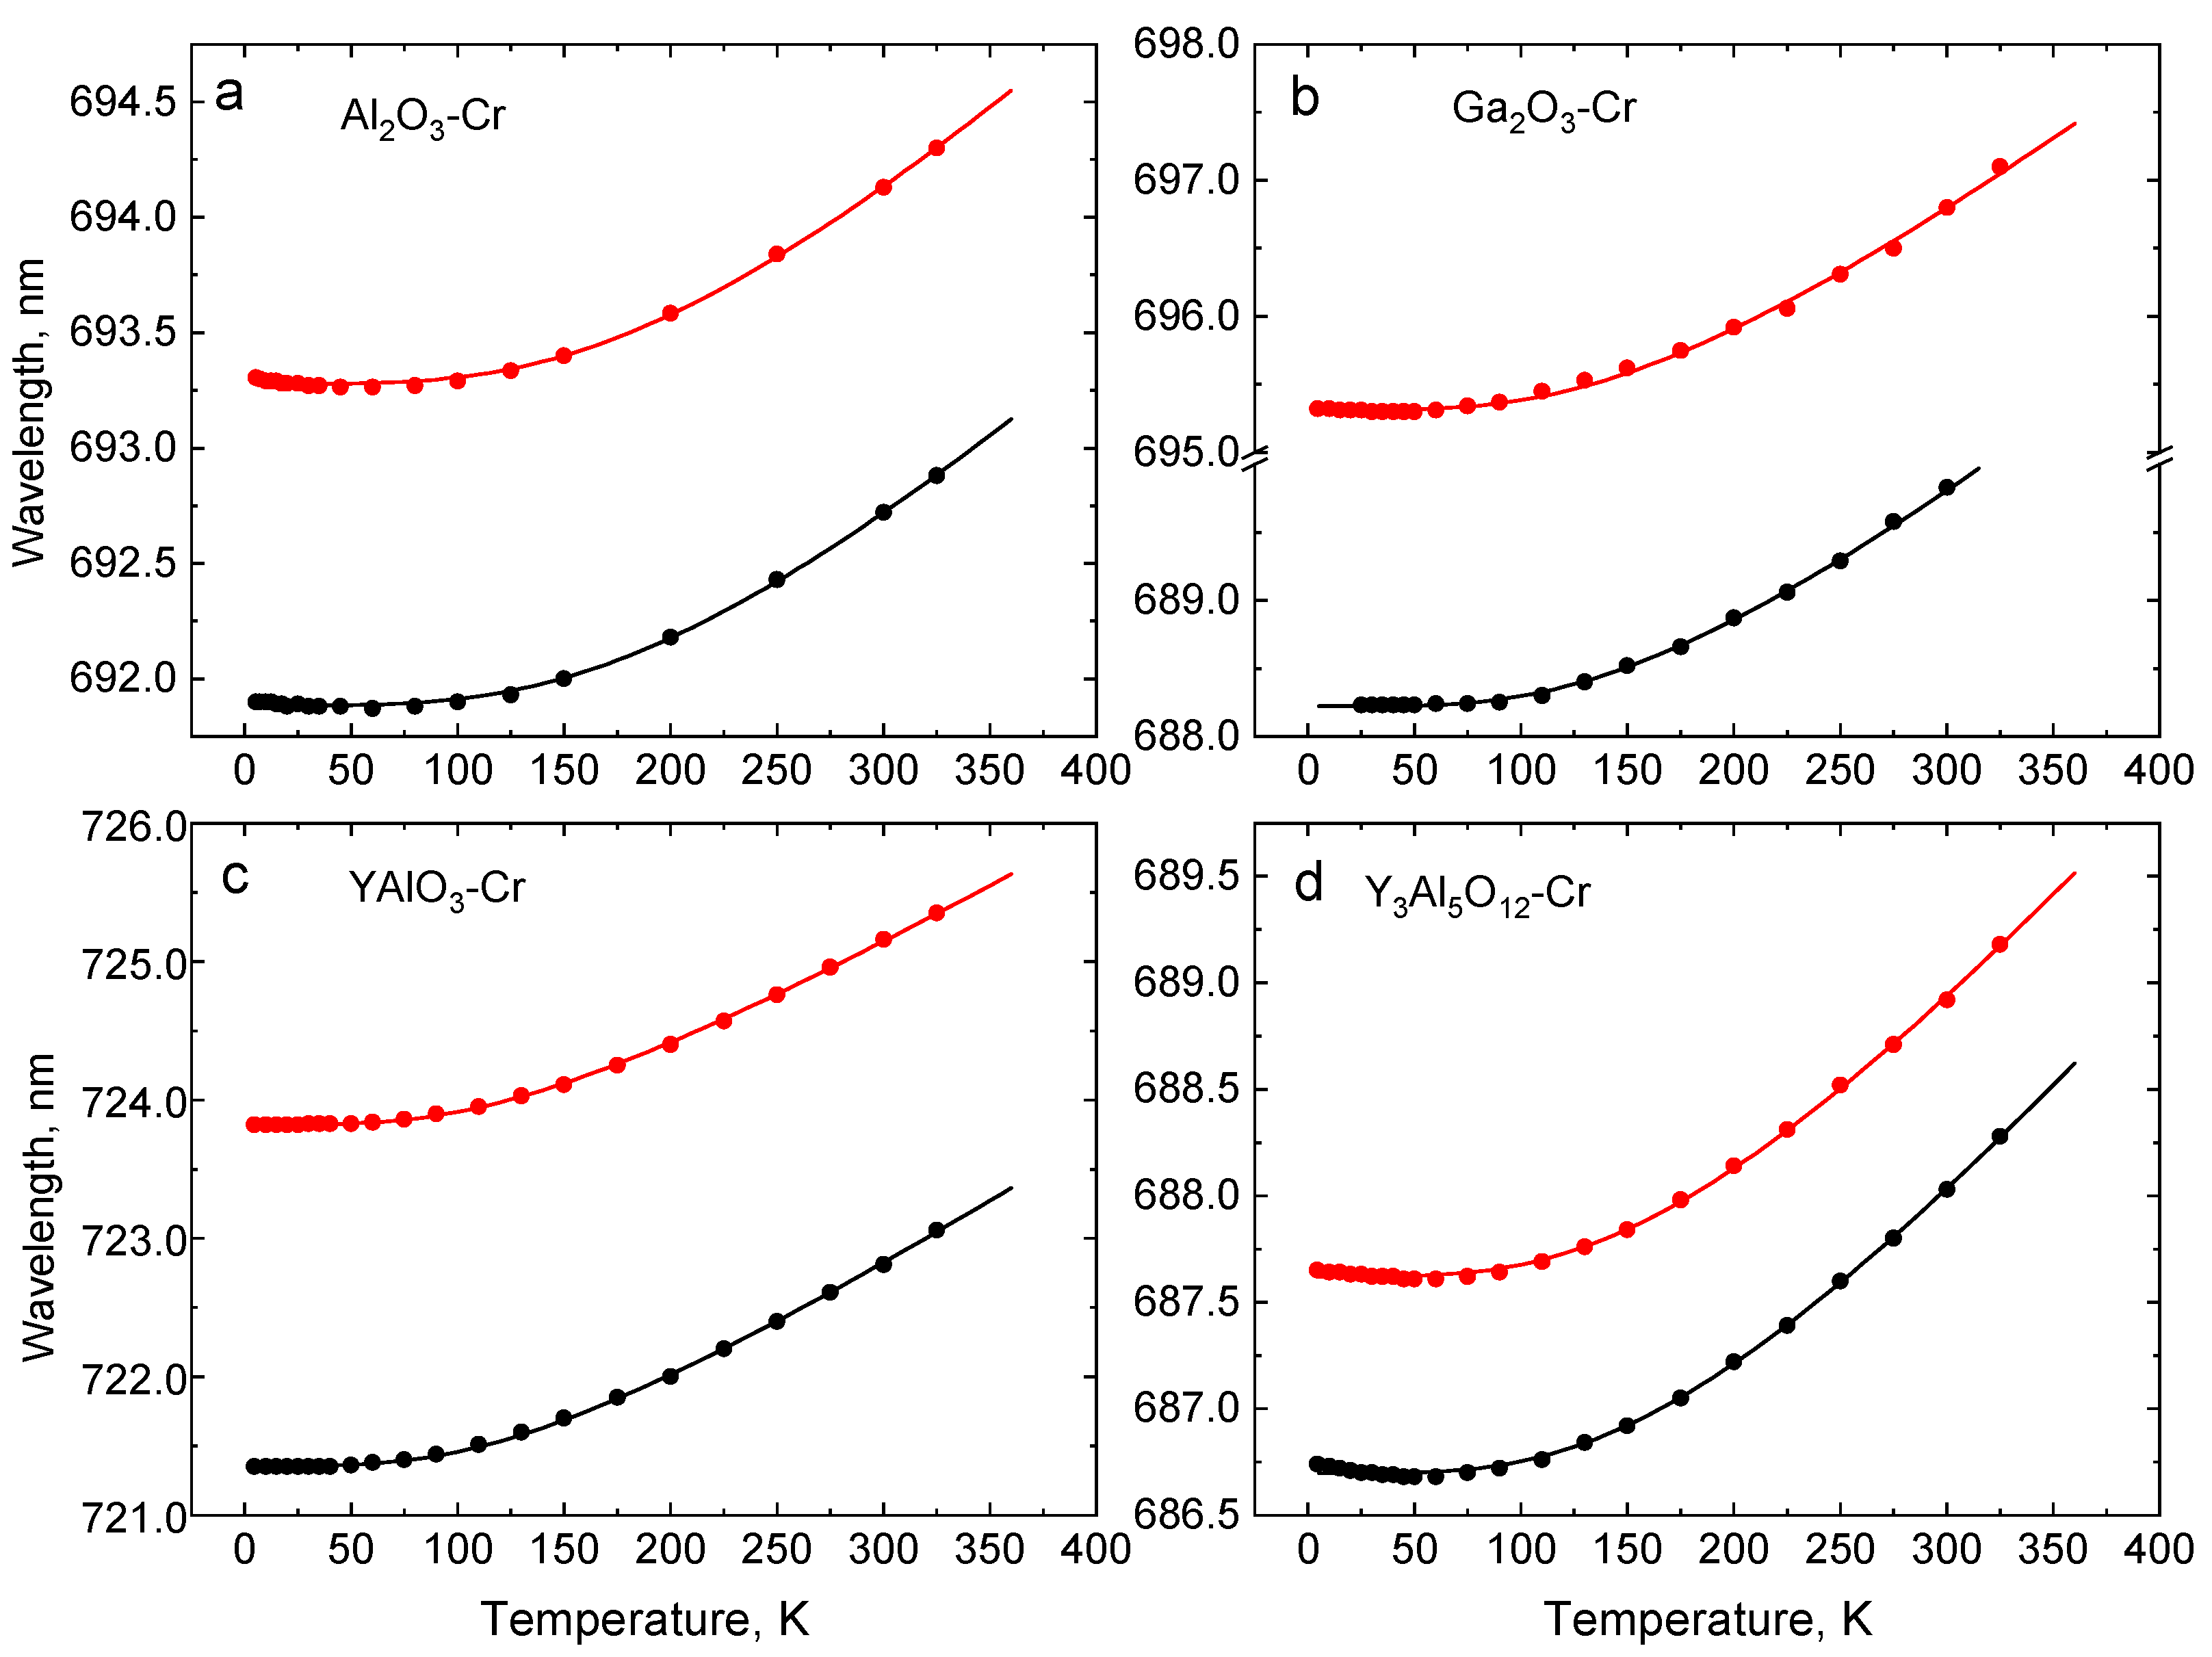
4.2. Wavelength Shift of Cr3+ R-Lines with Temperature

The absolute wavelength shift of the R-lines Δ ν is yet another feature of the Cr3+ emission that can be readily used in thermometry. Figure 6 displays the shift induced by temperature in the crystals under study. The mechanism of the effect is explained in terms of the interaction of electron states of the impurity ion with the phonons of the host lattice via absorption/emission of a single resonant phonon and a Raman process involving scattering of two phonons [39]. The theoretical interpretation of the wavelength shift with temperature has been developed by McCumber and Sturge and applied to Al2O3-Cr emission [42]. According to the model, the thermal shift of the lines Δ ν can be approximated by the following equation.
Δ ν ( T ) = α ( T T D ) 4 0 T D / T x 3 exp ( x ) 1 d x
where α is the coupling coefficient for the electron-phonon interactions and T D is the Debye temperature of the material. The formula was used as the model for a correlated fit of the thermal shifts of the R-lines, which allows individual α for the two lines, individual values for wave numbers at the lowest temperatures, and the Debye temperature T D common to both (R1 and R2) data sets. Very good fit results were achieved for the crystals studied, in this case, throughout the entire measurement range. The fit parameters are summarised in Table 3. Note that an earlier study of the wavelength shift in Al2O3-Cr yielded T D = 750 K [42], while the Debye temperature derived from the fit in this scenario is closer to the consolidated reference value ( T D = 970 K [76]). The values of Debye temperatures obtained from the fit for YAlO3 and Y3Al5O12 are in good agreement with that derived from measurements of temperature changes of crystal structures ( T D = 534 K [77] and 760 K [78], respectively). Lastly, the fitted value of the Debye temperature for Ga2O3 ( T D = 682 K) is consistent with that obtained from a measurement of the thermal conductivity ( T D = 738 K) [79].
Inspection of the data presented in Figure 6 shows that the wavelength shift of the R-lines is insignificant at low temperatures. In YAlO3-Cr and Ga2O3-Cr, the lines start to exhibit a recognizable departure from a near constant at T > 70 K, while, in Cr-doped Al2O3 and Y3Al5O12, the onset of the changes is at an even higher temperature (ca. 100 K). This defines the lower limit of a temperature range where each crystal can be used for temperature monitoring based on the wavelength shift of R-lines.

4.3. Temperature Dependence of the Luminescence Decay Time

The variation of luminescence decay time constants of the R-lines of Cr3+ over the 4–325 K temperature range was measured to evaluate the decay-time-based responsivity characteristics of the crystals. Decay curves at different temperatures are shown in Figure 6. The emission process in Cr3+ can be described by a classic model of radiative decay of isolated impurity centres. The resultant exponential decay curve for the intensity I ( t )   is I 0 exp ( t / τ ) + C , where   I 0 is the initial intensity, τ is the luminescence decay constant, and C is the background [39] (see Figure 7). The decay time constants as a function of temperature determined from the data in Figure 7 are plotted in Figure 8. The common trend observed in all crystals is an increase of the decay time constants with cooling. However, the gradients in τ = f ( T ) are unique to each material. The main differences in the τ = f ( T ) plots are observed at low temperatures (see Figure 7). For example, in Al2O3-Cr, at temperatures below ≈100 K, the decay time constants shorten when cooling, rather than continuing the trend seen at higher temperatures. A similar, though less pronounced, decrease in the temperature dependence of the decay time constant of Y3Al5O12-Cr is seen below 20 K. In YAlO3-Cr, we also detected a small yet steady decrease of the decay time constant below 70 K. Ga2O3-Cr is the sole material where τ = f ( T ) keeps increasing with cooling until it reaches a steady value.
Such a significant difference in the behaviour of the Cr3+ emission τ = f ( T ) characteristic, especially when individual to the material and prominent at low temperatures, is intriguing and deserves further investigation. The earlier explanation of this effect [40,80] suggests that the decrease in τ = f ( T ) of Al2O3-Cr below 100 K (see Figure 8a) is due to thermally-activated transitions from the lower E ¯ to the upper 2 A ¯ level. Since the upper level has a longer radiative lifetime, such transitions cause the increase of the measured decay constant. At further cooling, the probability of such a transition and, hence, population of the upper level is gradually reduced, which translates into a decrease of the decay time constant. This is then determined predominantly by the radiative rate of the lower level. It is readily understood, therefore, that the magnitude of the energy split of the emission states of Cr3+ and the respective transition rates are the main factors controlling the shape of the τ = f ( T ) characteristic at low temperatures.
This interpretation envisions that a thermally activated exchange between the split levels should manifest itself in a temperature dependence of the luminescence decay time in all Cr-doped compounds. So far, this has been reported and discussed only for ruby [40], and alexandrite [81]. It seems plausible that, in other materials, other effects may mask it. One such example is Y3Al5O12-Cr. The decrease of the decay time constant at low temperature observed by us is prominently visible (see Figure 8d), whereas earlier studies missed this feature [82,83], which leads to an alternative interpretation of the temperature dependency. Another example is YAlO3-Cr, which exhibits the longest decay time constant (55 ms) in comparison with other Cr-doped compounds under study. Due to this, the relative decrease of the decay time constant at low temperatures accounts for ca. 5% (see Figure 8c), which is easy to overlook or even attribute to experimental errors. In Ga2O3-Cr, the luminescence decay time constant exhibits a steady rise with a decreasing temperature (see Figure 8b). One possible explanation of this behaviour is that, due to a large energy splitting of the 2E level and the low thermal quenching temperature, the thermal activation of the upper 2 A ¯ level is superseded by the thermal depopulation through the 2E→4T2 transitions. Another possibility to explain this observation is to assume the opposite relationship between the radiative rates of two levels in the crystal, i.e., the radiative lifetime of the lower level is longer than that of the upper level. For temperature monitoring, a monotonic change of the decay time constant is preferable. Thus, it would be very helpful to get better insight into the mechanism behind this behaviour. Motivated by this, we developed a phenomenological model that can provide an interpretation for the variety of τ = f ( T ) characteristics, which is measured here.
The basis and prerequisite of the model is that the impurity ions of Cr3+ strongly interact with the crystal field and lattice vibrations of the host. Consequently, changes in temperature that alter the crystal field, phonon density, and their energy affect the emission decay time constant. The temperature dependence of the luminescence decay time constant of Cr3+ can be described by a model that takes into account two types of processes affecting the population of the 2E levels, i.e., thermally-induced depopulation and phonon-assisted relaxation of the emission centre. With the assumption that the states are in thermal equilibrium, the observed decay time will be a thermal average of the radiative decay rates of the three levels ( E ¯ , 2 A ¯ , and 4T2) involved in the transitions, and weighted by the Boltzmann occupation factor and degeneracy.
1 τ ( T ) = i = 1 3 g i R i e x p ( Δ E i k T ) i = 1 3 g i e x p ( Δ E i k T )
In this expression, R i are the radiative decay rates, g i are the degeneracies of the states, and Δ E i is the energy difference between the i th state and the lower excited level. In this case, the integers i   = 1, 2, and 3 correspond to the E ¯ , 2 A ¯ , and 4T2 levels having a degeneracy equal to 2, 2, and 12, respectively. Subsequently, Δ E 1 = 0, Δ E 2   =   D , the energy split of the 2E levels, and Δ E 2 = Δ E is the energy difference between the 2E and 4T2 levels.
Another effect causing a change of the radiative decay rates with temperature is phonon-induced interactions. This effect can be accounted for by a factor c o t h ( E p / 2 k T ) , [39,82,84], resulting in the following expression for the radiative decay rate of the i th state.
R i = 1 τ i c o t h ( E p 2 k T )
where τ i is the radiative decay time constant, and E p stands for “effective energy” of the phonons responsible for the exchange with the sidebands. In the following derivation, we introduce two simplifications. First, because of the proximity of the E ¯ and 2 A ¯ levels, we assume that the same value for the phonon energy E p can be used to characterise the phonon-induced interaction with both levels. Second, we omit the phonon-induced interaction for the radiative decay transitions occurring from the 4T2 level and use a temperature-independent term R 3 = 1 / τ 3 . This is a valid approximation since these transitions become involved only in the radiative decay process of Cr3+ at higher temperatures when thermally assisted depopulation dominates the phonon-mediated exchange with sidebands. Thus, the expression for τ ( t ) can be rearranged as follows.
τ ( T ) = 1 + e x p ( D k T ) + 6 e x p ( Δ E k T ) 1 τ 1 c o t h ( E p 2 k T ) + 1 τ 2 c o t h ( E p 2 k T ) e x p ( D 2 k T ) + 6 τ 3 e x p ( Δ E k T )
In this case, 1 τ i = R i ( i   = 1, 2 and 3) are the radiative decay rates of the E ¯ , 2 A ¯ , and 4T2 levels, respectively. This equation accounts for the thermalisation process occurring between the E ¯ and 2 A ¯ levels and phonon-assisted relaxation and depopulation of the levels due to thermally induced 2E→4T2 transitions. These are the main processes that determine the τ = f ( T ) behaviour in the low-temperature region.
This model (Equation (5)) was then used to fit the experimental data for Al2O3-Cr by achieving good agreement of experimental data and theory over the entire temperature range (see a solid line in Figure 7a). The parameters of the fit are summarised in Table 4. A very similar model had been adopted by Zhang et al. [40] to fit the temperature dependence of the decay time of Al2O3-Cr. The main difference is the number of free parameters used for the fit. In Reference [40], two fixed values for the phonon energies E p and the ratio τ 1 / τ 2 were used while, in the case presented here, all parameters except the energy gap between the two levels, D , are free parameters, which result in greater accuracy of the parameters.
The relation between the radiative lifetimes of the two levels (<1), as obtained, is consistent with the reasoning proposed in this case for the interpretation of the observed change of the luminescence decay time constant at low temperatures. This relation between τ 1   and   τ 2 , the population of the upper 2 A ¯ level occurring at the expense of depleting the lower emission level of Cr3+, leads to the increase of the measured decay time of Al2O3-Cr with an increase of temperature over the 4–100 K range.
We then applied the model to fit the measured temperature dependencies of the decay time of other crystals and obtained exceptionally good agreement with the experimental results (see Figure 8b–d). The parameters of the fits, i.e., effective phonon energies and activation energies of thermal quenching, correlate with those quoted for the emission of the crystals in References [72,82,85]. Similar to the ruby, the radiative lifetime of the upper level τ 2 of Cr3+ in YAlO3 and Y3Al5O12-Cr is higher than for the lower level, which explains the decrease of the decay time constant with cooling below 70 K and 20 K, respectively.
The fitting of the τ = f ( T ) dependency of Ga2O3-Cr yielded the most interesting result. The lifetime of the lower level exceeds the respective value for the upper level by a factor of three, which results in an inverse relation of the two parameters ( τ 1 / τ 2 > 1). This has major implications for the temperature dependence of the decay time constant. Since the lower level E ¯ has a longer radiative lifetime, the thermal activation of the upper 2 A ¯ level at heating results in a steady increase of the overall transition rate that, in turn, translates into a monotonic decrease of the decay time constant with temperature in Cr-doped Ga2O3.
For thermometric applications, this type of temperature dependency is much preferred. This is in contrast to the situation observed in other crystals where the slope of τ = f ( T ) plot changes its sign at around 120 K (Al2O3-Cr), 70 K (YAlO3-Cr), and 20 K (Y3Al5O12-Cr), which causes ambiguity of the temperature reading and much reduced sensitivity in the important region of cryogenic temperatures. In the next section, we will discuss the effect different features of luminescence of Cr-doped oxides have on the performance characteristics of temperature sensing methods.

5. Comparison of Temperature Sensing Schemes

Having investigated the temperature changes of different luminescence parameters in Cr-doped oxides and determined the analytical expression for the dependence, we can evaluate and compare the merit of these materials for non-contact thermometry when used in different modes of temperature sensing. The sensitivity S of different materials can be defined as the modulus of the fraction of change of measured thermometric parameter Q -either luminescence intensity ratio, wavelength shift, or decay time constant- over changes with temperature.
S = | d Q d T |
For good sensitivity over a wide range of temperatures, a large value of the derivative | d Q / d T | over the full range is desirable. This parameter alone cannot, however, be used for direct comparison of different methods for temperature sensing as it is expressed in different units, depending on the monitored variable. One way to regulate the comparison throughout different materials and temperature measurement methods is to use the temperature uncertainty or resolution δ T , which can be calculated as a ratio of experimental error of the measured parameter δ Q and sensitivity [8].
Δ T = Δ Q | d Q d T | 1
This parameter represents the smallest temperature difference that can be resolved by the sensor and, hence, can serve as an indicator of the measurement accuracy [86].
To determine this parameter, one needs to have a reasonable estimate for the standard error on the mean of the measured intensity ratio, decay time, and wavelength shift. The relative errors for measurements of decay time and intensity ratio over the examined temperature range are estimated to be 0.5% and 2%, respectively, while the absolute error in determining the wavelength shift is taken as a temperature-independent constant value equal to 0.02 nm. Expression (7) and the temperature dependencies of the measured parameters were then used to calculate the uncertainty of temperature measurements as a function of temperature.
The temperature dependence of the thermometric resolutions for the crystals discussed here are presented in Figure 9a–c. All the plots demonstrate a significant (in some cases, more than two orders of magnitude) variation of δ T over the temperature range of interest. To compare the relative sensitivity of different crystals and in different regimes of temperature measurements, we use a value of δ T   = 1 K as a separator between high and low resolution of a temperature sensor. The temperature resolution typically reported for non-contact luminescence sensors using decay time and intensity ratio techniques can vary over a broad range from 5 × 10⁻³ to 5 K [2,6,8,9,23,27,38,56,74,87,88,89,90].
Inspection of the δ T = f ( T ) plots shows that good temperature resolution over the 5–100 K range can be achieved by monitoring the luminescence intensity ratio of the R-lines in Cr3+-doped oxides (see Figure 9a). The best value of temperature uncertainty, ±0.06 K at 10 K, observed for Al2O3-Cr is superior to what is typically found in other materials [2,8]. The underlying mechanism, which leads to good temperature sensitivity of the intensity ratio method, is a low energy gap between the two levels involved in the luminescence process. However, the resolution of Al2O3-Cr diminishes very significantly with an increasing temperature so that, at above 25 K, YAlO3-Cr is better. Ga2O3-Cr, which possesses the largest energy gap between the E ¯ and 2 A ¯ levels of Cr3+, manifests the best temperature resolution (better than ±1 K) over the 40–140 K range. The use of the intensity ratio of R-lines in Ga2O3-Cr for temperature reading has, however, one important shortcoming, limited operation range of sensing. On the one hand, because of the large energy difference between the two states, the population of the upper levels swiftly drops with cooling, and, thereby, limits the ability to determine temperature. On the other hand, due to strong thermal quenching, the intensity of the R-lines decreases rapidly with increasing temperature, which leads to a concomitant decrease of the signal-to-noise ratio, which renders a temperature evaluation above 200 K difficult.
Temperature monitoring using the wavelength shift of the R-lines of Cr3+ luminescence exhibits the worst temperature resolution, as shown in Figure 9b. This is due to the low sensitivity of the method. For example, at T > 200 K, the peak wavelength of the R1 line of Cr3+ shifts with a gradient of ca. 1 × 10⁻² nm/K [43] whereas the accuracy of determining the position of the sharp R-lines is ±0.02 nm. Furthermore, the slope of Δ ν = f ( T ) rapidly reduces with cooling, which translates to poor accuracy of the temperature reading at lower temperatures. Therefore, this method is competitive merely at higher temperatures where the uncertainty reduces to a few K. At 300 K, the temperature resolution is ±3 K for Al2O3-Cr and ±2 K for Ga2O3-Cr while YAlO3-Cr and Y3Al5O12-Cr are in between the two.
The last plot (Figure 9c), which shows the temperature resolution of the decay time thermometry achievable with Cr3+ doped crystals, reveals the most interesting features. Al2O3-Cr, which has been extensively promoted for high-temperature applications, exhibits an increase of the uncertainty at cryogenic temperatures. The best temperature resolution at 300 K, δ T = ±2.5 K, is consistent with previously reported values [50], but it deteriorates significantly with cooling. Therefore, in case of Al2O3-Cr, decay time thermometry is inferior when compared to the intensity ratio technique for applications below room temperature. Despite better performance of YAlO3-Cr, the accuracy of measurements at low temperatures is also limited. The longer decay period is another disadvantage of this material, which makes measurements based on this approach longer. This is not ideal for practical applications. Inspection of the data in Figure 9c shows that Y3Al5O12-Cr exhibits significantly better temperature resolution than the former two compounds, but, evidently, it is Ga2O3-Cr that represents the best material for decay time thermometry at cryogenic temperatures. The crystal exhibits good temperature resolution (better than ±1 K) over a broad range (80–300 K). The lowest uncertainty of the temperature measurements is found to be ±0.3 K at 165 K, which is comparable to the accuracy of standard resistance temperature sensors and the best resolution achieved by non-contact luminescence decay time sensors [9,23]. It appears that Cr-doped Ga2O3, applied to temperature sensing, is superior in comparison with the other two crystals. Overall, these findings correlate very well with the earlier reasoning regarding the impact of the energy structure of Cr3+ on the thermometric sensitivity of the decay time method in the temperature range in question. The relatively small energy gap between the 2E and 4T2g levels in materials with intermediate crystal field strength is beneficial for cryogenic thermometry while hosts with a larger energy gap are more suited for measurements at higher temperatures.

6. Conclusions

The sensitivity of Cr3+ luminescence to changes of temperature is put to use for non-contact measurements of temperature by monitoring the relevant emission characteristics, namely, intensity ratio of R-lines, wavelength shift, and decay time constant. Renewed interest in non-contact luminescence sensing is prompted by the necessity to monitor the temperature of cryogenically-preserved proteins and cells subjected to exposure of ionising radiation in X-ray crystallography, X-ray, and electron microscopy or tomography experiments. We evaluated the feasibility and potential of Cr-doped Al2O3, Ga2O3, YAlO3, and Y3Al5O12 for temperature sensing over the 4–300 K range.
The main step forward presented in this case with respect to what has previously been reported for some of the materials in the context of non-contact luminescence sensing of temperature is an extended examination of luminescence characteristics and identification of principal features influencing thermometry over the above temperature range. This is complemented by comprehensive analysis and interpretation of thermometric properties of the crystals under study. To do this, we applied pertinent theoretical models used to explain the observed temperature dependencies by changes in the dynamics of the excited level populations due to (i) thermalization, (ii) electron-phonon interaction, (iii) non-radiative multi-phonon relaxation, and (iv) thermal depopulation of higher states. The intensity ratio of R-lines at low temperatures is predominantly controlled by the process (i) responsible for redistribution of populations between the upper and lower levels. The process (ii) is the cause of a wavelength shift while the explanation of the temperature change of the decay rate needs to take into account the combined effects of all processes (i)−(iv). We then demonstrated that the models provide adequate interpretation of the processes, which can be judged from the high quality of fits obtained for the measured temperature dependence of the luminescence intensity ratio F , wavelength shift Δ ν , and decay time constant τ in the crystals under study. The results of the fits yielded a number of quantitative parameters of which further analysis allows us to establish how the energy structure of the emission centre and phonon dynamics in different hosts influence the luminescence properties and what effect it has upon the different modes of non-contact luminescence temperature sensing. We demonstrated that the temperature dependence of the luminescence decay time in Al2O3-Cr, YAlO3-Cr, and Y3Al5O12-Cr exhibits qualitatively different behaviour to that of Ga2O3-Cr. According to the model that describes the dynamics of the luminescence process of Cr3+, this is due to the change in the ratio of radiative decay rates of E ¯ and 2 A ¯ levels ( τ 1 / τ 2 ). The ratio is found to be less than one in all crystals but Ga2O3-Cr, where τ 1 / τ 2 > 1.
Lastly, we evaluated the thermometric performance of the three methods of temperature sensing in four crystals. The comparison shows that the intensity ratio method has high accuracy and, hence, it can be used at very low temperatures. It is found that Ga2O3-Cr, which possesses the largest energy gap between the emitting levels of Cr3+, manifests good temperature resolution (±1 K or better) over the 40–140 K range. This is contrasted by Al2O3-Cr and YAlO3-Cr where a similar level of temperature resolution is observed below 50 K. The spectral line shift technique has not proven to be adequate for temperature sensing in the range of cryogenic temperatures since all the materials exhibit relatively small shifts of the Cr3+ emission lines and, subsequently, exhibit large measurement uncertainties. The study also demonstrated that the non-contact decay time thermometry using Al2O3-Cr and YAlO3-Cr is suboptimal for application at low temperatures. The temperature resolution is ca. ±2.5 K at 300 K and it degrades further with cooling. In contrast, Y3Al5O12-Cr is well suited for temperature monitoring when using this method at above 150 K. Best performance can be achieved with Ga2O3-Cr. The crystal exhibits resolution better than ±1 K over a broad temperature range (80–300 K). This demonstrates that, among the examined materials, Ga2O3-Cr shows considerable promise for the technology of non-contact thermometry sensing. The full complement of Ga2O3-Cr capabilities as a non-contact cryogenic temperature sensor includes performance comparable or superior to other sensors and a possibility to use two sensing modes that offer comparable resolution in the range of cryogenic temperatures. The results of this study unequivocally demonstrated that Ga2O3-Cr is the preferred material for non-contact temperature monitoring within the cryogenic range 30–200 K that is of primary interest for experimenting with frozen proteins and cells.

Author Contributions

Conceptualization, V.B.M. and Y.Z.; methodology, A.S. Formal analysis V.B.M. and Y.Z. Investigation, V.T, Y.Z., and A.L. Data curation, H.K. Resources, A.W. Writing—original draft preparation, V.B.M. Writing—review & editing, H.K., A.S, Y.Z., V.T., A.L., and A.W. All authors have read and agreed to the published version of the manuscript.

Funding

The Polish National Science Centre (project no. 2018/31/B/ST8/00774).

Acknowledgments

V.B.M. wishes to acknowledge a helpful discussion with J. I. Eldridge on the theoretical model for the temperature dependence of the luminescence decay time constant. Authors thank V. Vasyltsiv for providing the sample of Cr-doped gallium oxide used in this study.

Conflicts of Interest

The authors declare no conflict of interest.

References

  1. Childs, P.R.N.; Greenwood, J.R.; Long, C.A. Review of temperature measurement. Rev. Sci Instrum. 2000, 71, 2959–2978. [Google Scholar] [CrossRef] [Green Version]
  2. Khalid, A.H.; Kontis, K. Thermographic. Phosphors for high temperature measurements: Principles, current state of the art and recent applications. Sensors 2008, 8, 5673–5744. [Google Scholar] [PubMed]
  3. Dramićanin, M. Luminescence thermometry. In Methods, Materials, and Applications; Woodhead Publishing: Cambridge, UK, 2018. [Google Scholar]
  4. Kim, M.M.; Giry, A.; Mastiani, M.; Rodrigues, G.O.; Reis, A.; Mandin, P. Microscale thermometry: A review. Microelectron. Eng. 2015, 148, 129–142. [Google Scholar] [CrossRef]
  5. Brites, C.D.S.; Lima, P.P.; Silva, N.J.O.; Millan, A.; Amaral, V.S.; Palacio, F.; Carlos, L.D. Thermometry at the nanoscale. Nanoscale 2012, 4, 4799–4829. [Google Scholar] [CrossRef] [Green Version]
  6. Brubach, J.; Pflitsch, C.; Dreizler, A.; Atakan, B. On surface temperature measurements with thermographic phosphors: A review. Prog. Energ. Combust. 2013, 39, 37–60. [Google Scholar] [CrossRef]
  7. Wang, X.D.; Wolfbeis, O.S.; Meier, R.J. Luminescent probes and sensors for temperature. Chem. Soc. Rev. 2013, 42, 7834–7869. [Google Scholar] [CrossRef]
  8. Brites, C.D.S.; Balabhadra, S.; Carlos, L.D. Lanthanide-based thermometers: At the cutting-edge of luminescence thermometry. Adv. Opt. Mater. 2019, 7, 1801239. [Google Scholar] [CrossRef] [Green Version]
  9. Homeyer, E.; Pailhes, S.; Debord, R.; Jary, V.; Dujardin, C.; Ledoux, G. Diamond contact-less micrometric temperature sensors. Appl. Phys. Lett. 2015, 106, 243502. [Google Scholar] [CrossRef]
  10. Vlaskin, V.A.; Janssen, N.; van Rijssel, J.; Beaulac, R.; Gamelin, D.R. Tunable dual emission in doped semiconductor nanocrystals. Nano. Lett. 2010, 10, 3670–3674. [Google Scholar] [CrossRef]
  11. Mahata, M.K.; Koppe, T.; Kumar, K.; Hofsass, H.; Vetter, U. Demonstration of temperature dependent energy migration in dual-mode YVO4: Ho3+/Yb3+ nanocrystals for low temperature thermometry. Sci. Rep. 2016, 6, 36342. [Google Scholar] [CrossRef]
  12. Wang, J.; Bu, Y.Y.; Wang, X.F.; Seo, H.J. A novel optical thermometry based on the energy transfer from charge transfer band to Eu3+-Dy3+ ions. Sci. Rep. 2017, 7, 6023. [Google Scholar] [CrossRef] [PubMed]
  13. Gharouel, S.; Labrador-Paez, L.; Haro-Gonzalez, P.; Horchani-Naifer, K.; Ferid, M. Fluorescence intensity ratio and lifetime thermometry of praseodymium phosphates for temperature sensing. J. Lumin. 2018, 201, 372–383. [Google Scholar] [CrossRef]
  14. Wang, Y.J.; Tsiumra, V.; Peng, Q.; Liang, H.B.; Zhydachevskyy, Y.; Chaika, M.; Dluzewski, P.; Przybylinska, H.; Suchocki, A. Hole trapping process and highly sensitive ratiometric thermometry over a wide temperature range in Pr3+-Doped Na2La2Ti3O10 layered perovskite microcrystals. J. Phys. Chem. A 2019, 123, 4021–4033. [Google Scholar] [CrossRef] [PubMed]
  15. Allison, S.W.; Beshears, D.L.; Cates, M.R.; Scudiere, M.B.; Shaw, D.W.; Ellis, A.D. Luminescence of YAG:Dy and YAG:Dy, Er crystals to 1700 °C. Meas. Sci. Technol. 2020, 31, 044001. [Google Scholar] [CrossRef]
  16. Allison, S.W.; Gillies, G.T. Remote thermometry with thermographic phosphors: Instrumentation and applications. Rev. Sci. Instrum. 1997, 68, 2615–2650. [Google Scholar] [CrossRef]
  17. Brubach, J.; Kissel, T.; Frotscher, M.; Euler, M.; Albert, B.; Dreizler, A. A survey of phosphors novel for thermography. J. Lumin. 2011, 131, 559–564. [Google Scholar] [CrossRef]
  18. Chambers, M.D.; Clarke, D.R. Doped oxides for high-temperature luminescence and lifetime thermometry. Annu. Rev. Mater. Res. 2009, 39, 325–359. [Google Scholar] [CrossRef] [Green Version]
  19. Ahmed, N.; Kraus, H.; Kim, H.J.; Mokina, V.; Tsiumra, V.; Wagner, A.; Zhydachevskyy, Y.; Mykhaylyk, V.B. Characterisation of tungstate and molybdate crystals ABO4 (A = Ca, Sr, Zn, Cd; B = W, Mo) for luminescence lifetime cryothermometry. Materialia 2018, 4, 287–296. [Google Scholar] [CrossRef]
  20. Pugh-Thomas, D.; Walsh, B.M.; Gupta, M.C. Spectroscopy of BeAl2O4:Cr3+ with application to high-temperature sensing. Appl. Opt. 2010, 49, 2891–2897. [Google Scholar] [CrossRef]
  21. Wang, X.F.; Liu, Q.; Bu, Y.Y.; Liu, C.S.; Liu, T.; Yan, X.H. Optical temperature sensing of rare-earth ion doped phosphors. RSC Adv. 2015, 5, 86219–86236. [Google Scholar] [CrossRef]
  22. Fuhrmann, N.; Brubach, J.; Dreizler, A. Phosphor thermometry: A comparison of the luminescence lifetime and the intensity ratio approach. Proc. Combust. Inst. 2013, 34, 3611–3618. [Google Scholar] [CrossRef]
  23. Yakunin, S.; Benin, B.M.; Shynkarenko, Y.; Nazarenko, O.; Bodnarchuk, M.I.; Dirin, D.N.; Hofer, C.; Cattaneo, S.; Kovalenko, M.V. High-resolution remote thermometry and thermography using luminescent low-dimensional tin-halide perovskites. Nat. Mater. 2019, 18, 846–852. [Google Scholar] [CrossRef]
  24. Cai, T.; Kim, D.; Kim, M.; Liu, Y.Z.; Kim, K.C. Two-dimensional thermographic phosphor thermometry in a cryogenic environment. Meas. Sci. Technol. 2017, 28, 015201. [Google Scholar] [CrossRef]
  25. Cates, M.R.; Beshears, D.L.; Allison, S.W.; Simmons, G.M. Phosphor thermometry at cryogenic temperatures. Rev. Sci. Instrum. 1997, 68, 2412–2417. [Google Scholar] [CrossRef]
  26. Bresson, F.; Devillers, R. Fluorescence temperature sensing on rotating samples in the cryogenic range. Rev. Sci. Instrum. 1999, 70, 3046–3051. [Google Scholar] [CrossRef]
  27. Liu, X.; Akerboom, S.; de Jong, M.; Mutikainen, I.; Tanase, S.; Meijerink, A.; Bouwman, E. Mixed-Lanthanoid Metal-O.ganic Framework for Ratiometric Cryogenic Temperature Sensing. Inorg. Chem. 2015, 54, 11323–11329. [Google Scholar] [CrossRef]
  28. Weik, M.; Colletier, J.P. Temperature-dependent macromolecular X-ray crystallography. Acta. Crystallogr. D 2010, 66, 437–446. [Google Scholar] [CrossRef] [PubMed]
  29. Ponomarenko, O.; Nikulin, A.Y.; Moser, H.O.; Yang, P.; Sakata, O. Radiation-induced melting in coherent X-ray diffractive imaging at the nanoscale. J. Synchrotron. Radiat. 2011, 18, 580–594. [Google Scholar] [CrossRef] [PubMed]
  30. Garman, E.F.; Weik, M. X-ray radiation damage to biological macromolecules: Further insights. J. Synchrotron. Radiat. 2017, 24, 1–6. [Google Scholar] [CrossRef]
  31. Russi, S.; González, A.; Kenner, L.R.; Keedy, D.A.; Fraser, J.S.; Bedem, H.V.D. Conformational variation of proteins at room temperature is not dominated by radiation damage. J. Synchrotron. Radiat. 2017, 24, 73–82. [Google Scholar] [CrossRef]
  32. Warkentin, M.; Atakişi, H.; Hopkins, J.B.; Walko, D.; Thorne, R.E. Lifetimes and spatio-temporal response of protein crystals in intense X-ray microbeams. IUCrJ 2017, 4, 785–794. [Google Scholar] [CrossRef] [PubMed]
  33. Mykhaylyk, V.B.; Wagner, A.; Kraus, H. Non-contact luminescence lifetime cryothermometry for macromolecular crystallography. J. Synchrotron. Radiat. 2017, 24, 636–645. [Google Scholar] [CrossRef] [PubMed] [Green Version]
  34. Mykhaylyk, V.; Kraus, H.; Wägner, A. Non-Contact Luminescence Lifetime Microthermometry using Scintillation Sensors. Acta Phys. Pol. A 2018, 133, 1108–1111. [Google Scholar] [CrossRef]
  35. Warren, A.J.; Axford, D.; Owen, R.L. Direct measurement of X-ray-induced heating of microcrystals. J. Synchrotron. Radiat. 2019, 26, 991–997. [Google Scholar] [CrossRef] [Green Version]
  36. Mykhaylyk, V.B.; Kraus, H.; Bobb, L.; Gamernyk, R.; Koronski, K. Megahertz non-contact luminescence decay time cryothermometry by means of ultrafast PbI2 scintillator. Sci. Rep. 2019, 9, 5274. [Google Scholar] [CrossRef]
  37. Mikhailik, V.B.; Kraus, H. Scintillators for cryogenic applications: State-of-art. J. Phys. Stud. 2010, 14, 4201–4206. [Google Scholar] [CrossRef]
  38. Särner, G.; Richter, M.; Aldén, M. Two-dimensional thermometry using temperature-induced line shifts of ZnO:Zn and ZnO:Ga fluorescence. Opt. Lett. 2008, 33, 1327–1329. [Google Scholar] [CrossRef] [PubMed]
  39. Powell, R.C. Physics of Solid-State Laser Materials; Springer: Berlin/Heidelberg, Germany, 1998. [Google Scholar]
  40. Zhang, Z.; Grattan, K.T.V.; Palmer, A.W. Temperature dependences of fluorescence lifetimes in Cr3+-doped insulating crystals. Phys. Rev. B 1993, 48, 7772–7778. [Google Scholar] [CrossRef]
  41. Grinberg, M. 2E→4A2 fluorescence of Cr3+ in high and intermediate field garnets. J. Lumin. 1993, 54, 369–382. [Google Scholar] [CrossRef]
  42. McCumber, D.E.; Sturge, M.D. Linewidth and Temperature Shift of the R Lines in Ruby. J. Appl. Phys. 1963, 34, 1682. [Google Scholar] [CrossRef]
  43. Ragan, D.D.; Gustavsen, R.; Schiferl, D. Calibration of the ruby R1 and R2 fluorescence shifts as a function of temperature from 0 to 600 K. J. Appl. Phys. 1992, 72, 5539–5544. [Google Scholar] [CrossRef] [Green Version]
  44. Kumari, S.; Khare, A. Optical and structural characterization of pulsed laser deposited ruby thin films for temperature sensing application. Appl. Surf. Sci. 2013, 265, 180–186. [Google Scholar] [CrossRef]
  45. Weinstein, B.A. Ruby thermometer for cryobaric diamond anvil cell. Rev. Sci. Instrum. 1986, 57, 910–913. [Google Scholar] [CrossRef]
  46. Grattan, K.T.V.; Selli, R.K.; Palmer, A.W. Ruby fluorescence wavelength division fiber-optic temperature sensor. Rev. Sci. Instrum. 1987, 58, 1231–1234. [Google Scholar] [CrossRef]
  47. Grattan, K.T.V.; Selli, R.K.; Palmer, A.W. Ruby decay-time fluorescence thermometer in a fiber-optic configuration. Rev. Sci. Instrum. 1988, 59, 1328–1335. [Google Scholar] [CrossRef]
  48. Anghel, F.; Iliescu, C.; Grattan, K.T.V.; Palmer, A.W.; Zhang, Z.Y. Fluorescent-based lifetime measurement thermometer for use at subroom temperatures (200–300 K). Rev. Sci. Instrum. 1995, 66, 2611–2614. [Google Scholar] [CrossRef]
  49. Hu, Y.; Zhang, Z.; Grattan, K.; Palmer, A.; Meggitt, B. Ruby-based decay-time thermometry: Effect of probe size on extended measurement range (77–800 K). Sens. Actuators A Phys. 1997, 63, 85–90. [Google Scholar] [CrossRef]
  50. Seat, H.C.; Sharp, J.H. Dedicated temperature sensing with C-axis oriented single crystal ruby (Cr3+ Al2O3) fibers: Temperature and strain dependences of R-line fluorescence. IEEE Trans. Instrum. Meas. 2004, 53, 140–154. [Google Scholar] [CrossRef]
  51. Grattan, K.T.V.; Zhang, Z.Y.; Sun, T.; Shen, Y.H.; Tong, L.M.; Ding, Z.C. Sapphire-ruby single-crystal fibre for application in high temperature optical fibre thermometers: Studies at temperatures up to 1500 degrees C. Meas. Sci. Technol. 2001, 12, 981–986. [Google Scholar]
  52. Atakan, B.; Eckert, C.; Pflitsch, C. Light emitting diode excitation of Cr3+:Al2O3 as thermographic phosphor: Experiments and measurement strategy. Meas. Sci. Technol. 2009, 20, 75304. [Google Scholar] [CrossRef]
  53. Zhang, Z.Y.; Grattan, K.T.V.; Palmer, A.W.; Fernicola, V.; Crovini, L. Temperature dependence of the YAG:Cr3+ fluorescence lifetime over the range 77 to 900 K. Phys. Rev. B 1995, 51, 2656–2660. [Google Scholar] [CrossRef] [PubMed]
  54. Fuhrmann, N.; Kissel, T.; Dreizler, A.; Brübach, J. Gd3Ga5O12:Cr—A phosphor for two-dimensional thermometry in internal combustion engines. Meas. Sci. Technol. 2011, 22, 045301. [Google Scholar] [CrossRef]
  55. Uchiyama, H.; Aizawa, H.; Katsumata, T.; Komuro, S.; Morikawa, T.; Toba, E. Fiber-optic thermometer using Cr-doped YAlO3 sensor head. Rev. Sci. Instrum. 2003, 74, 3883–3885. [Google Scholar] [CrossRef]
  56. Eldridge, J.I.; Chambers, M.D. Fiber optic thermometer using Cr-doped GdAlO3 broadband emission decay. Meas. Sci. Technol. 2015, 26, 095202. [Google Scholar] [CrossRef]
  57. Zhiyi, Z.; Grattan, K.T.V.; Palmer, A.W. Fiber-optic high-temperature sensor based on the fluorescence lifetime of alexandrite. J. Appl. Phys. 1992, 63, 3869–3873. [Google Scholar]
  58. Aizawa, H.; Ohishi, N.; Ogawa, S.; Watanabe, E.; Katsumata, T.; Komuro, S.; Morikawa, T.; Toba, E. Characteristics of chromium doped spinel crystals for a fiber-optic thermometer application. Rev. Sci. Instrum. 2002, 73, 3089–3092. [Google Scholar] [CrossRef]
  59. Borisov, S.M.; Gatterer, K.; Bitschnau, B.; Klimant, I. Preparation and Characterization of Chromium(III)-Activated Yttrium Aluminum Borate: A New Thermographic Phosphor for Optical Sensing and Imaging at Ambient Temperatures. J. Phys. Chem. C 2010, 114, 9118–9124. [Google Scholar] [CrossRef]
  60. Back, M.; Trave, E.; Ueda, J.; Tanabe, S. Ratiometric Optical Thermometer Based on Dual Near-Infrared Emission in Cr3+-Doped Bismuth-Based Gallate Host. Chem. Mater. 2016, 28, 8347–8356. [Google Scholar] [CrossRef]
  61. Li, X.; Jiang, G.; Zhou, S.; Wei, X.; Chen, Y.; Duan, C.-K.; Yin, M. Luminescent properties of chromium(III)-doped lithium aluminate for temperature sensing. Sens. Actuators B Chem. 2014, 202, 1065–1069. [Google Scholar] [CrossRef]
  62. Chervin, J.C.; Canny, B.; Mancinelli, M. Ruby-spheres as pressure gauge for optically transparent high pressure cells. High Press. Res. 2003, 23, 493. [Google Scholar] [CrossRef]
  63. Brik, M.G.; Srivastava, A.M. Review—A Review of the Electronic Structure and Optical Properties of Ions with d(3) Electron Configuration (V2+, Cr3+, Mn4+, Fe5+) and Main Related Misconceptions. ECS J. Solid State Sci. Technol. 2018, 7, R3079–R3085. [Google Scholar] [CrossRef]
  64. Sugano, S. Multiplets of Transition-Metal Ions in Crystals; Academic Press: San Diego, CA, USA, 1970. [Google Scholar]
  65. Popa, A.; Toloman, D.; Stan, M.; Silipas, T.D.; Biris, A.R. Optical and electron paramagnetic resonance studies of Cr doped Ga2O3 nanoparticles. In 10th International Conference Processes in Isotopes and Molecules (pim 2015); AIP Publishing: College Park, MD, USA, 2015; p. 060006. [Google Scholar]
  66. Struve, B.; Huber, G. The effect of the crystal field strength on the optical spectra of Cr3+ in gallium garnet laser crystals. Appl. Phys. A 1985, 36, 195–201. [Google Scholar] [CrossRef]
  67. Brik, M.; Camardello, S.J.; Srivastava, A.M.; Avram, N.M.; Suchocki, A. Spin-Forbidden Transitions in the Spectra of Transition Metal Ions and Nephelauxetic Effect. ECS J. Solid State Sci. Technol. 2015, 5, R3067–R3077. [Google Scholar] [CrossRef]
  68. Yamaga, M.; Takeuchi, H.; Han, T.P.J.; Henderson, B. Electron paramagnetic resonance and optical spectra of Cr3+-doped YAlO3. J. Phys. Condens. Matter 1993, 5, 8097–8104. [Google Scholar] [CrossRef]
  69. Weber, M.J.; Varitimos, T.E. Optical-Spectra and Relaxation of Cr3+ Ions in YAlO3. J. Appl. Phys. 1974, 45, 810–816. [Google Scholar] [CrossRef]
  70. Walsh, C.G.; Donegan, J.F.; Glynn, T.J.; Morgan, G.P.; Imbusch, G.F.; Remeika, J.P. Luminescence from β -Ga2O3-Cr3+. J. Lumin. 1988, 40–41, 103–104. [Google Scholar] [CrossRef]
  71. Vivien, D.; Viana, B.; Revcolevschi, J.D.; Barrie, A.; Dunn, B.; Nelson, P.; Stafsudd, O.M. Stafsudd, Optical-Properties of β-Ga2O3-Cr3+ Single-Crystals for Tunable Laser Applications. J. Lumin. 1987, 39, 29–33. [Google Scholar] [CrossRef]
  72. Tokida, Y.; Adachi, S. Photoluminescence spectroscopy and energy-level analysis of metal-organic-deposited Ga2O3:Cr3+ films. J. Appl. Phys. 2012, 112, 63522. [Google Scholar] [CrossRef]
  73. Yeom, T.H.; Kim, I.G.; Lee, S.H.; Choh, S.H.; Yu, Y.M. Electron paramagnetic resonance characterization of Cr3+ impurities in a beta-Ga2O3 single crystal. J. Appl. Phys. 2003, 93, 3315–3319. [Google Scholar] [CrossRef]
  74. Wade, S.; Collins, S.F.; Baxter, G.W. Fluorescence intensity ratio technique for optical fiber point temperature sensing. J. Appl. Phys. 2003, 94, 4743. [Google Scholar] [CrossRef]
  75. Luchechko, A.; Vasyltsiv, V.; Zhydachevskyy, Y.; Kushlyk, M.; Ubizskii, S.; Suchocki, A.; Zhydachevskii, Y. Luminescence spectroscopy of Cr3+ ions in bulk single crystalline β-Ga2O3. J. Phys. D Appl. Phys. 2020, 53, 354001. [Google Scholar] [CrossRef]
  76. Dorogokupets, P.I.; Ponomarev, E.M.; Melekhova, E.A. Optimization of experimental data on the heat capacity, volume, and bulk moduli of minerals. Petrology 1999, 7, 574–591. [Google Scholar]
  77. Senyshyn, A.; Vasylechko, L. Low Temperature Crystal Structure Behaviour of Complex Yttrium Aluminium Oxides YAlO3 and Y3Al5O {12}. Acta Phys. Pol. A 2013, 124, 329–335. [Google Scholar] [CrossRef]
  78. Aggarwal, R.L.; Ripin, D.J.; Ochoa, J.R.; Fan, T.Y. Measurement of thermo-optic properties of Y3Al5O12, Lu3Al5O12, YAIO(3), LiYF4, LiLuF4, BaY2F8, KGd(WO4)(2), and KY(WO4)(2) laser crystals in the 80–300 K temperature range. J. Appl. Phys. 2005, 98, 103514. [Google Scholar] [CrossRef]
  79. Guo, Z.; Verma, A.; Wu, X.F.; Sun, F.Y.; Hickman, A.; Masui, T.; Kuramata, A.; Higashiwaki, M.; Jena, D.; Luo, T.F. Anisotropic thermal conductivity in single crystal beta-gallium oxide. Appl. Phys. Lett. 2015, 106, 111909. [Google Scholar] [CrossRef]
  80. Nelson, D.F.; Sturge, M.D. Relation between Absorption and Emission in the Region of the R Lines of Ruby. Phys. Rev. 1965, 137, A1117–A1130. [Google Scholar] [CrossRef]
  81. Walling, J.; Peterson, O.; Jenssen, H.; Morris, R.; O’Dell, E. Tunable alexandrite lasers. IEEE J. Quantum. Electron. 1980, 16, 1302–1315. [Google Scholar] [CrossRef]
  82. Zhang, Z.; Grattan, K. Temperature dependence of YAG: Cr3+ fluorescence lifetime up to 550 K. J. Lumin. 1994, 62, 263–269. [Google Scholar] [CrossRef]
  83. Shen, Y.R.; Bray, K.L. Effect of pressure and temperature on the lifetime of Cr3+ in yttrium aluminum garnet. Phys. Rev. B 1997, 56, 10882–10891. [Google Scholar] [CrossRef]
  84. Suchocki, A.; Gilliland, G.D.; Powell, R.C.; Bowen, J.M.; Walling, J.C. Spectroscopic properties of alexandrite crystals II. J. Lumin. 1987, 37, 29–37. [Google Scholar] [CrossRef]
  85. Zhydachevskii, Y.; Galanciak, D.; Kobyakov, S.; Berkowski, M.; Kaminska, A.; Suchocki, A.; Zakharko, Y.; Durygin, A. Photoluminescence studies of Mn4+ions in YAlO3 crystals at ambient and high pressure. J. Phys. Condens. Matter 2006, 18, 11385–11396. [Google Scholar] [CrossRef]
  86. Back, M.; Ueda, J.; Xu, J.; Murata, D.; Brik, M.G.; Tanabe, S. Ratiometric Luminescent Thermometers with a Customized Phase-Transition-Driven Fingerprint in Perovskite Oxides. ACS Appl. Mater. Interfaces 2019, 11, 38937–38945. [Google Scholar] [CrossRef] [PubMed]
  87. Glais, E.; Đorđević, V.; Papan, J.; Viana, B.; Dramićanin, M.D. MgTiO3: Mn4+ a multi-reading temperature nanoprobe. RSC Adv. 2018, 8, 18341–18346. [Google Scholar] [CrossRef] [Green Version]
  88. Venturini, F.; Bürgi, R.; Borisov, S.M.; Klimant, I. Optical temperature sensing using a new thermographic phosphor. Sens. Actuators A Phys. 2015, 233, 324–329. [Google Scholar] [CrossRef]
  89. Brites, C.D.S.; Martínez, E.D.; Urbano, R.R.; Rettori, C.; Carlos, L.D. Self-Calibrated Double Luminescent Thermometers Through Upconverting Nanoparticles. Front. Chem. 2019, 7, 267. [Google Scholar] [CrossRef] [Green Version]
  90. Eldridge, J.I. Luminescence decay-based Y2O3:Er phosphor thermometry: Temperature sensitivity governed by multiphonon emission with an effective phonon energy transition. J. Lumin. 2019, 214, 116535. [Google Scholar] [CrossRef]
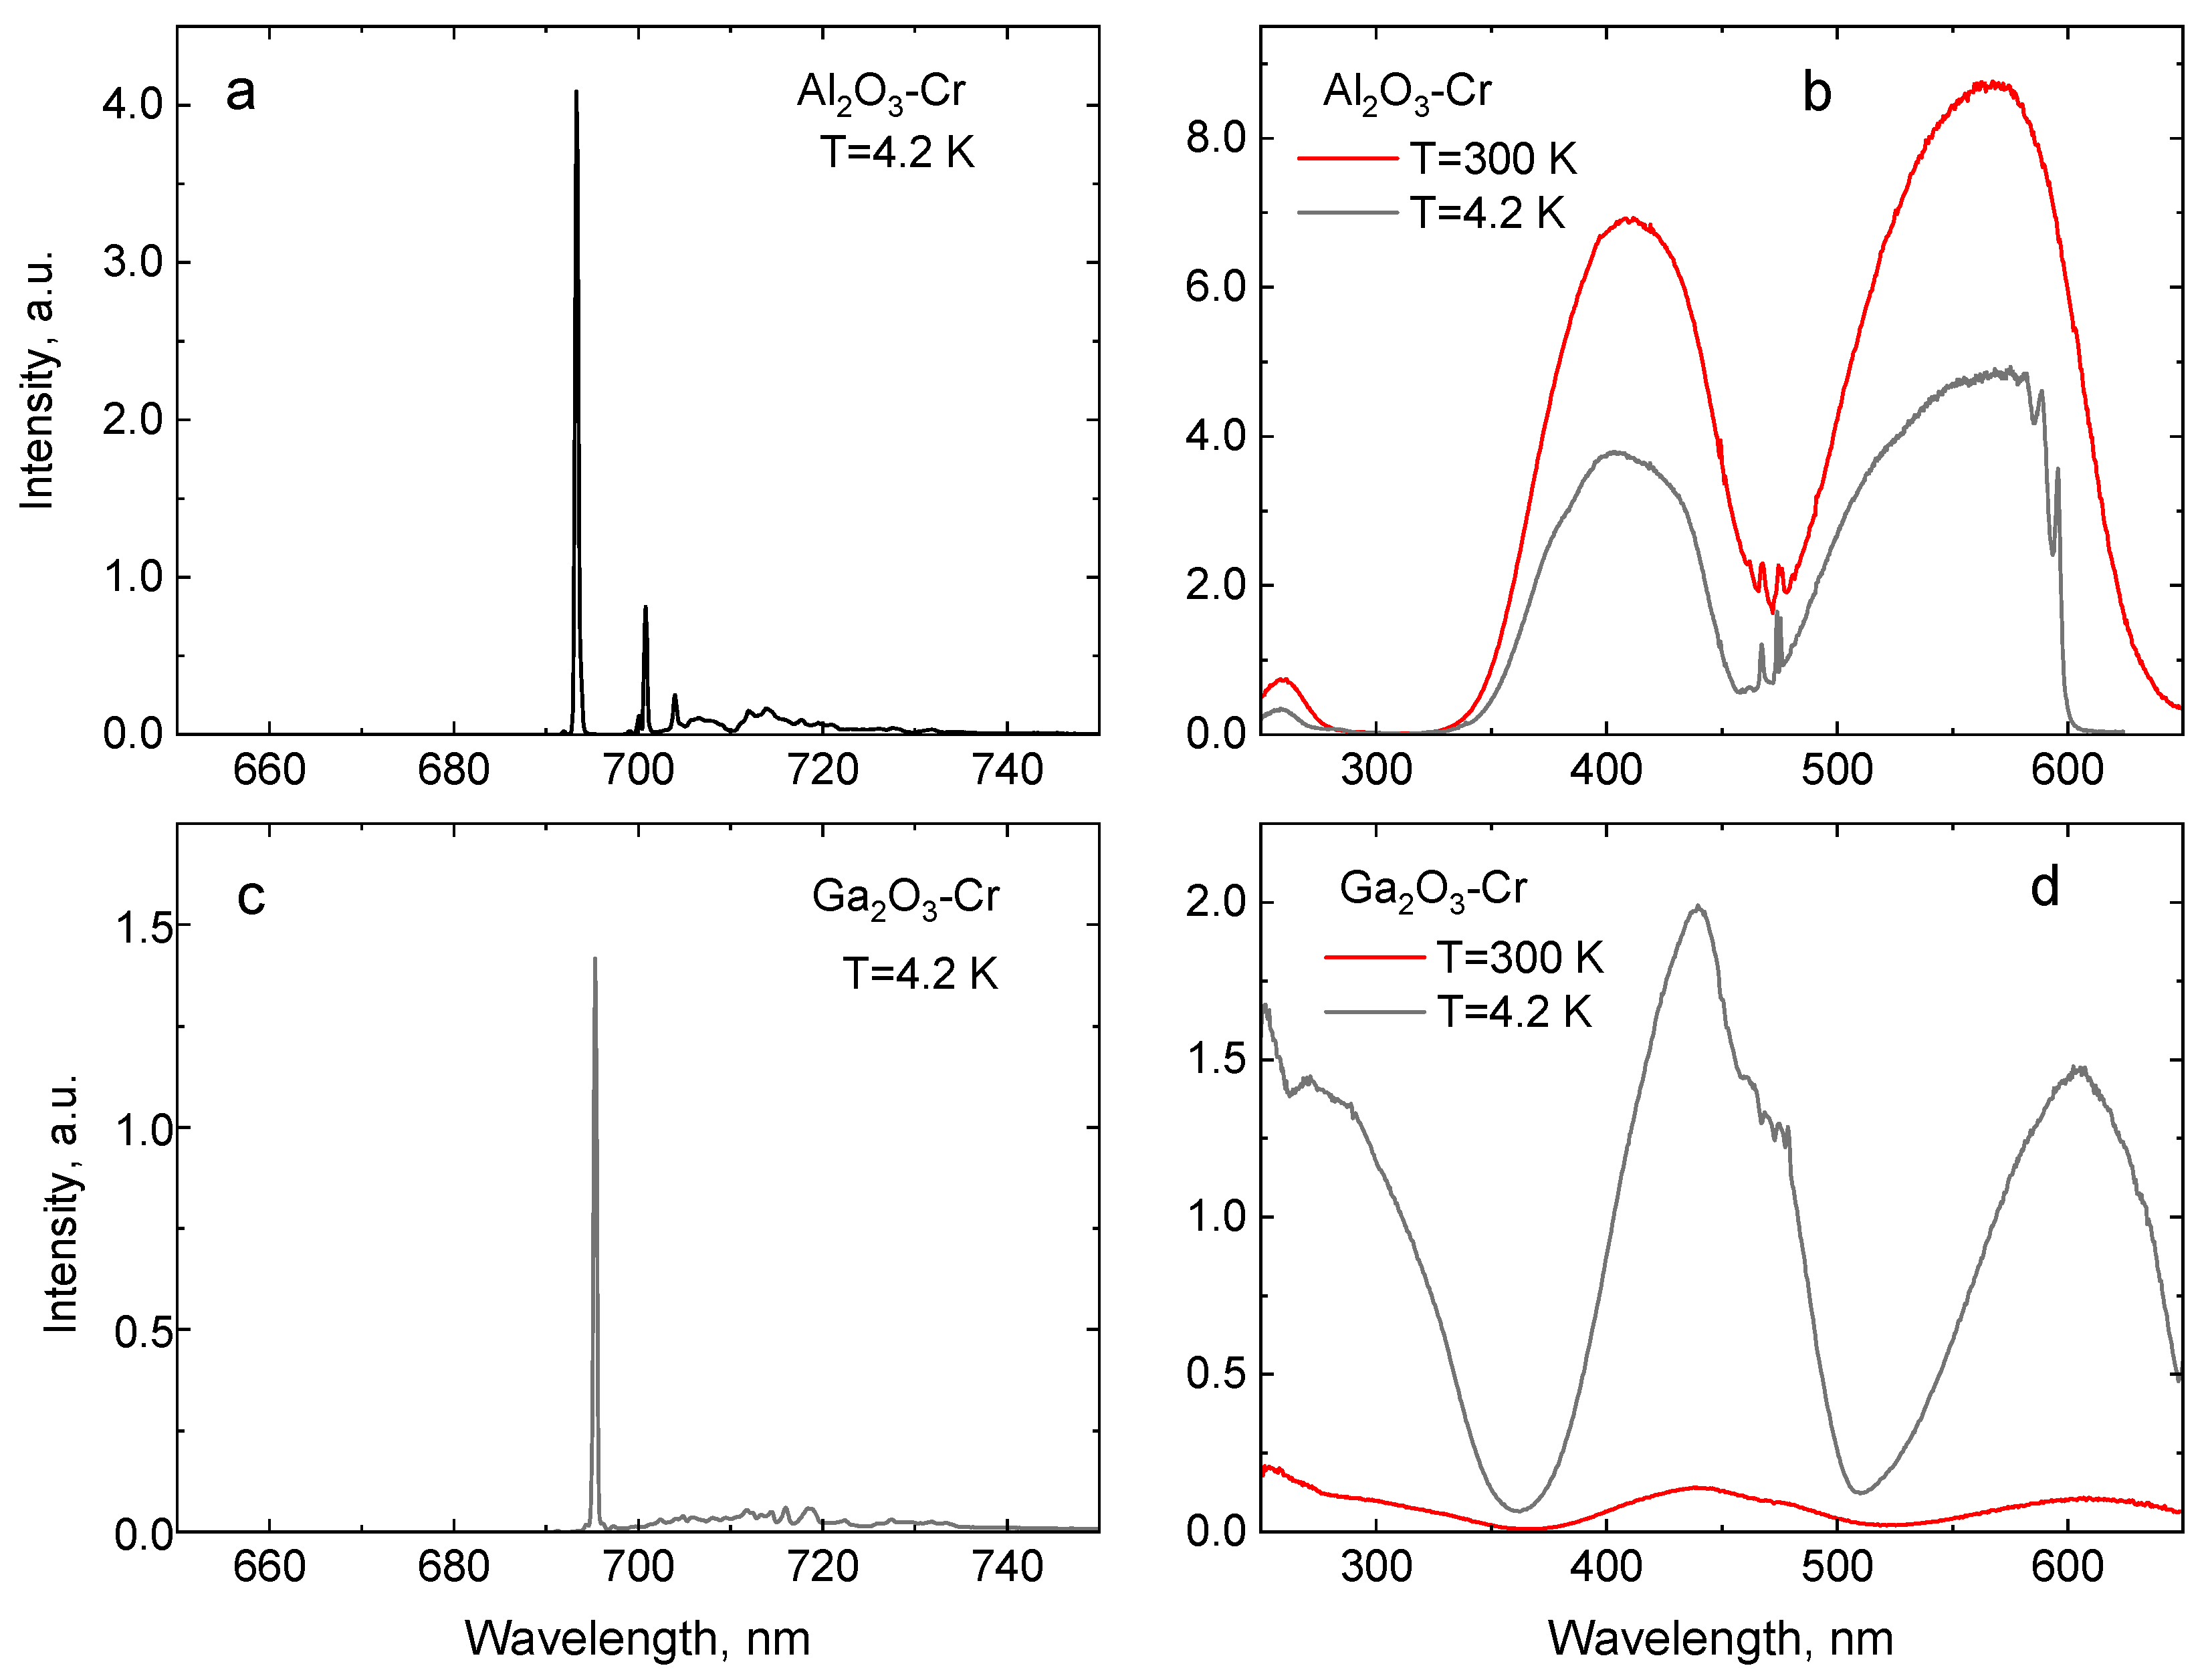
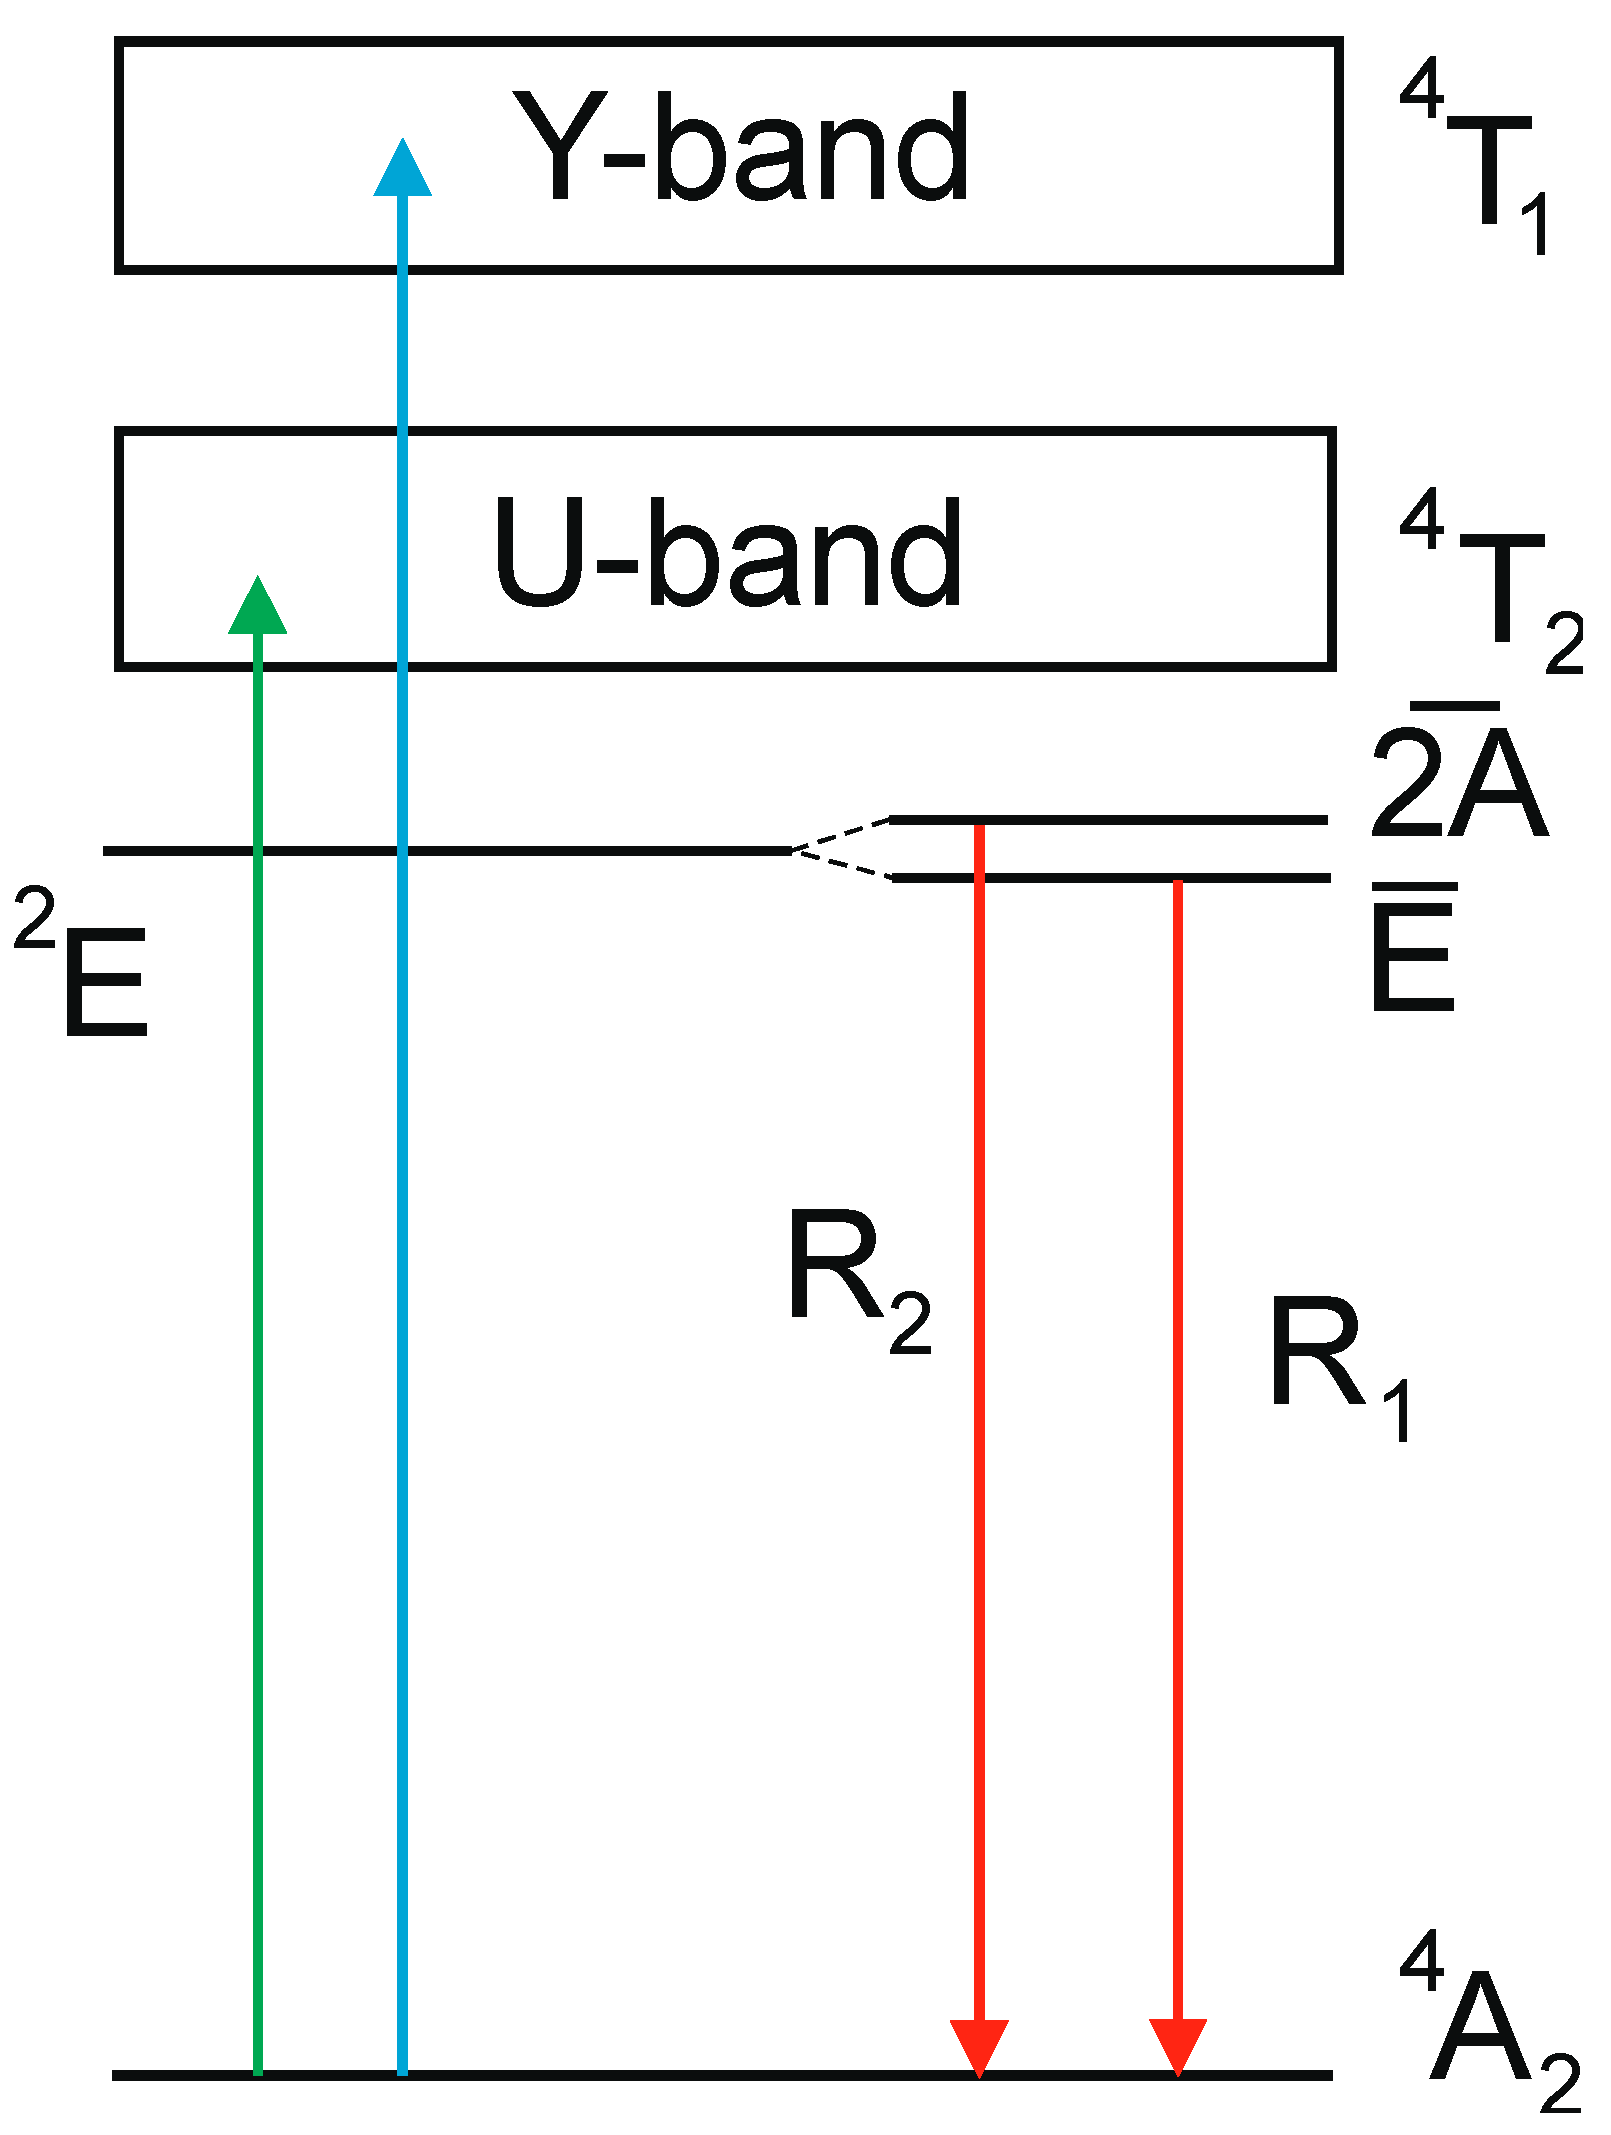
Figure 1. Luminescence (a,c) and luminescence excitation spectra (b,d) of Al2O3-Cr and Ga2O3-Cr crystals.
Sensors 20 05259 g001
Figure 2. Luminescence (a,c) and luminescence excitation spectra (b,d) of YAlO3-Cr and Y3Al5O12-Cr.
Sensors 20 05259 g002
Figure 3. Simplified diagram of energy levels of Cr3+ ion in oxide crystals. Vertical arrows show excitation and emission transitions.
Sensors 20 05259 g003
Figure 4. Variation of the luminescence spectra in the region of R-lines with temperature, measured in Cr-doped Al2O3 (a), Ga2O3 (b), YAlO3 (c), and Y3Al5O12 crystals (d). Temperature increment in the plots is 50 K.
Sensors 20 05259 g004
Figure 5. Temperature changes of the luminescence intensity ratio of R-lines ( F = I R 2 / I R 1 ) in Al2O3-Cr (a), Ga2O3-Cr (b), YAlO3-Cr, (c) and Y3Al5O12-Cr (d). The red lines show the best fit of experimental results (black dots) to Equation (1) using the parameters presented in Table 2.
Sensors 20 05259 g005
Figure 6. Positions of the R1- (red) and R2- (black) lines in Al2O3-Cr (a), Ga2O3-Cr (b), YAlO3-Cr (c), and Y3Al5O12-Cr (d) as a function of temperature. The dots are experimental data points and the curves show the best fit of experimental results for Equation (2), using parameters presented in Table 2.
Sensors 20 05259 g006
Figure 7. The luminescence decay curves of Cr3+ emissions in Al2O3-Cr (a), Ga2O3-Cr (b), YAlO3-Cr (c), and Y3Al5O12-Cr (d).
Sensors 20 05259 g007
Figure 8. Temperature dependence of the luminescence decay time constant of Cr3+ emission in Al2O3-Cr (a), Ga2O3-Cr (b), YAlO3-Cr (c), and Y3Al5O12-Cr (d). The curves show the best fit of Equation (5) to the experimental results with the fit parameters presented in Table 4.
Sensors 20 05259 g008
Figure 9. The temperature resolution of Al2O3-Cr (1, black), Ga2O3-Cr (2, green), YAlO3-Cr (3, red), and Y3Al5O12 (4, blue) for different modes of temperature sensing: (a)—luminescence intensity ratio, (b)—wavelength shift, (c)—decay time constant, where the curves are calculated using the fitted τ = f ( T ) dependence and measurement uncertainties.
Sensors 20 05259 g009
Table 1. Position of the main Cr3+ emission peaks and excitation bands in the measured crystals at 4 K.
Crystal Band Gap, eV E ¯ 4 A 2 ( R 1 - Line ) ,   nm 2 A ¯ 4 A 2 ( R 2 - Line ) ,   nm R1-R2 Gap, meV4A24T1g (Y-BAND), nm4A24T2g (U-Band), nm2E-4T2g Gap, meV
Al2O3 9.4693.3692.73.6411568290
Ga2O3 4.85 695.3689.718.244160880
YAlO3 8.5723.9723.05.9422564380
Y3Al5O127.1687.7688.92.4434601135
Table 2. Parameters of fits obtained from the temperature dependence of the luminescence intensity ratio, Equation (1), for Cr-doped oxides investigated in this work.
ParameterAl2O3-CrGa2O3-CrYAlO3-CrY3Al5O12-Cr
A0.809 ± 0.0045.39 ± 0.191.019 ± 0.0040.814 ± 0.008
D, meV3.36 ± 0.0428.4 ± 0.65.8 ± 0.12.8 ± 0.1
Table 3. Parameters of fits obtained from the temperature dependence of the luminescence wavelength shift in Equation (3) for Cr-doped oxides investigated in this work.
ParameterAl2O3-CrGa2O3-CrYAlO3-CrY3Al5O12-Cr
α R 1 , cm−1−518.0 −534.2−284.5−570.7
α R 2 , cm−1−507.5−582.8−317.8−581.1
TD, K867682541739
Table 4. Parameters of fits obtained from the temperature dependence of the luminescence decay time constant (Equation (5)) for Cr-doped oxides.
ParameterAl2O3-CrGa2O3-CrYAlO3-CrY3Al5O12-Cr
τ 1, ms3.98 ± 0.013.09 ± 0.0152.6 ± 0.28.94 ± 0.03
τ 2, ms4.46 ± 0.011.02 ± 0.0455.4 ± 1.09.04 ± 0.08
Ep, meV 60.9 ± 0.4 35.7 ± 0.3 41.4 ± 0.6 32.6 ± 0.3
D *, meV3.618.25.92.4
τ 3, μs33 ± 2530.1 ± 1.4263 ± 2832.6 ± 0.3
ΔE, meV237 ± 2383 ± 1279 ± 36138 ± 0.7
* The value of D is fixed to be equal to the energy splitting of the 2E level.

