Intrinsic Spectral Resolution Limitations of QEPAS Sensors for Fast and Broad Wavelength Tuning

 ,
, 
Abstract
1. Introduction
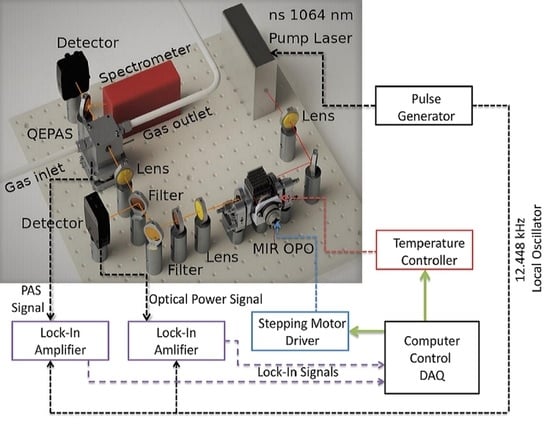
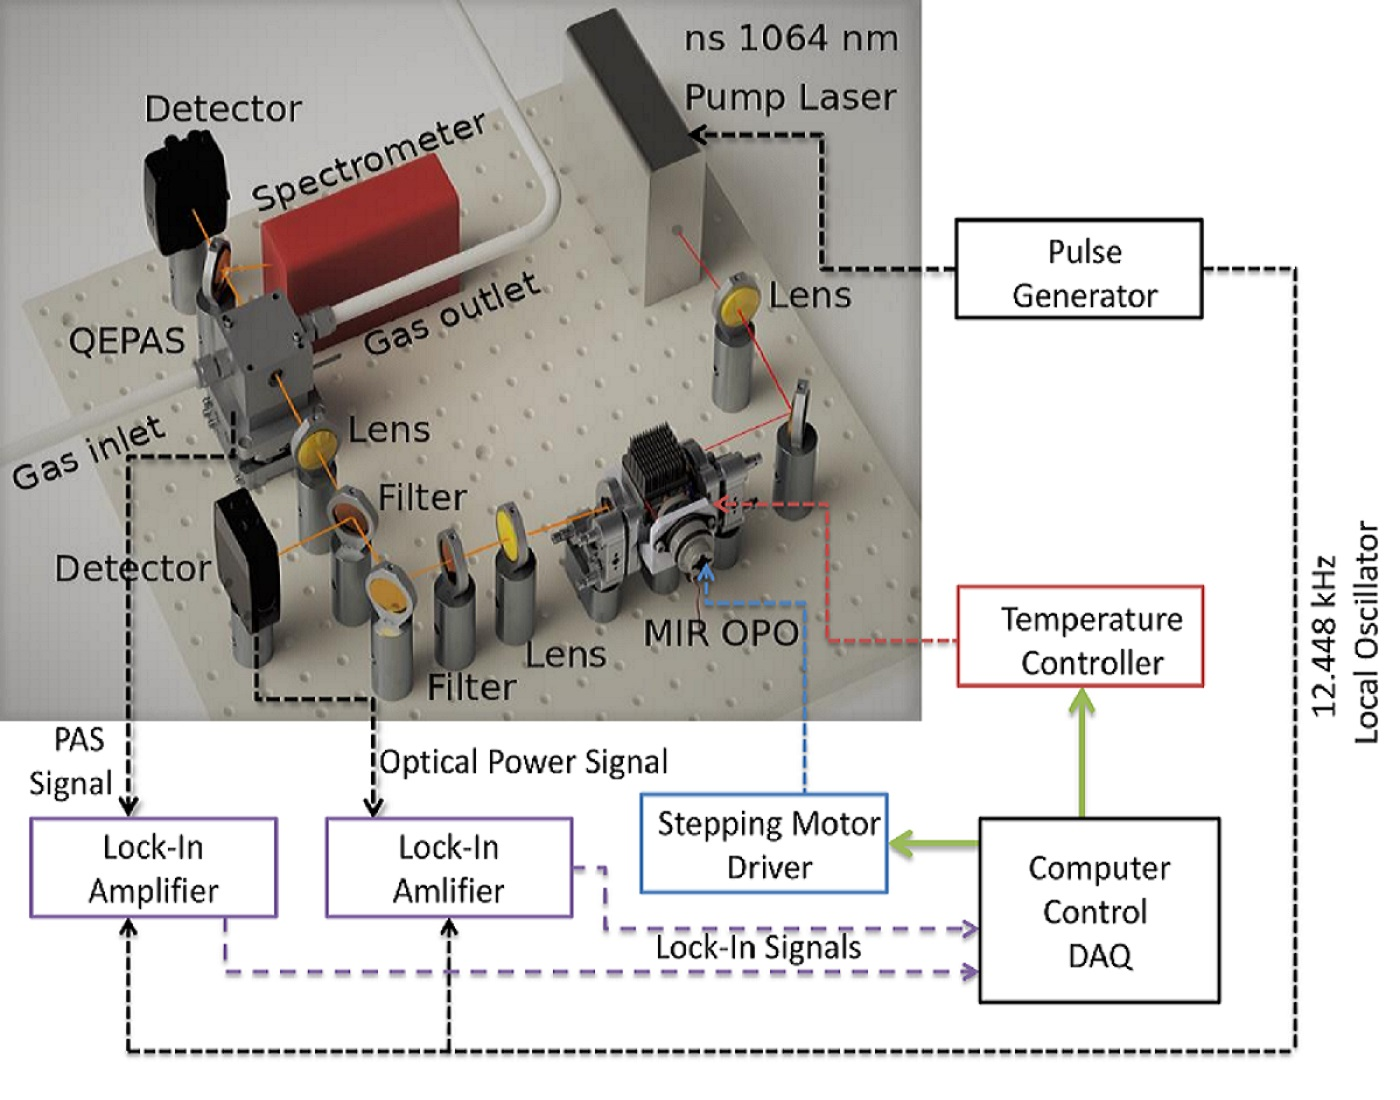
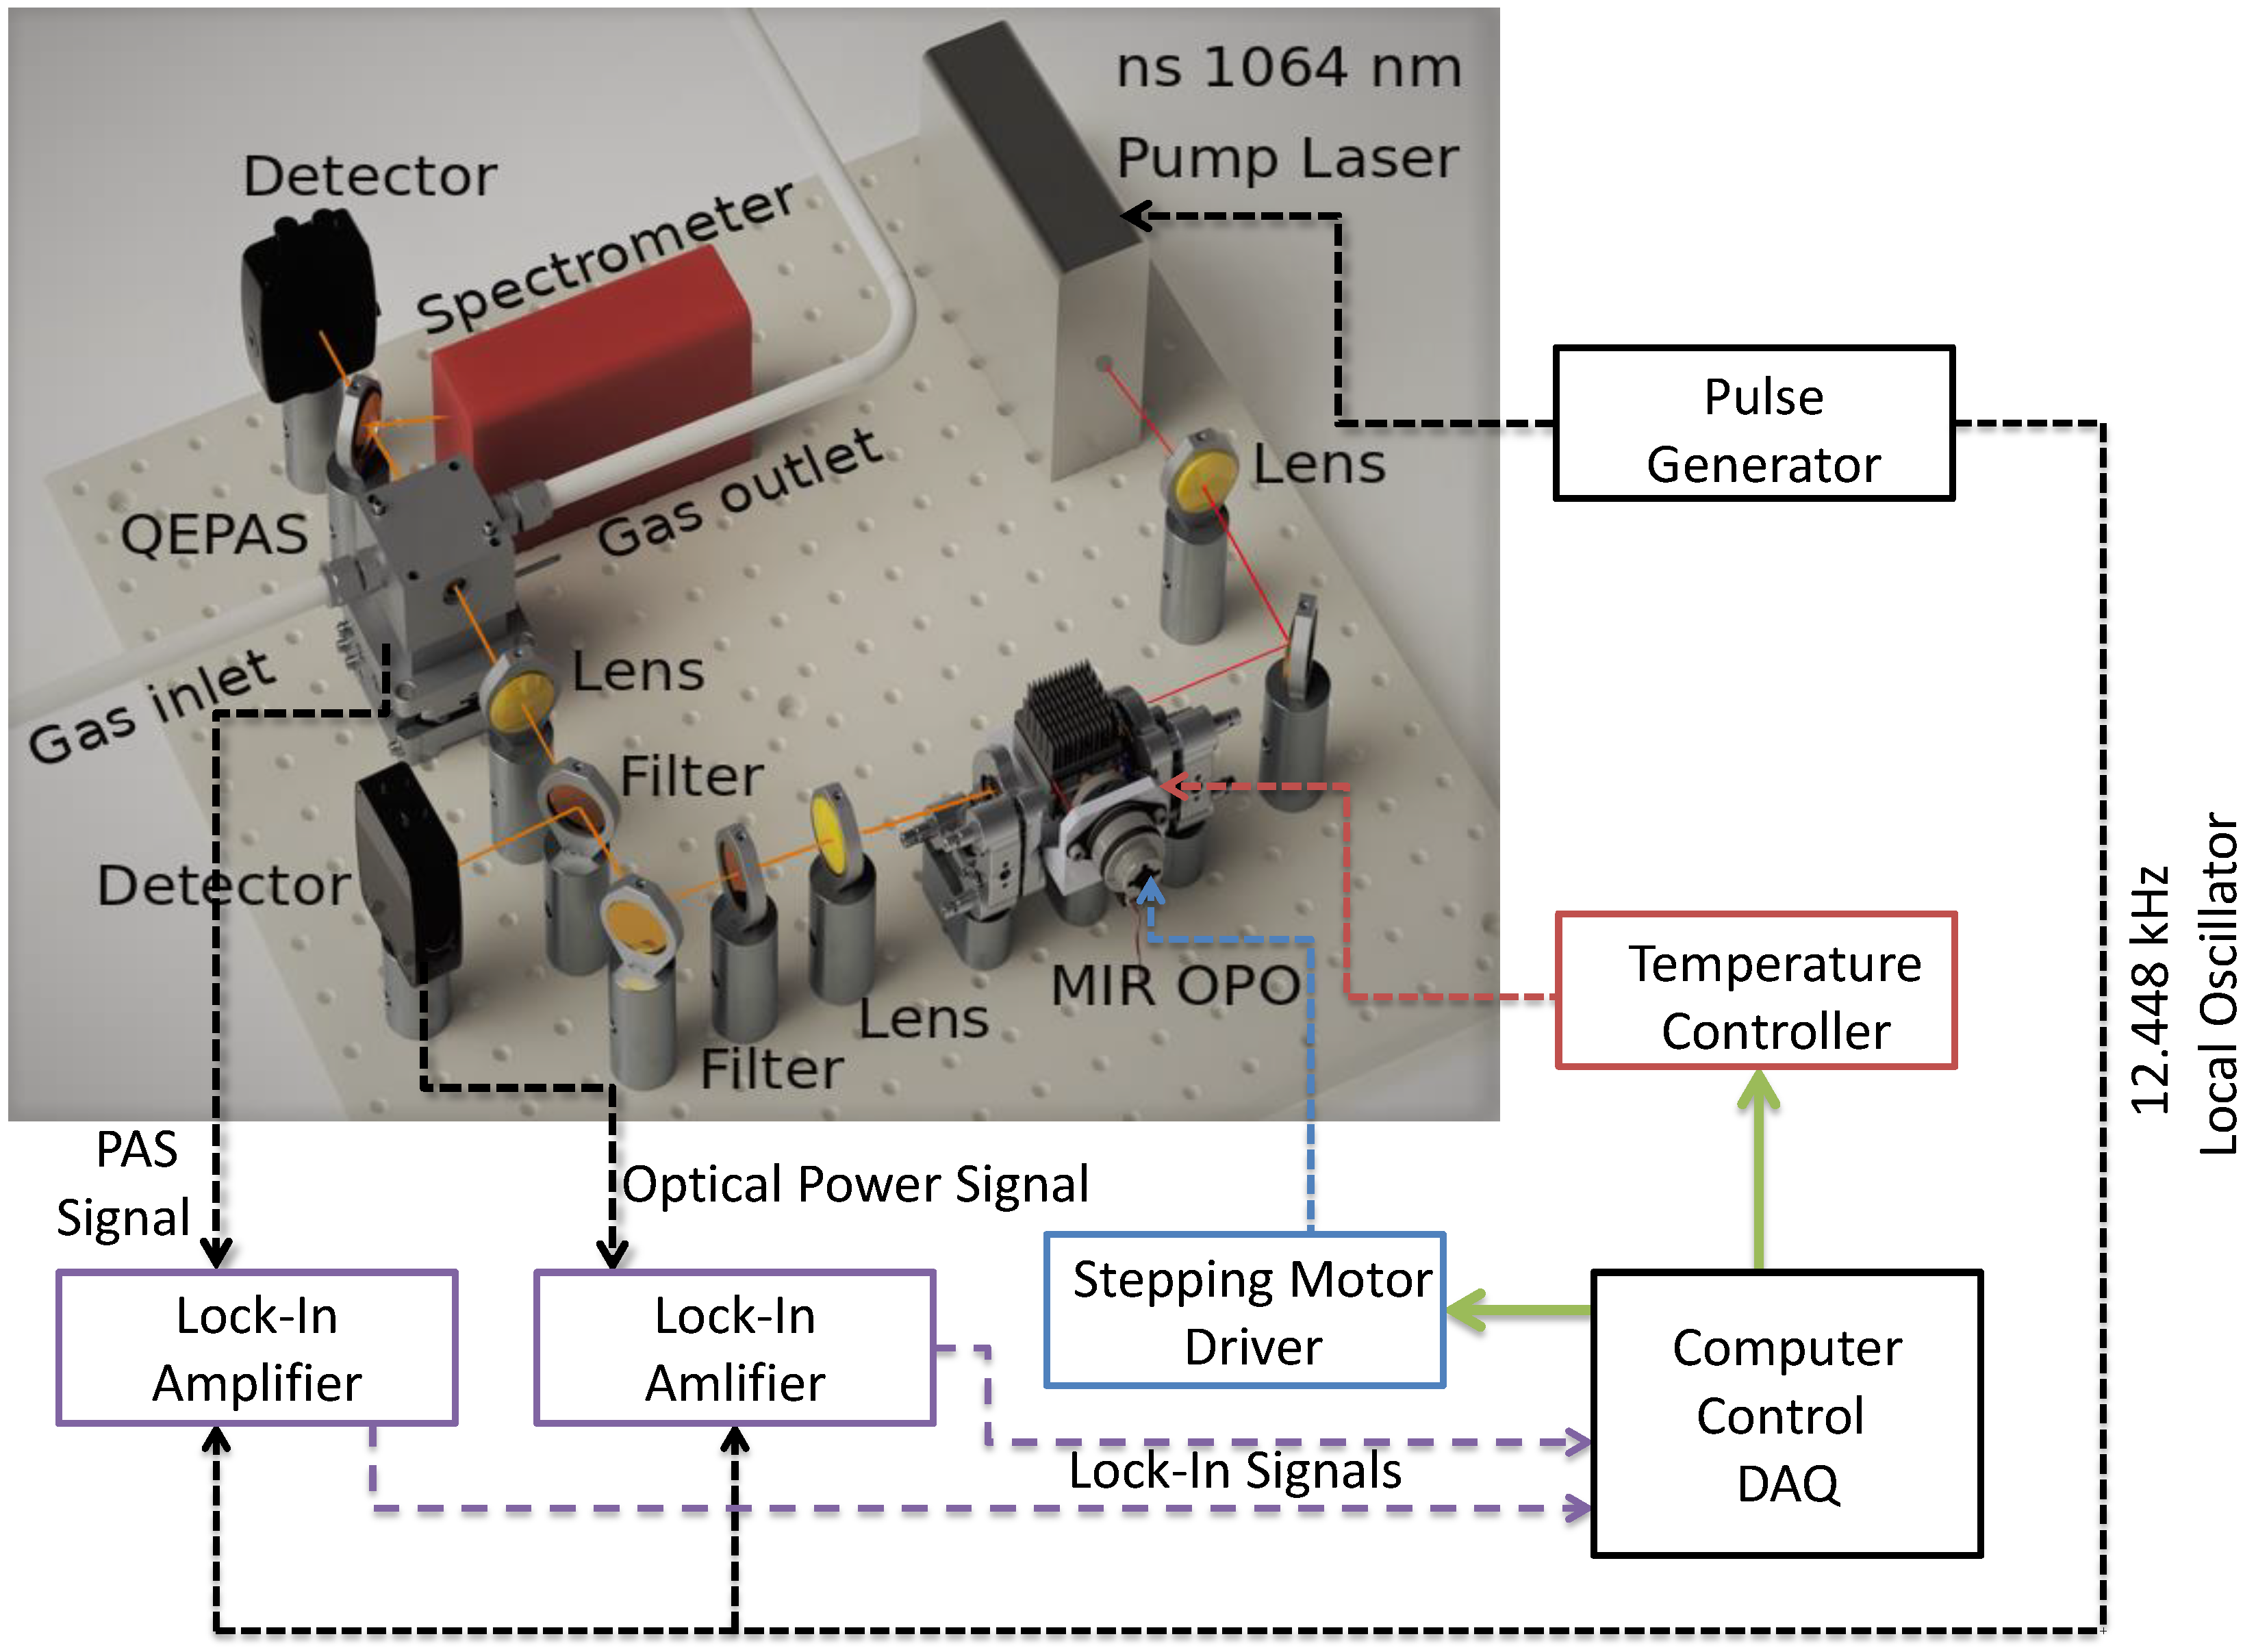
2. Experimental Setup
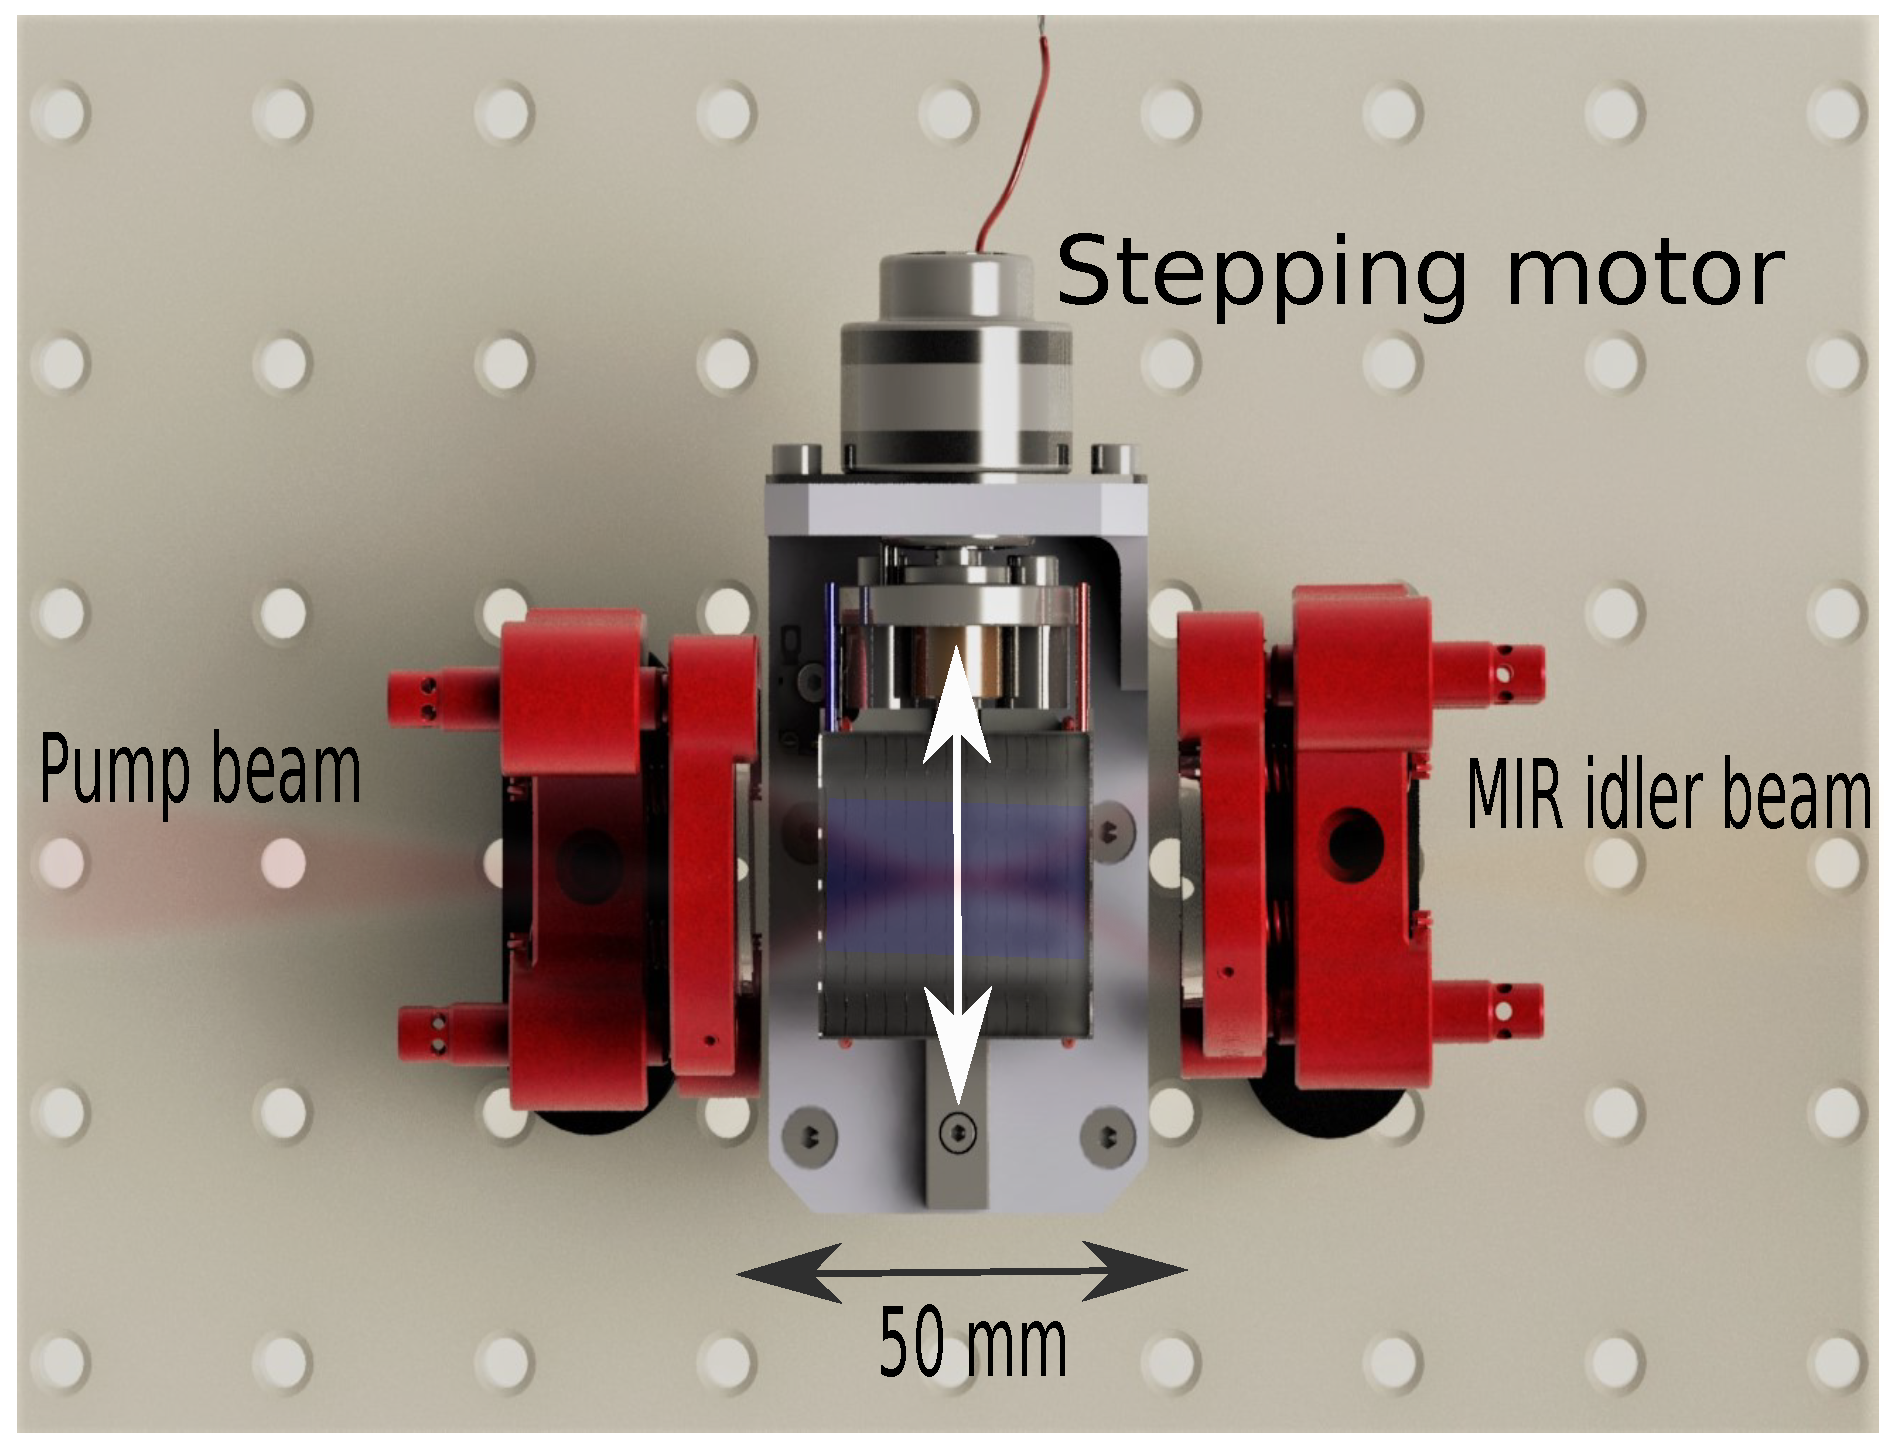
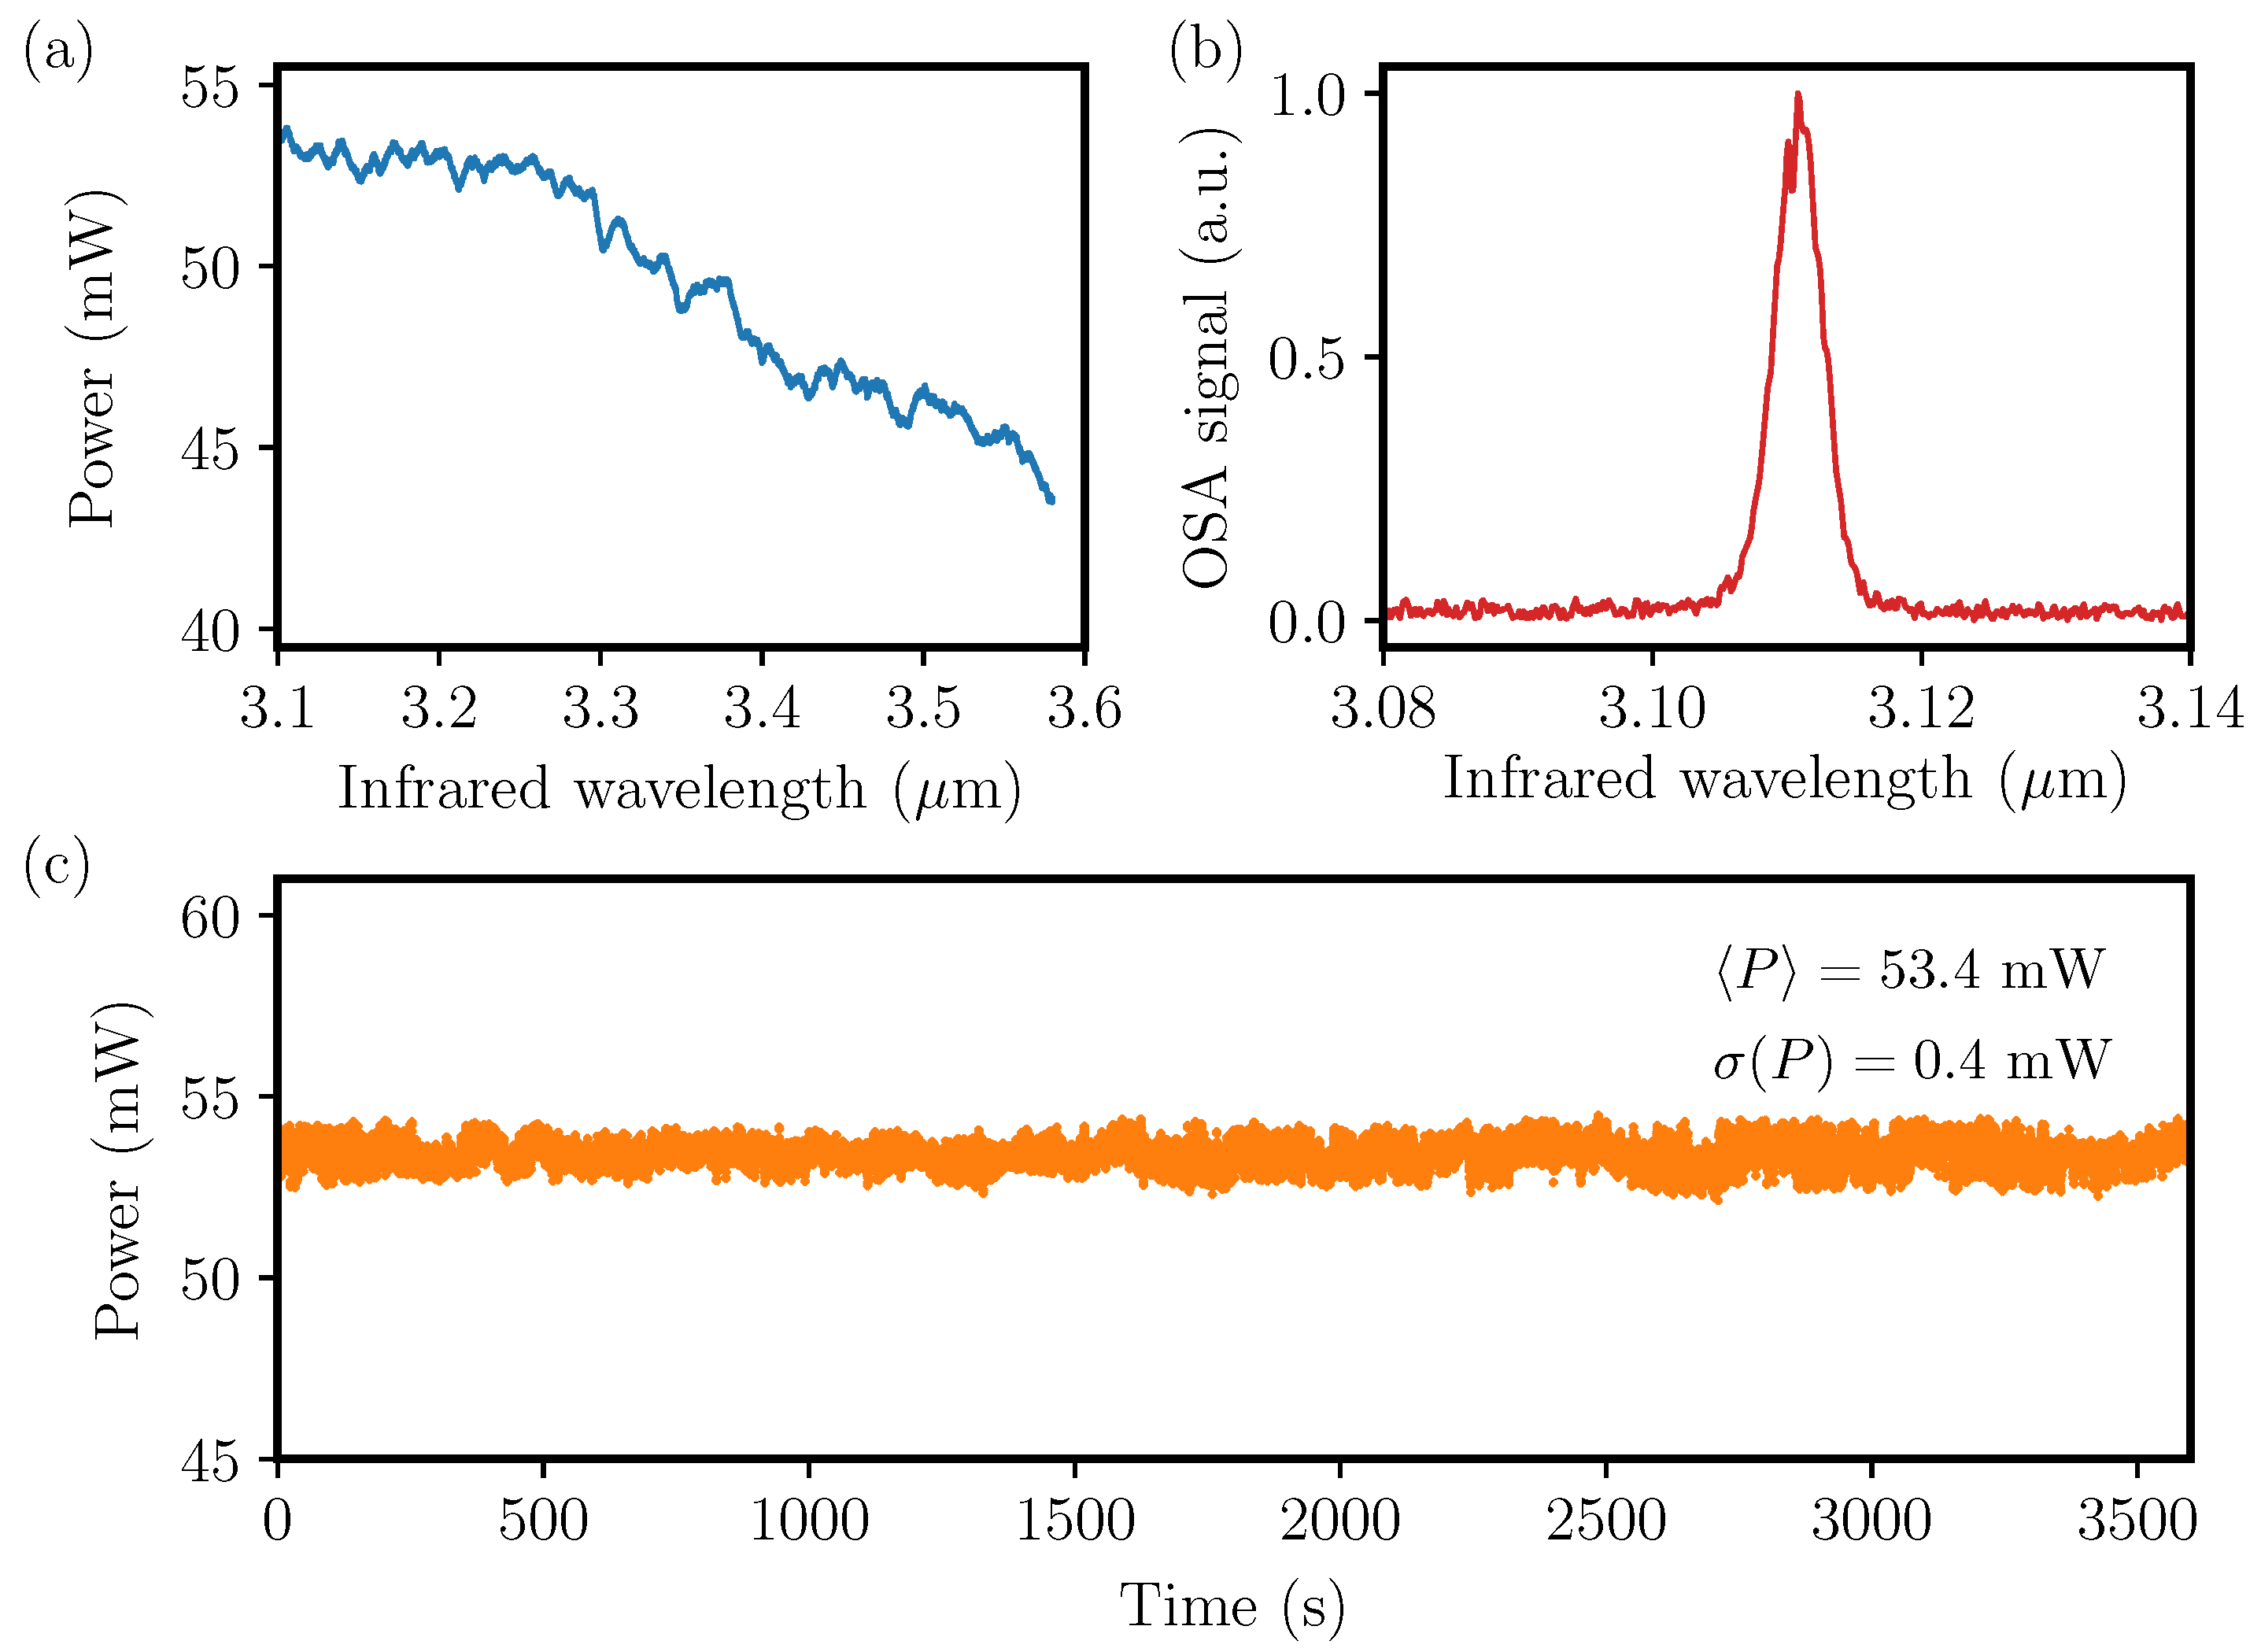
2.1. The MIR OPO
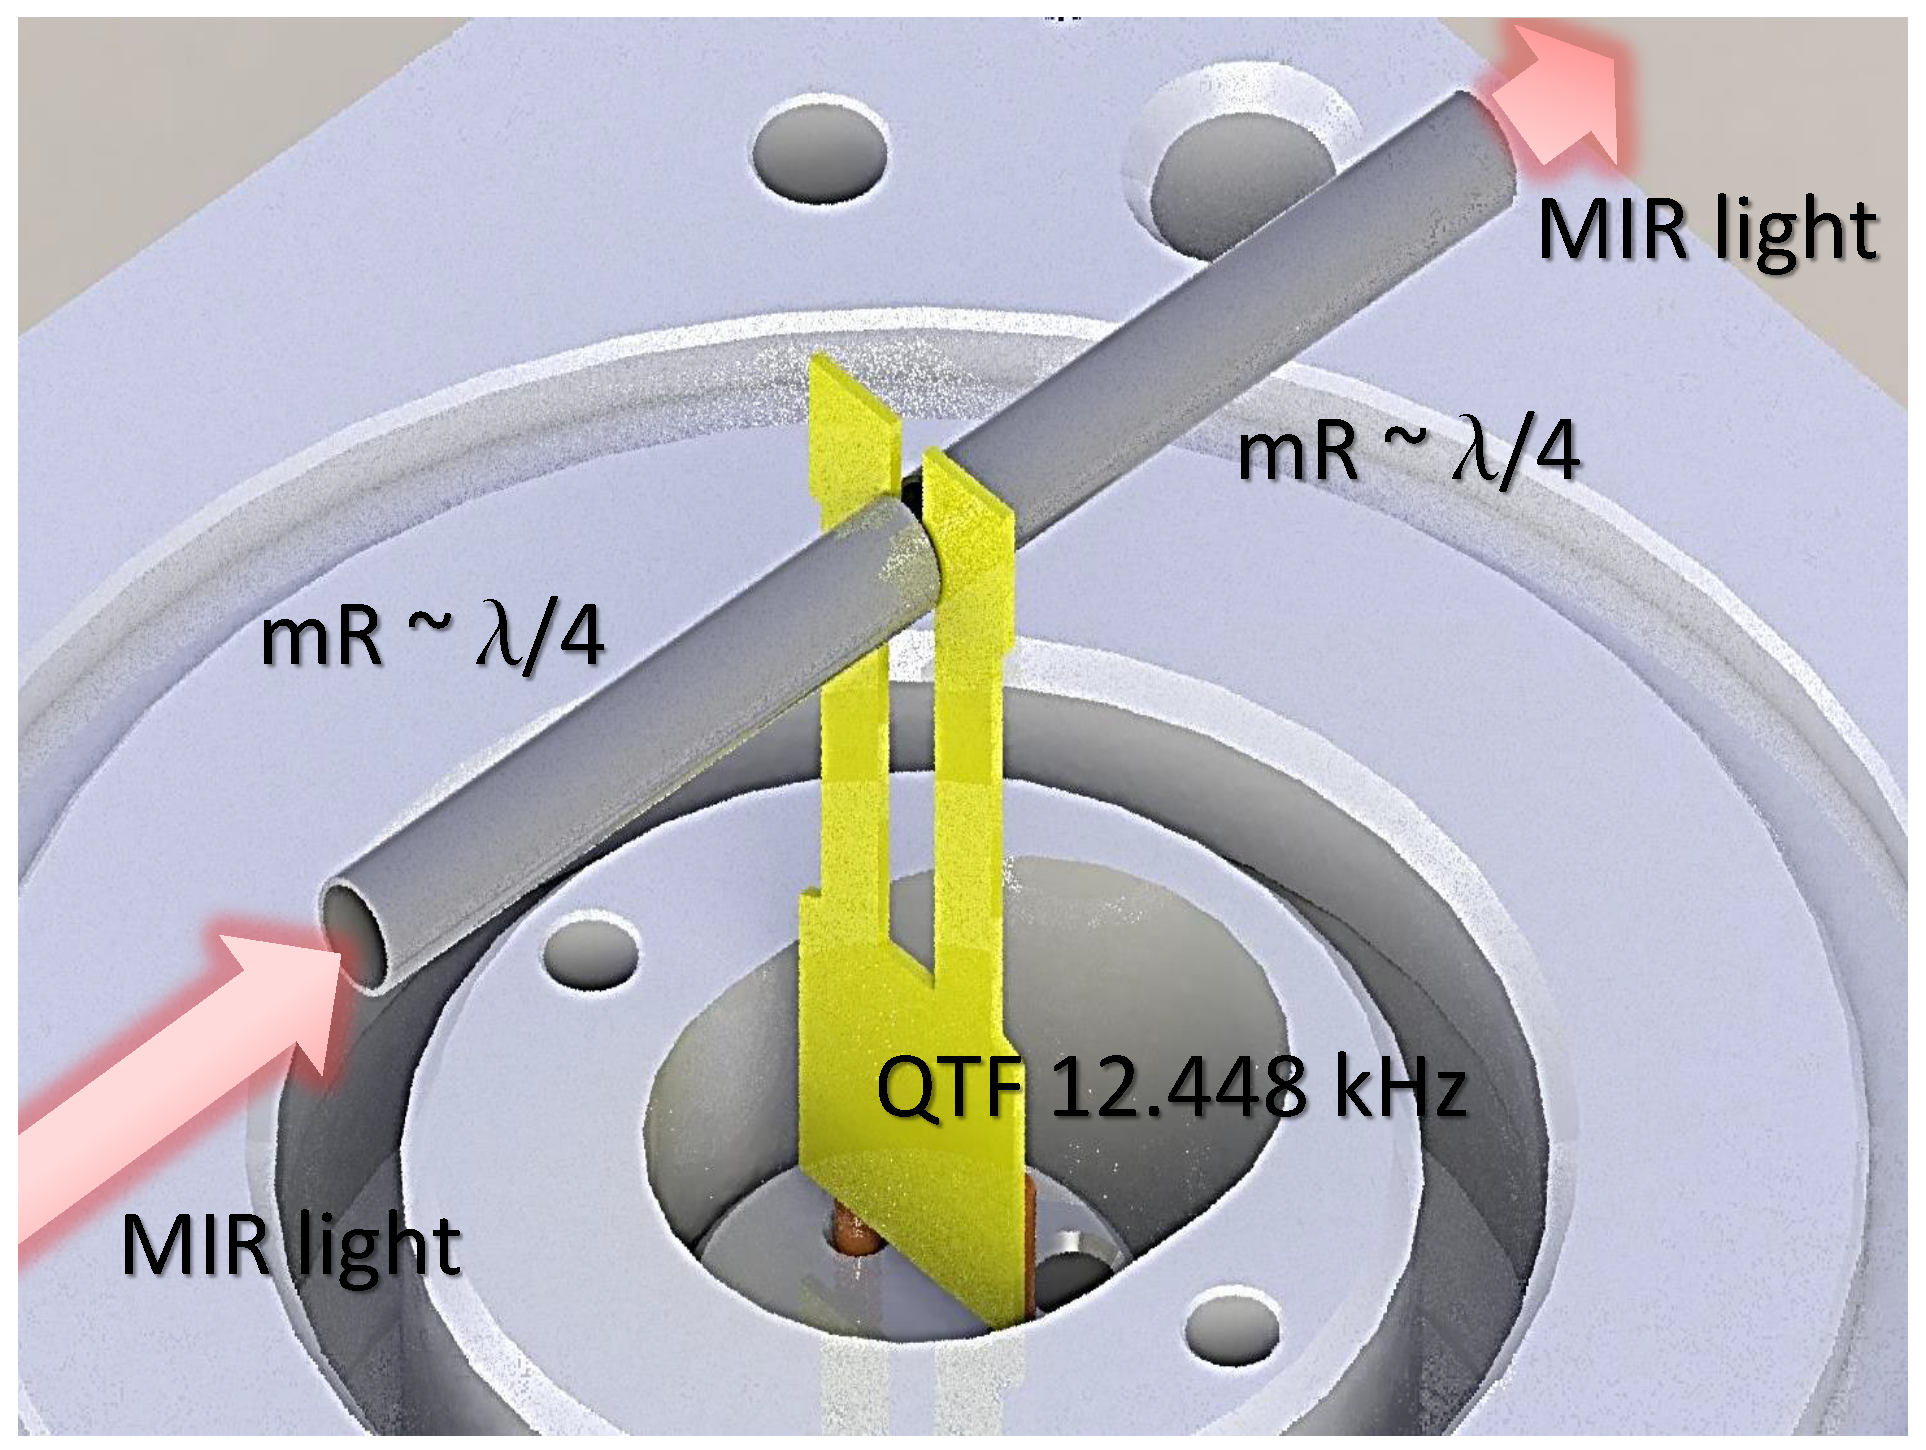
2.2. The QEPAS Cell
3. Results
3.1. Slow Wavelength Sweep
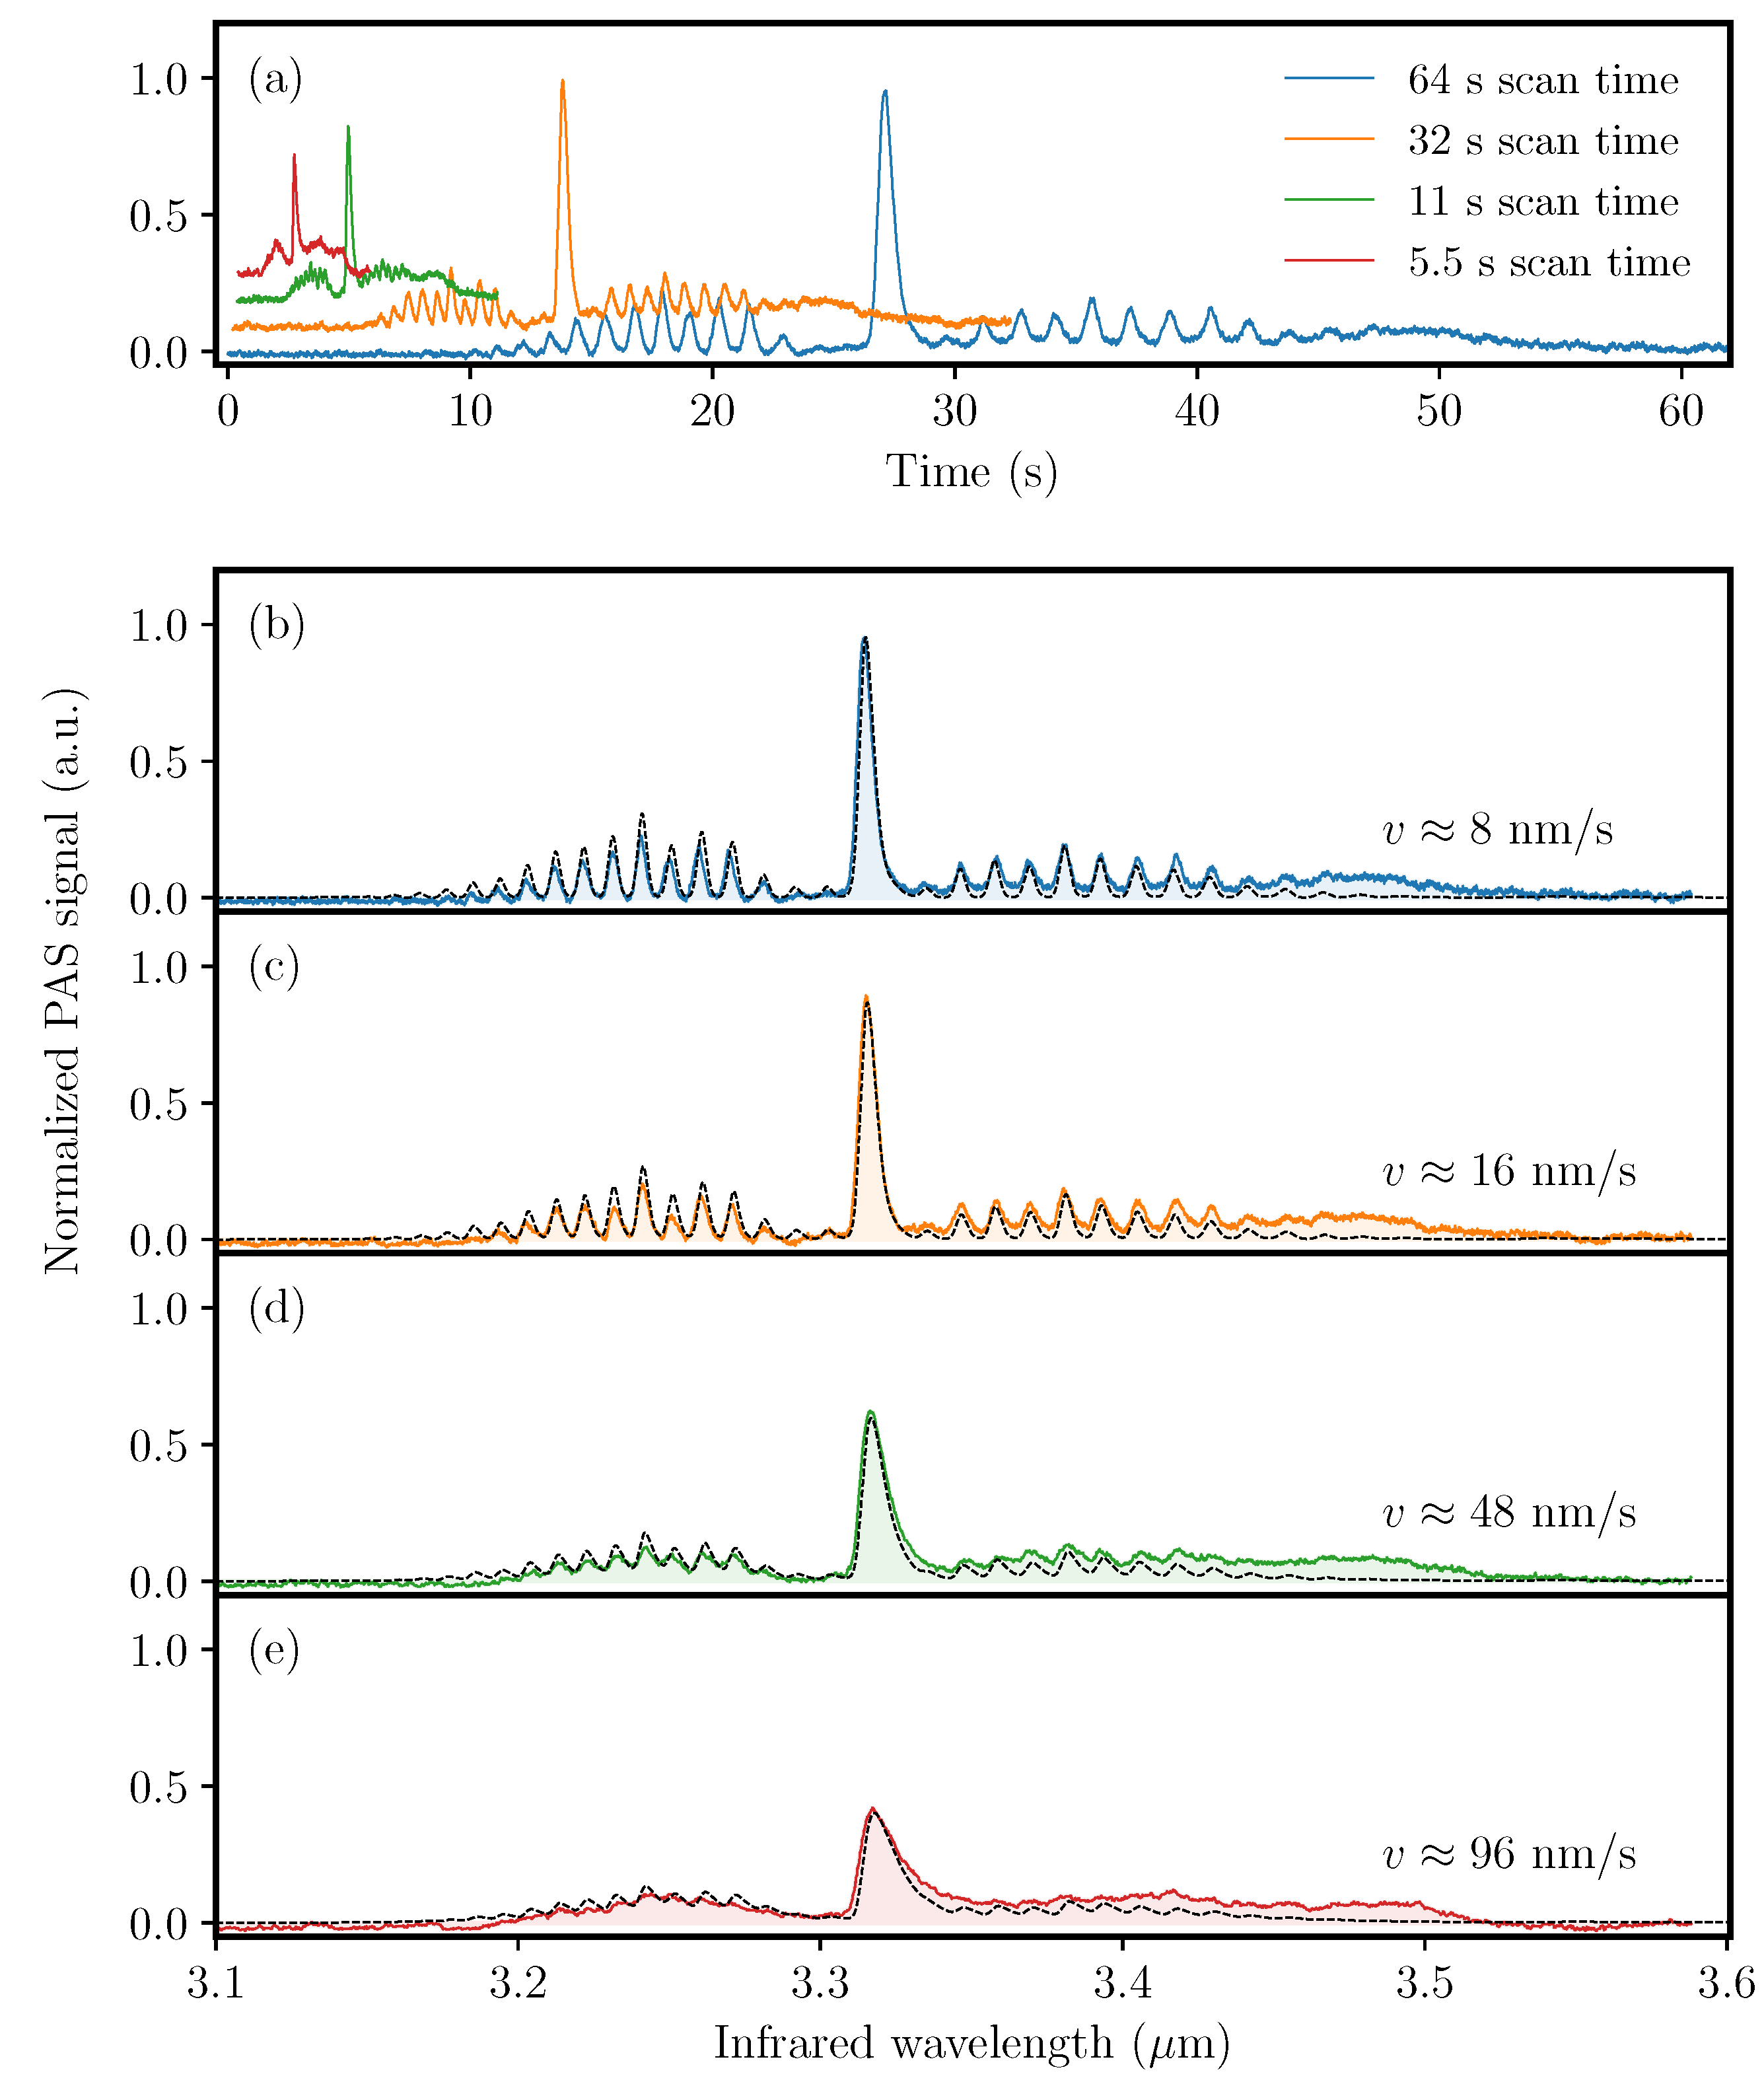
3.2. Fast Wavelength Sweep
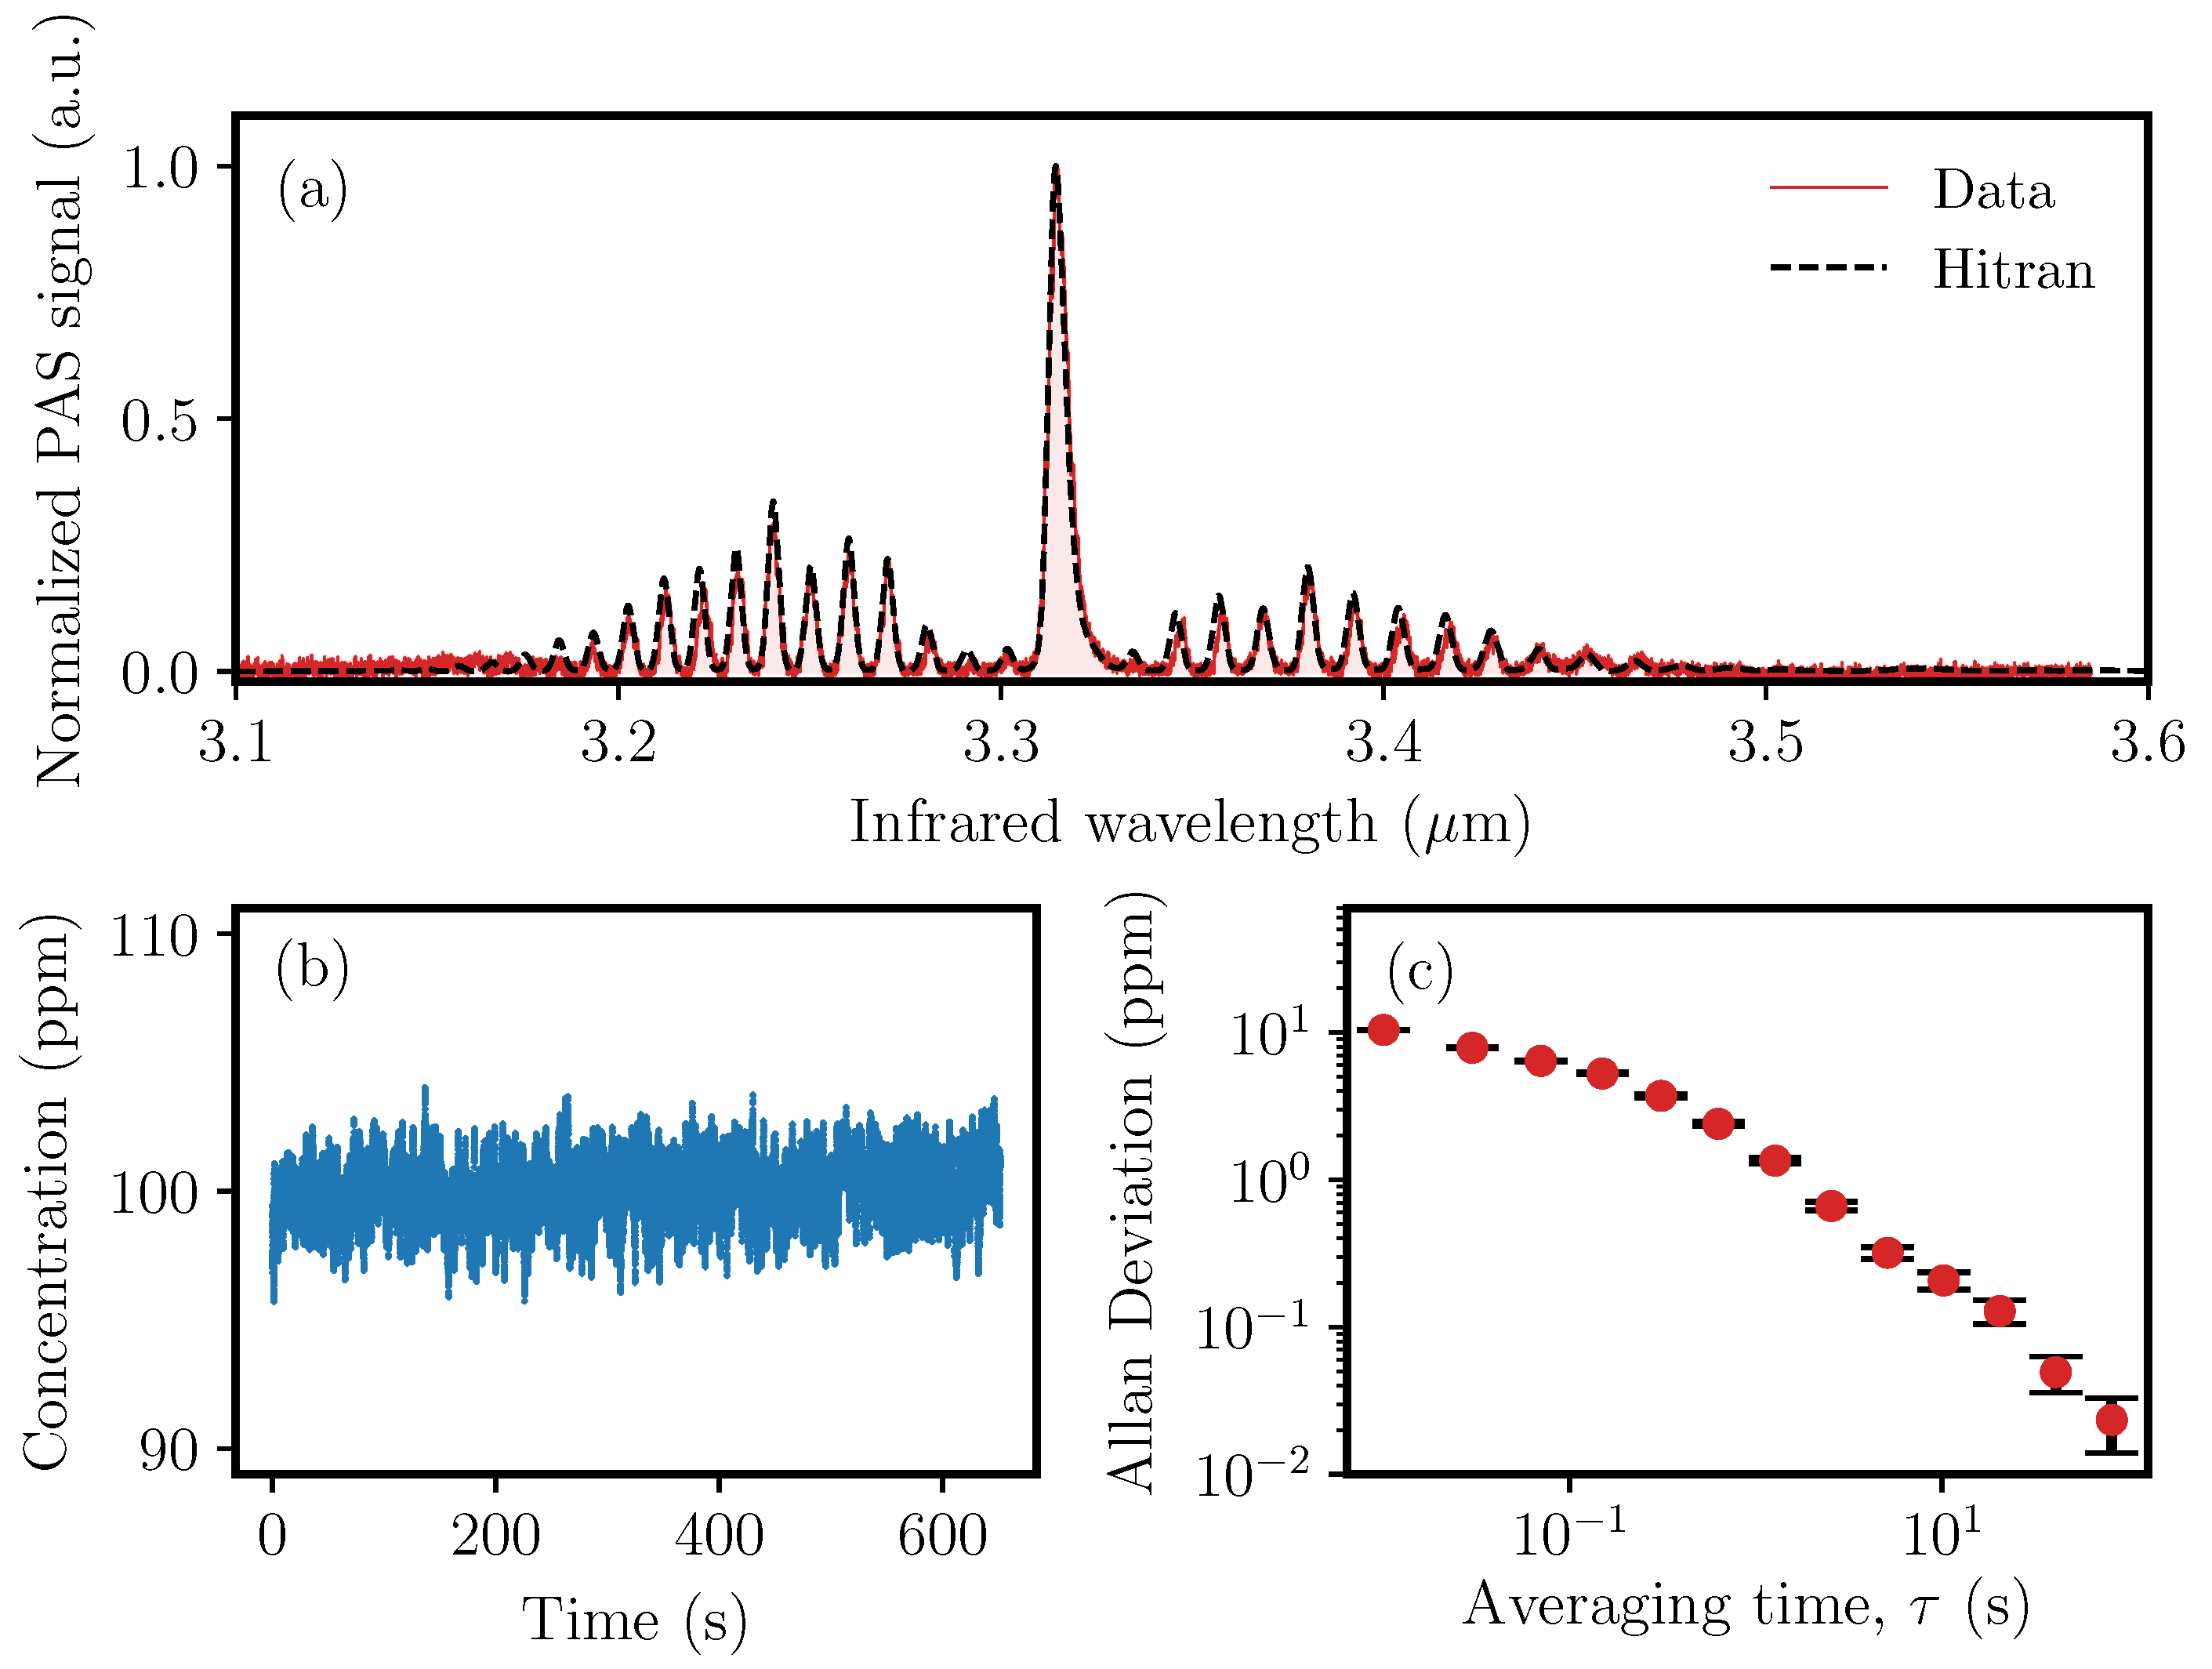
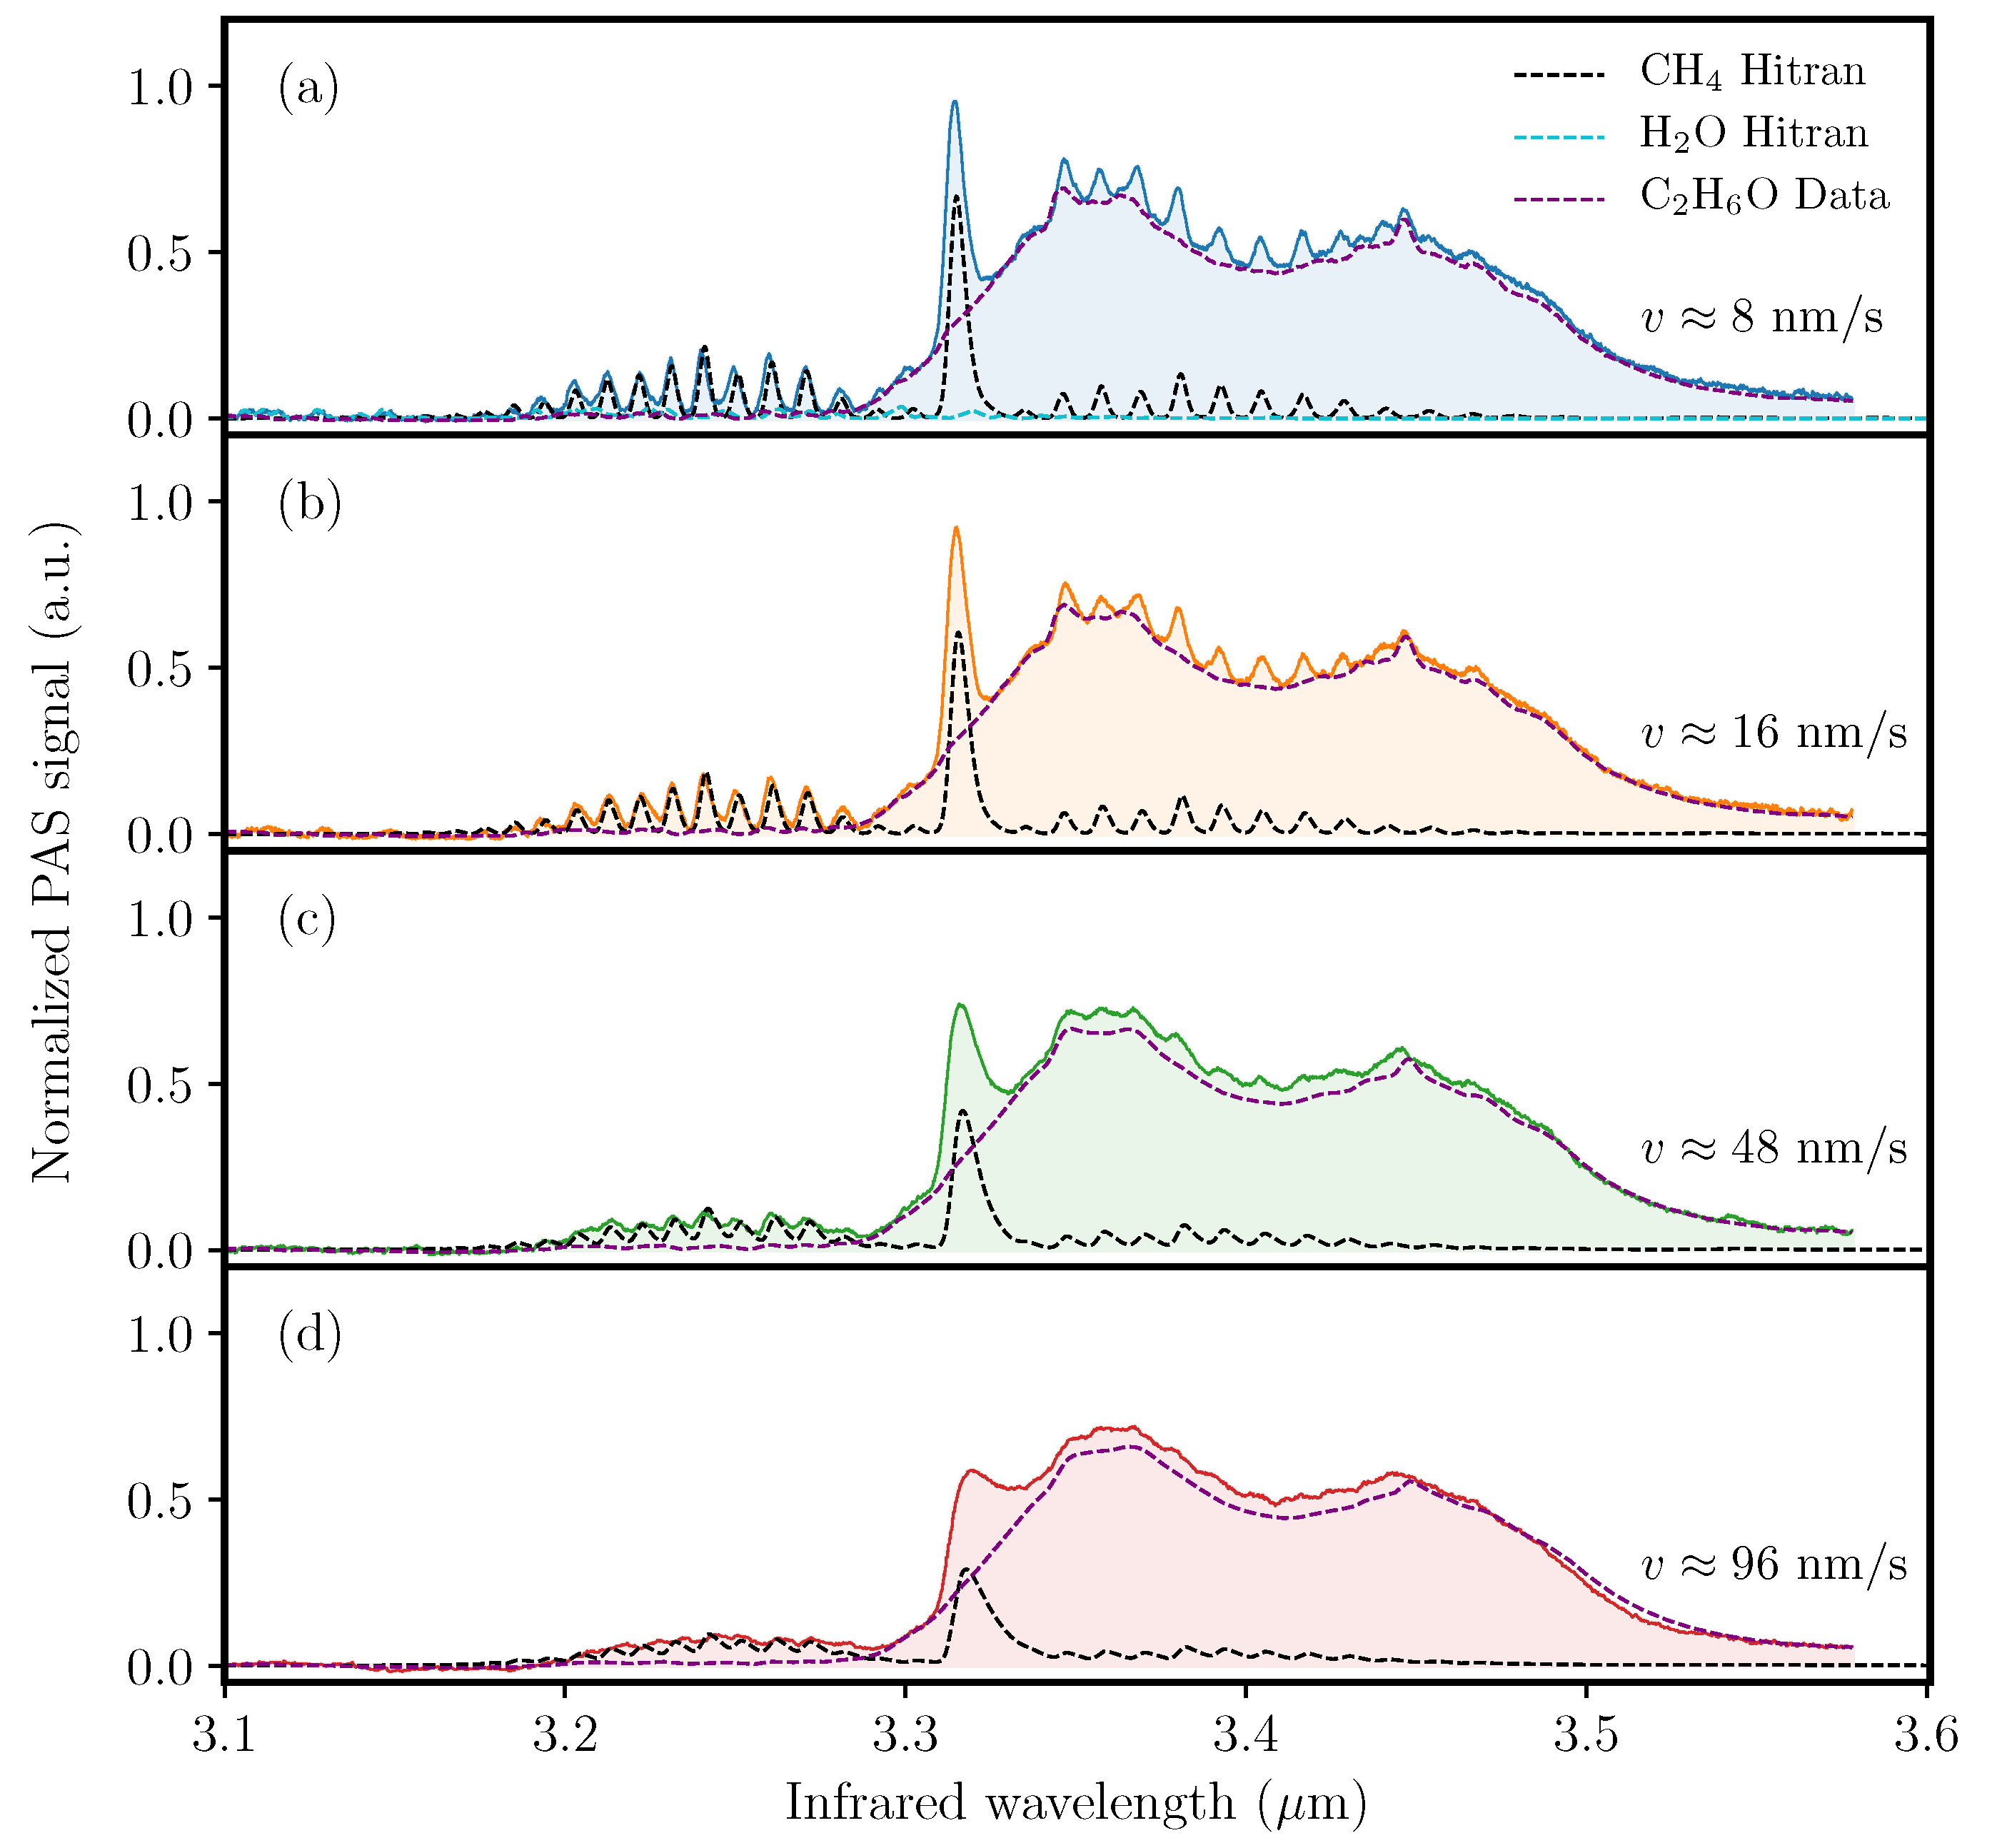
3.3. Investigation of a Gas Mixture: CH, CHO, and HO in N
4. Discussion
Author Contributions
Funding
Conflicts of Interest
Abbreviations
| MIR | Mid-infrared |
| NNEA | Normalized noise equivalent absorption |
| OPO | Optical parametric oscillator |
| PA | Photoacoustic |
| PAS | Photoacoustic spectroscopy |
| QEPAS | Quartz-enhanced photoacoustic spectroscopy |
| QTF | Quartz tuning fork |
References
- Hodgkinson, J.; Tatam, R.P. Optical gas sensing: A review. Meas. Sci. Technol. 2013, 24, 012004. [Google Scholar] [CrossRef]
- Sigrist, M.W.; Bartlome, R.; Maronov, D.; Rey, J.M.; Vogler, D.E.; Wachter, H. Trace gas monitoring with infrared laser-based detection schemes. Appl. Phys. B 2008, 90, 289. [Google Scholar] [CrossRef]
- Webber, M.E.; Pushkarsky, M.; Patel, C.K.N. Fiber-amplifier-enhanced photoacoustic spectroscopy with near-infrared tunable diode lasers. Appl. Opt. 2003, 42, 2119–2126. [Google Scholar] [CrossRef] [PubMed]
- Dasa, M.K.; Nteroli, G.; Bowen, P.; Messa, G.; Feng, Y.; Petersen, C.R.; Koutsikou, S.; Bondu, M.; Moselund, P.M.; Podoleanu, A.; et al. All-fibre supercontinuum laser for in vivo multispectral photoacoustic microscopy of lipids in the extended near-infrared region. Photoacoustics 2020, 18, 100163. [Google Scholar] [CrossRef] [PubMed]
- Borri, S.; Patimisco, P.; Galli, I.; Mazzotti, D.; Giusfredi, G.; Akikusa, N.; Yamanishi, M.; Scamarcio, G.; De Natale, P.; Spagnolo, V. Intracavity quartz-enhanced photoacoustic sensor. Appl. Phys. Lett. 2014, 104, 091114. [Google Scholar] [CrossRef]
- Tomberg, T.; Hieta, T.; Vainio, M.; Halonen, L. Cavity-enhanced cantilever-enhanced photo-acoustic spectroscopy. Analyst 2019, 144, 2291–2296. [Google Scholar] [CrossRef]
- Tomberg, T.; Vainio, M.; Hieta, T.; Halonen, L. Sub-parts-per-trillion level sensitivity in trace gas detection by cantilever-enhanced photo-acoustic spectroscopy. Sci. Rep. 2018, 8, 1848. [Google Scholar] [CrossRef]
- Wildi, T.; Voumard, T.; Brasch, V.; Yilmaz, G.; Herr, T. Photo-acoustic dual-frequency comb spectroscopy. arXiv 2020, arXiv:2004.04691. [Google Scholar] [CrossRef]
- Lassen, M.; Brusch, A.; Balslev-Harder, D.; Petersen, J.C. Phase-sensitive noise suppression in a photoacoustic sensor based on acoustic circular membrane modes. Appl. Opt. 2015, 54, D38–D42. [Google Scholar] [CrossRef]
- Hirschmann, C.B.; Sinisalo, S.; Uotila, J.; Ojala, S.; Keiskia, R.L. Trace gas detection of benzene, toluene, p-, m- and o-xylene with a compact measurement system using cantilever enhanced photoacoustic spectroscopy and optical parametric oscillator. Vib. Spectrosc. 2013, 68, 170–176. [Google Scholar] [CrossRef]
- Zeninari, V.; Parvitte, B.; Courtois, D.; Kapitanov, V.A.; Ponomarev, Y.N. Methane detection on the sub-ppm level with a near-infrared diode laser photoacoustic sensor. Infrared Phys. Technol. 2003, 44, 253–261. [Google Scholar] [CrossRef]
- Li, S.; Dong, L.; Wu, H.; Sampaolo, A.; Patimisco, P.; Spagnolo, V.; Tittel, F.K. Ppb-level quartz-enhanced photoacoustic detection of carbon monoxide exploiting a surface grooved tuning fork. Anal. Chem. 2019, 91, 5834–5840. [Google Scholar] [CrossRef] [PubMed]
- Lassen, M.; Baslev-Harder, D.; Brusch, A.; Nielsen, O.S.; Heikens, D.; Persijn, S.; Petersen, J.C. Photo-acoustic sensor for detection of oil contamination in compressed air systems. Opt. Express 2017, 25, 1806–1814. [Google Scholar] [CrossRef] [PubMed]
- Wu, H.; Dong, L.; Yin, X.; Sampaolo, A.; Patimisco, P.; Ma, W.; Zhang, L.; Yin, W.; Xiao, L.; Spagnolo, V.; et al. Atmospheric CH4 measurement near a landfill using an ICL-based QEPAS sensor with V-T relaxation self-calibration. Sens. Actuators B Chem. 2019, 297, 126753. [Google Scholar] [CrossRef]
- Miklós, A.; Hess, P.; Bozóki, Z. Application of acoustic resonators in photoacoustic trace gas analysis and metrology. Rev. Sci. Instrum. 2001, 72, 1937–1955. [Google Scholar] [CrossRef]
- Kosterev, A.A.; Bakhirkin, Y.A.; Curl, R.F.; Tittel, F.K. Quartz-enhanced photoacoustic spectroscopy. Opt. Lett. 2002, 27, 1902–1904. [Google Scholar] [CrossRef]
- Patimisco, P.; Scamarcio, G.; Tittel, F.K.; Spagnolo, V. Quartz-Enhanced Photoacoustic Spectroscopy: A Review. Sensors 2014, 14, 6165–6206. [Google Scholar] [CrossRef]
- Bell, A.G. Upon the Production of Sound by Radiant Energy; Gibson Brothers, Printers: Washington, DC, USA, 1881. [Google Scholar]
- Rosencwaig, A. Photoacoustics and Photoacoustic Spectroscopy; John Wiley & Sons Inc.: Hoboken, NJ, USA, 1980. [Google Scholar]
- Manohar, S.; Razansky, D. Photoacoustics: A historical review. Adv. Opt. Photon. 2016, 8, 586–617. [Google Scholar] [CrossRef]
- Friedt, J.M.; Carry, E. Introduction to the quartz tuning fork. Am. J. Phys. 2007, 75, 415–422. [Google Scholar] [CrossRef]
- Patimisco, P.; Sampaolo, A.; Dong, L.; Tittel, F.K.; Spagnolo, V. Recent advances in quartz enhanced photoacoustic sensing. Appl. Phys. Rev. 2018, 5, 011106. [Google Scholar] [CrossRef]
- Lassen, M.; Lamard, L.; Feng, Y.; Peremans, A.; Petersen, J.C. Off-axis quartz-enhanced photoacoustic spectroscopy using a pulsed nanosecond mid-infrared optical parametric oscillator. Opt. Lett. 2016, 41, 4118–4121. [Google Scholar] [CrossRef] [PubMed]
- Duquesnoy, M.; Aoust, G.; Melkonian, J.M.; Lévy, R.; Raybaut, M.; Godard, A. Quartz Enhanced Photoacoustic Spectroscopy Based on a Custom Quartz Tuning Fork. Sensors 2019, 19, 1362. [Google Scholar] [CrossRef]
- Dong, L.; Wu, H.; Zheng, H.; Liu, Y.; Liu, X.; Jiang, W.; Zhang, L.; Ma, W.; Ren, W.; Yin, W.; et al. Double acoustic micro-resonator quartz-enhanced photoacoustic spectroscopy. Opt. Lett. 2014, 39, 2479–2482. [Google Scholar] [CrossRef] [PubMed]
- Rousseau, R.; Loghmari, Z.; Bahriz, M.; Chamassi, K.; Teissier, R.; Baranov, A.N.; Vicet, A. Off-beam QEPAS sensor using an 11-μm DFB-QCL with an optimized acoustic resonator. Opt. Express 2019, 27, 7435–7446. [Google Scholar] [CrossRef] [PubMed]
- Petra, N.; Zweck, J.; Kosterev, A.A.; Minkoff, S.E.; Thomazy, D. Theoretical analysis of a quartz-enhanced photoacoustic spectroscopy sensor. Appl. Phys. B 2009, 94, 673–680. [Google Scholar] [CrossRef]
- Kosterev, A.A.; Buerki, P.R.; Dong, L.; Reed, M.; Day, T.; Tittel, F.K. QEPAS detector for rapid spectral measurements. Appl. Phys. B 2010, 100, 173–180. [Google Scholar] [CrossRef]
- Russell, D.A. On the sound field radiated by a tuning fork. Am. J. Phys. 2000, 68, 1139. [Google Scholar] [CrossRef]
- Kosterev, A.A.; Dong, L.; Thomazy, D.; Tittel, F.K.; Overby, S. QEPAS for chemical analysis of multi-component gas mixtures. Appl. Phys. B 2010, 101, 649–659. [Google Scholar] [CrossRef]
- Yin, X.; Dong, L.; Zheng, H.; Liu, X.; Wu, H.; Yang, Y.; Ma, W.; Zhang, L.; Yin, W.; Xiao, L.; et al. Impact of humidity on quartz-enhanced photoacoustic spectroscopy based CO detection using a near-IR telecommunication diode laser. Sensors 2016, 16, 162. [Google Scholar] [CrossRef]
- Maurin, N.; Rousseau, R.; Trzpil, W.; Aoust, G.; Hayot, M.; Mercier, J.; Bahriz, M.; Gouzi, F.; Vicet, A. First clinical evaluation of a quartz enhanced photo-acoustic CO sensor for human breath analysis. Sens. Actuators B Chem. 2020, 319, 128247. [Google Scholar] [CrossRef]
- Wu, H.; Dong, L.; Zheng, H.; Yu, Y.; Ma, W.; Zhang, L.; Yin, W.; Xiao, L.; Jia, S.; Tittel, F.K. Beat frequency quartz-enhanced photoacoustic spectroscopy for fast and calibration-free continuous trace-gas monitoring. Nat. Commun. 2017, 8, 15331. [Google Scholar] [CrossRef] [PubMed]
- Lamard, L.; Balslev-Harder, D.; Peremans, A.; Petersen, J.C.; Lassen, M. Versatile photoacoustic spectrometer based on a mid-infrared pulsed optical parametric oscillator. Appl. Opt. 2019, 58, 250–256. [Google Scholar] [CrossRef] [PubMed]
- Petrov, V. Frequency down-conversion of solid-state laser sources to the mid-infrared spectral range using non-oxide nonlinear crystals. Prog. Quantum. Electron. 2015, 42, 1–106. [Google Scholar] [CrossRef]
- Umemura, N.; Matsuda, D.; Mizuno, T.; Kato, K. Sellmeier and thermo-optic dispersion formulas for the extraordinary ray of 5 mol.% MgO-doped congruent LiNbO 3 in the visible, infrared, and terahertz regions. Appl. Opt. 2014, 53, 5726–5732. [Google Scholar] [CrossRef] [PubMed]
- Mukherjee, A.; Prasanna, M.; Lane, M.; Go, R.; Dunayevskiy, I.; Tsekoun, A.; Patel, C.K.N. Optically multiplexed multi-gas detection using quantum cascade laser photoacoustic spectroscopy. Appl. Opt. 2008, 47, 4884–4887. [Google Scholar] [CrossRef]
- Hassouna, M.; Robin, P.; Charpiot, A.; Edouard, N.; Méda, B. Infrared photoacoustic spectroscopy in animal houses: Effect of non-compensated interferences on ammonia, nitrous oxide and methane air concentrations. Biosyst. Eng. 2013, 114, 318–326. [Google Scholar] [CrossRef]
- Besson, J.P.; Schilt, S.; Thévenaz, L. Multi-gas sensing based on photoacoustic spectroscopy using tunable laser diodes. Spectrochim. Acta A 2004, 60, 3449–3456. [Google Scholar] [CrossRef]
- Mao, X.; Zhou, X.; Gong, Z.; Yu, Q. An all-optical photoacoustic spectrometer for multi-gas analysis. Sens. Actuators B Chem. 2016, 232, 251–256. [Google Scholar] [CrossRef]
- Ma, Y.; Lewicki, R.; Razeghi, M.; Tittel, F.K. QEPAS based ppb-level detection of CO and N2O using a high power CW DFB-QCL. Opt. Express 2013, 21, 1008–1019. [Google Scholar] [CrossRef]
- Elefante, A.; Giglio, M.; Sampaolo, A.; Menduni, G.; Patimisco, P.; Passaro, V.; Wu, H.; Rossmadl, H.; Mackowiak, V.; Cable, A.; et al. Dual-gas quartz-enhanced photoacoustic sensor for simultaneous detection of methane/nitrous oxide and water vapor. Anal. Chem. 2019, 91, 12866–12873. [Google Scholar] [CrossRef]
- Elefante, A.; Menduni, G.; Rossmadl, H.; Mackowiak, V.; Giglio, M.; Sampaolo, A.; Patimisco, P.; Passaro, V.; Spagnolo, V. Environmental Monitoring of Methane with Quartz-Enhanced Photoacoustic Spectroscopy Exploiting an Electronic Hygrometer to Compensate the H2O Influence on the Sensor Signal. Sensors 2020, 20, 2935. [Google Scholar] [CrossRef] [PubMed]
- Zifarelli, A.; Giglio, M.; Menduni, G.; Sampaolo, A.; Patimisco, P.; Passaro, V.M.N.; Wu, H.; Dong, L.; Spagnolo, V. Partial Least-Squares Regression as a Tool to Retrieve Gas Concentrations in Mixtures Detected Using Quartz-Enhanced Photoacoustic Spectroscopy. Anal. Chem. 2020, 92, 11035–11043. [Google Scholar] [CrossRef] [PubMed]
- Giglio, M.; Zifarelli, A.; Sampaolo, A.; Menduni, G.; Elefante, A.; Blanchard, R.; Pfluegl, C.; Witinski, M.F.; Vakhshoori, D.; Wu, H.; et al. Broadband detection of methane and nitrous oxide using a distributed-feedback quantum cascade laser array and quartz-enhanced photoacoustic sensing. Photoacoustics 2020, 17, 100159. [Google Scholar] [CrossRef] [PubMed]


© 2020 by the authors. Licensee MDPI, Basel, Switzerland. This article is an open access article distributed under the terms and conditions of the Creative Commons Attribution (CC BY) license (http://creativecommons.org/licenses/by/4.0/).
Share and Cite
Christensen, J.B.; Høgstedt, L.; Friis, S.M.M.; Lai, J.-Y.; Chou, M.-H.; Balslev-Harder, D.; Petersen, J.C.; Lassen, M. Intrinsic Spectral Resolution Limitations of QEPAS Sensors for Fast and Broad Wavelength Tuning. Sensors 2020, 20, 4725. https://doi.org/10.3390/s20174725
Christensen JB, Høgstedt L, Friis SMM, Lai J-Y, Chou M-H, Balslev-Harder D, Petersen JC, Lassen M. Intrinsic Spectral Resolution Limitations of QEPAS Sensors for Fast and Broad Wavelength Tuning. Sensors. 2020; 20(17):4725. https://doi.org/10.3390/s20174725
Chicago/Turabian StyleChristensen, Jesper B., Lasse Høgstedt, Søren M. M. Friis, Jui-Yu Lai, Ming-Hsien Chou, David Balslev-Harder, Jan C. Petersen, and Mikael Lassen. 2020. "Intrinsic Spectral Resolution Limitations of QEPAS Sensors for Fast and Broad Wavelength Tuning" Sensors 20, no. 17: 4725. https://doi.org/10.3390/s20174725
APA StyleChristensen, J. B., Høgstedt, L., Friis, S. M. M., Lai, J.-Y., Chou, M.-H., Balslev-Harder, D., Petersen, J. C., & Lassen, M. (2020). Intrinsic Spectral Resolution Limitations of QEPAS Sensors for Fast and Broad Wavelength Tuning. Sensors, 20(17), 4725. https://doi.org/10.3390/s20174725