An Instrumented Assessment of a Rhythmic Finger Task among Children with Motor Coordination Difficulties


Abstract
1. Introduction
2. Methods
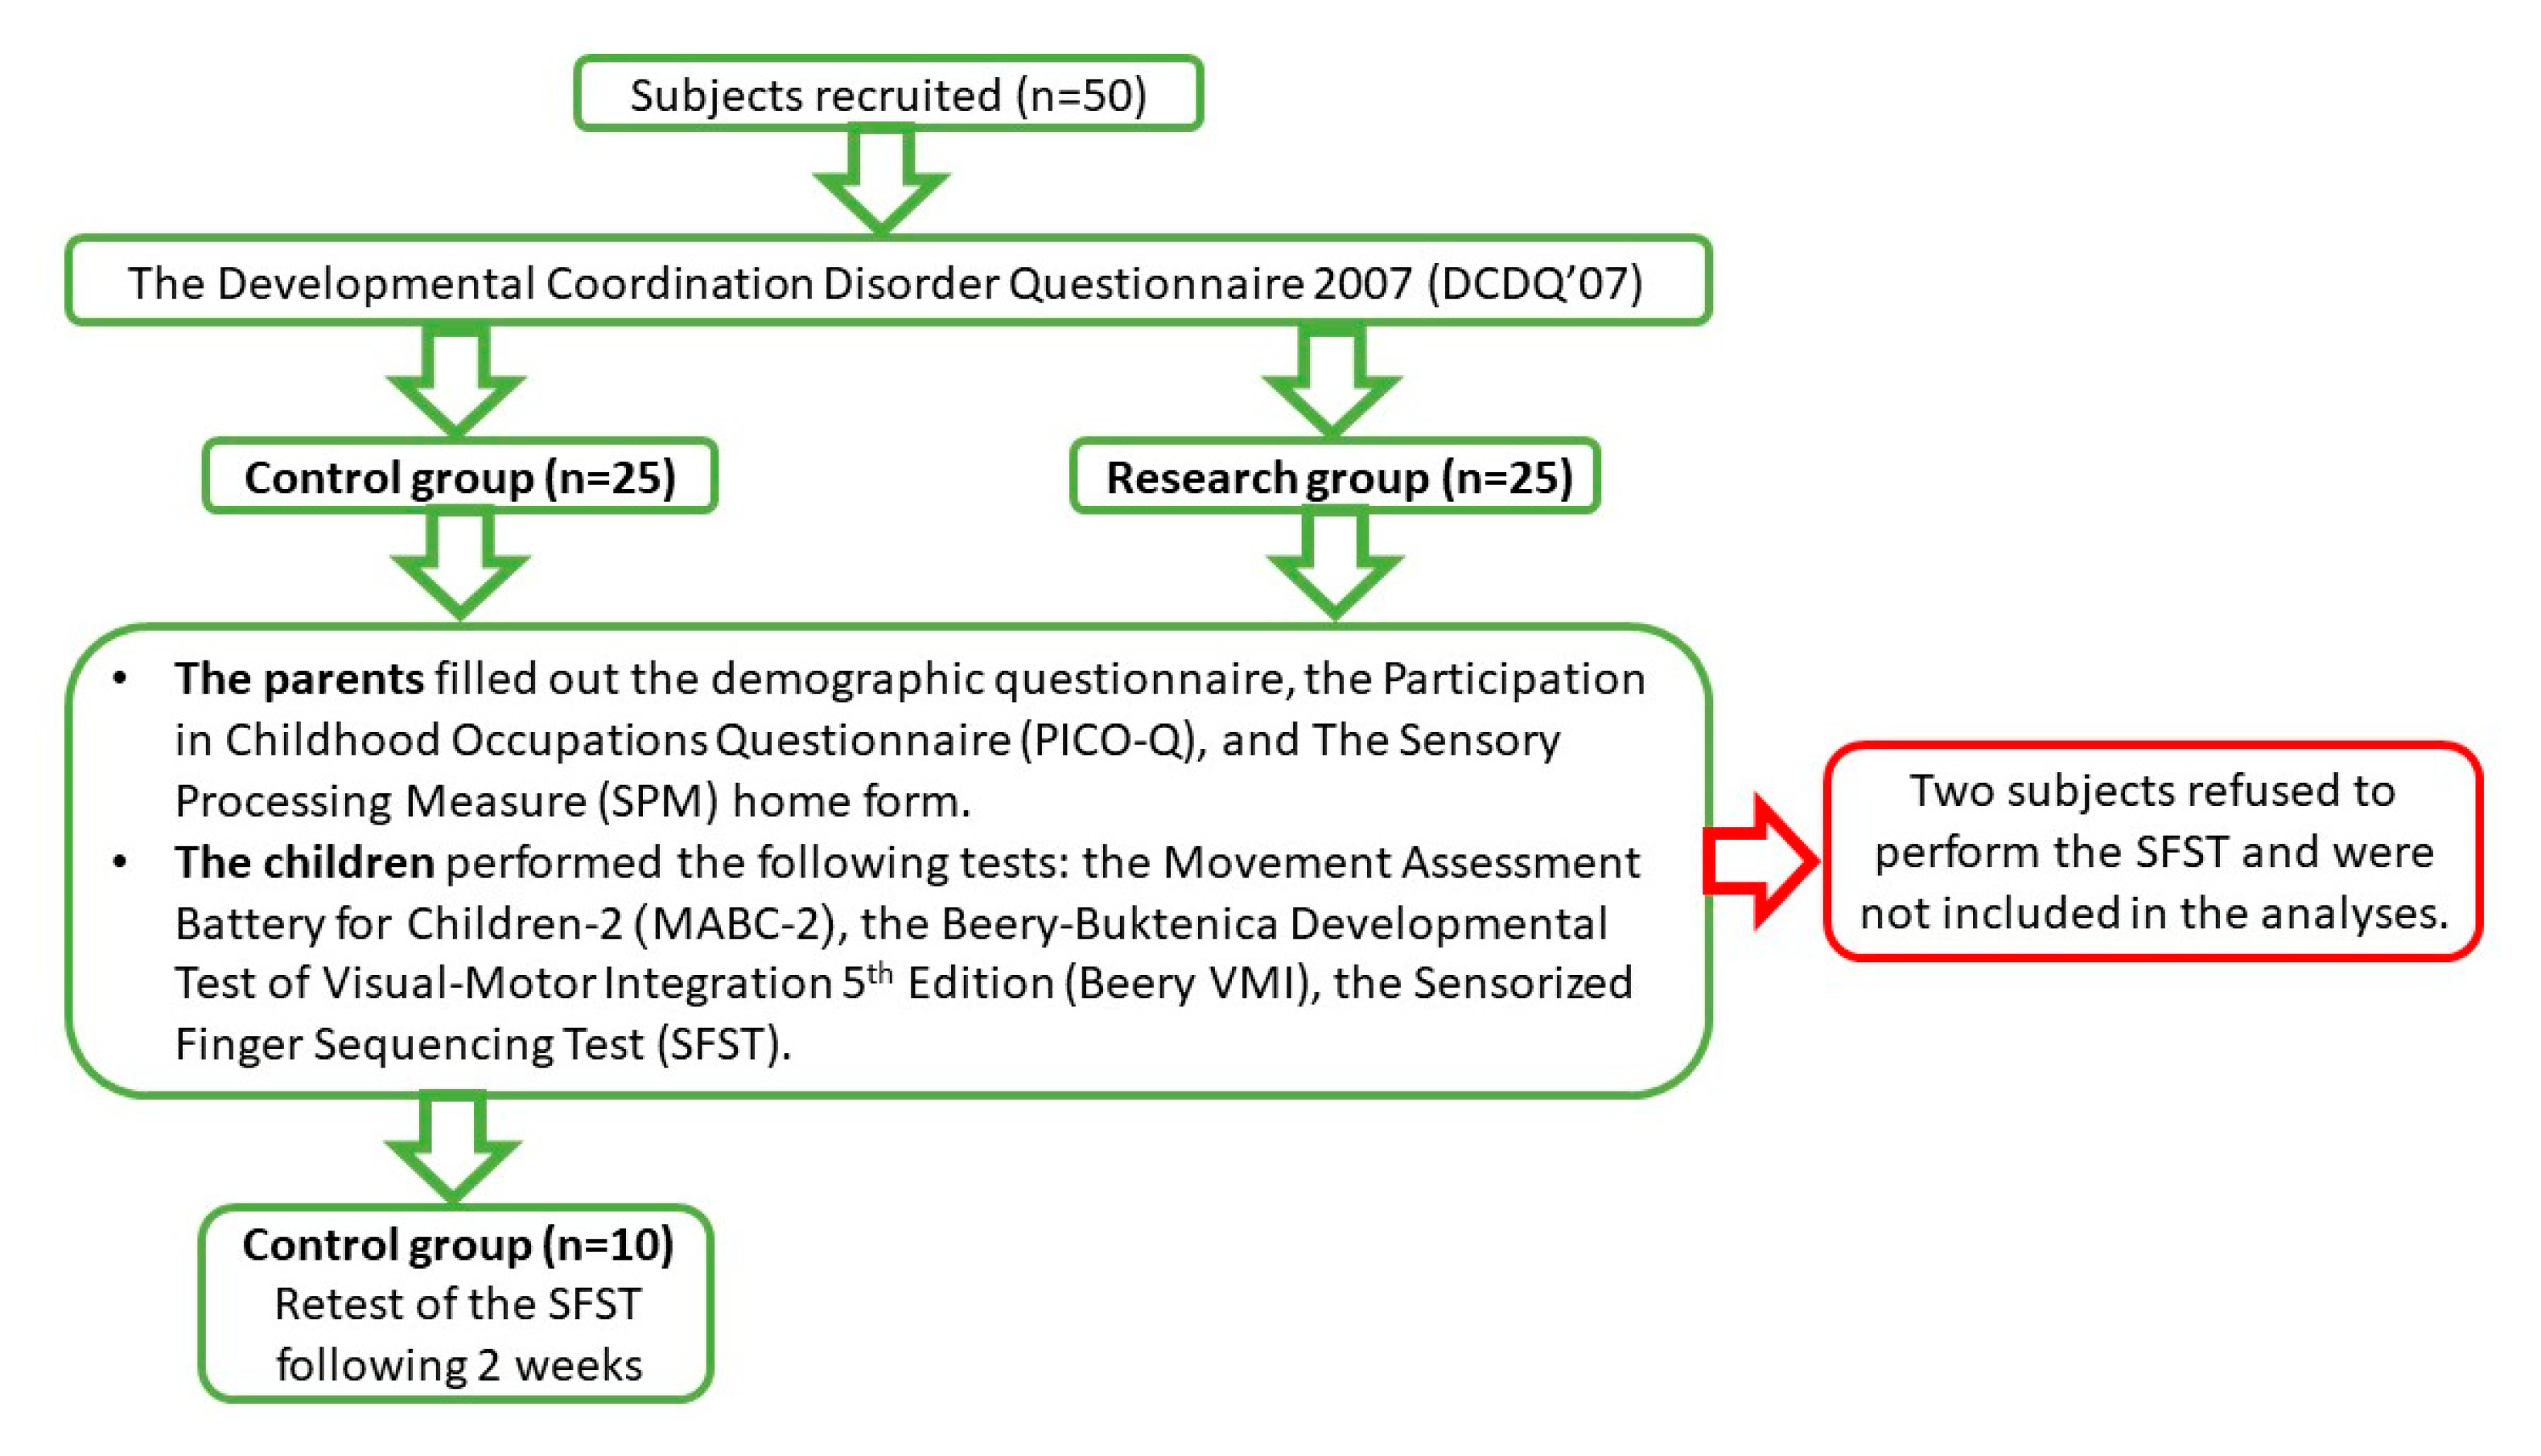
2.1. Participants
2.2. Study Tools
- The Movement Assessment Battery for Children-2 (MABC-2) [26]: a standardized assessment of motor skills for children aged 3–16 years. It consists of eight subtests in three domains: manual dexterity (posting coins, threading beads and drawing while following a trail); ball skills (catching and throwing at a target); balance (one leg balance, walking with heels raised and jumping). Subtests for the 3–6 years age group were used. A total test score and a final standard score for each domain were calculated;
- The Beery–Buktenica Developmental Test of Visual-Motor Integration 5th Edition (Beery VMI) [27]: a standard test of visual motor integration for ages in the range of 2–18 years. In this study, two subtests were used: the Visual Motor Integration (VMI), which consists of copying 30 geometric shapes that increase in difficulty, and the Motor Coordination (MC), which comprises drawing in 30 mazes. Both tests were performed with pencil and paper. A final standard score was calculated for each subtest;
- The Sensory Processing Measure (SPM) home form [14]: a standardized caregiver screening questionnaire for children aged 5–12 years. It consists of 75 items that describe behaviors of sensory processing, praxis, and social participation in eight categories. Each item is rated in terms of the frequency of the behavior on a 4-point Likert scale (1-never, 4-always). A standard score is calculated for each category that allows comparison to the norms: typical function in the range of 40–59, some problems 60–69, and definite dysfunction 70–80. We used the following final scores: total sensory systems, body awareness, balance and motion, and planning and ideas;
- The Participation in Childhood Occupations Questionnaire (PICO-Q) [28]. This is a standardized caregiver questionnaire that evaluates participation in activities of children in four main domains: activities of daily living, academic activities, play and leisure, and social functioning. Both versions of the questionnaire were used: for ages 6–10 years (consisting of 30 items) and for ages 4–6 years (consisting of 32 items) (Langer, 2014, personal communication). Each item of both versions is scored on three scales, which together form an overall view of the participation of the child. Specifically, three total scores are calculated: performance difficulty, performance frequency, and activity enjoyment, using a 1–5 Likert scale.
2.3. Procedure
2.4. Data Analysis
3. Results
3.1. Construct Validity Testing
3.2. Test–Retest Reliability
4. Discussion
5. Conclusions
Author Contributions
Funding
Conflicts of Interest
References
- Proske, U.; Gandevia, S.C. The proprioceptive senses: Their roles in signaling body shape, body position and movement, and muscle force. Physiol. Rev. 2012, 92, 1651–1697. [Google Scholar] [CrossRef] [PubMed]
- Chu, V.W.T. Assessing proprioception in children: A review. J. Mot. Behav. 2017, 49, 458–466. [Google Scholar] [CrossRef] [PubMed]
- Cardinali, L.; Brozzoli, C.; Luauté, J.; Roy, A.C.; Farnè, A. Proprioception is necessary for body schema plasticity: Evidence from a deafferented patient. Front. Hum. Neurosci. 2016, 10, 272. [Google Scholar] [CrossRef] [PubMed]
- Shin, J.C.; Ivry, R.B. Concurrent learning of temporal and spatial sequences. J. Exp. Psychol. Learn. Mem. Cogn. 2002, 28, 445. [Google Scholar] [CrossRef]
- Izadi-Najafabadi, S.; Ryan, N.; Ghafooripoor, G.; Gill, K.; Zwicker, J.G. Participation of children with developmental coordination disorder. Res. Dev. Disabil. 2019, 84, 75–84. [Google Scholar] [CrossRef]
- Wang, M.; Perova, Z.; Arenkiel, B.R.; Li, B. Synaptic modifications in the medial prefrontal cortex in susceptibility and resilience to stress. J. Neurosci. 2014, 34, 7485–7492. [Google Scholar] [CrossRef]
- Loftesnes, J.M.; Ingvaldsen, R.P.; Sigmundsson, H. Children with developmental coordination disorder: Can underlying perceptual disability be remediated through specific training? Psychol. Rep. 2017, 120, 242–254. [Google Scholar] [CrossRef]
- Tseng, Y.-T.; Tsai, C.-L.; Chen, F.-C.; Konczak, J. Wrist position sense acuity and its relation to motor dysfunction in children with developmental coordination disorder. Neurosci. Lett. 2018, 674, 106–111. [Google Scholar] [CrossRef]
- Li, K.-Y.; Su, W.-J.; Fu, H.-W.; Pickett, K.A. Kinesthetic deficit in children with developmental coordination disorder. Res. Dev. Disabil. 2015, 38, 125–133. [Google Scholar] [CrossRef]
- Rosengren, K.S.; Deconinck, F.J.; DiBerardino, L.A., III; Polk, J.D.; Spencer-Smith, J.; De Clercq, D.; Lenoir, M. Differences in gait complexity and variability between children with and without developmental coordination disorder. Gait Posture 2009, 29, 225–229. [Google Scholar] [CrossRef]
- Gomez, A.; Sirigu, A. Developmental coordination disorder: Core sensori-motor deficits, neurobiology and etiology. Neuropsychologia 2015, 79, 272–287. [Google Scholar] [CrossRef] [PubMed]
- Ayres, A.J. Sensory Integration and Praxis Test: SIPT Manual; Western Psychological Services: Los Angeles, CA, USA, 1989. [Google Scholar]
- Bundy, A.C.; Lane, S.J.; Murray, E.A. Sensory Integration: Theory and Practice; FA Davis: Philadelphia, PA, USA, 2002. [Google Scholar]
- Parham, L.D.; Ecker, C.; Miller-Kuhaneck, H.; Henry, D.A.; Glennon, T.J. SPM Sensory Processing Measure: By L. Diane Parham, Cheryl Ecker, Heather Miller-Kuhaneck, Diana A. Henry, Tara, J. Glennon; Western Psychological Services: Torrance, CA, USA, 2007. [Google Scholar]
- Blanche, E.I.; Bodison, S.; Chang, M.C.; Reinoso, G. Development of the Comprehensive Observations of Proprioception (COP): Validity, reliability, and factor analysis. Am. J. Occup. Ther. 2012, 66, 691–698. [Google Scholar] [CrossRef] [PubMed]
- Blanche, E.I.; Reinoso, G. The use of clinical observations to evaluate proprioceptive and vestibular functions. Am. Occup. Ther. Assoc. 2008. [Google Scholar]
- Schaaf, R.C.; Burke, J.P.; Cohn, E.; May-Benson, T.A.; Schoen, S.A.; Roley, S.S.; Lane, S.J.; Parham, L.D.; Mailloux, Z. State of measurement in occupational therapy using sensory integration. Am. J. Occup. Ther. 2014, 68, e149–e153. [Google Scholar] [CrossRef]
- Association, A.P. Diagnostic and Statistical Manual of Mental Disorders (DSM-5 ®); American Psychiatric Pub: Washington, DC, USA, 2013. [Google Scholar]
- Elbasan, B.; Kayıhan, H.; Duzgun, I. Sensory integration and activities of daily living in children with developmental coordination disorder. Ital. J. Pediatr. 2012, 38, 14. [Google Scholar] [CrossRef]
- Fong, S.S.; Tsang, W.W.; Ng, G.Y. Altered postural control strategies and sensory organization in children with developmental coordination disorder. Hum. Mov. Sci. 2012, 31, 1317–1327. [Google Scholar] [CrossRef]
- Wilson, P.H.; Ruddock, S.; Smits-Engelsman, B.; Polatajko, H.; Blank, R. Understanding performance deficits in developmental coordination disorder: A meta-analysis of recent research. Dev. Med. Child Neurol. 2013, 55, 217–228. [Google Scholar] [CrossRef]
- Gillberg, C.; Kadesjö, B. Why bother about clumsiness? The implications of having developmental coordination disorder (DCD). Neural Plast. 2003, 10, 59–68. [Google Scholar] [CrossRef]
- Mostofsky, S.H.; Rimrodt, S.L.; Schafer, J.G.; Boyce, A.; Goldberg, M.C.; Pekar, J.J.; Denckla, M.B. Atypical motor and sensory cortex activation in attention-deficit/hyperactivity disorder: A functional magnetic resonance imaging study of simple sequential finger tapping. Biol. Psychiatry 2006, 59, 48–56. [Google Scholar] [CrossRef]
- Wilson, B.; Kaplan, B.; Crawford, S.; Roberts, G. The developmental coordination disorder questionnaire 2007 (DCDQ’07). Adm. Man. DCDQ107 Psychom. Prop. 2007. [Google Scholar]
- Théoret, H.; Haque, J.; Pascual-Leone, A. Increased variability of paced finger tapping accuracy following repetitive magnetic stimulation of the cerebellum in humans. Neurosci. Lett. 2001, 306, 29–32. [Google Scholar] [CrossRef]
- Henderson, S.E.; Sugden, D.A.; Barnett, A.L. Movement Assessment Battery for Children-2; Pearson Assessment: London, UK, 2007. [Google Scholar]
- Beery, K.E. Beery VMI: The Beery-Buktenica Developmental Test of Visual-Motor Integration; Pearson: Minneapolis, MN, USA, 2004. [Google Scholar]
- Bar-Shalita, T.; Yochman, A.; Shapiro-Rihtman, T.; Vatine, J.-J.; Parush, S. The participation in childhood occupations questionnaire (PICO-Q): A pilot study. Phys. Occup. Ther. Pediatr. 2009, 29, 295–310. [Google Scholar] [CrossRef] [PubMed]
- Du, W.; Wilmut, K.; Barnett, A.L. Level walking in adults with and without Developmental Coordination Disorder: An analysis of movement variability. Hum. Mov. Sci. 2015, 43, 9–14. [Google Scholar] [CrossRef] [PubMed]
- Halsband, U.; Lange, R.K. Motor learning in man: A review of functional and clinical studies. J. Physiol. Paris 2006, 99, 414–424. [Google Scholar] [CrossRef] [PubMed]
- Press, D.Z.; Casement, M.D.; Pascual-Leone, A.; Robertson, E.M. The time course of off-line motor sequence learning. Cogn. Brain Res. 2005, 25, 375–378. [Google Scholar] [CrossRef]
- Roche, R.; Wilms-Floet, A.M.; Clark, J.E.; Whitall, J. Auditory and visual information do not affect self-paced bilateral finger tapping in children with DCD. Hum. Mov. Sci. 2011, 30, 658–671. [Google Scholar] [CrossRef]


| Control Group (n = 24) | Study Group (n = 24) | |||
|---|---|---|---|---|
| p | t | Mean ± SD | Mean ± SD | |
| 0.652 | −0.454 | 70.3 ± 7.0 | 6.9 ± 69.4 | Age (months) |
| p | χ2 | % | % | |
| 0.766 | 0.356 | 14 (58.3) | 16 (67.0) | Boys |
| 0.724 | 0.505 | 20 (83.3) | 18 (75.0) | Right handed |
| Control Group (n = 24) | Study Group (n = 24) | ||||||
|---|---|---|---|---|---|---|---|
| p | z | IQR | Median | IQR | Median | ||
| <0.001 | −4.522 | 10.7–6.7 | 25 | 1.0–9.0 | 3.5 | Total score | MABC−2 |
| <0.001 | −4.131 | 6.0–34.0 | 9 | 8.0–1.0 | 3.5 | Manual dexterity | |
| <0.001 | −3.498 | 75.0–25.0 | 43.5 | 5.0–37.0 | 12.5 | Ball skills | |
| <0.001 | −4.226 | 25.0–63.0 | 37 | 5.0–22.7 | 9 | Balance | |
| <0.001 | −4.131 | 42.0–65.0 | 58 | 13.2–43.5 | 27 | VMI | Beery |
| 0.007 | −2.707 | 33.2–72.2 | 46 | 9.7–56.7 | 25 | MC | |
| <0.001 | −4.898 | 47.2–57.0 | 51 | 57.0–61.0 | 63.5 | Total | SPM |
| <0.001 | −4.665 | 51.0–57.0 | 54 | 59.0–66.0 | 64 | Balance and motion | |
| <0.001 | −5.326 | 41.2–52.5 | 48 | 57.0–68.5 | 63 | Planning and ideas | |
| <0.001 | −4.507 | 48.0–56.7 | 48 | 57.0–66.0 | 62 | Body awareness | |
| <0.001 | −5.170 | 1.2–1.4 | 1.3 | 1.4–2.6 | 2.2 | Performance level | PICO-Q |
| 0.003 | −2.939 | 3.7–4.5 | 4.2 | 4.2–2.9 | 3.4 | Enjoyment level | |
| t | SD | Mean | SD | Mean | |||
| <0.001 | −4.238 | 0.4 | 4.2 | 0.7 | 3.5 | Frequency level | |
| Control Group (n = 24) | Study Group (n = 24) | ||||||
|---|---|---|---|---|---|---|---|
| p | t/z | IQR | Median | IQR | Median | ||
| 0.035 | −2.103 | 9.6–14.2 | 11.6 | 11.1–20.3 | 13.9 | Total time (s) | Dominant hand |
| 0.059 | −1.887 | 1.0–5.0 | 2 | 0.5–1.5 | 1 | Correct touches | |
| 0.036 | −2.094 | 0.1–0.4 | 0.1 | 0.1–0.8 | 0.4 | SD touch time (s) * | |
| 0.075 | 1.82 | 3.2 a | 10.4 a | 4.1 a | 12.3 a | Total time (s) a | Non-dominant hand |
| 0.058 | −1.899 | 1.0–5.5 | 3 | 1.0–2.0 | 2 | Correct touches | |
| 0.032 | −2.142 | 0.1–0.3 | 0.12 | 0.2–0.4 | 0.2 | SD touch time (s) ** | |
| 2nd Measurement | 1st Measurement | |||||
|---|---|---|---|---|---|---|
| r | IQR | Median | IQR | Median | ||
| −0.08 | 8.5–10.5 | 9.3 | 9.6–14.0 | 9.8 | Total time (s) | Dominant hand |
| −0.04 | 1.0–5.0 | 2.5 | 2.7–5.2 | 4.5 | Correct touches | |
| 0.87 ** | 0.1–0.1 | 0.1 | 0.1–0.5 | 0.1 * | SD touch time (s) | |
| 0.06 | 1.5 a | 9.1 a | 2.1 a | 9.9 a | Total time (s) a | Non-dominant hand |
| 0.18 | 2.7 a | 3.3 a | 2.1 a | 4.5 a | Correct touches a | |
| −0.32 | 0.1–0.2 | 0.1 ¥ | 0.1–0.2 | 0.15 | SD touch time (s) | |
© 2020 by the authors. Licensee MDPI, Basel, Switzerland. This article is an open access article distributed under the terms and conditions of the Creative Commons Attribution (CC BY) license (http://creativecommons.org/licenses/by/4.0/).
Share and Cite
Keinan, A.; Bar-Shalita, T.; Portnoy, S. An Instrumented Assessment of a Rhythmic Finger Task among Children with Motor Coordination Difficulties. Sensors 2020, 20, 4554. https://doi.org/10.3390/s20164554
Keinan A, Bar-Shalita T, Portnoy S. An Instrumented Assessment of a Rhythmic Finger Task among Children with Motor Coordination Difficulties. Sensors. 2020; 20(16):4554. https://doi.org/10.3390/s20164554
Chicago/Turabian StyleKeinan, Artal, Tami Bar-Shalita, and Sigal Portnoy. 2020. "An Instrumented Assessment of a Rhythmic Finger Task among Children with Motor Coordination Difficulties" Sensors 20, no. 16: 4554. https://doi.org/10.3390/s20164554
APA StyleKeinan, A., Bar-Shalita, T., & Portnoy, S. (2020). An Instrumented Assessment of a Rhythmic Finger Task among Children with Motor Coordination Difficulties. Sensors, 20(16), 4554. https://doi.org/10.3390/s20164554