Abstract
Precise flow measurement in the open channel is a key prerequisite to implementation of modern agricultural efficient water use. The channel with an arc-bottomed shape is the most common channel type in irrigation area at present. The paper has verified the log-law is along the normal line rather than along the vertical line in arc-bottom channel. By conducting the velocity distribution log-law, this paper derives the expression of the multiple characteristic sensing points location of the flow-velocity sensor in the channel section, which is along the normal line. Based on this, a new algorithm to estimate the discharge of the arc-bottomed channel flow is proposed. We have also developed the experiment of the arc-bottomed channels (including semicircular channels, arc-bottom trapezoidal channels and U-shaped channels) and utilize the data to verify the method. The results indicate that the sensing locations expression of the flow velocity measuring sensor such as acoustic doppler velocimetry and propeller is suitable for improving discharge estimation’s accuracy of the arc-bottomed channels. This method could be extensively used in estimating discharge of irrigation and drainage channels in agricultural water conservancy projects. It will enhance the efficiency and accuracy of water resources management departments in irrigation areas, which also meet the strategic requirements of agricultural sustainable development.
1. Introduction
Estimating the discharge of open channels is an essential problem in water-resources engineering []. As important irrigation and drainage channels, the arc-bottomed channel has the characteristics of large flow capacity, strong sediment transport capacity and significant seepage control effect []. Moreover, due to its opening width is narrower than trapezoidal cross-section, a certain extent cultivated land area can be saved. The arc-bottomed channels, such as semicircular, trapezoidal with arc-bottom and U-shaped channel cross-section, have been widely used in irrigation areas currently. For example, the open channels with an arc-bottomed shape accounts for the majority in Hetao irrigation area in Inner Mongolia of China. However, the flow measurement of the arc-bottomed channel is still in the development stage, and the measuring technology has not yet been solved.
As is known, velocity distribution is critical to the calculating the discharge in channels []. Since Prandtl put forward the concept of the boundary layer in 1904, Keulegen first proposed that the log-law could describe the velocity distribution of fully developed uniform turbulence in an open channel in 1938 [,]:
where u is velocity, is the von Kármán constant, is the coefficient of kinematic viscosity and B is constant. Here, is friction velocity, which reflects the shear stress of the open channel. It is calculated according to the resistance balance of uniform open channel flow.
Considering the influence of the side wall, the formula of friction velocity [] is,
where g is gravitational acceleration, R is hydraulic radius and S is hydraulic gradient.
Nikuradse carried out an artificial sand rough pipe flow experiment by pasting sand on the wall of a pipe []. His result gave that the values of parameters and B in the log-law are 0.4 and 5.5. After that, other experimenters also gave different parameter values by doing experiments [,,]. In this paper, we will make mathematical derivation and further analysis based on the parameter values in log-law given by Nikuradse, that is,
Numerous researchers have attempted to give methods for estimating discharge of arc-bottomed open channels in recent years. Some of them have proposed the flow calculation formula to measure the discharge. Dey [] presented a model that could describe a free overfall from smooth circular channels with flat base and he computed the upstream discharge through the streamline curvature at free surface with the model. Yang et al. [] established exponent formula for horizontal velocity distribution properties and two-power law for vertical velocity distribution properties. They also put forward the midline three-point for flow measurement of U-shaped channel. Hu et al. [] used the volume-of-fluid model to show that the parabolic flume is a structure that effectively measures the discharge of U-shaped channels. Moreover, they derived a formula for calculating discharge that is applicable to U-shaped channels of various slopes. Besides these, there are a few researchers who designs flumes, weirs and gates for flow measurement. Samani [] designed three simple flumes for flow measurements in different cross-section open channels. He combined the Pi Theorem principle with laboratory scale physical models and developed the calibrated equations. Mohammadzadeh-Habili et al. [] investigated a new weir entitled of quarter-circular crested weir for flow measurement. They determined that the discharge coefficient of the weir was constant through conducting experiments. Vatankhah et al. [] proposed solid semicircular flap gates which is used to measure discharge along the circular channels under free flow condition. However, its leakage is inevitable and cannot be quantified.
Both the formula method and the weir-gate method exist problems in application scope and simplicity. Thus, this study wants to give a reliable and simple method in order to provide a good idea of flow measurement. Unlike previous studies, this paper proposes a new algorithm to estimate the discharge through multiple characteristic sensing points of the flow-velocity sensor in open channels with an arc-bottom by using velocity distribution log-law. First of all, the log-law is verified along the normal line rather than along the vertical line through comparison. Then, the paper gives theoretical expression of multiple characteristic sensing points location of the flow-velocity sensor and the formula for calculating channel discharge. Finally, based on the derived results, the discharge can be quickly obtained by using the sensor to measure the velocity of the characteristic points and substituting the discharge calculation formula. The relevant experimental design is carried out, involving three cross-section types of channels: semicircle, trapezoid with an arc-bottom and U-shaped. Through comparative analysis, it is considered that the multiple characteristic sensing points of the flow-velocity sensor can be applied to the flow measurement of arc-bottomed channels.
2. Methodology
The transportation direction of flow surplus energy is along the relative shortest geometric distance to the boundary []. For the arc-bottomed channel, due to its channel boundary is curvilinear, we can connect the center of the circle and any point in the channel cross-section and extend it to get the intersection point with the side wall. Then, it can be obtained that the length between these two points is the relative shortest geometric distance of energy dissipation. Hence, the mathematical derivation in methodology section is based on the velocity distribution along the normal line direction. The research object of this paper is arc-bottom channel. As shown in Figure 1, the common types of arc bottom channel are semicircle, arc-bottom trapezium and U-shaped.
Figure 1.
Three common kinds of cross-section types of channels with an arc-bottom. (a) Semicircle; (b) arc-bottom trapezium; (c) u-shaped. Here, x and y are the axes of the coordinate system, H is water depth, r is radius of the arc, and Ln is the length of the underwater part of the line.
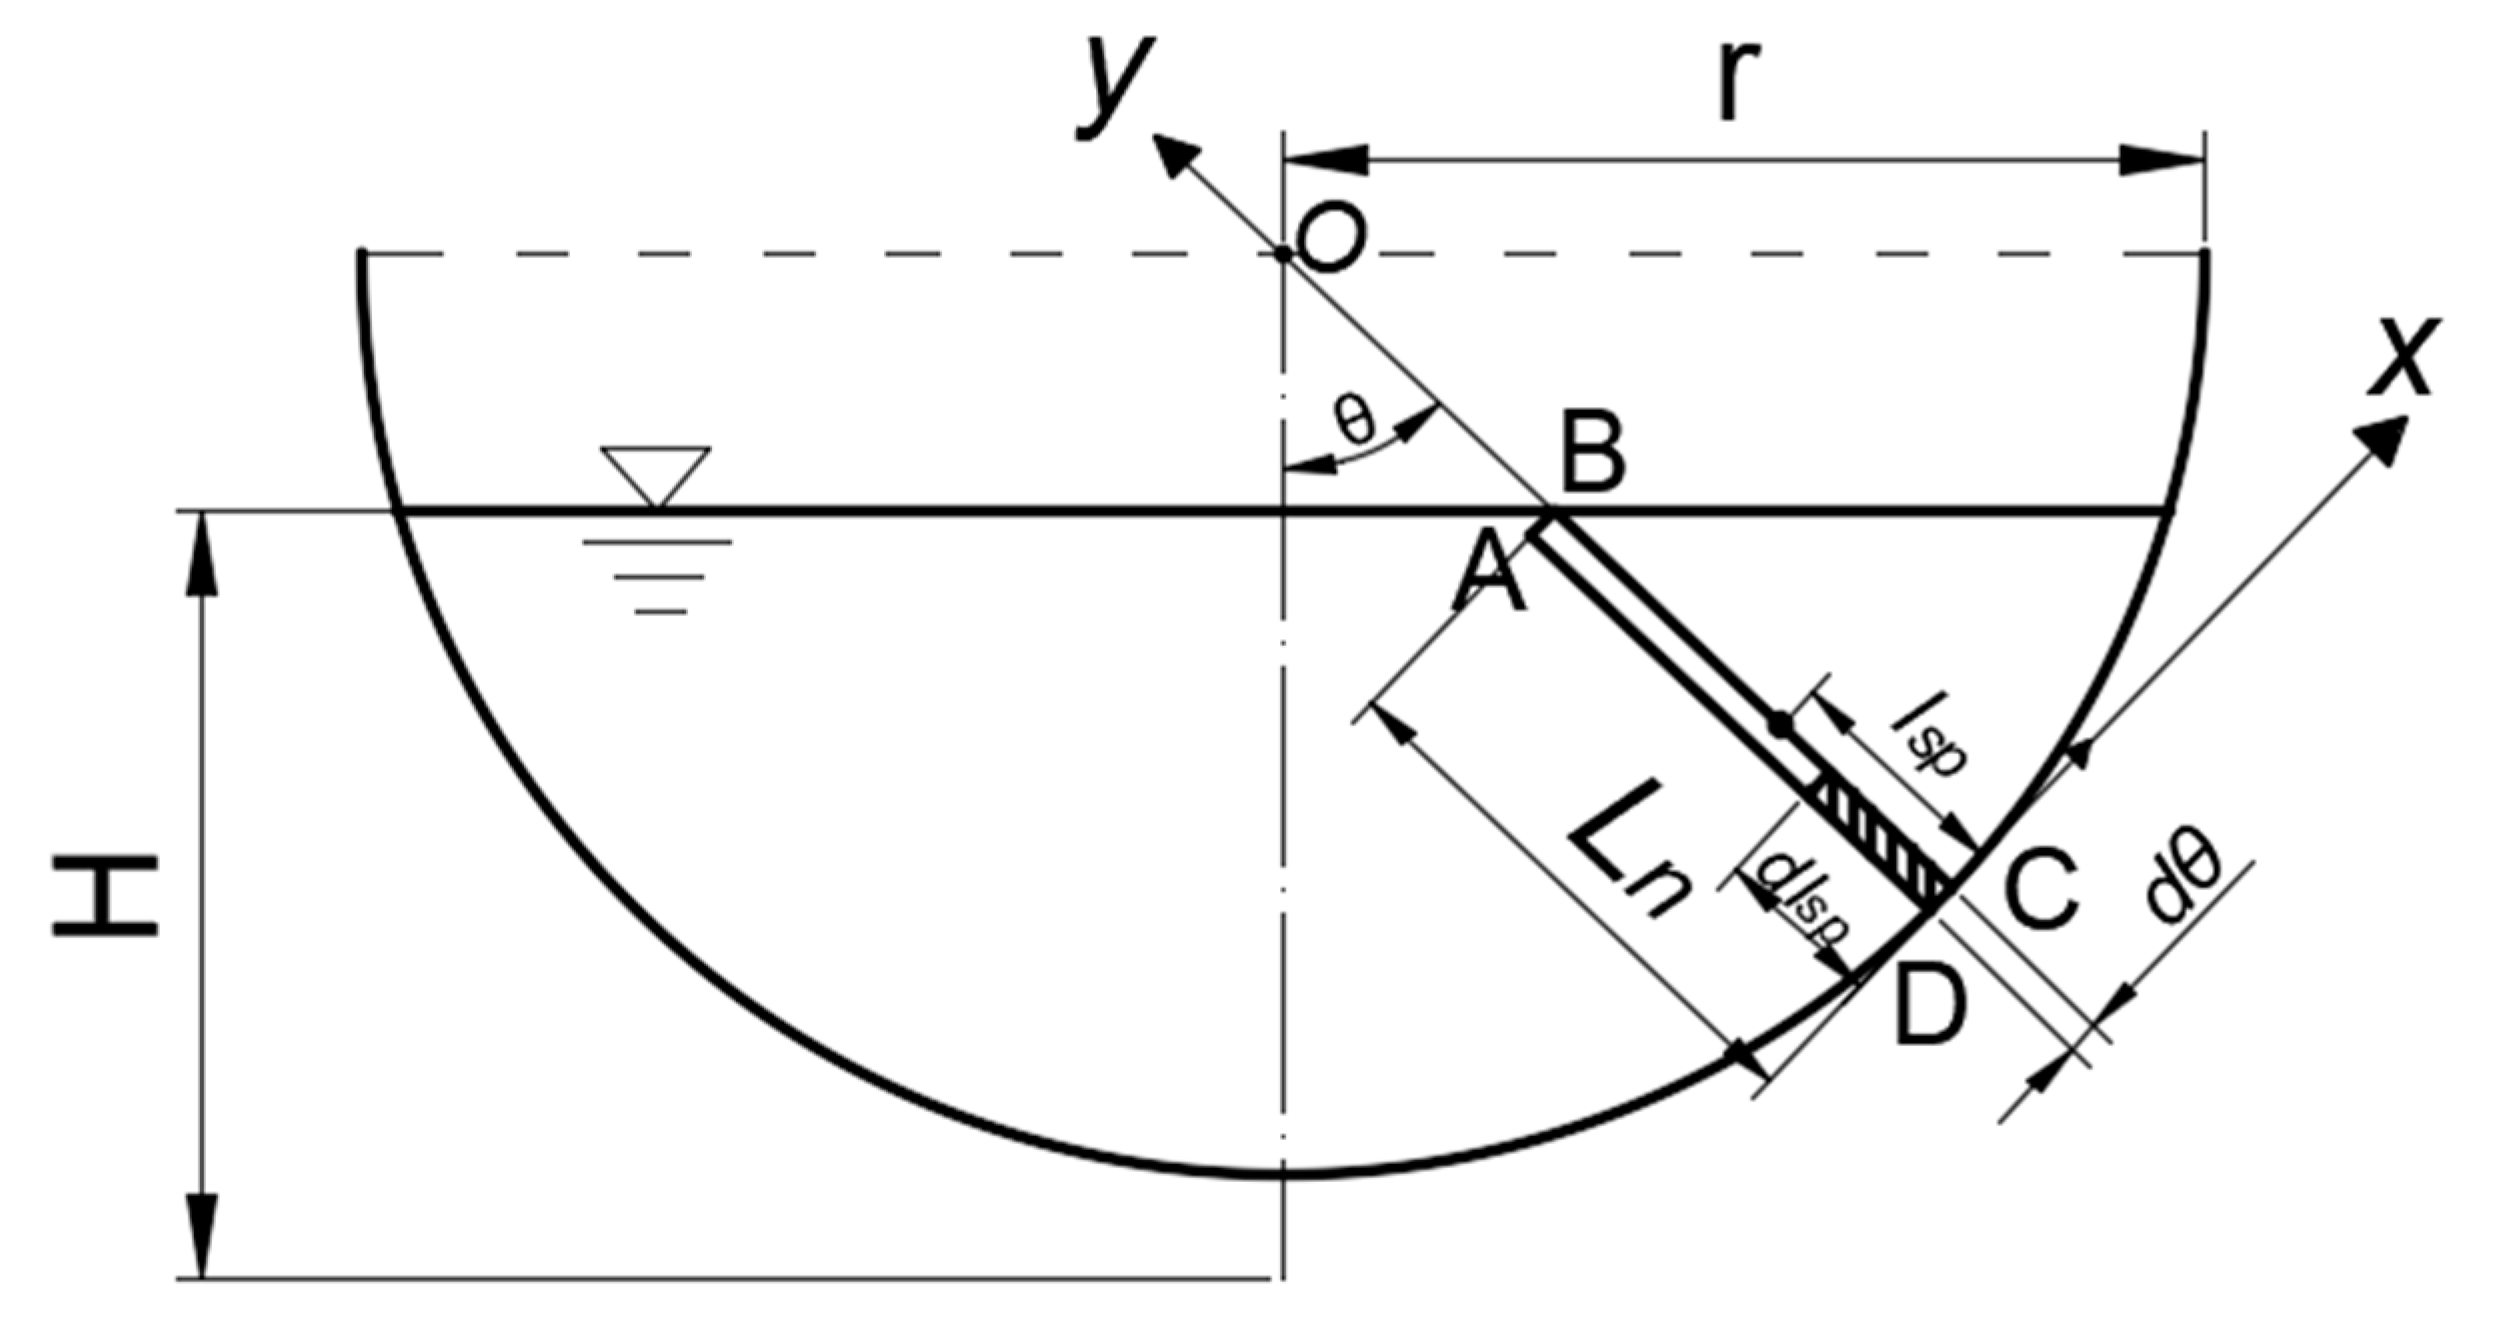
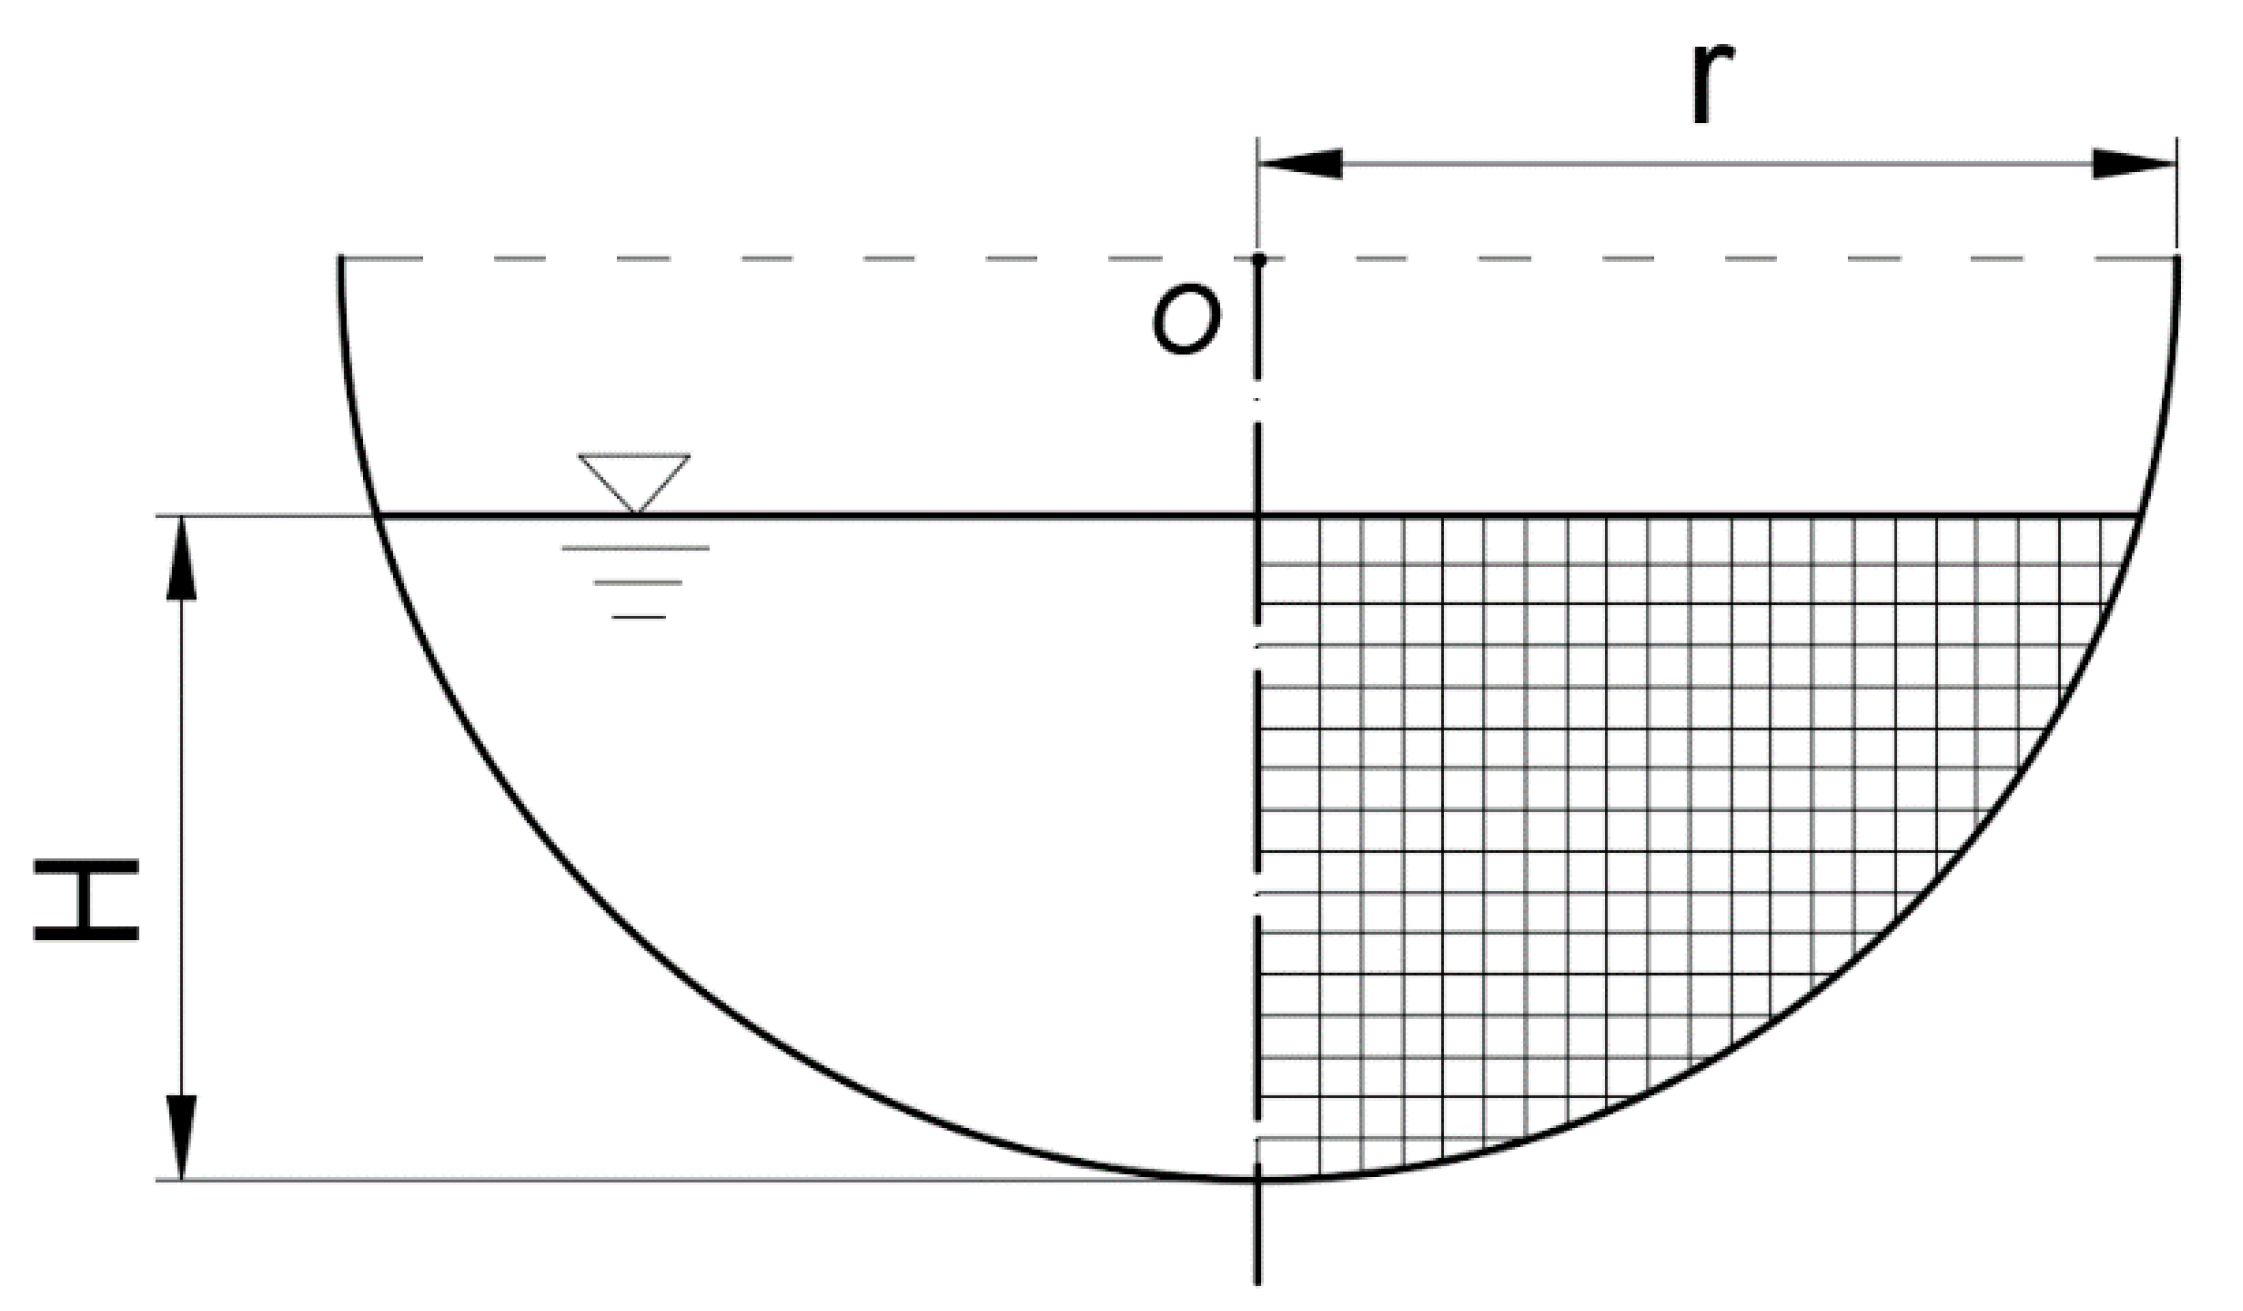
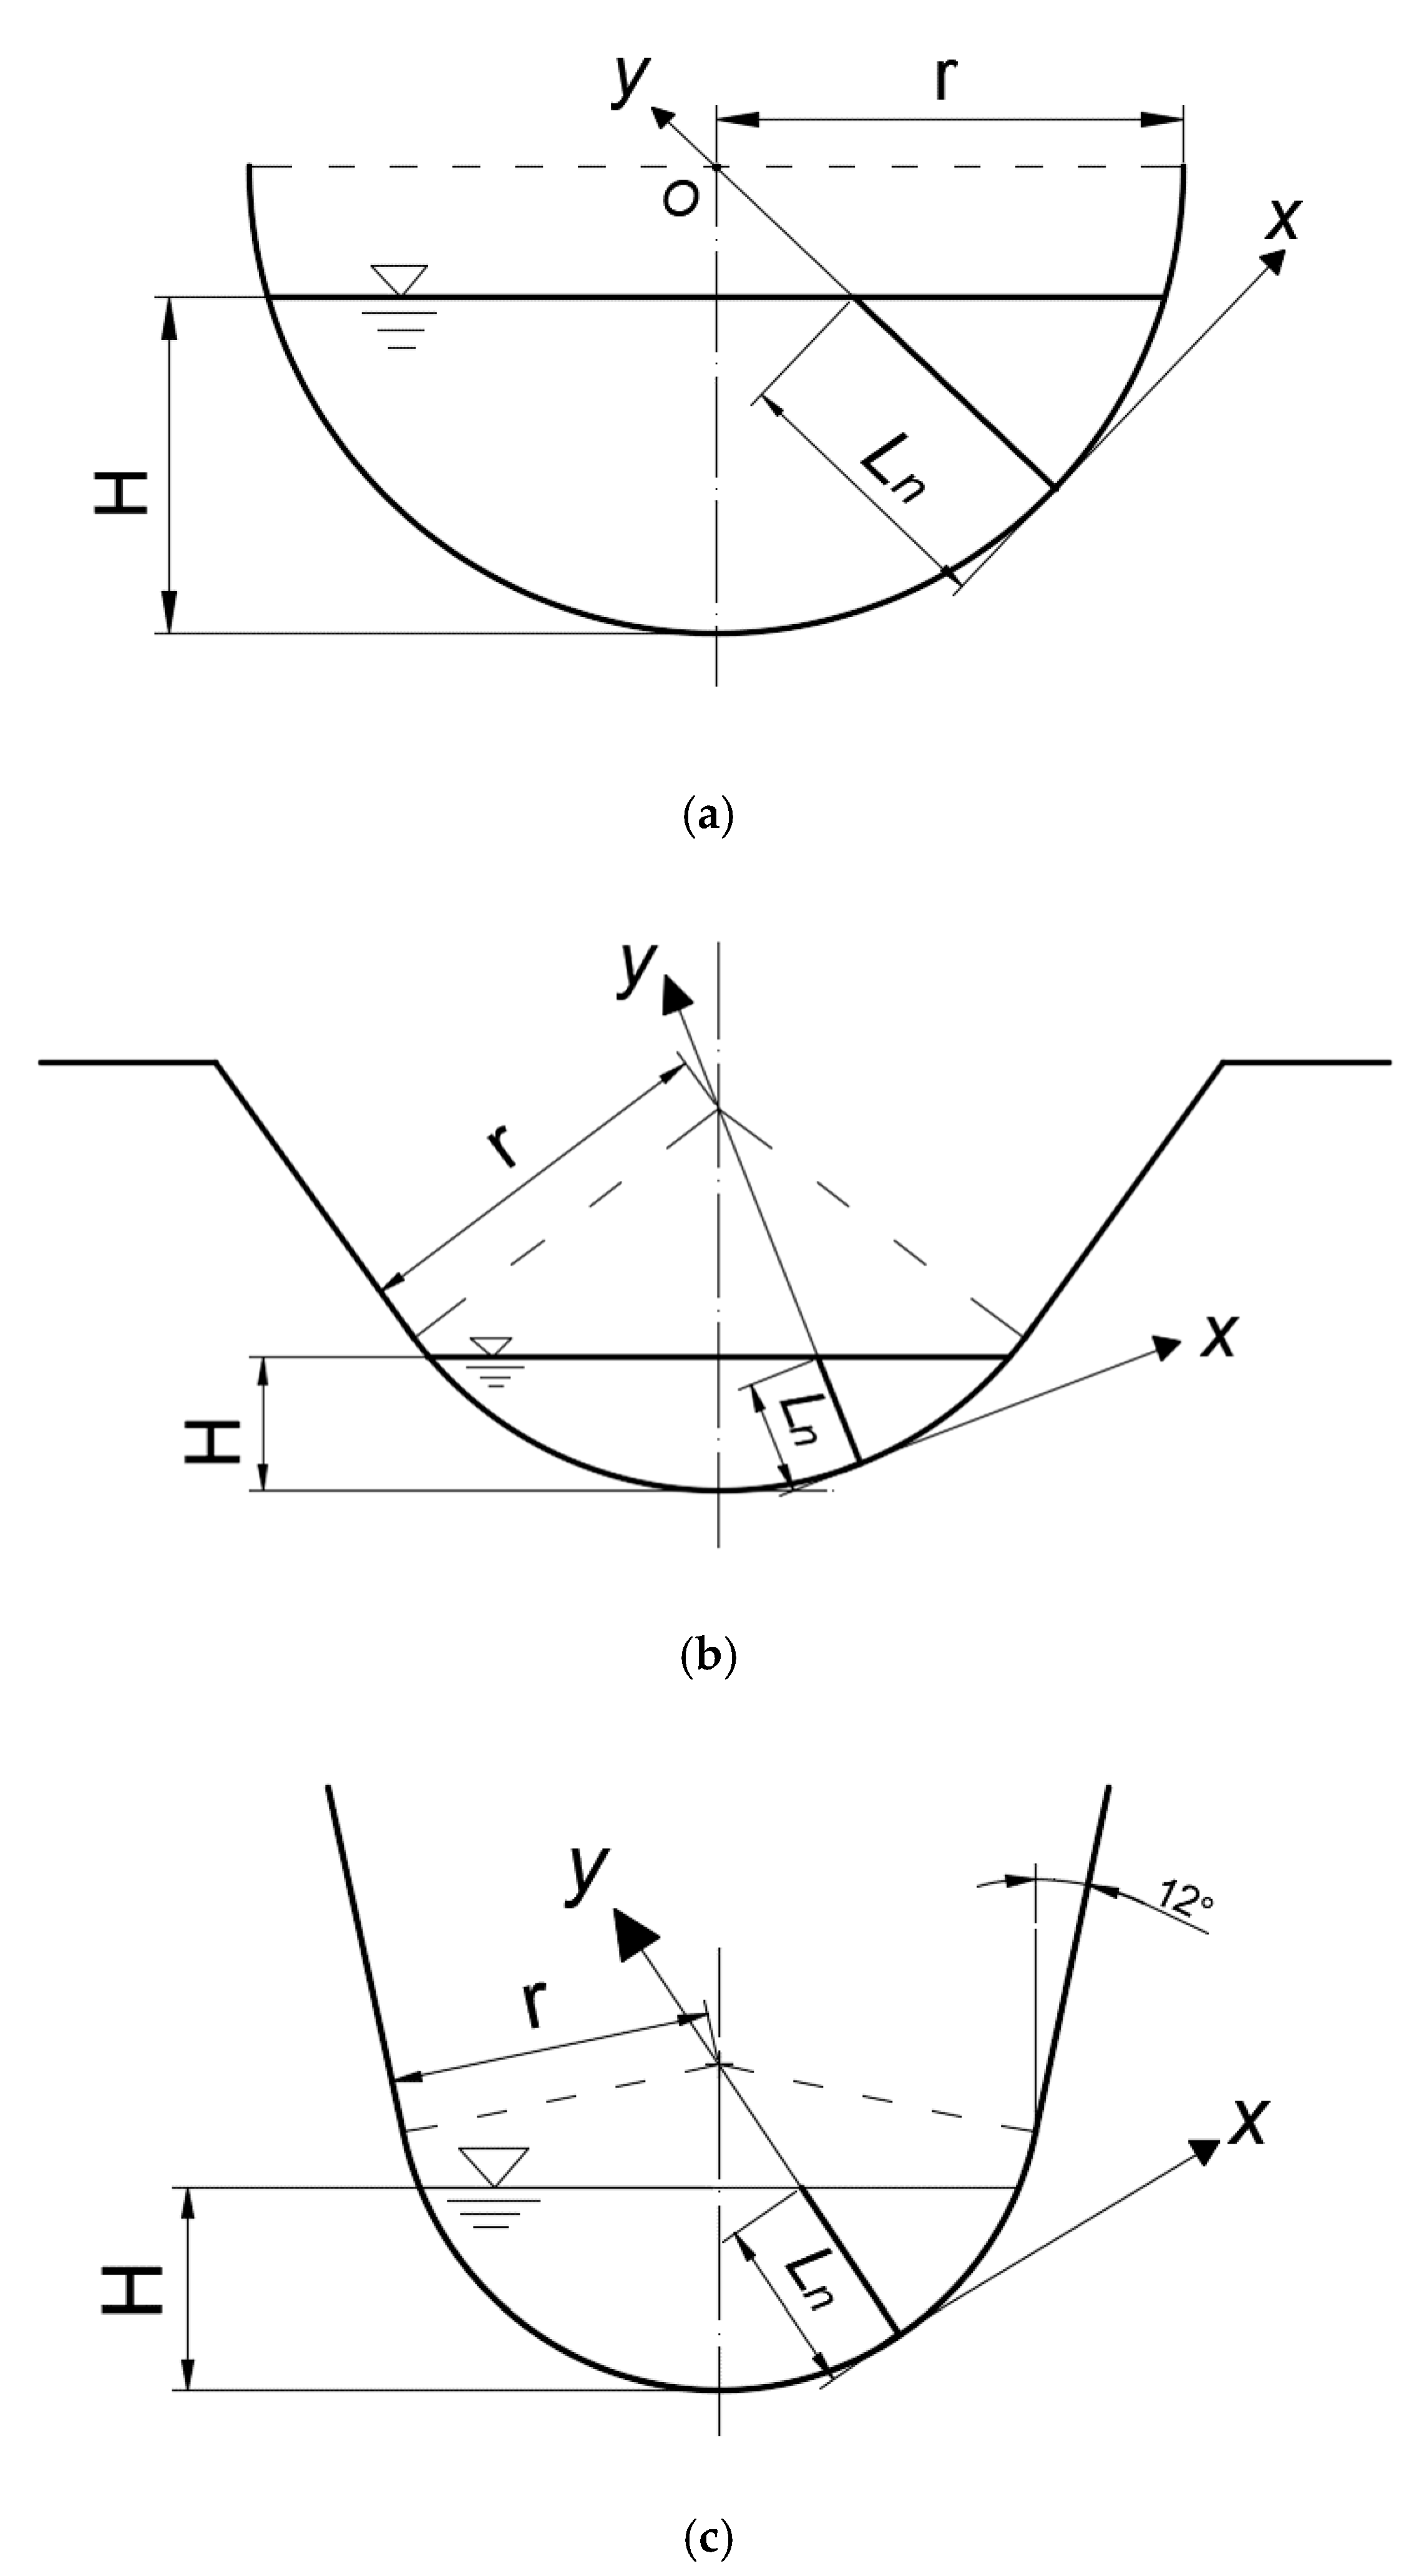
2.1. The Location of Characteristic Sensing Point of the Flow-Velocity Sensor in Arc-Bottom Channel
In this paper, because of the practical diversity of arc-bottomed channel forms, the derivation is based on the simplest form of the arc-bottomed channel. The simplified standard semicircular channel section diagram is analyzed.
In Figure 2, there is a straight line, which is angled with the center line as θ. The rectangle ABCD is Ln in length and dθ in width. Since dθ is infinitely close to zero, the discharge through the rectangle ABCD can be expressed as:
Figure 2.
The semicircular channel is taken as an example to analyze and deduce. Here, θ is the angle between the center line and the line passing through the circle center O. lsp is the distance between characteristic sensing point to the sidewall.
Then extracting the shadow rectangle with edge lengths being dlsp and dθ, the discharge of the shadow rectangle is:
For Equation (5), we integrate dlsp in the direction of y, that is,
According to Equation (3), velocity can be shown as:
where the meaning of lsp and y in Equation (3) are the same.
Substituting Equation (7) to Equation (6), it can get:
Substituting Equation (7) to Equation (4), it can get:
Since , the expression of lsp is obtained by simultaneous combining Equations (8) and (9), that is:
where Ln is the length of the underwater part of the line, e is natural constant and lsp is the distance between characteristic sensing point to the sidewall along the normal line. The characteristic sensing point’ s velocity can represent the average velocity of the measuring line.
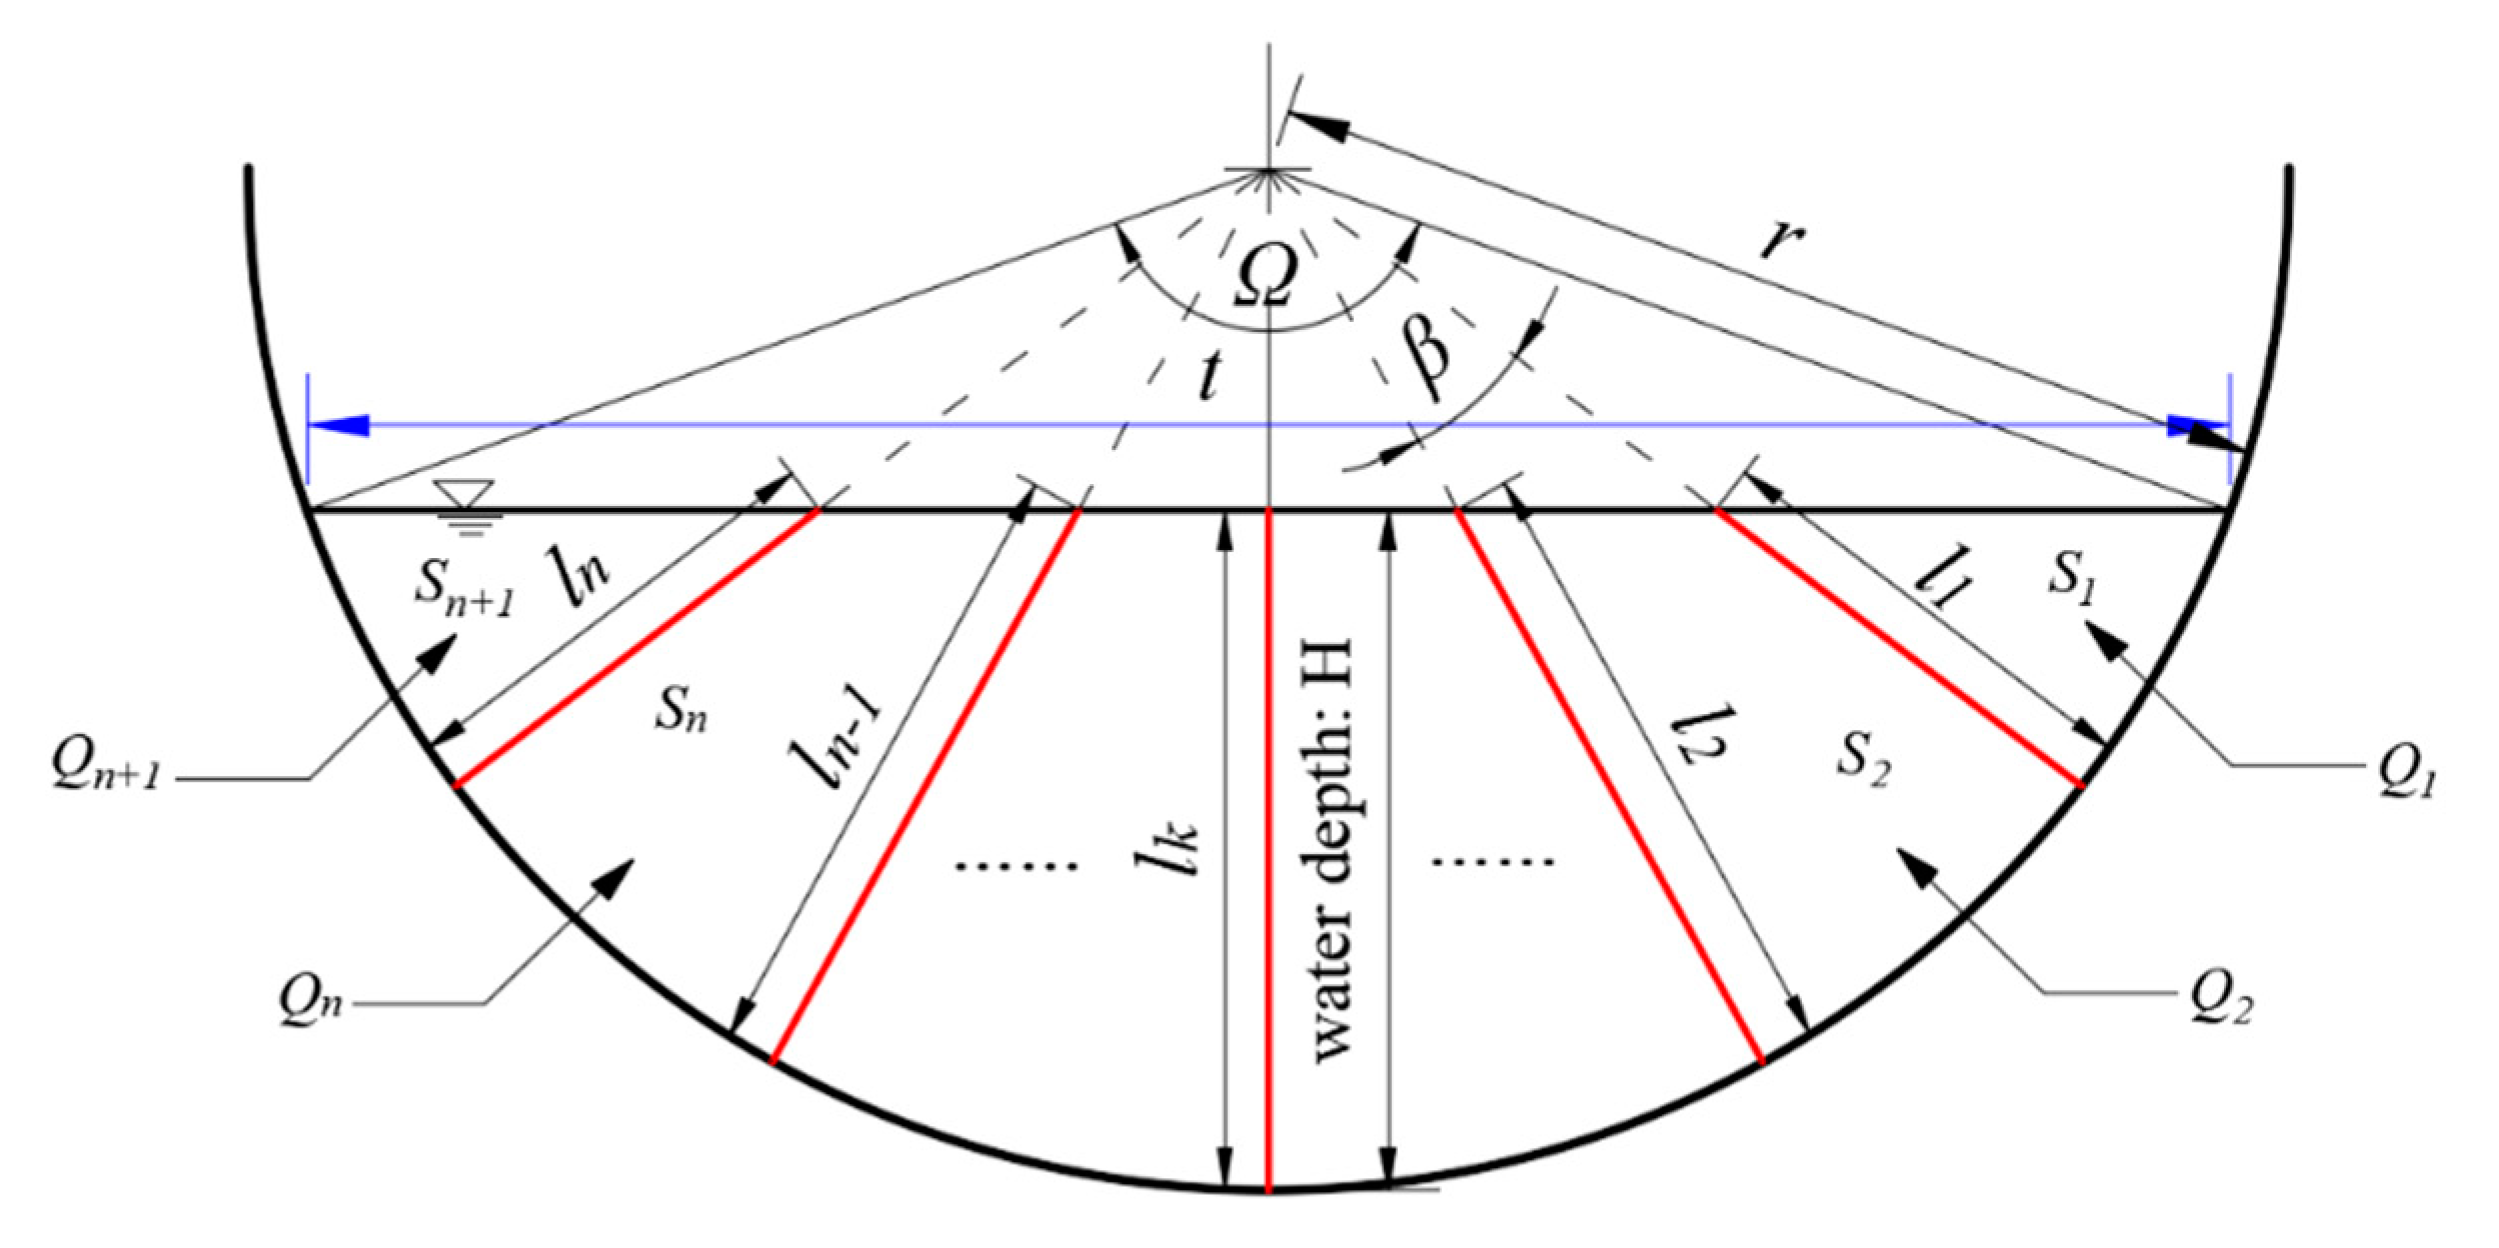
2.2. Derivation of Estimating Discharge through Multiple Characteristic Sensing Points of the Flow-Velocity Sensor
Since we have obtained the location formulation of characteristic sensing point of the flow-velocity sensor in Section 2.1, we can estimate discharge with multiple characteristic sensing points’ velocities through setting numerous measuring lines. As is shown in Figure 3, there are totally n measuring lines equally divided angle Ω, the length of which are l1, l2…ln. The angle between each two lines is β. It can be shown that
where t is the width of water surface, n is the number of measuring lines.
Figure 3.
Diagram of estimating discharge with n-measuring-lines. Here, l1, l2…ln are the lengths of measuring lines. S1, S2…Sn+1 are sub-areas of cross-section. Q1, Q2…Qn+1 are discharges of sub-areas. Ω is the total angle. β is the angle between each two-measuring line. t is the width of water surface.
The hydraulic radius R is expressed as:
The length of the k–th line and the area of the k–th area are, respectively,
The discharge of each region can be shown as:
where is the velocity of characteristic sensing point on the measuring line lk.
Because S1 and Sn+1 are at the edge of channel, the discharge can be estimated separately,
where α is velocity coefficient along the bank, is the velocity of characteristic sensing point on the measuring line l1.
Hence, the discharge Q of channel can be calculated through Equation (15),
3. Experimental Setup
Table 1 has summarized the experimental conditions and relevant parameters of channel. There are three types of channel section in table: semicircular, arc-bottom trapezoidal and U-shaped. The channel cross-sectional shape is shown in Figure 1. In order to increase the reliability, the tests are carried out in different places, such as the Hydraulic Experiment Hall of China Agricultural University (CAU) (Beijing, China), the College of Civil Engineering at the University of Birmingham (UoB) (Birmingham, UK), and the Applied Hydraulics Laboratory at the National Technical University of Athens (NTUA) (Athens, Greece). When the channel bottom slope is certain and the flow is uniform, one discharge Q corresponds to one water depth H. Thus, different groups set up in Table 1 are to ensure that the experiment is carried out under the condition of uniform flow. The experiments conducted in CAU uses the flow velocity measuring sensor such as acoustic doppler velocimetry and propeller. Besides that, the experimental instruments also consist of electromagnetic flowmeter, water pump, water stabilizing equipment, frequency converter, etc. We use these measuring sensors to collect three-dimensional velocity data in the channel from bottom upward along the vertical direction to the water surface. As is shown in Figure 4, all the corners of the lattice are points need to be measured.
Table 1.
Summary of experimental conditions.
Figure 4.
Schematic diagram of measurement points in the experiment (take semicircular channel as an example).
4. Results and Discussion
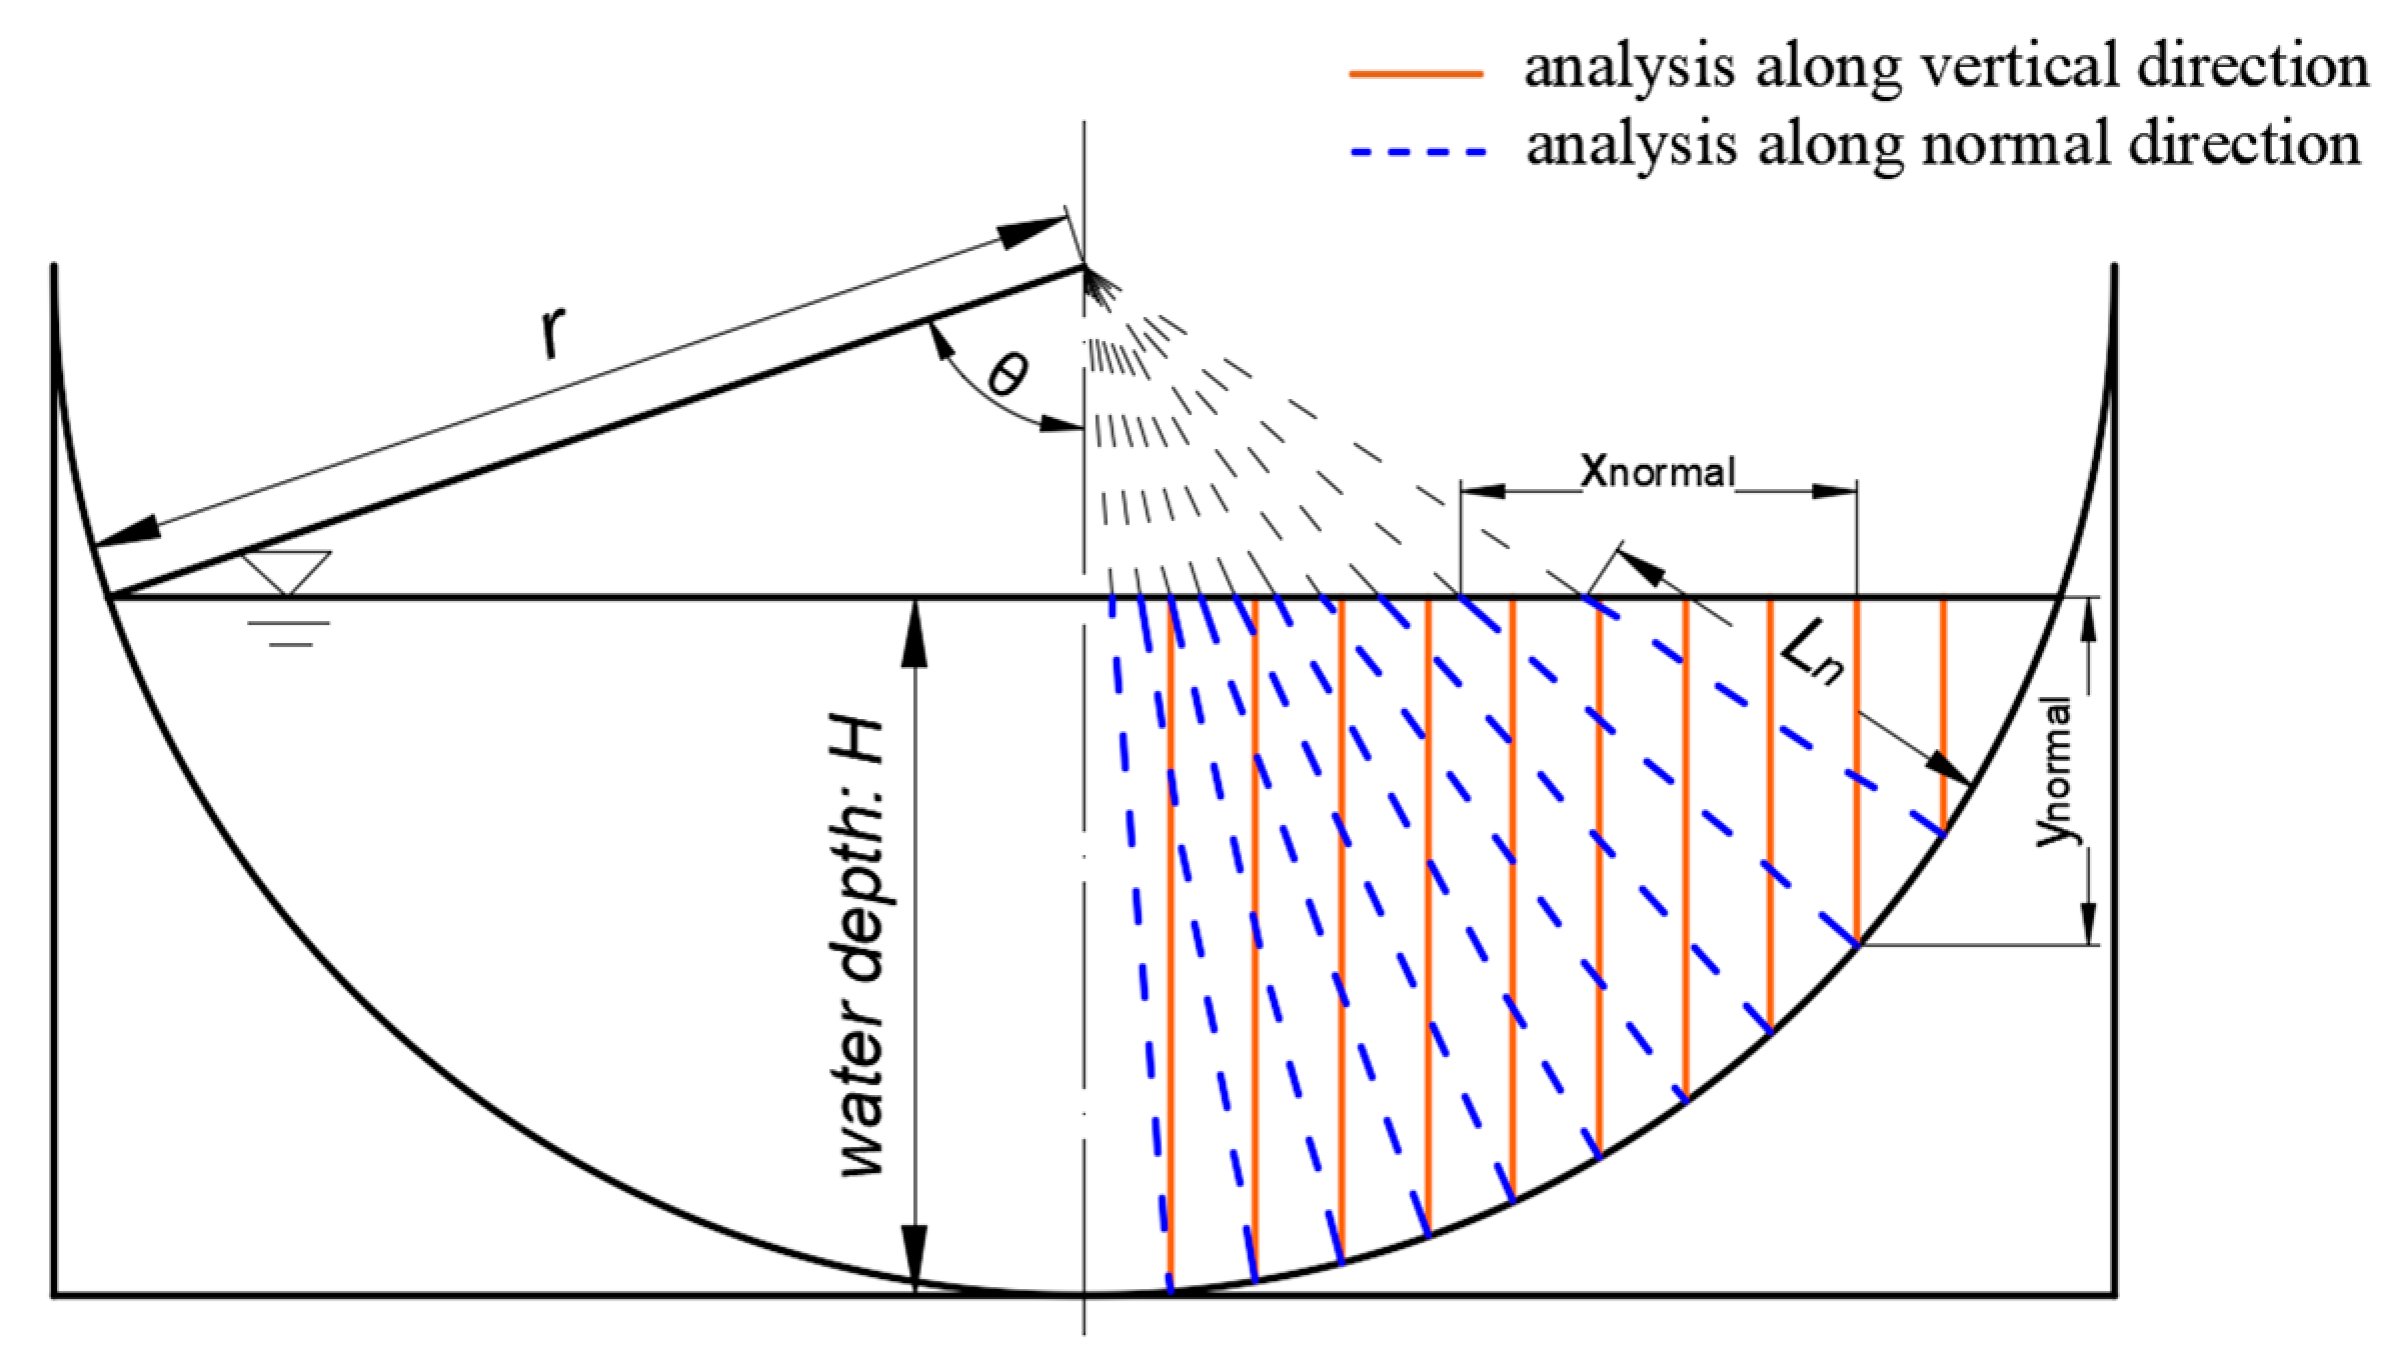
4.1. Analysis along Normal Line Direction
According to Yang and Lim [], they put forward a concept of energy transportation. They proposed that the direction of energy transportation is along the shortest geometric distance, between the source concerned and the boundary.
We used Equation (3) to make a comparative analysis along the vertical direction and the normal direction, respectively under C1 experimental condition. The analysis diagram is shown in Figure 5.
Figure 5.
Analysis along vertical or normal direction (red solid line refers to the vertical direction and blue dotted line refers to the normal direction). Here, xnormal and ynormal are the projection lengths of the line in the horizontal and vertical directions.
Giving a definition formula of normal slope , that is,
where and can be seen in Figure 5.
The calculation formula of the average error value in Table 2 is given by,
where E is the average error value, denotes the experimental value and denotes the theoretical value with the log-law.
Table 2.
Comparison of the application of the log-law in normal and vertical lines, with condition C1: H = 0.0813.
Using Equations (19) and (20), we can verify the application conditions of the log-law Equation (3) from two directions, as is shown in Table 2.
It can be seen from Table 2 that when the measuring velocity and the log-law are analyzed for consistency, the error value obtained along the normal direction is much lower than the error value obtained along the vertical direction. This can prove the correctness of the analysis along the normal line in the arc-bottomed channel.
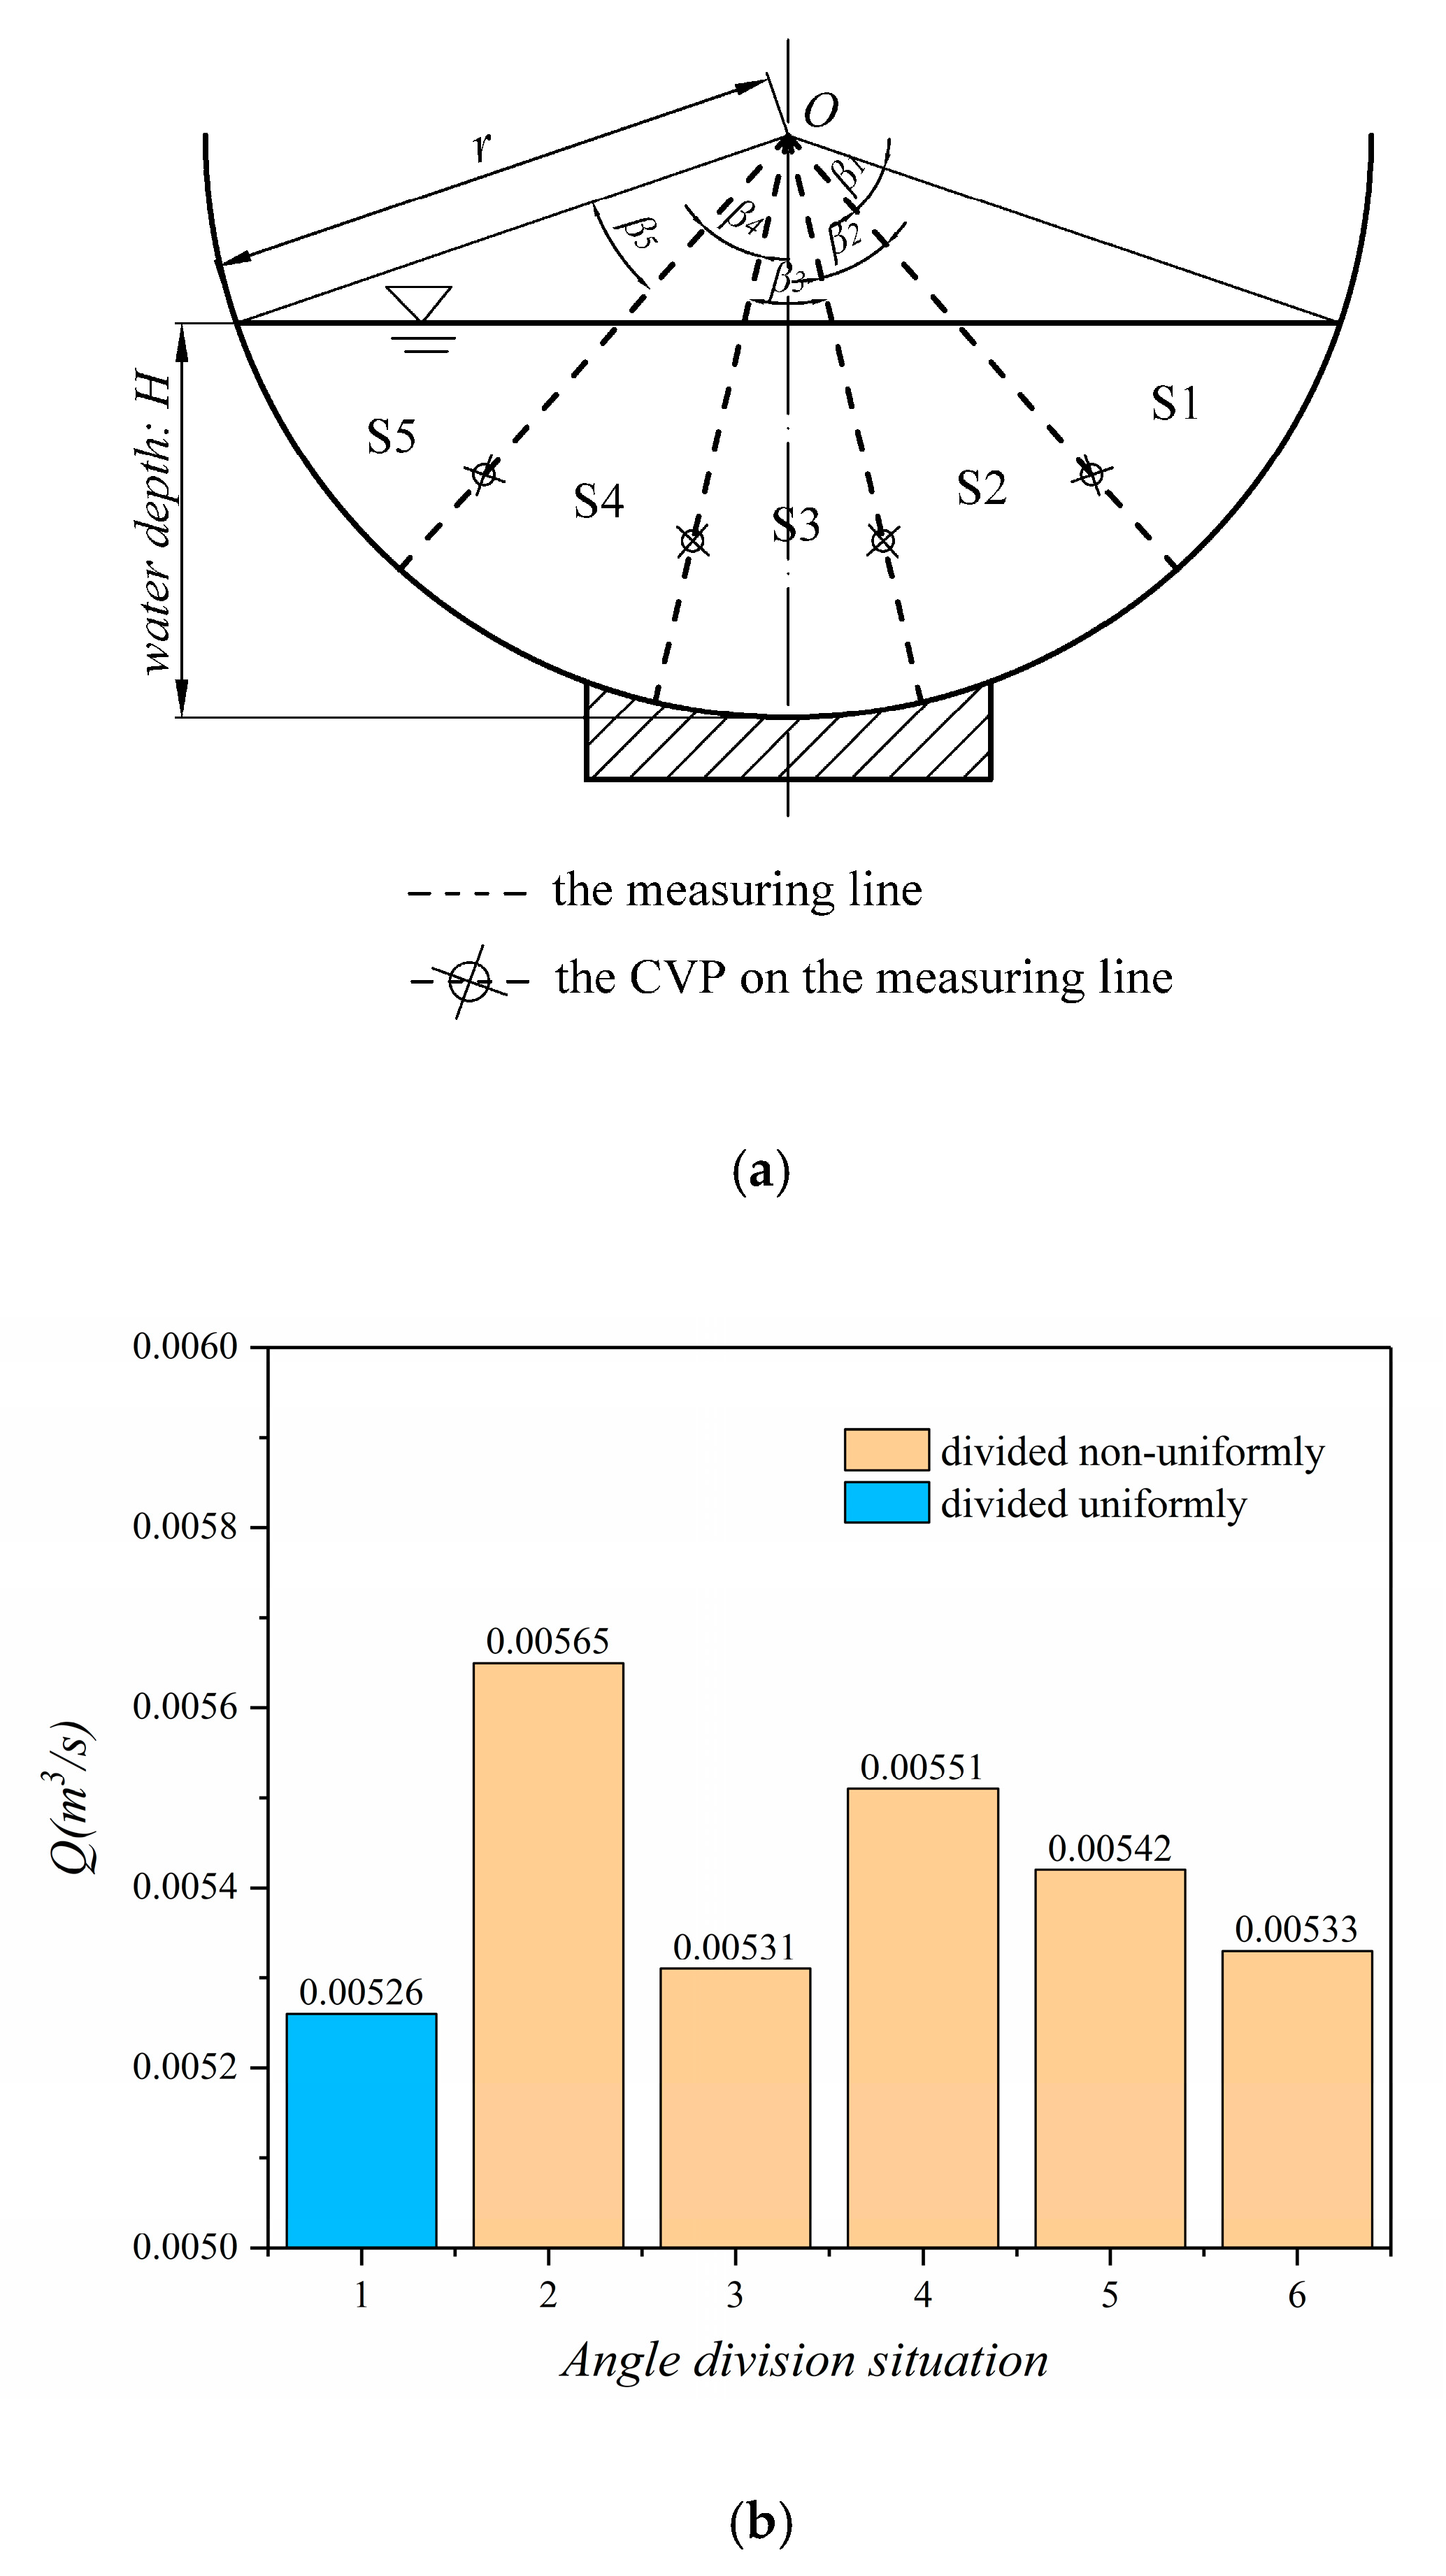
4.2. Multiple Characteristic Sensing Points of the Flow-Velocity Sensor in Arc-Bottom Channel
Figure 6 is the comparison between the measured and theoretical average velocity values under different experimental conditions along normal direction. The Um is the average velocity of each measuring point on the normal line, while Ut is obtained by theoretical calculation. Specifically, the location of characteristic sensing point is calculated by formula first and then the Ut is obtained by substituting the location to log-law.

Figure 6.
Comparison of measured and theoretical mean velocities: (a) T1–T3; (b) U1–U4.
From the comparison chart of mean radial velocity, we can get that the measured value of flow velocity is well-coincident with the theoretical value. Despite some fluctuations in individual test points, most of them are within the 10% error. The statistical rules of these data points can still prove the accuracy of the theoretical formula in Section 2.1. Thus, the velocity of characteristic sensing point is considered to represent the average velocity of normal direction.
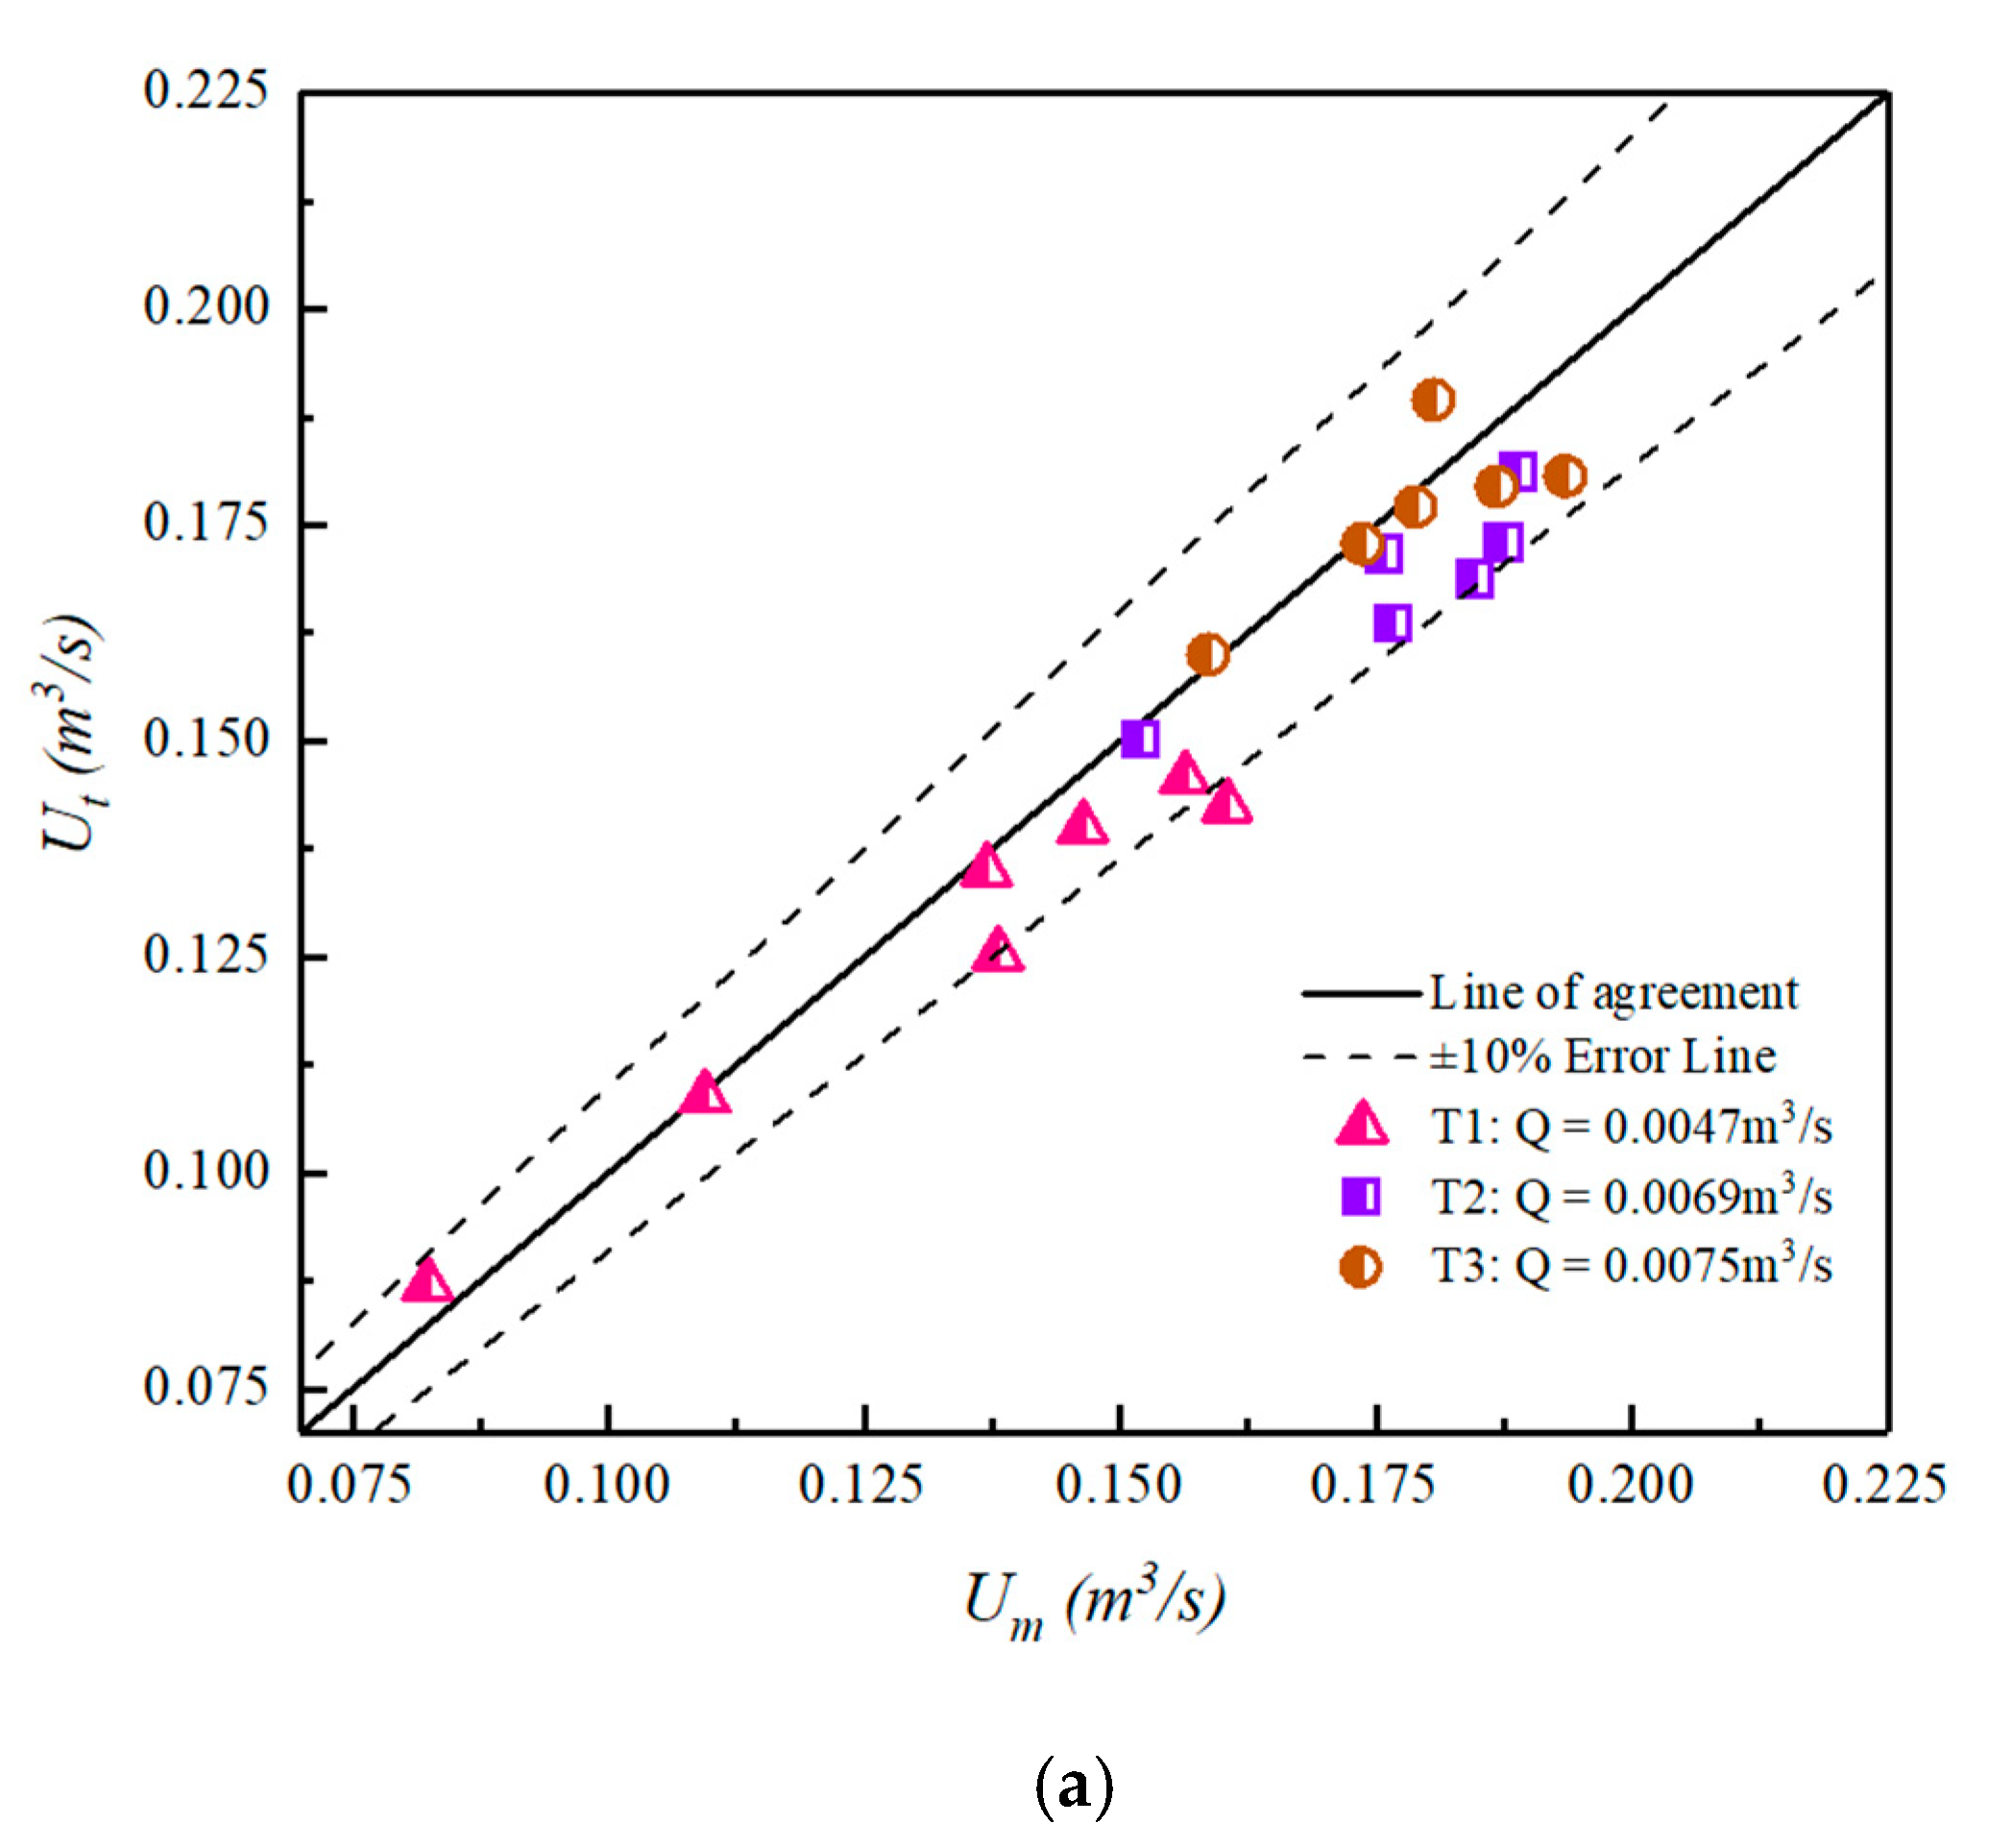
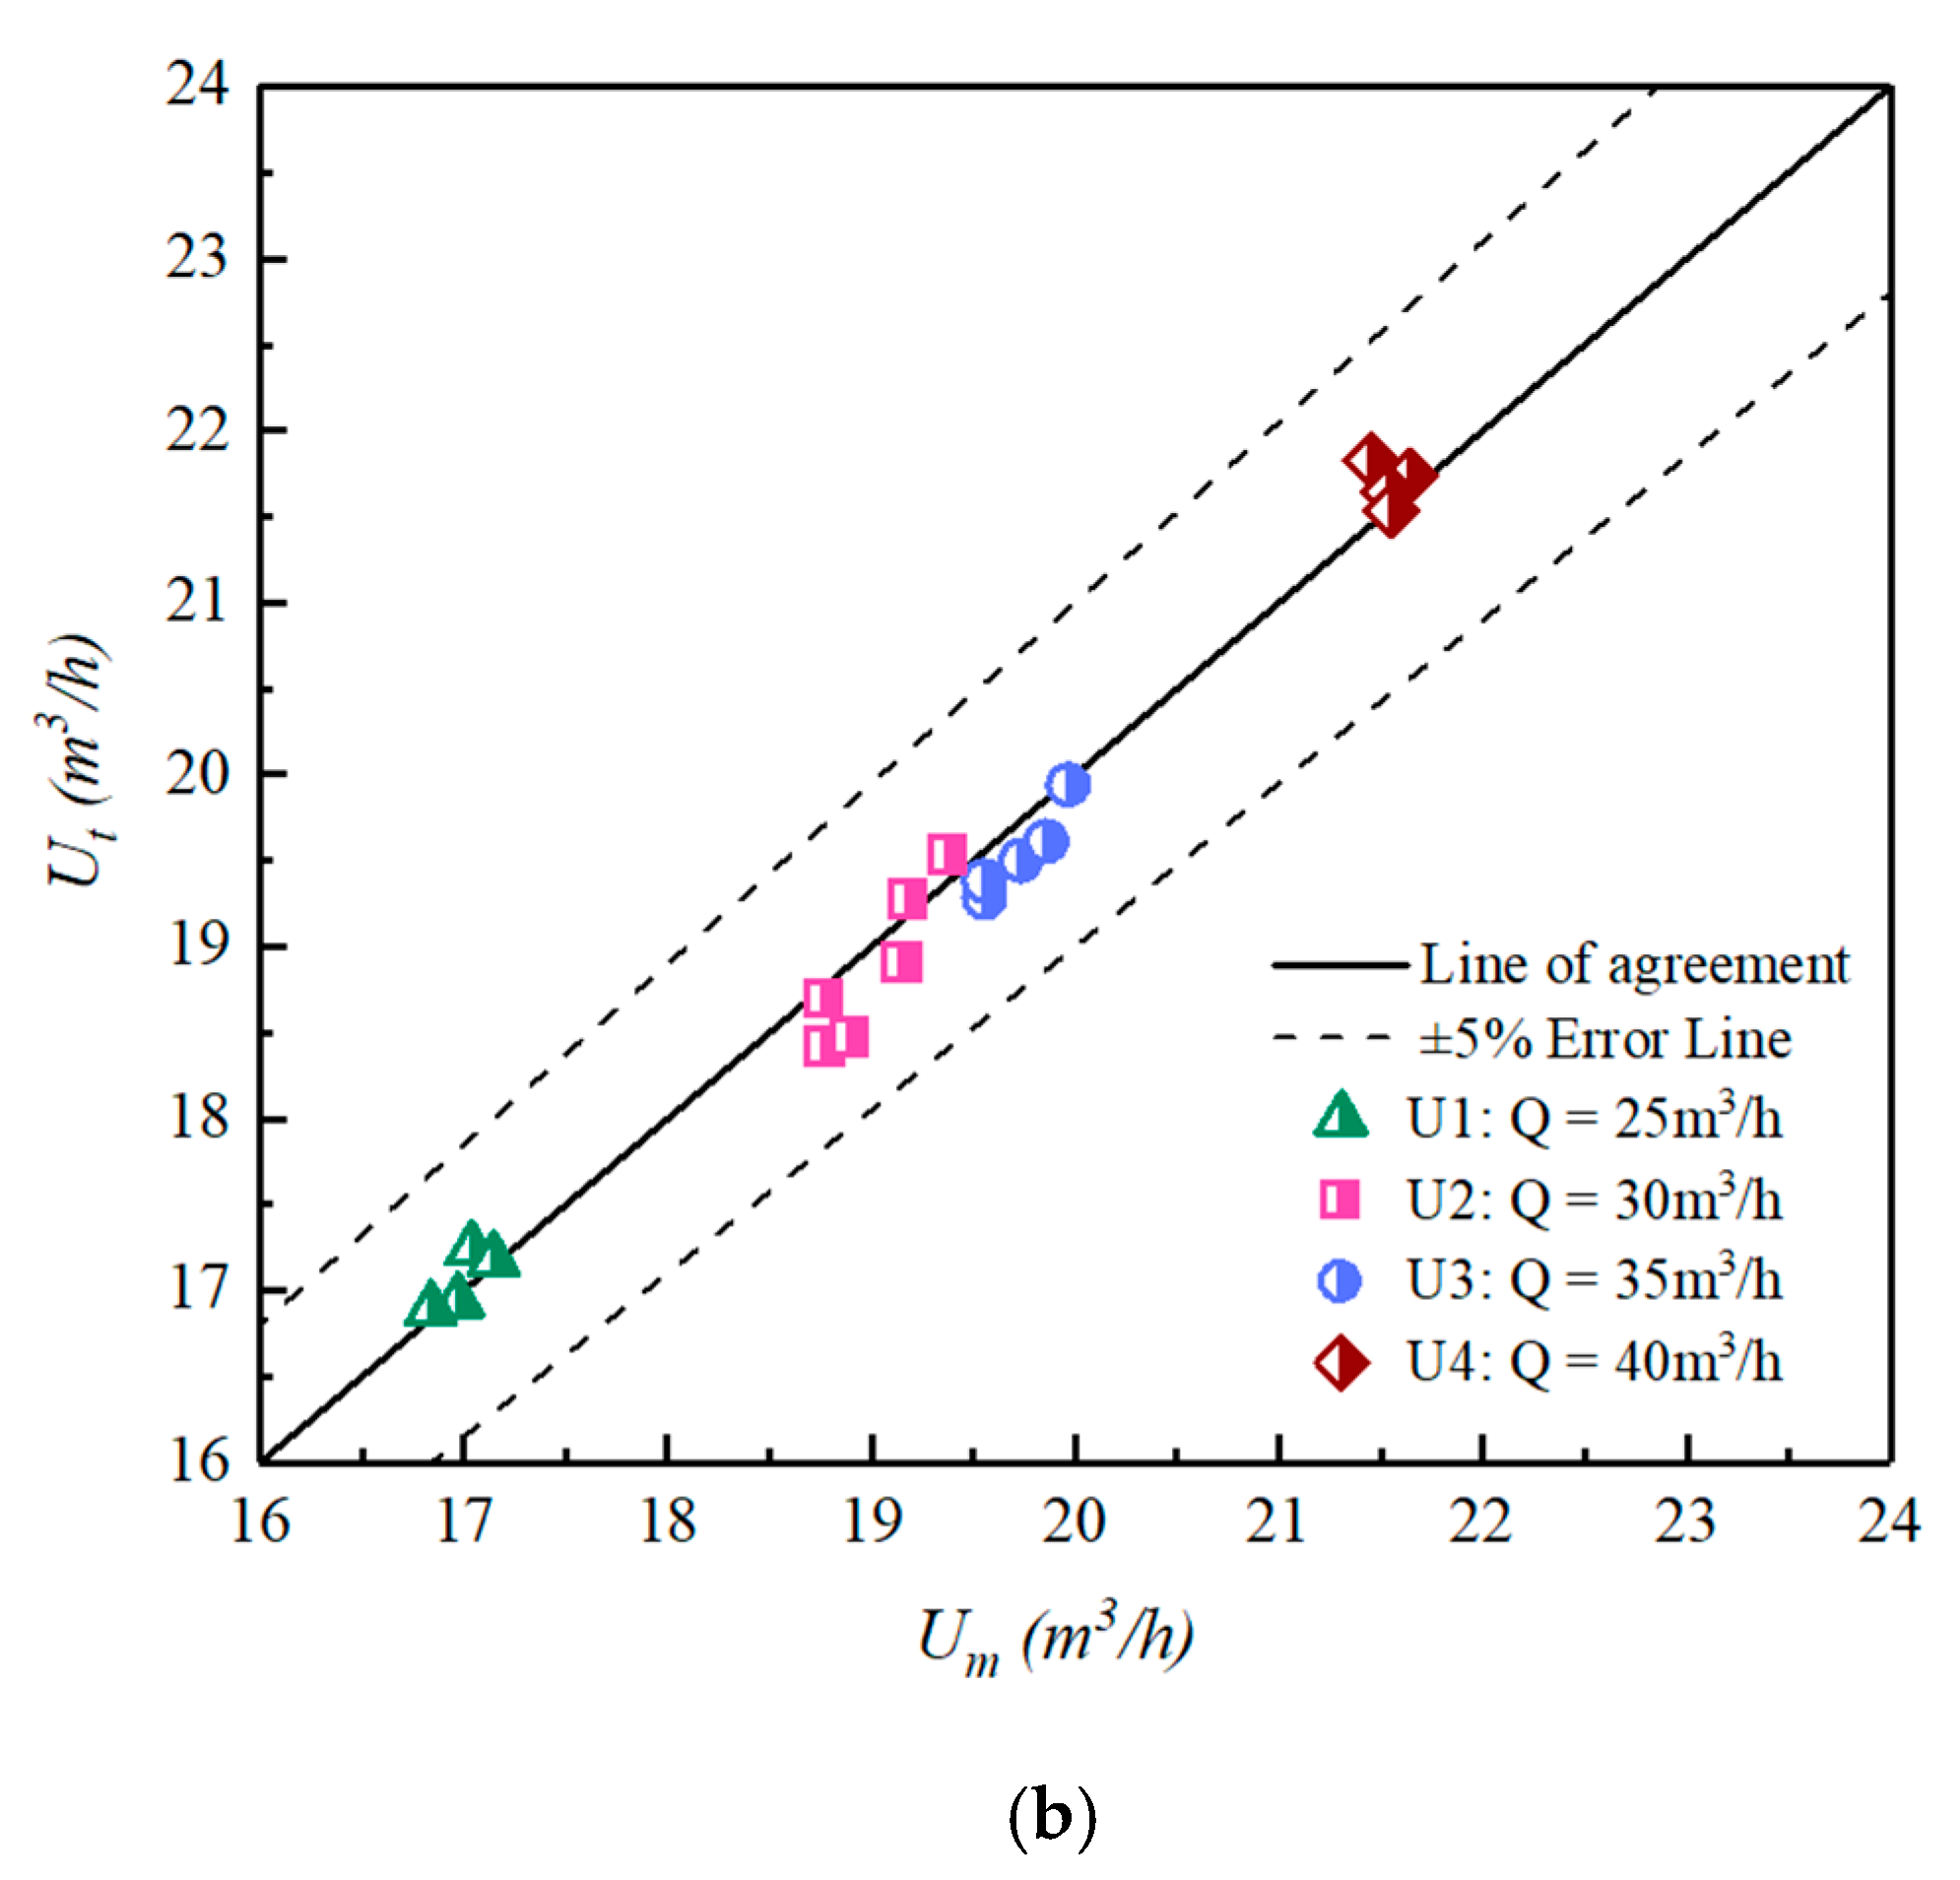
4.3. Estimating Discharge through Multiple Characteristic Sensing Points of the Flow-Velocity Sensor
As can be seen from the above, the calculation formula of discharge has been given in Section 2.2. As is shown in Figure 7, for C2 experimental condition, we set four combinations of measuring lines.
Figure 7.
Schematic diagram of flow measurement with different number of measuring lines (C2).
When only one measuring line is used to calculate the cross-section discharge, the measurement result is smaller than the displayed result on the flowmeter, which the relative error is 21.61%. Then, when two measuring lines are set on the cross-section, the relative error is reduced to 9.91%. The relative error is 4.18% when the number of measuring lines is increased to three and 2.95% when the number of measuring lines is four. We can conclude that the number of measuring lines is directly related to the discharge calculation in arc-bottom channel. It can be inferred that with the increase of the number of measuring lines, the relative error between the calculated discharge and actual discharge will be decreasing.
Then, the analysis is based on fixing the number of measuring lines and change the angle β between them. We take the C1 condition as the example. As is shown in Figure 8a, there are four measuring lines and the angles are randomly divided. Since Q = 0.005 m3/s in C1, Figure 8b shows that only the angle is divided uniformly, the calculated discharge is closest to the actual discharge.
Figure 8.
Estimating discharge of different angle combinations of four measuring lines (C1): (a) The angle Ω is divided to different sub-angles with four measuring lines. (b) The relationship between angle division situation and calculated discharge.
Therefore, considering the relative error and operability and simplicity in practice, we conclude that a 4-line method is most suitable for measuring discharge in arc-bottom open channel.
5. Conclusions
This study has proposed a new algorithm of estimating discharge of channels through sensors in irrigation area. The principal achievements are summarized below.
- (1)
- We compared the log-law along the normal direction and along the vertical direction. The results show the accuracy with the normal direction. We thought that the analysis should be carried out along the normal direction in the arc-bottomed channel rather than vertical direction,
- (2)
- Based on the log-law, the theoretical expression for calculating the locations of multiple characteristic sensing points in arc-bottom open channel is derived through the formula transformation. Then, we give the mathematical formula to calculate the discharge of the arc-bottomed channels. We can use sensors to measure the velocity of these characteristic sensing points and obtain the discharge. The correctness of the formula for multiple characteristic sensing points in arc-bottom channels is proved by numerous experimental data;
- (3)
- To prove the validity of the flow calculation formula, we estimate the discharge by setting different measuring lines. Compared with the measuring discharge, the calculating discharge can match well. Moreover, the number of measuring lines is positively correlated with the accuracy of flow measurement. When the angles between lines are the same, the number of measuring lines is positively correlated with the accuracy of flow measurement. When the number of measuring lines is fixed, the accuracy of angle uniformity is higher than that of nonuniformity.
Estimating channel discharge can better control the water consumption of irrigation area and regulate the water use of canal system. The multiple characteristic sensing points of the flow-velocity sensor and flow formula proposed by this study provide a theoretical basis for simplifying and quickly estimating the discharge of the arc-bottomed channel. It is an indispensable part of irrigation water management, which has practice-oriented significance in agricultural water management.
Author Contributions
Conceptualization, Y.H., J.C. and T.L.; methodology, S.W. and T.L.; software, J.C., S.W. and T.L.; validation, Y.H., and T.L.; writing—original draft preparation, T.L. and Y.H.; Writing—review & editing, Y.H. and S.W.; project administration, Y.H.; funding acquisition, Y.H. and J.C. All authors have read and agreed to the published version of the manuscript.
Funding
This research was supported in part by the National Natural Science Foundation of China, grant No. 51979275, by the National Key Research and Development Program of China under grant Nos. 2017YFC0403203 and 2017YFD0701003, by the Jilin Province Key Research and Development Plan Project under grant No. 20180201036SF, by the Open Fund of Synergistic Innovation Center of Jiangsu Modern Agricultural Equipment and Technology, Jiangsu University, under grant No. 4091600015, by the Open Research Fund of State Key Laboratory of Information Engineering in Surveying, Mapping and Remote Sensing, Wuhan University, under grant No. 19R06 and by the Open Research Project of the State Key Laboratory of Industrial Control Technology, Zhejiang University, China, under grant No. ICT20021.
Acknowledgments
The authors are very grateful for the funding support.
Conflicts of Interest
The authors declare no conflict of interest.
References
- Yang, S.Q.; Han, Y.; Dharmasiri, N. Flow resistance over fixed roughness elements. J. Hydraul. Res. 2011, 49, 257–262. [Google Scholar] [CrossRef]
- An, P.; Xing, Y.C.; Zhang, A.J.; Zhao, L.; Cheng, D.W. Optimal analysis of anti-frost heaping canal with cross section of trapezoidal slopes and curved bed. J. Irrig. Drain. 2017, 36, 56–62. [Google Scholar]
- Han, Y.; Yang, S.Q.; Sivakumar, M.; Qiu, L.C. Investigation of velocity distribution in open channel flows based on conditional average of turbulent structures. Math. Probl. Eng. 2017, 2017, 9. [Google Scholar] [CrossRef]
- Von Kármán, T. Turbulence and skin friction. J. Aeronaut. Sci. 1934, 1–20. [Google Scholar]
- Keulegan, G.H. Laws of turbulent flow in open channels. J. Res. Natl. Bur. Stand. 1938, 21, 707–741. [Google Scholar] [CrossRef]
- Liu, C.J.; Li, D.X.; Wang, X.K. Experimental study on friction velocity and velocity profile of open channel flow. J. Hydraul. Eng. 2005, 36, 950–955. [Google Scholar]
- Nikuradse, J. Laws of Flow in Rough Pipes. 1950. Available online: https://ntrs.nasa.gov/search.jsp?R=19930093938 (accessed on 21 May 2020).
- Cardoso, A.H.; Graf, W.H.; Gust, G. Uniform-flow in a smooth open channel. J. Hydraul. Res. 1989, 27, 606–616. [Google Scholar] [CrossRef]
- Steffler, P.M.; Rajaratnam, N.; Peterson, A.W. LDA measurements in open channel. J. Hydraul. Div. Am. Soc. Civ. Eng. 1985, 111, 119–130. [Google Scholar] [CrossRef]
- Nezu, I.; Rodi, W. Open-channel flow measurements with a Laser Doppler Anemometer. J. Hydraul. Eng. 1986, 112, 335–355. [Google Scholar] [CrossRef]
- Dey, S. Free overall in circular channels with flat base: A method of open channel flow measurement. Flow Meas. Instrum. 2002, 13, 209–221. [Google Scholar] [CrossRef]
- Yang, S.H.; Han, J.X.; Peng, S.Z.; Han, D. Analysis and experiment of distribution properties and its application of velocity in U-shaped open channel. Trans. Chin. Soc. Agric. Mach. 2012, 43, 92–96. [Google Scholar]
- Hu, H.; Huang, J.S.; Qian, Z.D.; Huai, W.X.; Yu, G.J. Hydraulic analysis of parabolic fume for flow measurement. Flow Meas. Instrum. 2014, 37, 54–64. [Google Scholar] [CrossRef]
- Samani, Z. Three simple flumes for flow measurement in open channels. J. Irrig. Drain. Div. Am. 2017, 143, 04017010. [Google Scholar] [CrossRef]
- Mohammadzadeh-Habili, J.; Heidarpour, M.; Afzalimehr, H. Hydraulic characteristics of a new weir entitled of quarter-circular crested weir. Flow Meas. Instrum. 2013, 33, 168–178. [Google Scholar] [CrossRef]
- Vatankhah, A.R.; Ghaderinia, H. Semi-circular flap gate as a flow metering structure in circular channel. Flow Meas. Instrum. 2018, 64, 28–38. [Google Scholar] [CrossRef]
- Yang, S.Q.; Lim, S.Y. Mechanism of energy transportation and turbulent flow in a 3D channel. J. Hydraul. Div. Am. Soc. Civ. Eng. 1997, 123, 684–692. [Google Scholar] [CrossRef]
- Knight, D.W.; Sterling, M. Boundary shear in circular pipes running partially full. J. Hydraul. Div. Am. Soc. Civ. Eng. 2000, 126, 263–275. [Google Scholar] [CrossRef]
- Demetriou, J.D.; Nanou-Giannarou, A.I. Water conveyance in channels with semi-circular cross sections. Agric. Water Manag. 1988, 13, 273–283. [Google Scholar] [CrossRef]
© 2020 by the authors. Licensee MDPI, Basel, Switzerland. This article is an open access article distributed under the terms and conditions of the Creative Commons Attribution (CC BY) license (http://creativecommons.org/licenses/by/4.0/).