Metabolt: An In-Situ Instrument to Characterize the Metabolic Activity of Microbial Soil Ecosystems Using Electrochemical and Gaseous Signatures


Abstract

1. Introduction
- mimic natural growth conditions;
- register information associated with time variability;
- allow investigating spatial differentiation and different experimental conditions;
- monitor in a non-invasive, non-specific, and large-scale way, the metabolic activity of a system; and
- monitor the gaseous interchange with the atmosphere.
2. Materials and Methods
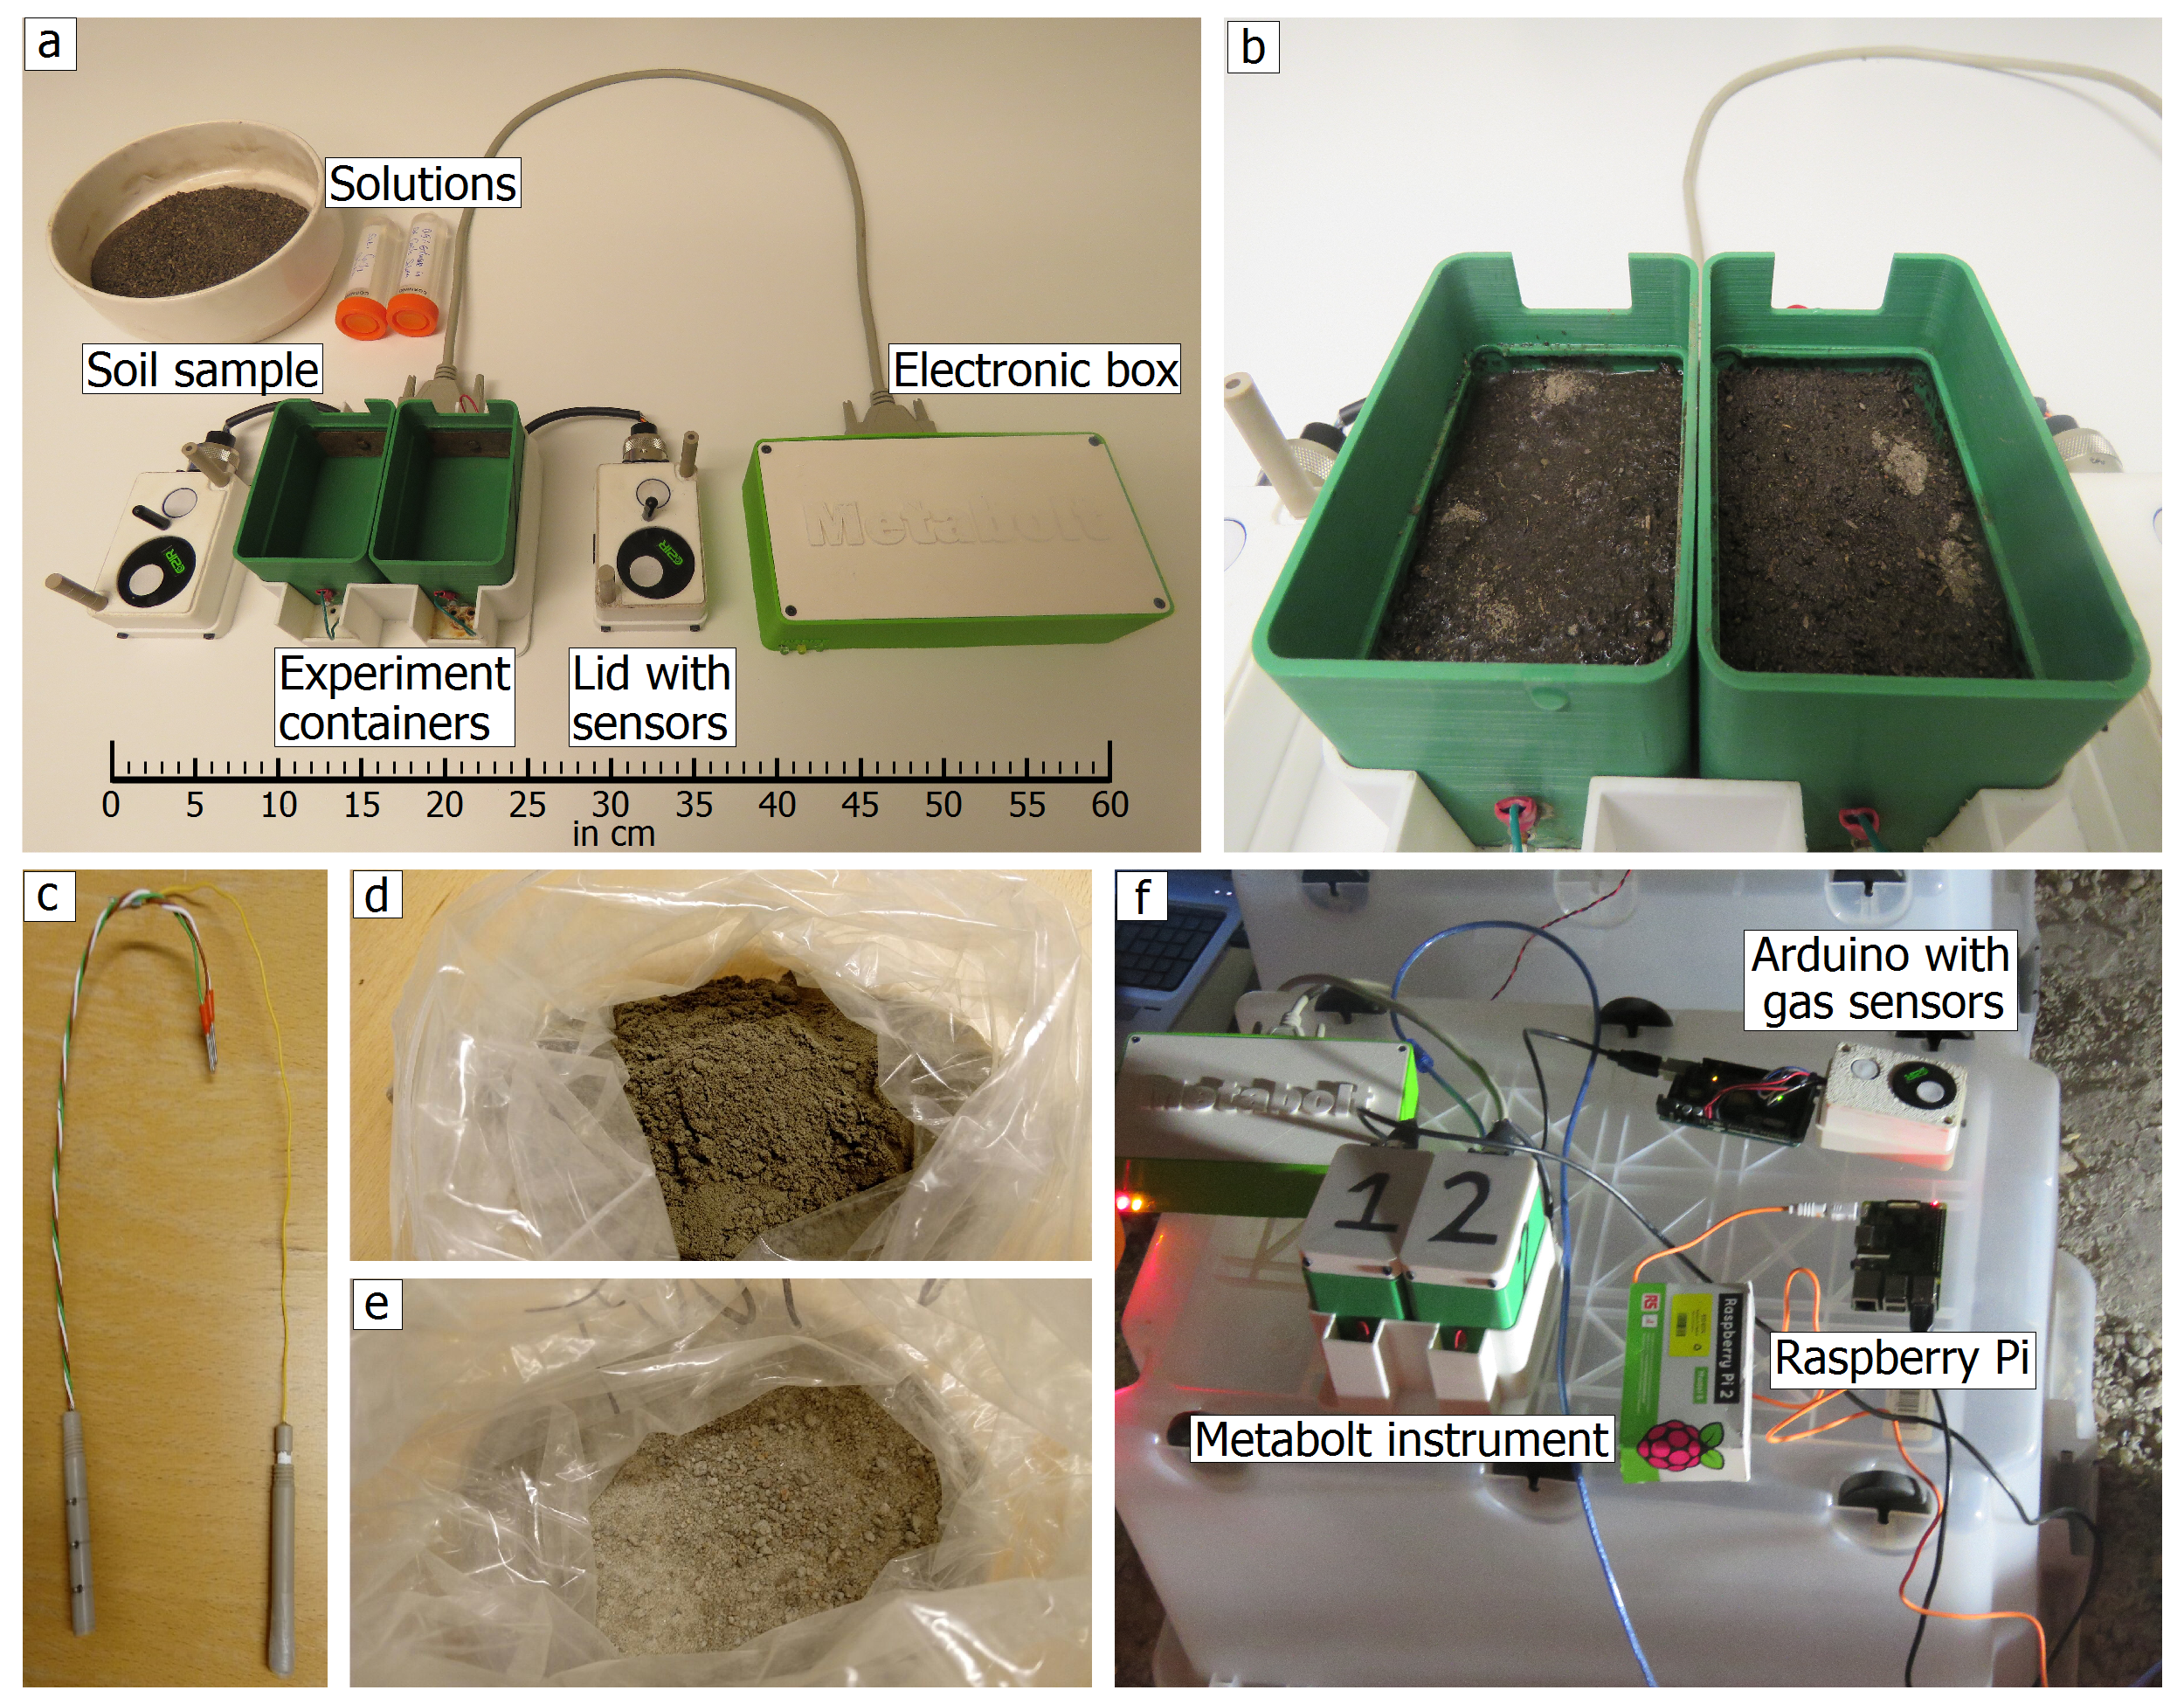
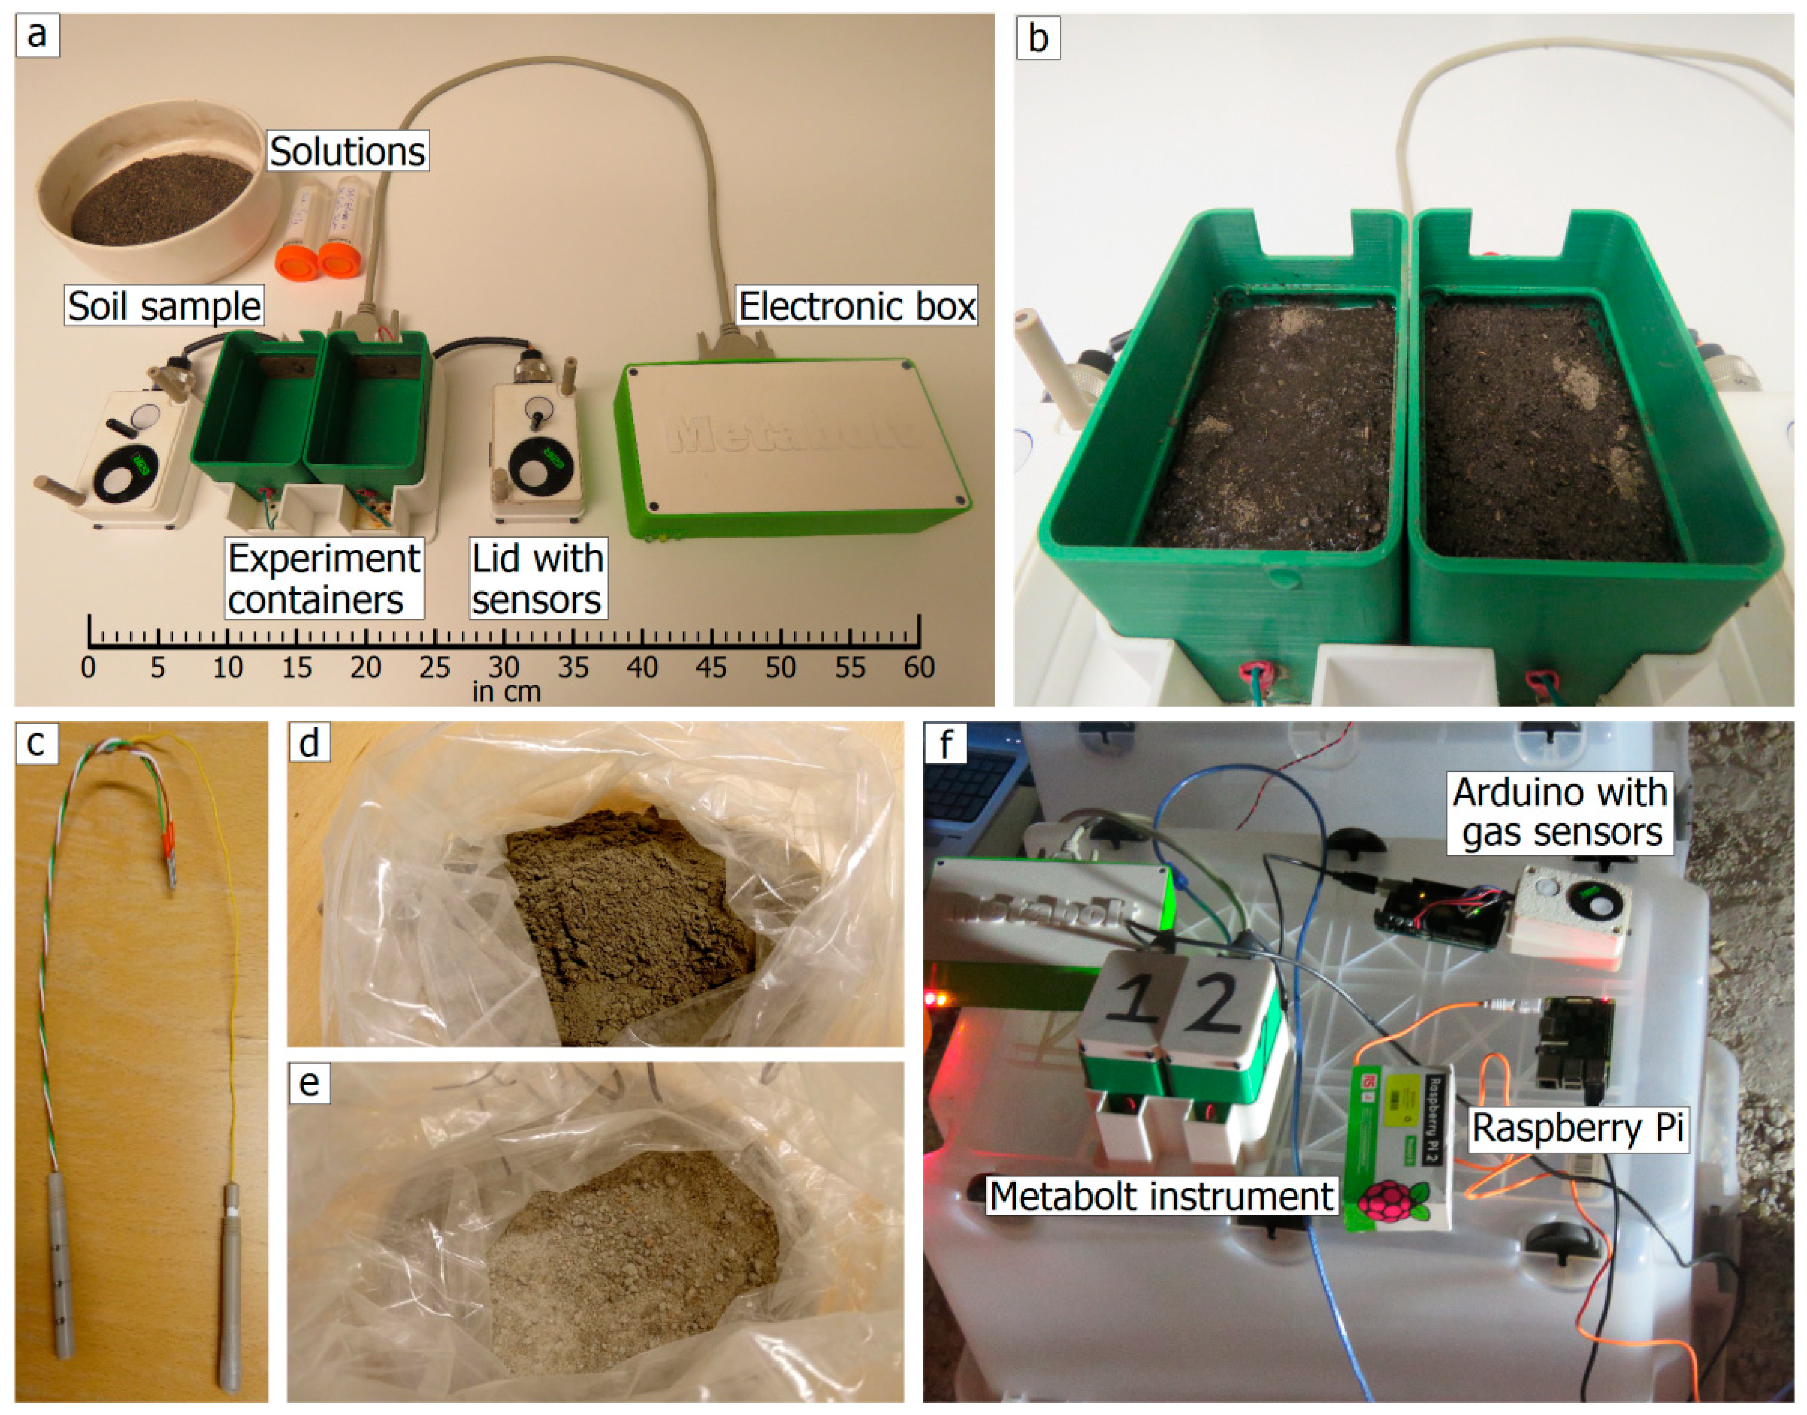
2.1. The Instrument
2.2. Sensor Calibration Procedure
2.3. Sample Preparation
2.4. Experimental Setup
2.5. Measurements, Data Sampling, and Data Treatment
3. Results
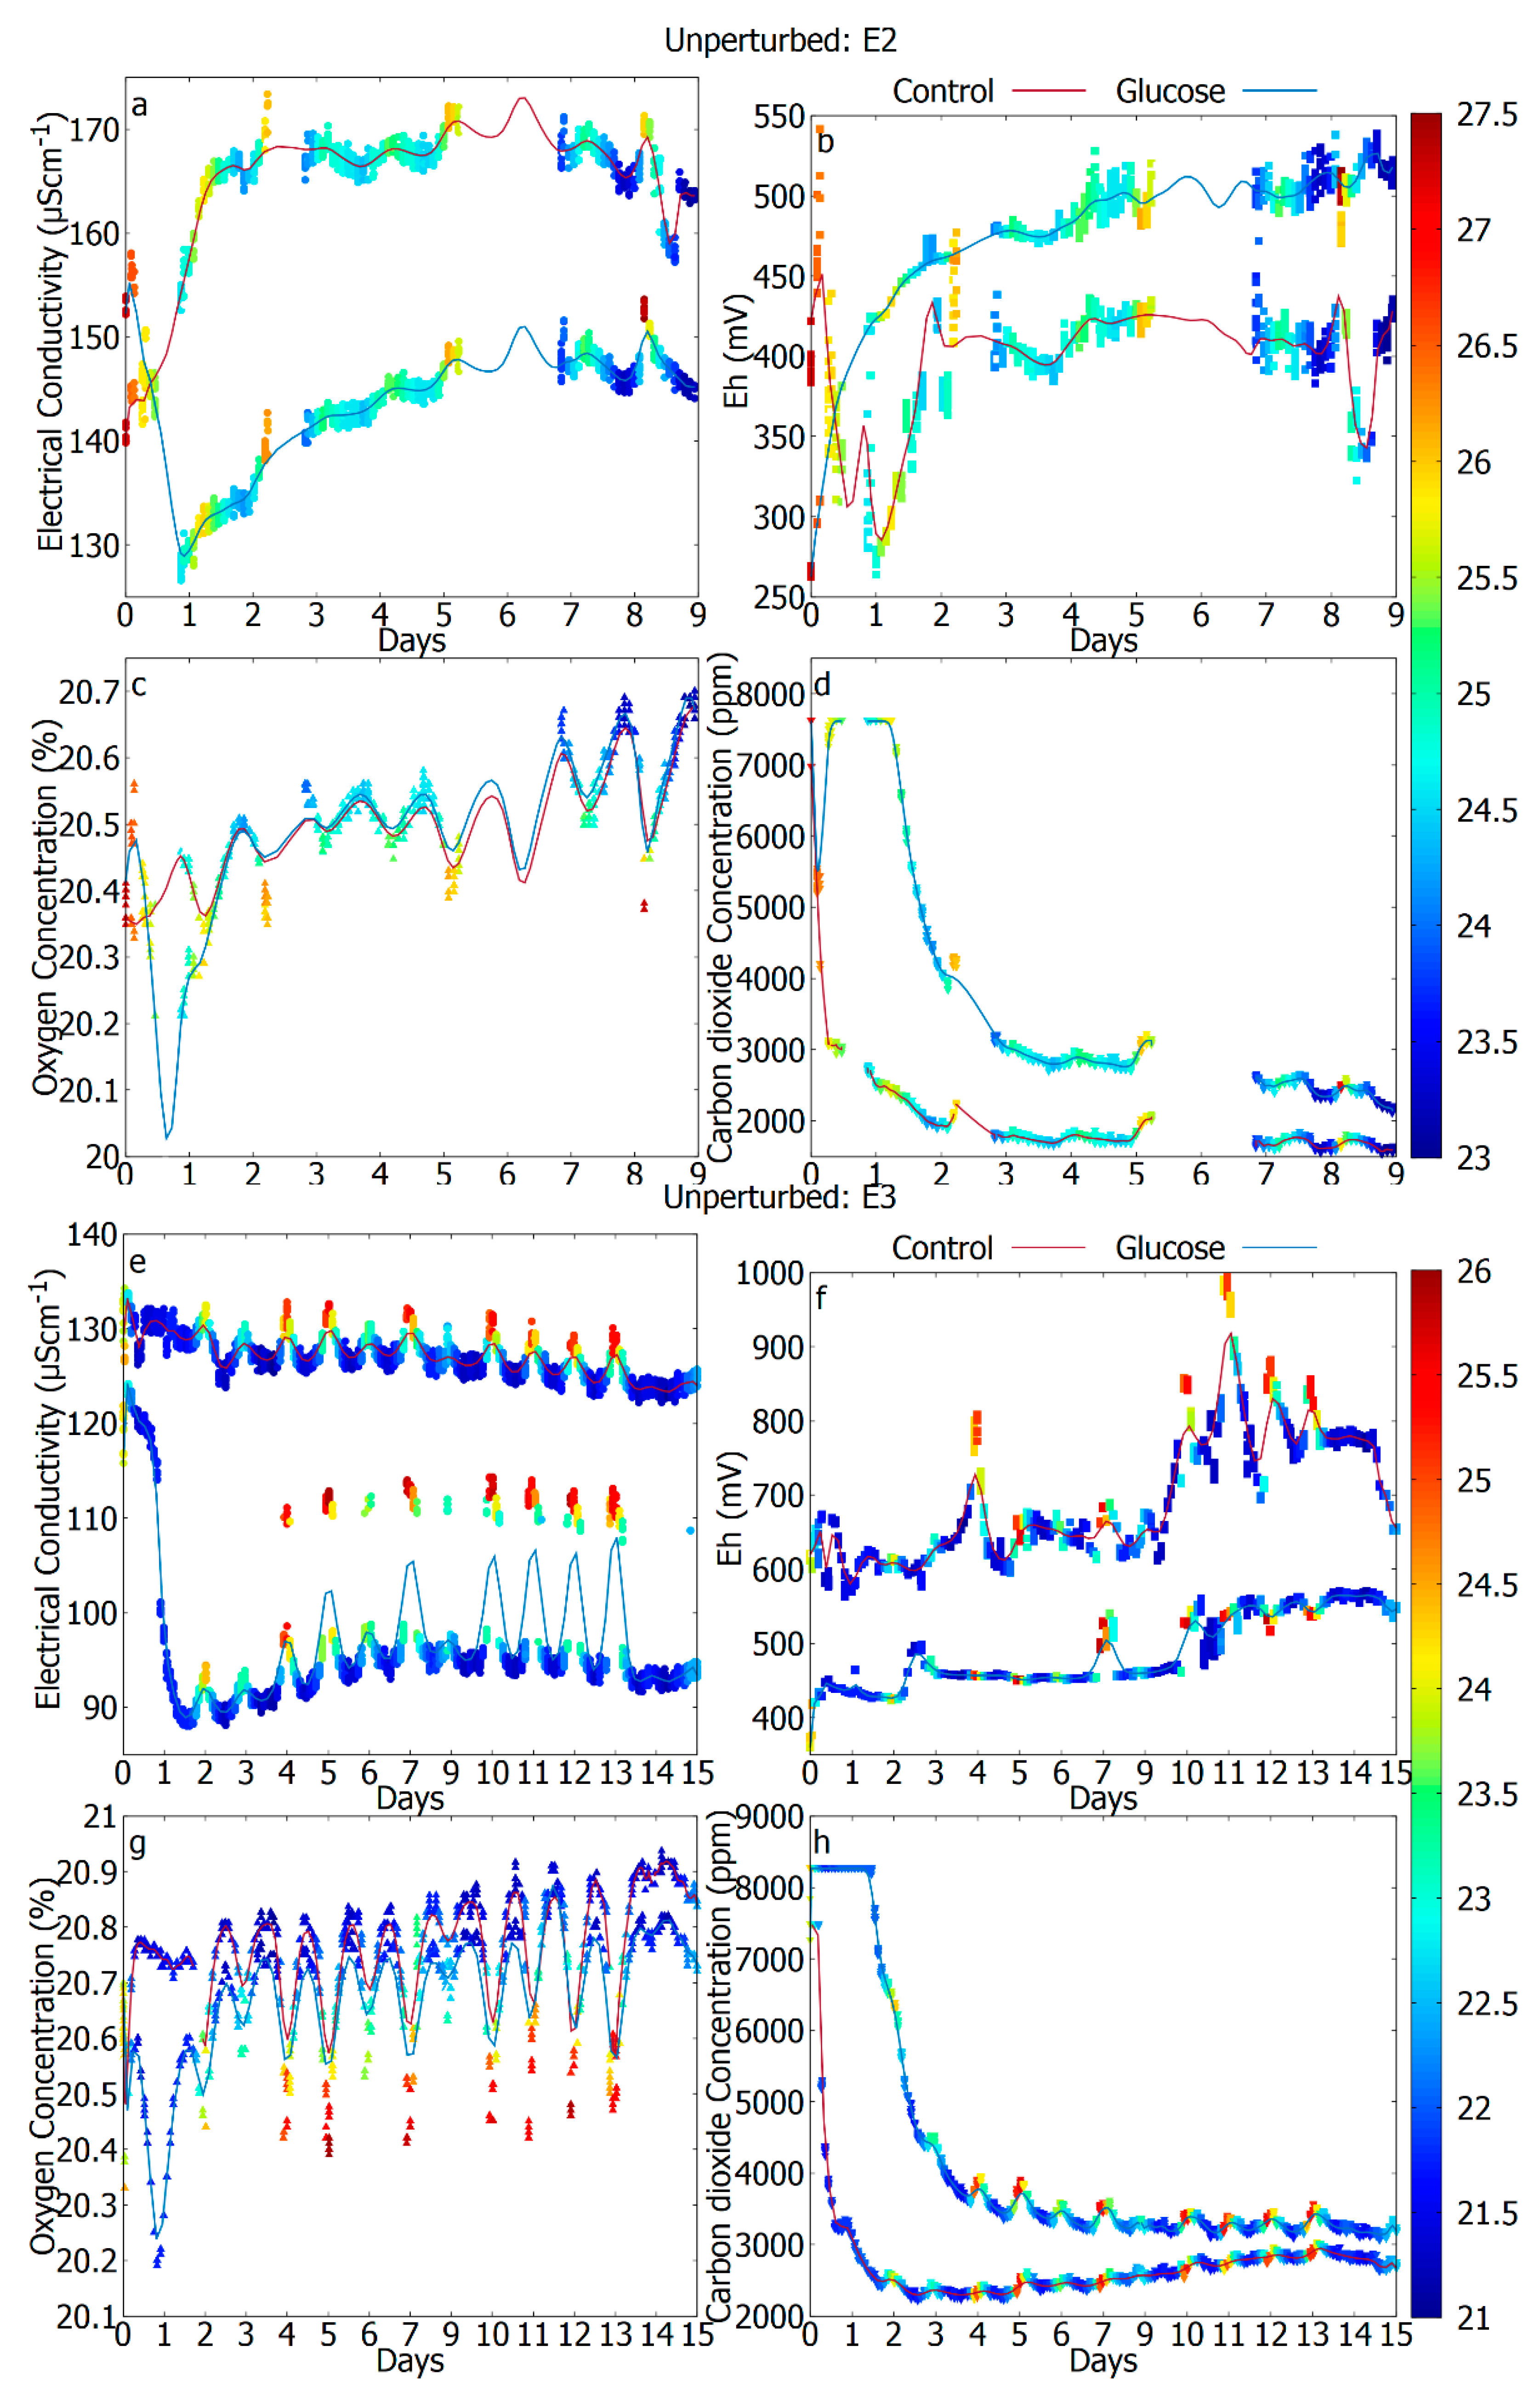
3.1. Gaseous Signatures as a Footprint of Metabolic Activity through Respiration
3.2. Electrochemical Signatures as a Potential Indicator of Microbial Metabolism
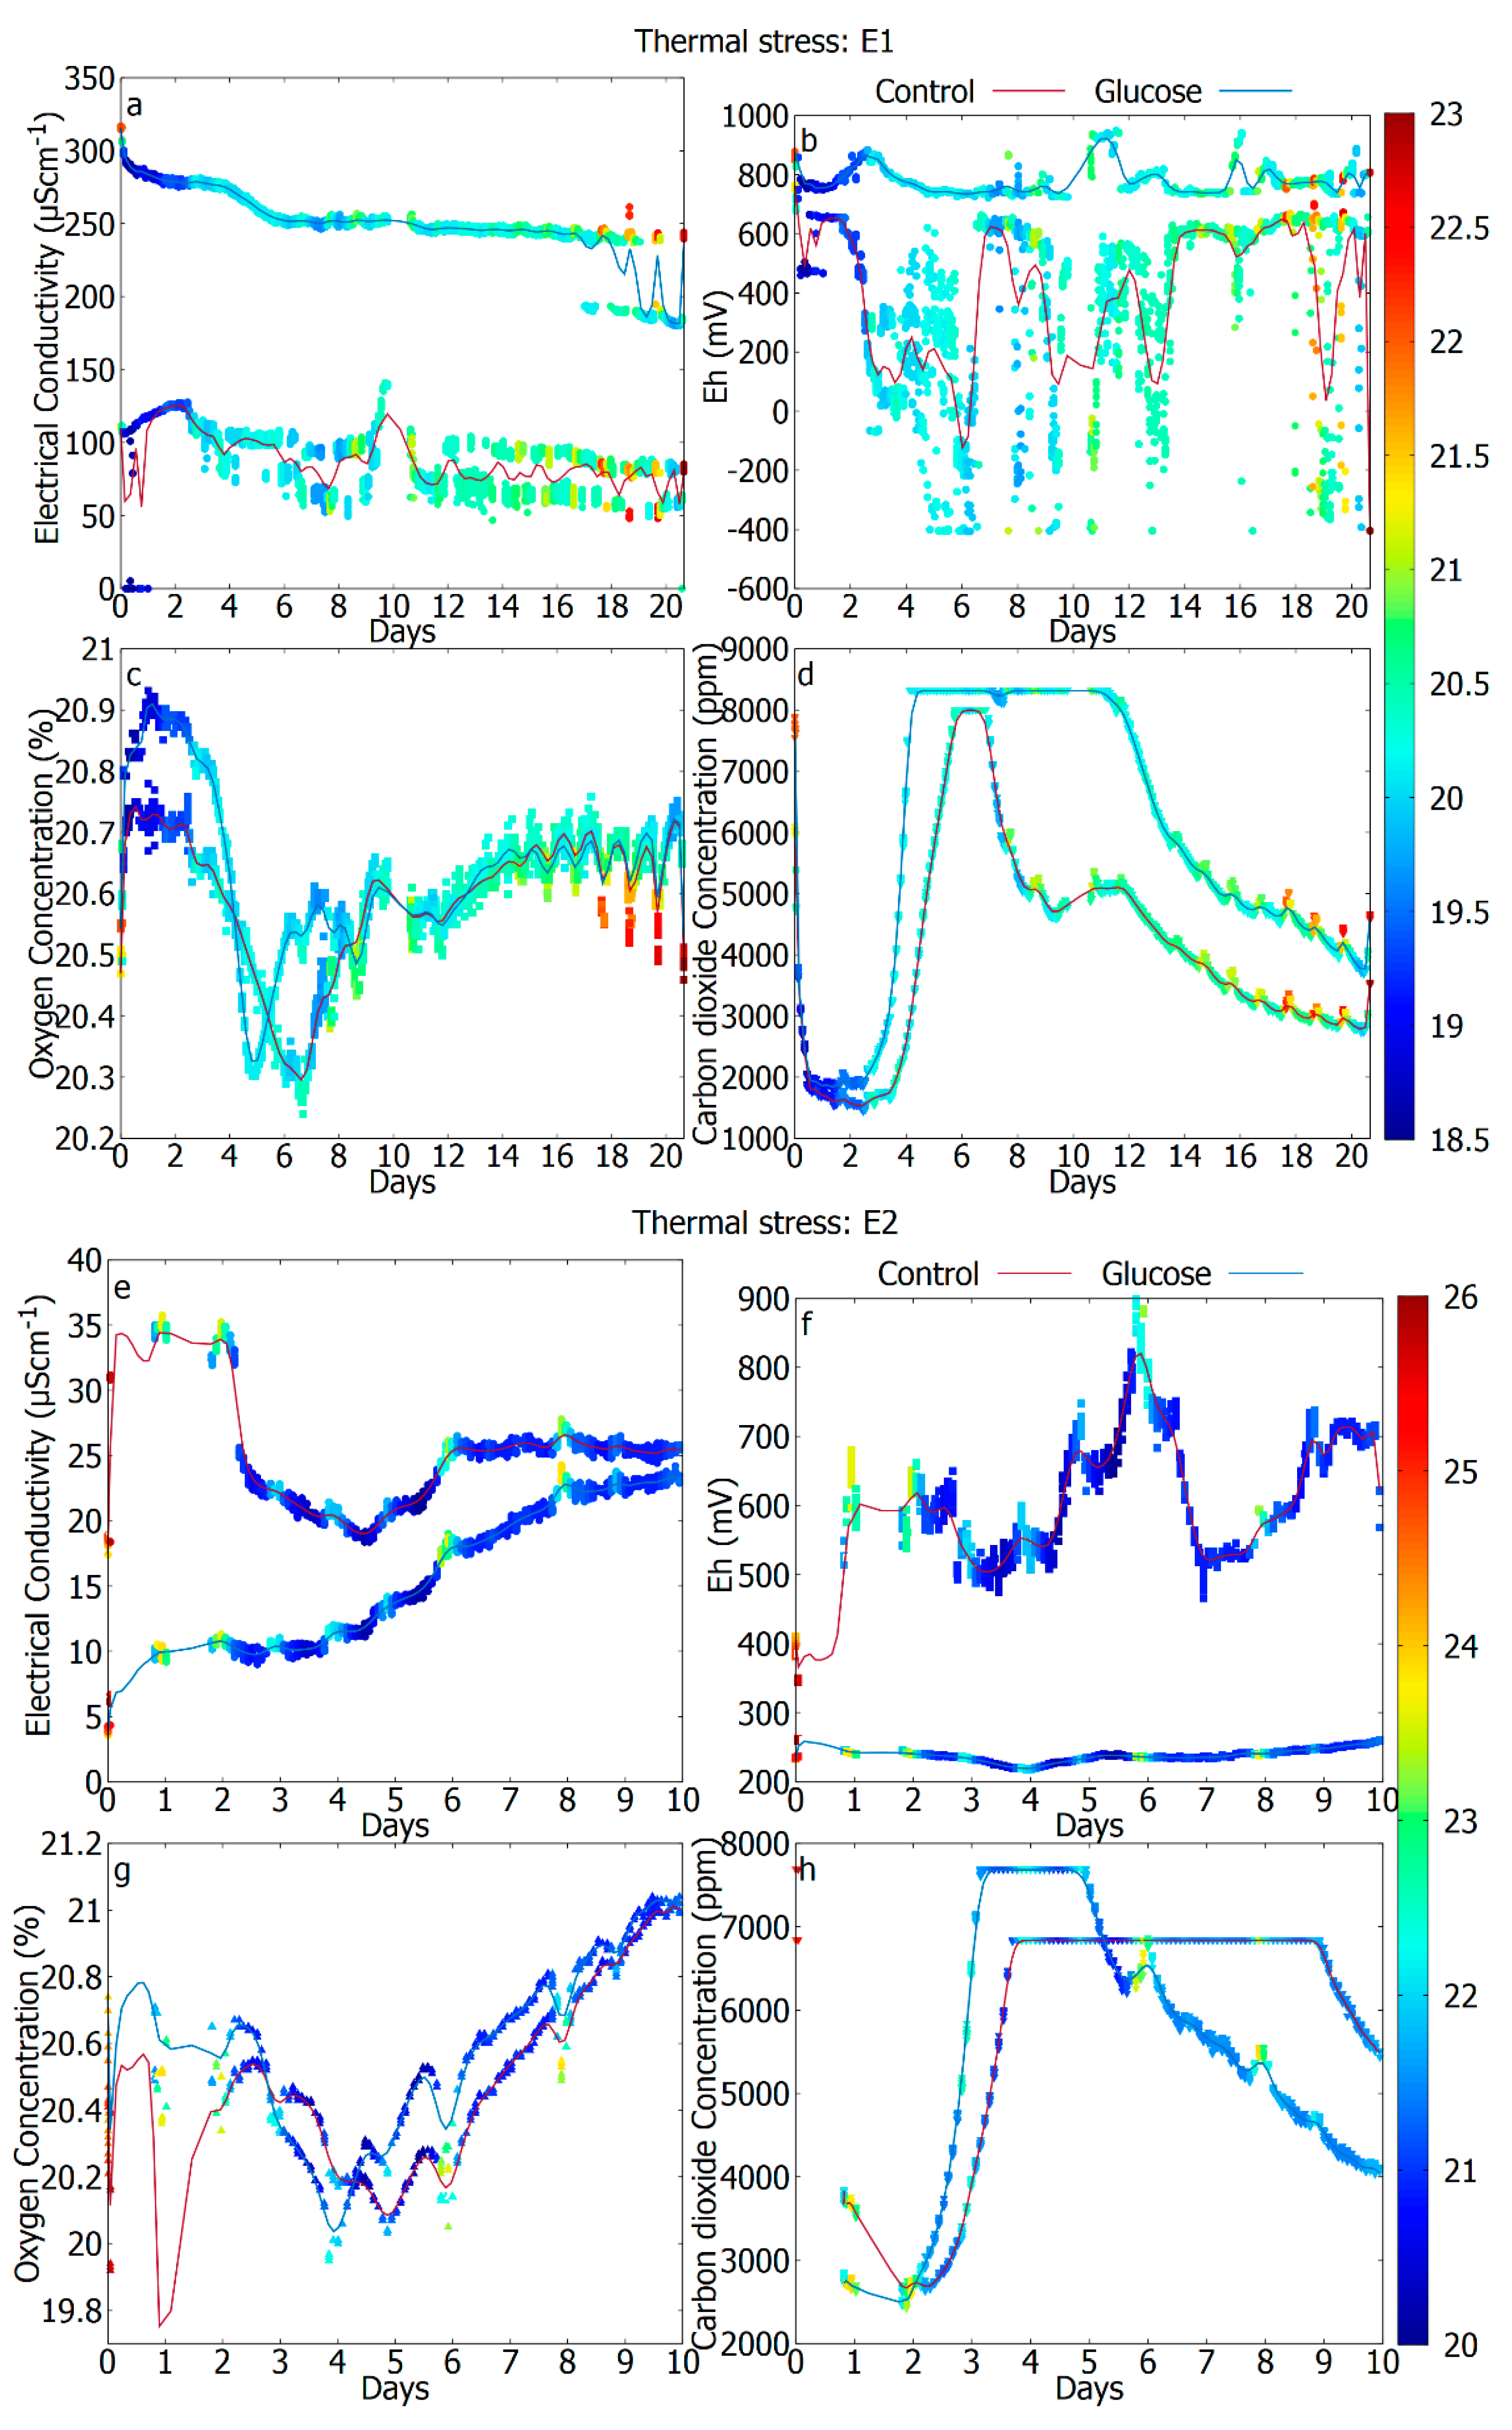
3.3. The Difference in Response Due to Temperature (Unperturbed vs. Thermal Stress)
3.4. The Difference in Response Due to Reduced Water Activity (Unperturbed vs. Osmotic Stress)
4. Discussion
- to observe the electrochemical behavior in the samples as a result of microbial metabolism from the instantaneous profile of the EC and the Eh;
- to observe the global metabolic response to different additives (salts, antibiotic, toxic compounds, metals, etc.) and selective pressures (thermal treatment, pH changes, etc.) which may help to force the dominance of one species or one pathway over other (thermal treatment and osmotic stress were demonstrated in this paper);
- to understand the time response of the system to external factors like temperature or light, and other inducers of the diurnal variations;
- to register the response of living cells; to monitor in real time the phases of the lag, exponential growth, and the death of the cellular processes; and
- to investigate the optimal growth conditions in the solid or liquid media, about the temperature and other additives or parameters (water activity, pH, gases, nutrients, etc.) for the natural samples or selected species.
5. Conclusions
Supplementary Materials
Author Contributions
Funding
Acknowledgments
Conflicts of Interest
References
- Stewart, E.J. Growing Unculturable Bacteria. J. Bacteriol. 2012, 194, 4151–4160. [Google Scholar] [CrossRef] [PubMed]
- Azua-Bustos, A.; Fairén, A.G.; González-Silva, C.; Ascaso, C.; Carrizo, D.; Fernández-Martínez, M.Á.; Fernández-Sampedro, M.; García-Descalzo, L.; García-Villadangos, M.; Martin-Redondo, M.P.; et al. Unprecedented rains decimate surface microbial communities in the hyperarid core of the Atacama Desert. Sci. Rep. 2018, 8, 16706. [Google Scholar] [CrossRef] [PubMed]
- Cockell, C.S.; Schwendner, P.; Perras, A.; Rettberg, P.; Beblo-Vranesevic, K.; Bohmeier, M.; Rabbow, E.; Moissl-Eichinger, C.; Wink, L.; Marteinsson, V.; et al. Anaerobic microorganisms in astrobiological analogue environments: From field site to culture collection. Int. J. Astrobiol. 2018, 17, 314–328. [Google Scholar] [CrossRef]
- Preston, L.J.; Dartnell, L.R. Planetary habitability: Lessons learned from terrestrial analogues. Int. J. Astrobiol. 2014, 13, 81–98. [Google Scholar] [CrossRef]
- Gómez, F.; Walter, N.; Amils, R.; Rull, F.; Klingelhöfer, A.K.; Kviderova, J.; Sarrazin, P.; Foing, B.; Behar, A.; Fleischer, I.; et al. Multidisciplinary integrated field campaign to an acidic Martian Earth analogue with astrobiological interest: Rio Tinto. Int. J. Astrobiol. 2011, 10, 291–305. [Google Scholar] [CrossRef]
- Cockell, C.S.; Bush, T.; Bryce, C.; Direito, S.; Fox-Powell, M.; Harrison, J.P.; Lammer, H.; Landenmark, H.; Martin-Torres, J.; Nicholson, N.; et al. Habitability: A Review. Astrobiology 2016, 16, 89–117. [Google Scholar] [CrossRef]
- Rummel, J.D.; Beaty, D.W.; Jones, M.A.; Bakermans, C.; Barlow, N.G.; Boston, P.J.; Chevrier, V.F.; Clark, B.C.; de Vera, J.P.; Gough, R.V.; et al. A New Analysis of Mars “Special Regions”: Findings of the Second MEPAG Special Regions Science Analysis Group (SR-SAG2). Astrobiology 2014, 14, 887–968. [Google Scholar] [CrossRef]
- Waksman, S.A.; Tenney, F.G.; Stevens, K.R. The role of microorganisms in the transformation of organic matter in forest soils. Ecology 1928, 9, 126–144. [Google Scholar] [CrossRef]
- Alexander, M. Introduction to Soil Microbiology, 2nd ed.; John Wiley & Sons: New York, NY, USA, 1977; pp. 423–437. [Google Scholar]
- Malik, A.A.; Chowdhury, S.; Schlager, V.; Oliver, A.; Puissant, J.; Vazquez, P.G.M.; Jehmlich, N.; von Bergen, M.; Griffiths, R.I.; Gleixner, G. Soil Fungal:Bacterial Ratios Are Linked to Altered Carbon Cycling. Front. Microbiol. 2016, 7, 1247. [Google Scholar] [CrossRef]
- Strickland, M.S.; Rousk, J. Considering fungal: Bacterial dominance in soils—Methods, controls, and ecosystem implications. Soil Biol. Biochem. 2010, 42, 1385–1395. [Google Scholar] [CrossRef]
- Palková, Z. Multicellular microorganisms: Laboratory versus nature. EMBO Rep. 2004, 5, 470–476. [Google Scholar] [CrossRef] [PubMed]
- Wade, W. Unculturable bacteria––The uncharacterized organisms that cause oral infections. J. R. Soc. Med. 2002, 95, 81–83. [Google Scholar] [PubMed]
- The Scientist. Lost Colonies. Available online: https://www.the-scientist.com/features/lost-colonies-34760 (accessed on 30 September 2015).
- Lok, C. Mining the microbial dark matter. Nature 2015, 522, 270–273. [Google Scholar] [CrossRef] [PubMed]
- Banks, M.K.; Bryers, J.D. Bacterial species dominance within a binary culture biofilm. Appl. Environ. Microbiol. 1991, 57, 1974–1979. [Google Scholar] [CrossRef] [PubMed]
- Fierer, N. Embracing the unknown: Disentangling the complexities of the soil microbiome. Nat. Rev. Microbiol. 2017, 15, 579–590. [Google Scholar] [CrossRef]
- Hibbing, M.E.; Fuqua, C.; Parsek, M.R.; Peterson, S.B. Bacterial competition: Surviving and thriving in the microbial jungle. Nat. Rev. Microbiol. 2010, 8, 15–25. [Google Scholar] [CrossRef]
- Silverman, M.P.; Munoz, E.F. Microbial Metabolism and Dynamic Changes in the Electrical Conductivity of Soil Solutions: A Method for Detecting Extraterrestrial Life. Appl. Microbiol. 1974, 28, 960–967. [Google Scholar] [CrossRef]
- Rezanezhad, F. An experimental approach using an automated soil column system. J. Hydrol. 2014, 509, 245–256. [Google Scholar] [CrossRef]
- Bochove, E.V. Continuous Multiple Measurement of Soil Redox Potential Using Platinum Microelectrodes. Soil Sci. Soc. Am. J. 2002, 66, 1813–1820. [Google Scholar] [CrossRef]
- Enright, A.M.L.; Ferris, F.G. Fluctuation Analysis of Redox Potential to Distinguish Microbial Fe(II) Oxidation. Astrobiology 2016, 16, 846–852. [Google Scholar] [CrossRef]
- Enright, A.M.L.; Ferris, F.G. Bacterial Fe(II) oxidation distinguished by long-range correlation in redox potential. J. Geophys. Res. Biogeosci. 2016, 121, 1249–1257. [Google Scholar] [CrossRef]
- Wardman, C.; Nevin, K.P.; Lovley, D.R. Real-time monitoring of subsurface microbial metabolism with graphite electrodes. Front. Microbiol. 2014, 5, 621. [Google Scholar] [CrossRef] [PubMed]
- Edwards, N.T.; Riggs, J.S. Automated Monitoring of Soil Respiration: A Moving Chamber Design. Soil Sci. Soc. Am. J. 2003, 67, 1266–1271. [Google Scholar] [CrossRef]
- McGinn, S.M.; Akinremi, O.O.; McLean, H.D.; Ellert, B. An automated chamber system for measuring soil respiration. Can. J. Soil Sci. 1998, 78, 573–579. [Google Scholar] [CrossRef][Green Version]
- Joshi Gyawali, A.; Lester, B.J.; Stewart, R.D. Talking SMAAC: A New Tool to Measure Soil Respiration and Microbial Activity. Front. Earth Sci. 2019, 7, 138. [Google Scholar] [CrossRef]
- Reiser, R.; Stadelmann, V.; Weisskopf, P.; Grahm, L.; Keller, T. System for quasi-continuous simultaneous measurement of oxygen diffusion rate and redox potential in soil. J. Plant Nutr. Soil Sci. 2020, 183, 316–326. [Google Scholar] [CrossRef]
- De Cesare, F.; Di Mattia, E.; Pantalei, S.; Zampetti, E.; Vinciguerra, V.; Canganella, F.; Macagnano, A. Use of electronic nose technology to measure soil microbial activity through biogenic volatile organic compounds and gases release. Soil Biol. Biochem. 2011, 43, 2094–2107. [Google Scholar] [CrossRef]
- Crawford, R.L.; Paszczynski, A.; Lang, Q.; Erwin, D.P.; Allenbach, L.; Corti, G.; Anderson, T.J.; Cheng, I.F.; Wai, C.; Barnes, B.; et al. Measurement of microbial activity in soil by colorimetric observation of in situ dye reduction: An approach to detection of extraterrestrial life. BMC Microbiol. 2002, 2, 22. [Google Scholar] [CrossRef]
- Sashidhar, P.; Dubey, M.K.; Kochar, M. Sensing Soil Microbes and Interactions: How Can Nanomaterials Help? In Microbial Nanobionics; Springer: Cham, Switzerland, 2019; pp. 213–236. [Google Scholar]
- Tang, Y.; Li, L.; Wang, C.; Chen, M.; Feng, W.; Zou, X.; Huang, K. Real-time detection of surface deformation and strain in recycled aggregate concrete-filled steel tubular columns via four-ocular vision. Robot. Comput. Integr. Manuf. 2019, 59, 36–46. [Google Scholar] [CrossRef]
- Chen, M.; Tang, Y.; Zou, X.; Huang, K.; Li, L.; He, Y. High-accuracy multi-camera reconstruction enhanced by adaptive point cloud correction algorithm. Opt. Lasers Eng. 2019, 122, 170–183. [Google Scholar] [CrossRef]
- Davila, A.F.; Hawes, I.; Araya, J.G.; Gelsinger, D.R.; DiRuggiero, J.; Ascaso, C.; Osano, A.; Wierzchos, J. In situ metabolism in halite endolithic microbial communities of the hyperarid Atacama Desert. Front. Microbiol. 2015, 6, 1035. [Google Scholar] [CrossRef] [PubMed]
- Goordial, J.; Altshuler, I.; Hindson, K.; Chan-Yam, K.; Marcolefas, E.; Whyte, L.G. In Situ Field Sequencing and Life Detection in Remote (79°26′ N) Canadian High Arctic Permafrost Ice Wedge Microbial Communities. Front. Microbiol. 2017, 8, 2594. [Google Scholar] [CrossRef] [PubMed]
- Whitebox Labs Tentacle Shield for Arduino Datasheet. Available online: https://www.atlas-scientific.com/product_pages/components/tentacle-shield.html (accessed on 21 August 2017).
- Cockell, C.S.; Holt, J.; Campbell, J.; Groseman, H.; Josset, J.L.; Bontognali, T.R.; Phelps, A.; Hakobyan, L.; Kuretn, L.; Beattie, A.; et al. Subsurface scientific exploration of extraterrestrial environments (MINAR 5): Analogue science, technology and education in the Boulby Mine, UK. Int. J. Astrobiol. 2018, 18, 157–182. [Google Scholar] [CrossRef]
- EZO™ Electrical Conductivity Circuit Datasheet. Available online: https://www.atlas-scientific.com/product_pages/circuits/ezo_ec.html (accessed on 16 July 2018).
- EZO™ ORP Circuit Datasheet. Available online: https://www.atlas-scientific.com/product_pages/circuits/ezo_orp.html (accessed on 22 May 2018).
- Bard, A.J.; Faulkner, L.R. Electrochemical Methods: Fundamentals and Applications; John Wiley & Sons: New York, NY, USA, 2000. [Google Scholar]
- Sawyer, D.T.; Sobkowiak, A.J.; Roberts, J., Jr. Electrochemistry for Chemists, 2nd ed.; John Wiley & Sons: New York, NY, USA, 1995; Section 5.2. [Google Scholar]
- Friis, E.P.; Andersen, J.E.; Madsen, L.L.; Bonander, N.; Møller, P.; Ulstrup, J. Dynamics of Pseudomonas aeruginosa azurin and its Cys3Ser mutant at single-crystal gold surfaces investigated by cyclic voltammetry and atomic force microscopy. Electrochim. Acta 1998, 43, 1114–1122. [Google Scholar] [CrossRef]
- Uhlemann, M.; Krause, A.; Chopart, J.P.; Gebert, A. Electrochemical Deposition of Co under the Influence of High Magnetic Fields. J. Electrochem. Soc. 2005, 152, 817–826. [Google Scholar] [CrossRef]
- ECSS-Q-ST-70-57C: Dry Heat Bioburden Reduction for Flight Hardware. Available online: https://ecss.nl/standard/ecss-q-st-70-57c-dry-heat-bioburden-reduction-for-flight-hardware-30-august-2013/ (accessed on 30 August 2013).
- Bui, A.V.; Nguyen, H.M.; Joachim, M. Prediction of water activity of glucose and calcium chloride solutions. J. Food Eng. 2003, 57, 243–248. [Google Scholar] [CrossRef]
- Williams, J.P.; Hallsworth, J.E. Limits of life in hostile environments: No barriers to biosphere function? Environ. Microbiol. 2009, 11, 3292–3308. [Google Scholar] [CrossRef]
- Stevenson, A.; Cray, J.A.; Williams, J.P.; Santos, R.; Sahay, R.; Neuenkirchen, N.; McClure, C.D.; Grant, I.R.; Houghton, J.D.; Quinn, J.P.; et al. Is there a common water-activity limit for the three domains of life? ISME J. 2015, 9, 1333–1351. [Google Scholar] [CrossRef]
- Allison, J.B.; Anderson, J.A.; Cole, W.H. The method of electrical conductivity in studies on bacterial metabolism. J. Bacteriol. 1938, 36, 571. [Google Scholar] [CrossRef]
- Yang, L.; Banada, P.P.; Liu, Y.S.; Bhunia, A.K.; Bashir, R. Conductivity and pH Dual Detection of Growth Profile of Healthy and Stressed Listeria monocytogenes. Biotechnol. Bioeng. 2005, 92, 685–694. [Google Scholar] [CrossRef]
- Haruta, S.; Kanno, N. Survivability of Microbes in Natural Environments and Their Ecological Impacts. Microbes Environ. 2015, 30, 123–125. [Google Scholar] [CrossRef] [PubMed]
- Hurt, G.W. Hydric Soils. In Encyclopedia of Soils in the Environment; Elsevier: Amsterdam, The Netherlands, 2005; pp. 212–217. [Google Scholar]
- Csonka, L.N. Physiological and genetic responses of bacteria to osmotic stress. Microbiol. Rev. 1989, 53, 121–147. [Google Scholar] [CrossRef] [PubMed]
- Rivkina, E.M. Metabolic Activity of Permafrost Bacteria below the Freezing Point. Appl. Environ. Microbiol. 2000, 66, 3230–3233. [Google Scholar] [CrossRef] [PubMed]
- Stevenson, A.; Hamill, P.G.; O’Kane, C.J.; Kminek, G.; Rummel, J.D.; Voytek, M.A.; Dijksterhuis, J.; Hallsworth, J.E. Aspergillus penicillioides differentiation and cell division at 0.585 water activity. Environ. Microbiol. 2017, 19, 687–697. [Google Scholar] [CrossRef] [PubMed]
- Vakkada Ramachandran, A.; Nazarious, M.I.; Mathanlal, T.; Zorzano, M.P.; Martín-Torres, J. Space environmental chamber for planetary studies. Sensors 2020, 20, 3996. [Google Scholar] [CrossRef]
- Vakkada Ramachandran, A.; Israel Nazarious, M.; Mathanlal, T. SpaceQ Chamber: The Environment Simulator for Planetary Exploration Instrumentation and Research. In Proceedings of the EPSC-DPS 2019 Meeting (EPSC Abstracts), Geneva, Switzerland, 15–20 September 2019; Volume 13. [Google Scholar]
- Cockell, C.S.; Payler, S.; Paling, S.; McLuckie, D. The Boulby International Subsurface Astrobiology Laboratory. Astron. Geophys. 2013, 54, 157–182. [Google Scholar] [CrossRef]
- McKay, C.P. The Mars Oxidant experiment (MOx) for Mars ’96. Planet. Space Sci. 1998, 46, 769–777. [Google Scholar] [CrossRef]
- Kounaves, S.P.; Hecht, M.H.; Kapit, J.; Gospodinova, K.; DeFlores, L.; Quinn, R.C.; Boynton, W.V.; Clark, B.C.; Catling, D.C.; Hredzak, P.; et al. Wet Chemistry experiments on the 2007 Phoenix Mars Scout Lander mission: Data analysis and results. J. Geophys. Res. Planets 2010, 115, E1. [Google Scholar] [CrossRef]
- Quinn, R.C.; Chittenden, J.D.; Kounaves, S.P.; Hecht, M.H. The oxidation-reduction potential of aqueous soil solutions at the Mars Phoenix landing site. Geophys. Res. Lett. 2011, 38. [Google Scholar] [CrossRef]


| Sensor/Probe | Product Model | Measurement | Measurement Range | Resolution |
|---|---|---|---|---|
| Waterproof temperature sensor | DS18B20 1-Wire Digital Thermometer | Soil temperature | −55–125 °C | 0.25 °C at 10-bit |
| Two 50 × 30 × 0.5 mm copper sheets 90 mm apart | Atlas Scientific EZO™ Conductivity circuit | Electrical conductivity | 0.07–500,000 µS/cm | ±2% |
| 3-Pt (Custom-built by Paleo Terra, The Netherlands. Platinum sensing elements at distances 10, 20, and 30 mm, respectively, from the tip allowing for redox measurements at different depths of the experiment samples) redox probes and Ag|AgCl wire with 3M KCl reference probes | Atlas Scientific EZO™ ORP circuit | Redox potential | −1019.9–1019.9 mV | ±1 mV |
| Oxygen sensor | CO2Meter UV flux 25% oxygen sensor module | Air pressure Oxygen concentration | 500–1200 mbar 0 to 25 % | 1.1 mbar 0.01% |
| Carbon dioxide sensor | CO2Meter COZIR Ambient 10,000 ppm CO2 + RH/T sensor | Air temperature Relative humidity Carbon dioxide concentration | −25–55 °C 0–95% 0–10,000 ppm | 0.08 °C 0.08% 1 ppm |
| Condition | (I) Unperturbed | (II) Thermal Stress | (III) Osmotic Stress |
|---|---|---|---|
| Soil pre-treatment | No pre-treatment | Heated at 125 °C for 35.4 h | No pre-treatment |
| Added solution (control experiment) | 40 mL of deionized water | 40 mL of deionized water | 40 mL of deionized water |
| Added solution (actual experiment) | 40 mL of deionized water + 0.5% glucose (0.2 g) | 40 mL of deionized water + 0.5% glucose (0.2 g) | 40 mL of deionized water + 0.5% glucose (0.2 g) + 25% CaCl2 (10 g) |
| Number of experiments (E) | 3 (E1, E2, E3) | 3 (E1, E2, E3) | 3 (E1, E2, E3) |
| Incubation time (days) | E1: 10 E2: 9 E3: 15 | E1: 20 E2: 10 E3: 18 | E1: 16 E2: 14 E3: 11 |
| Soil sample collection season | E1: Autumn 2017 E2: Summer 2018 E3: Summer 2018 | E1: Autumn 2017 E2: Summer 2018 E3: Summer 2018 | E1: Autumn 2017 E2: Summer 2018 E3: Summer 2018 |
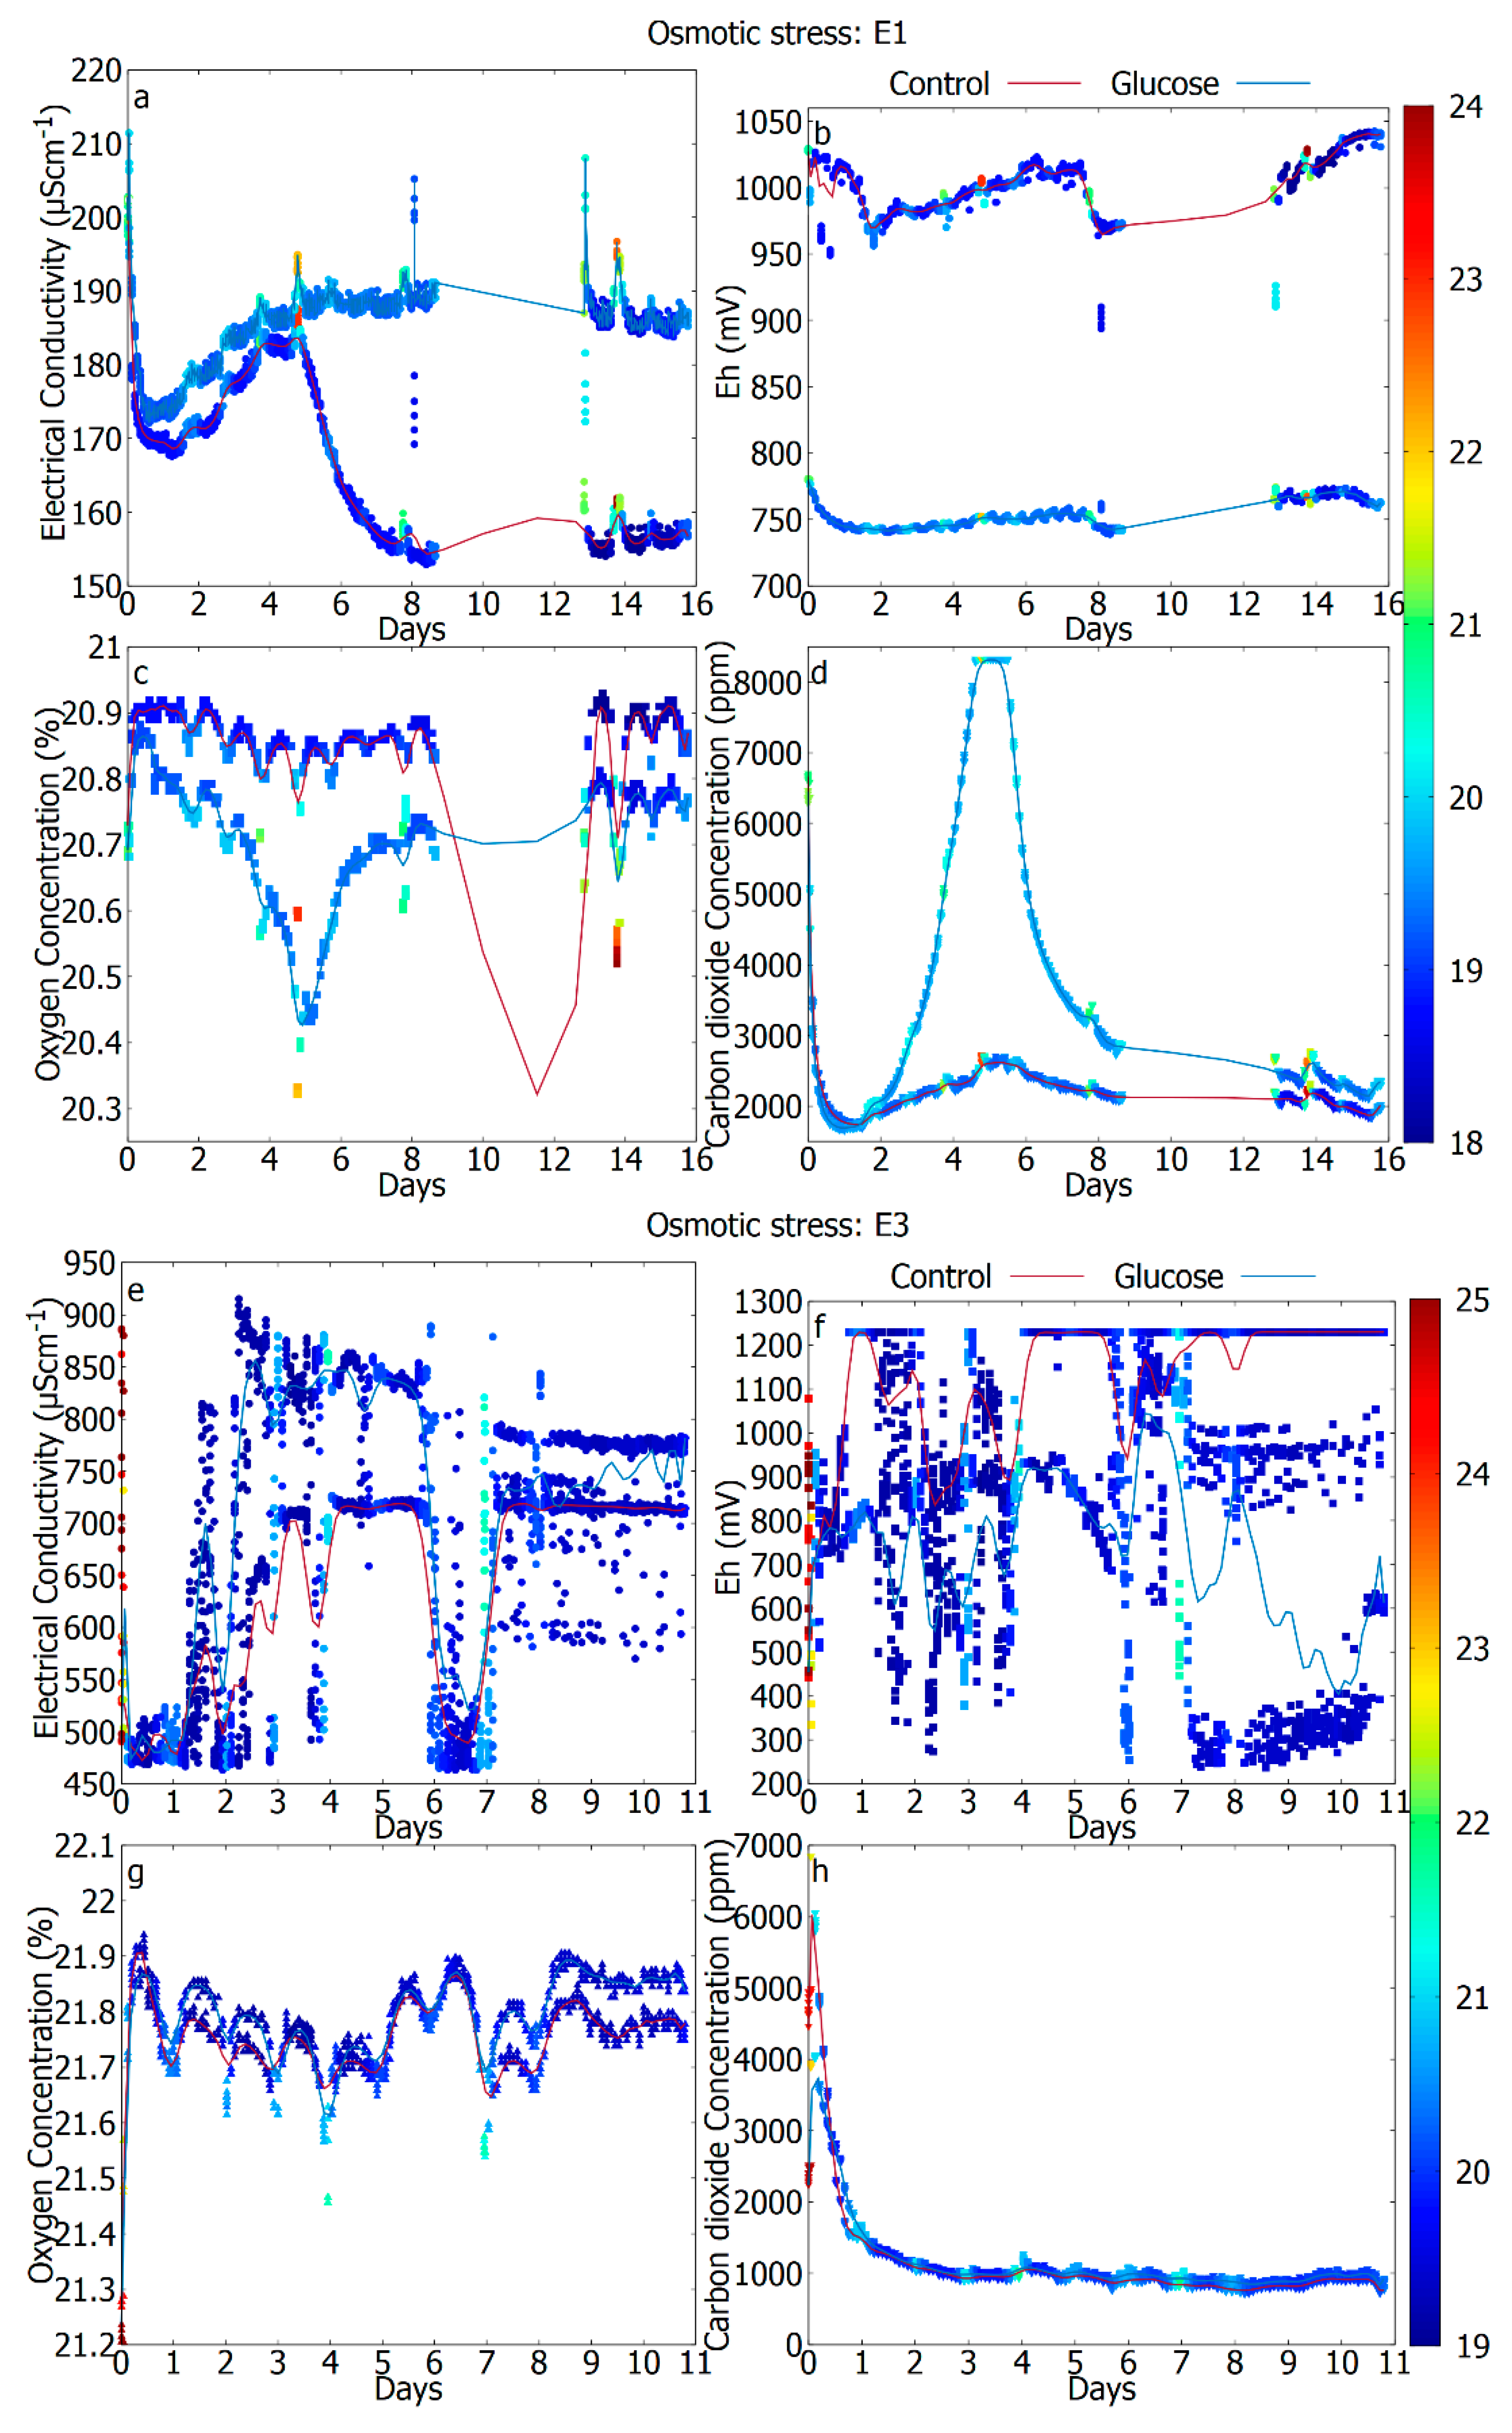
| Figure description | E1: Not shown E2: Figure 2a–d E3: Figure 2e–h | E1: Figure 3a–d E2: Figure 3e–h E3: Not shown | E1: Figure 4a–d E2: Not shown E3: Figure 4e–h |
© 2020 by the authors. Licensee MDPI, Basel, Switzerland. This article is an open access article distributed under the terms and conditions of the Creative Commons Attribution (CC BY) license (http://creativecommons.org/licenses/by/4.0/).
Share and Cite
Nazarious, M.I.; Zorzano, M.-P.; Martín-Torres, J. Metabolt: An In-Situ Instrument to Characterize the Metabolic Activity of Microbial Soil Ecosystems Using Electrochemical and Gaseous Signatures. Sensors 2020, 20, 4479. https://doi.org/10.3390/s20164479
Nazarious MI, Zorzano M-P, Martín-Torres J. Metabolt: An In-Situ Instrument to Characterize the Metabolic Activity of Microbial Soil Ecosystems Using Electrochemical and Gaseous Signatures. Sensors. 2020; 20(16):4479. https://doi.org/10.3390/s20164479
Chicago/Turabian StyleNazarious, Miracle Israel, María-Paz Zorzano, and Javier Martín-Torres. 2020. "Metabolt: An In-Situ Instrument to Characterize the Metabolic Activity of Microbial Soil Ecosystems Using Electrochemical and Gaseous Signatures" Sensors 20, no. 16: 4479. https://doi.org/10.3390/s20164479
APA StyleNazarious, M. I., Zorzano, M.-P., & Martín-Torres, J. (2020). Metabolt: An In-Situ Instrument to Characterize the Metabolic Activity of Microbial Soil Ecosystems Using Electrochemical and Gaseous Signatures. Sensors, 20(16), 4479. https://doi.org/10.3390/s20164479