Mind Mapping Training’s Effects on Reading Ability: Detection Based on Eye Tracking Sensors

Abstract
1. Introduction
2. Related Studies
3. Materials and Methods
3.1. Participants
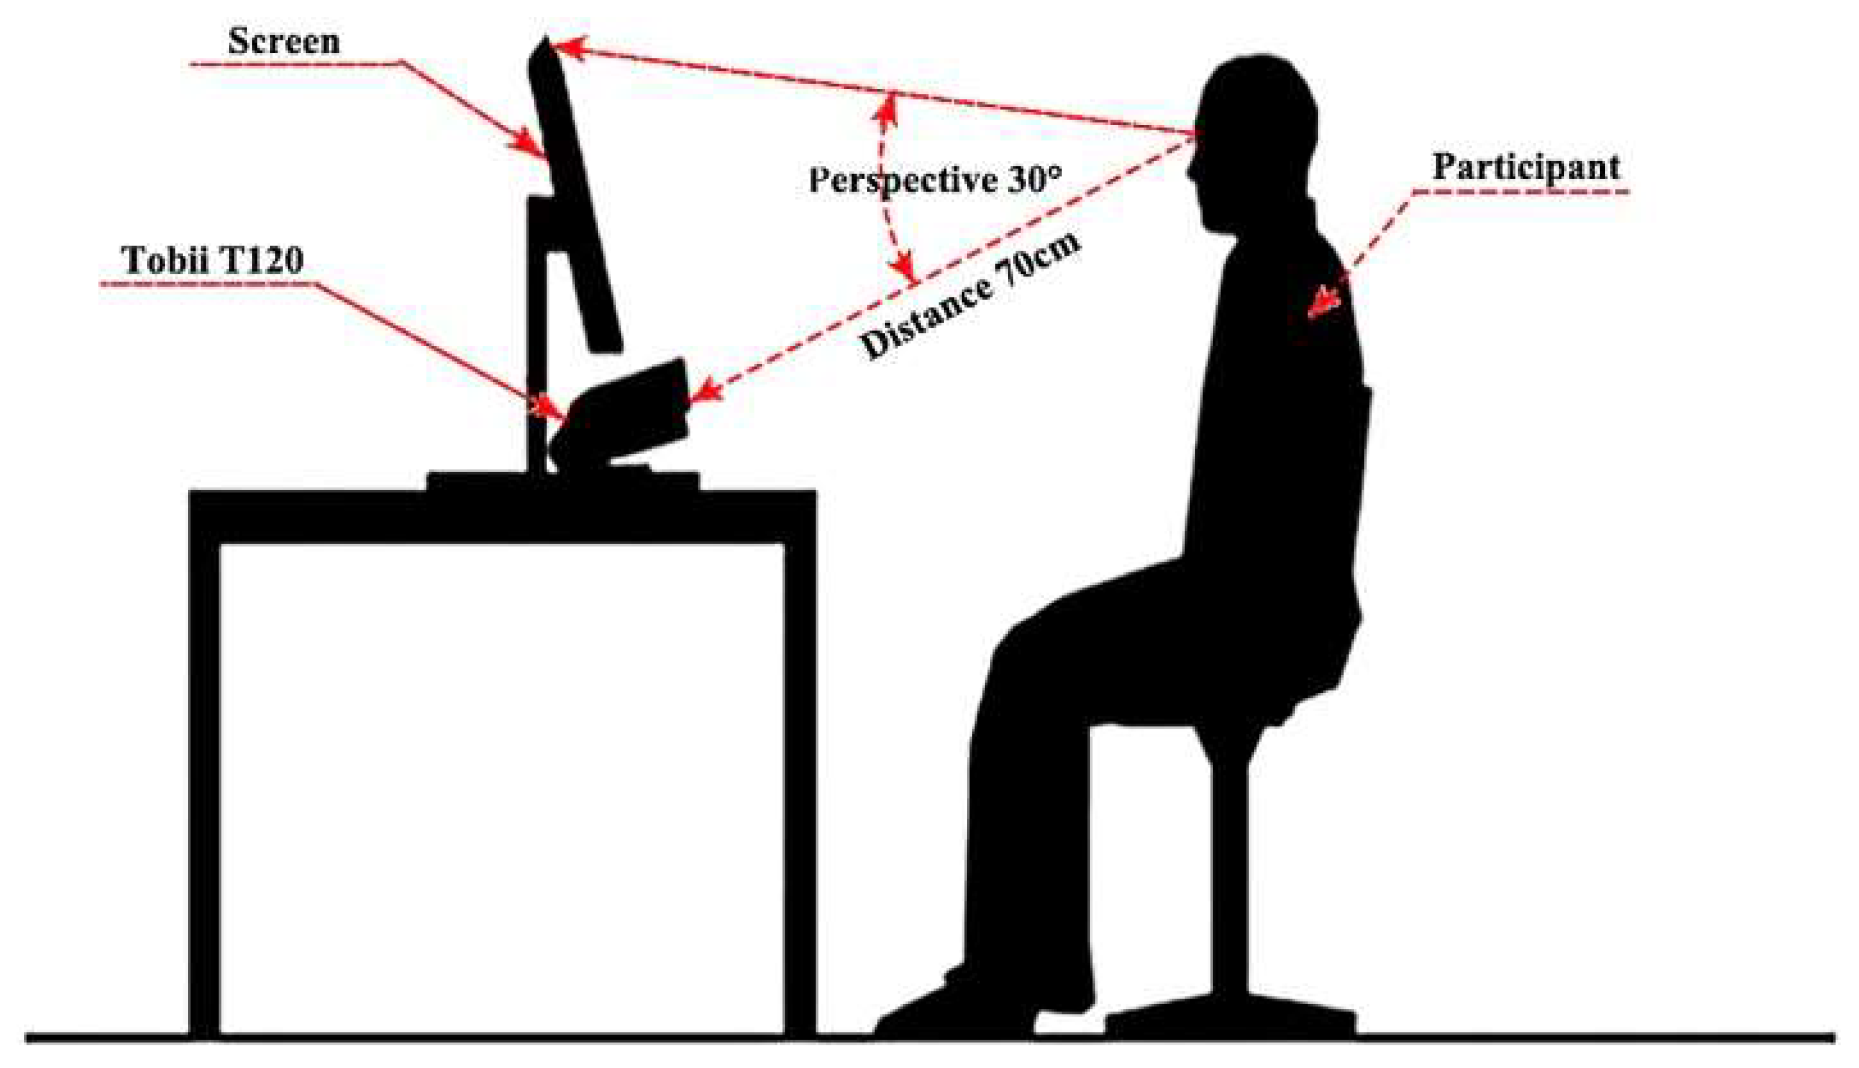
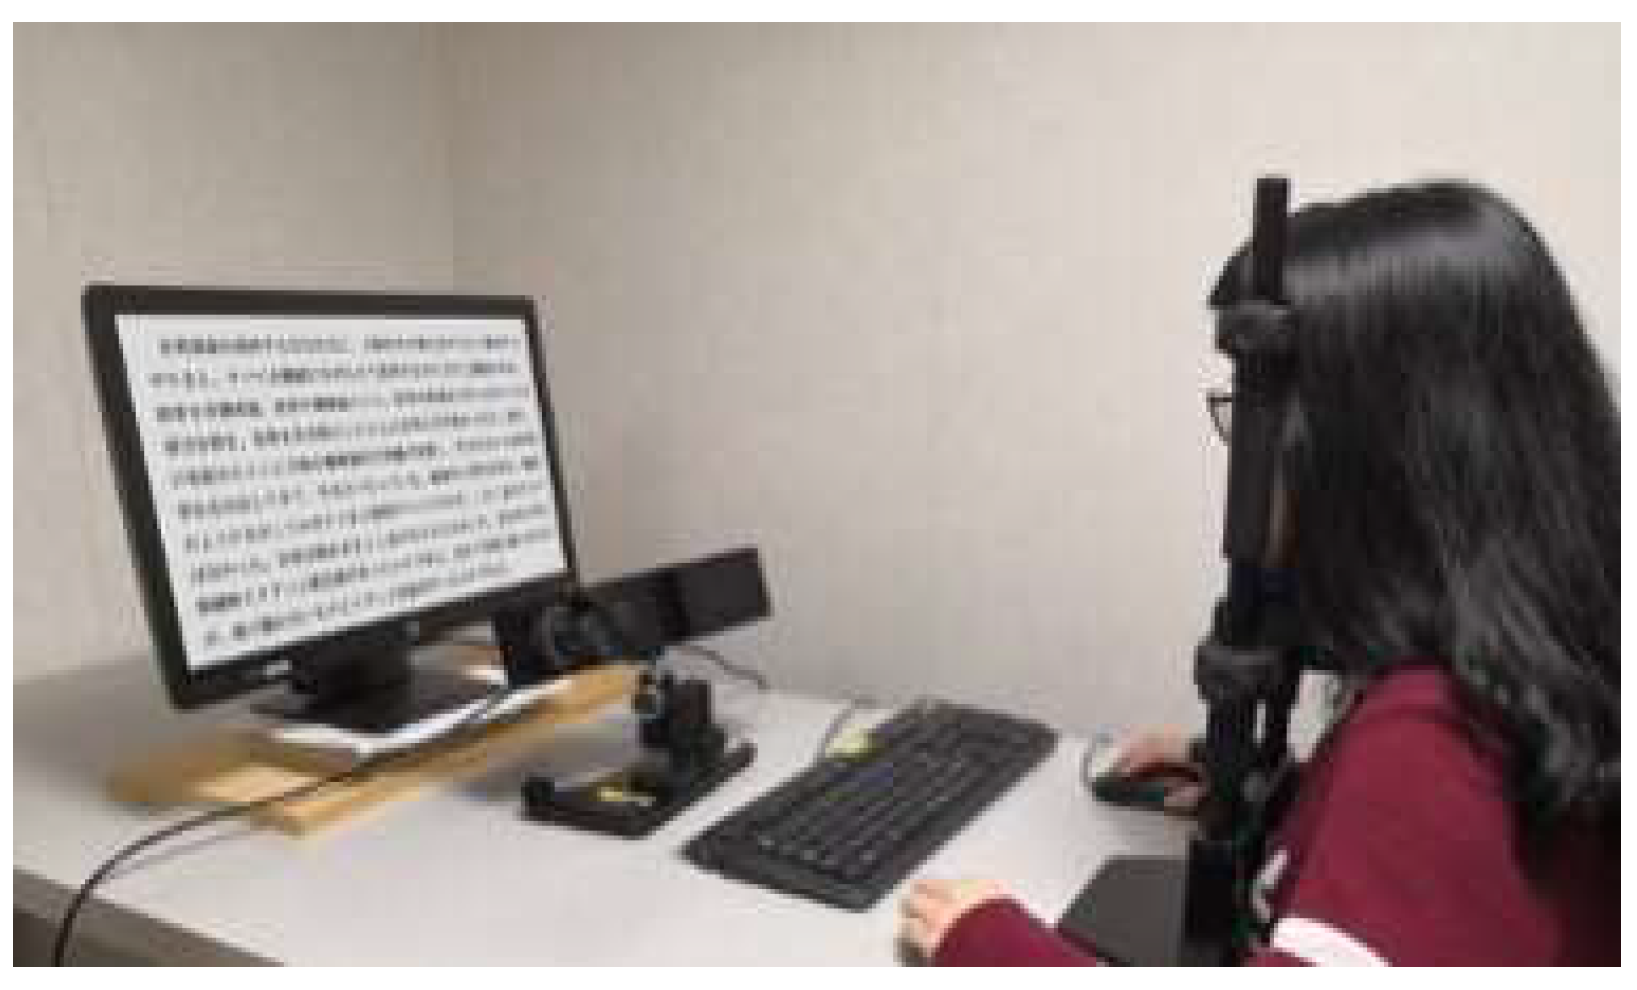
3.2. Apparatus
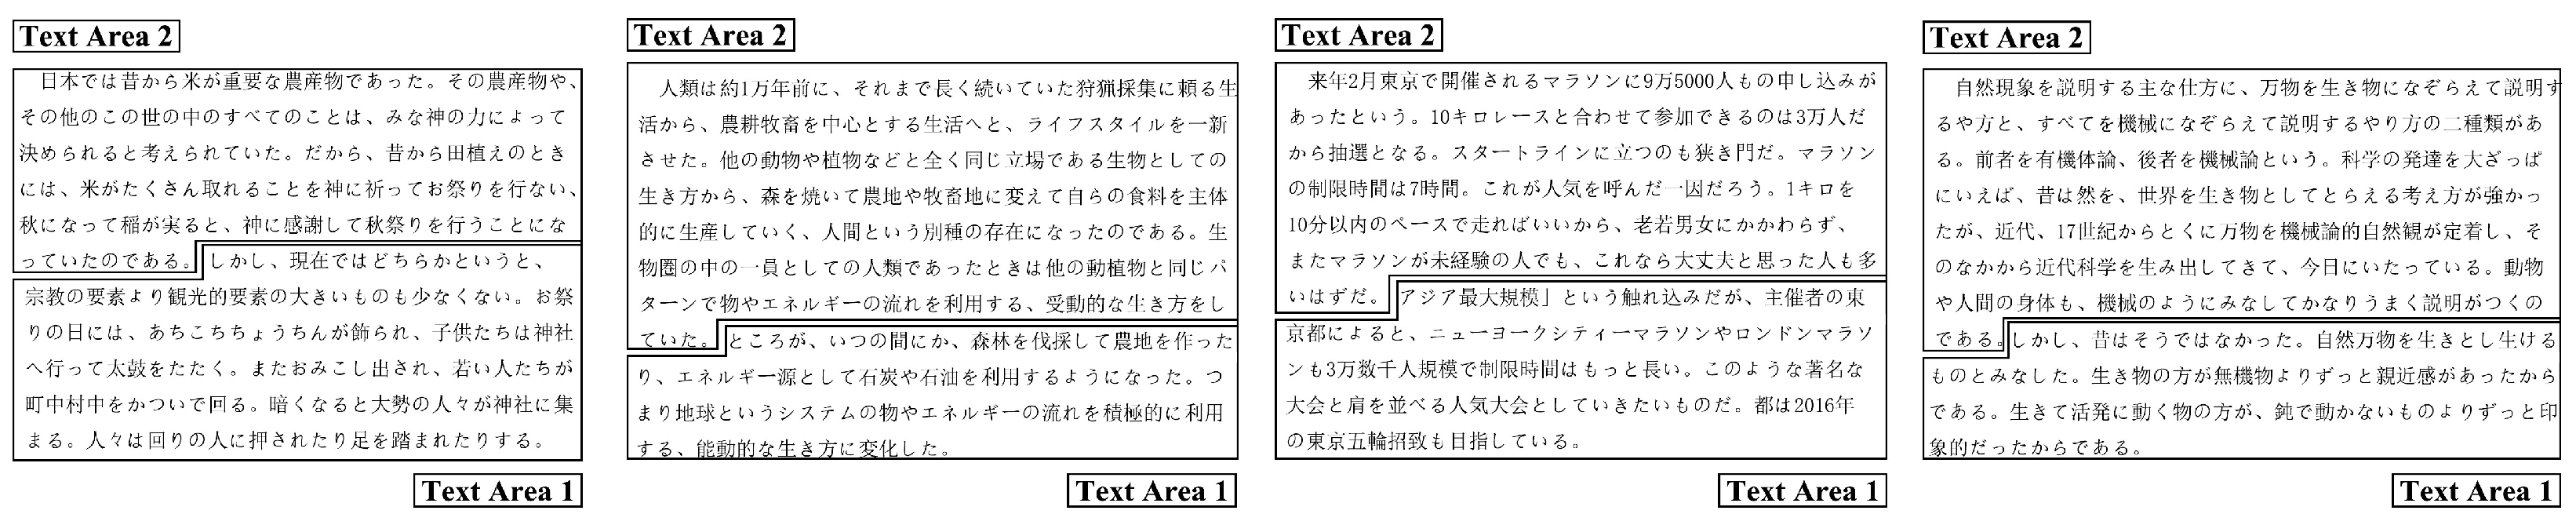
3.3. Materials
3.4. Procedure
- Give instructions to the participants about how to do the experiment.
- Ask the participants to read four Japanese articles that are displayed randomly on a PC screen, one after another. The time given for reading is unlimited.
- Record eye tracking data during reading.
- Follow each article with two reading comprehension multiple-choice questions and a requirement to write down the keywords and key sentences to measure their reading comprehension rate and reading efficiency, which participants must do immediately after reading.
- Analyze the obtained eye tracking data and other data (reading comprehension data).
3.5. Eye Movement Indicators
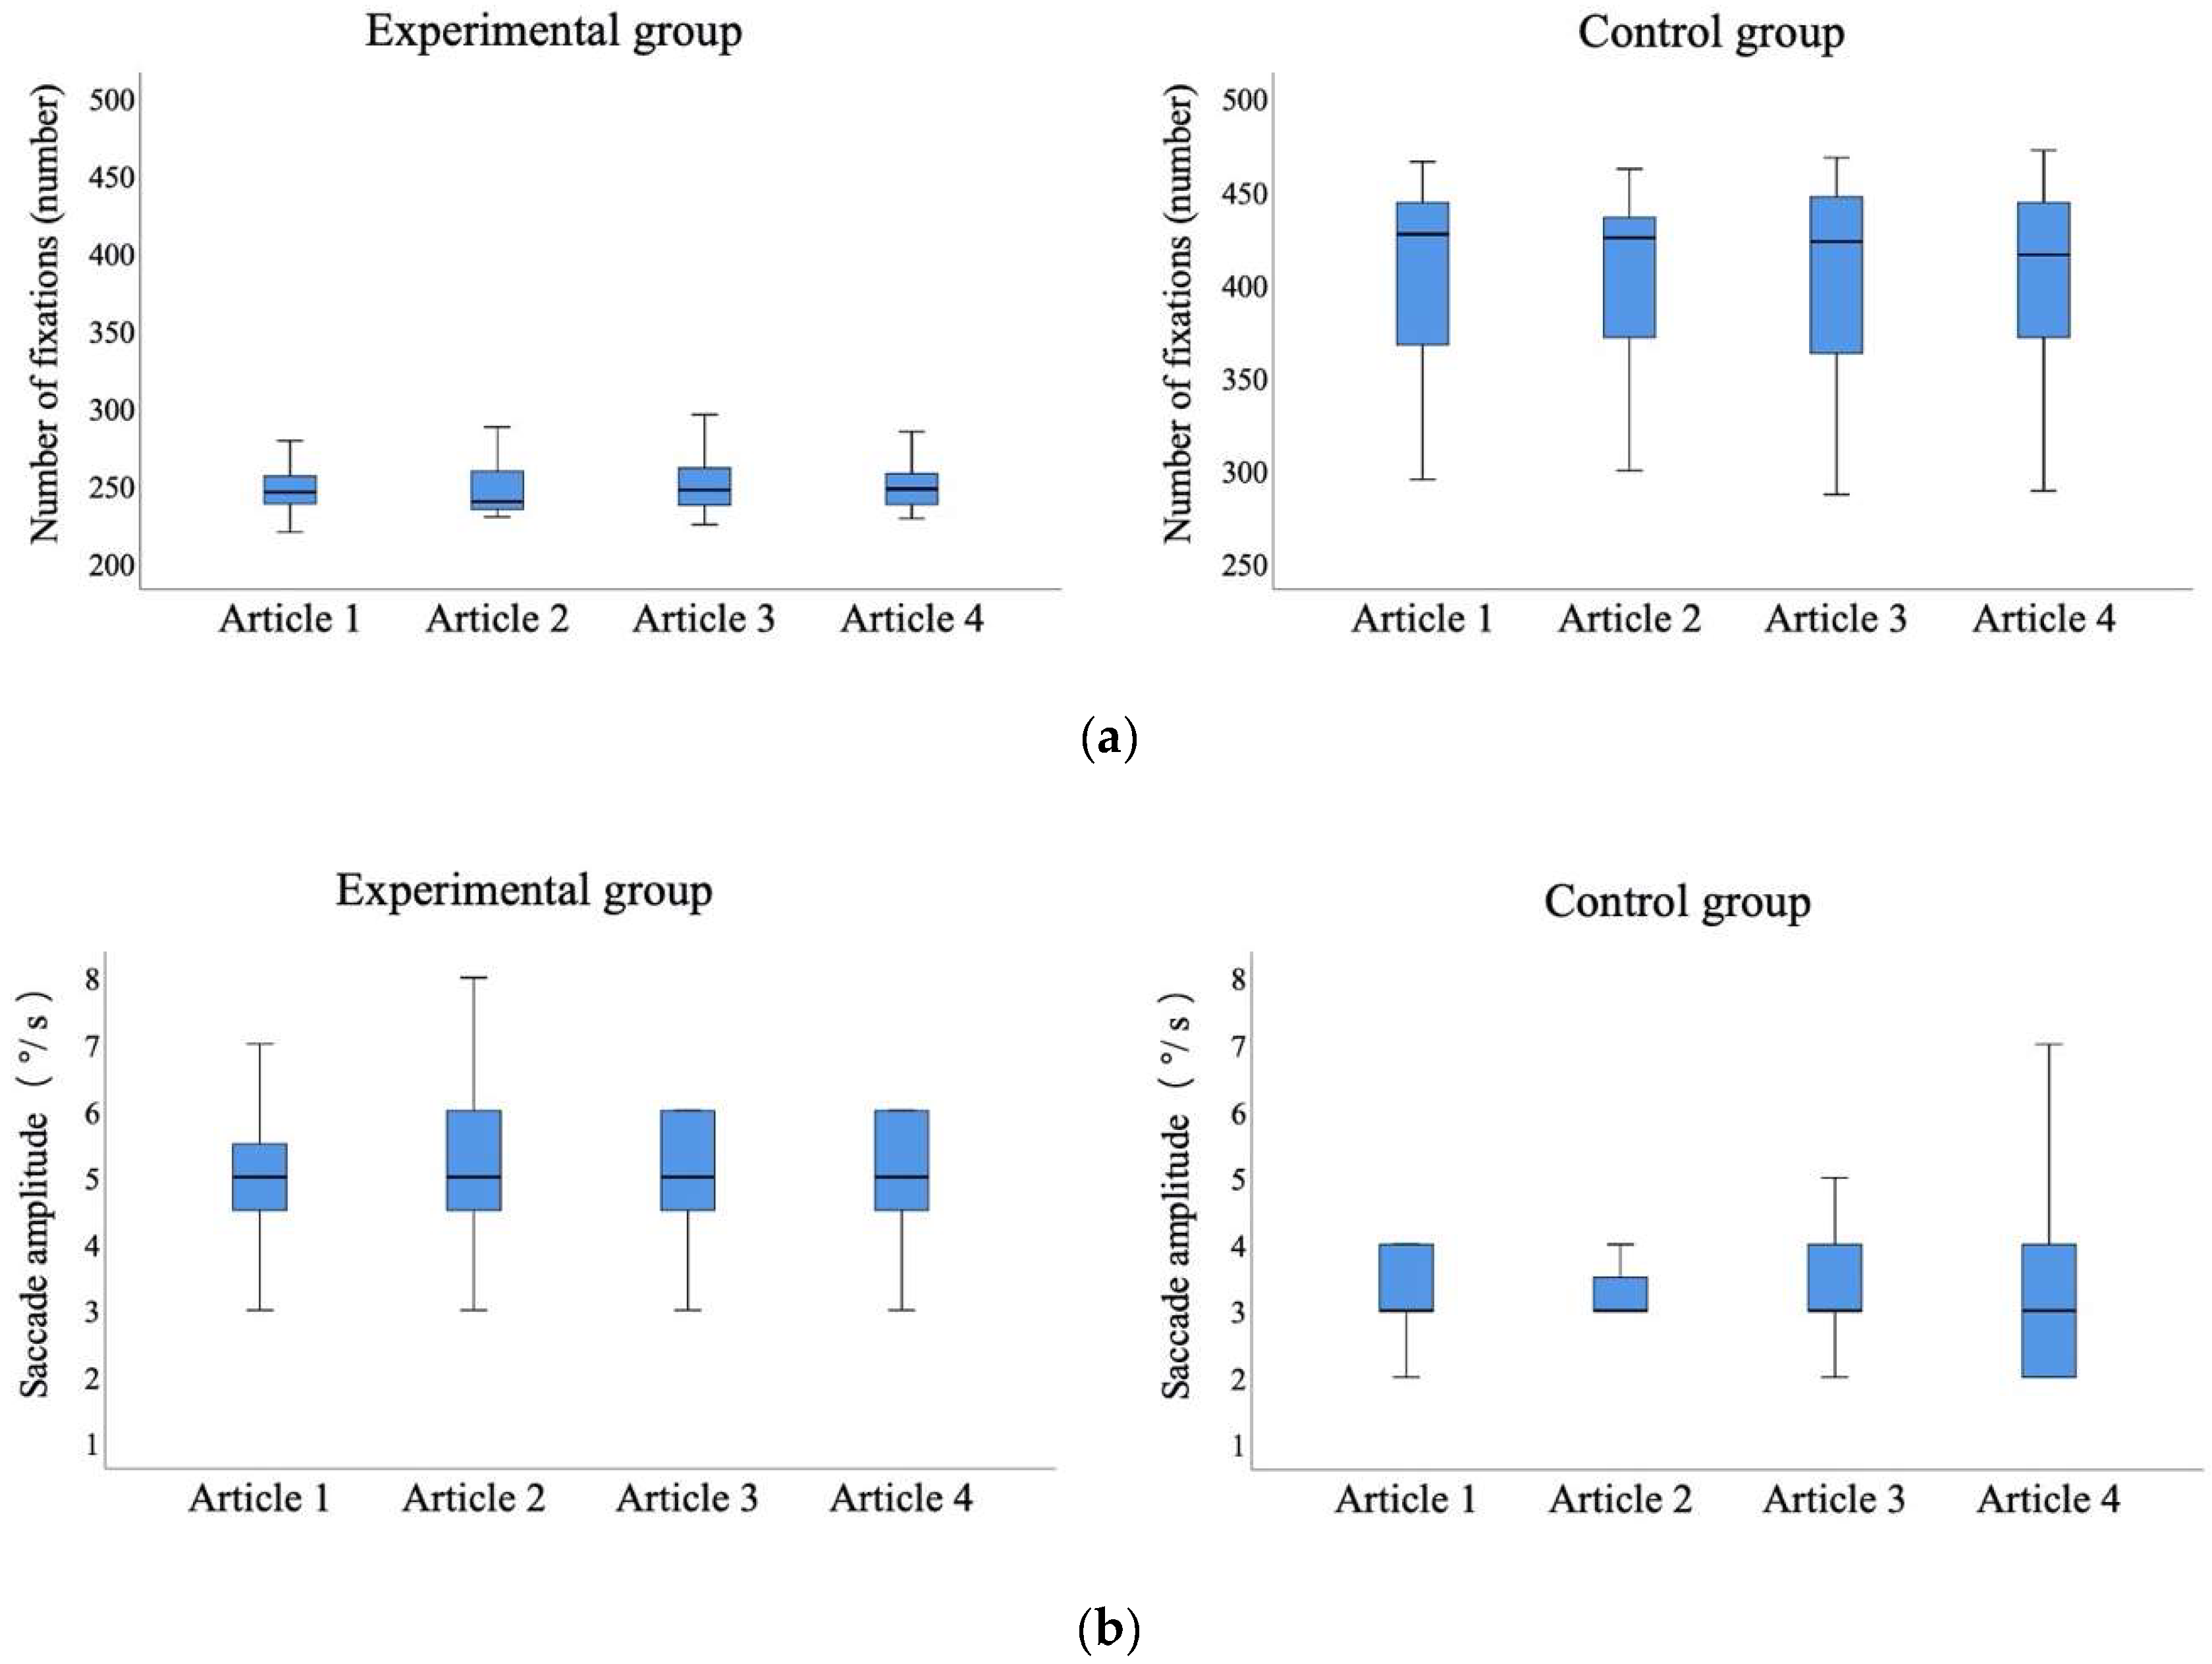
3.5.1. Fixation-Related Indicators
3.5.2. Regression Count
3.5.3. Saccade Amplitude
3.5.4. Pupil Diameter
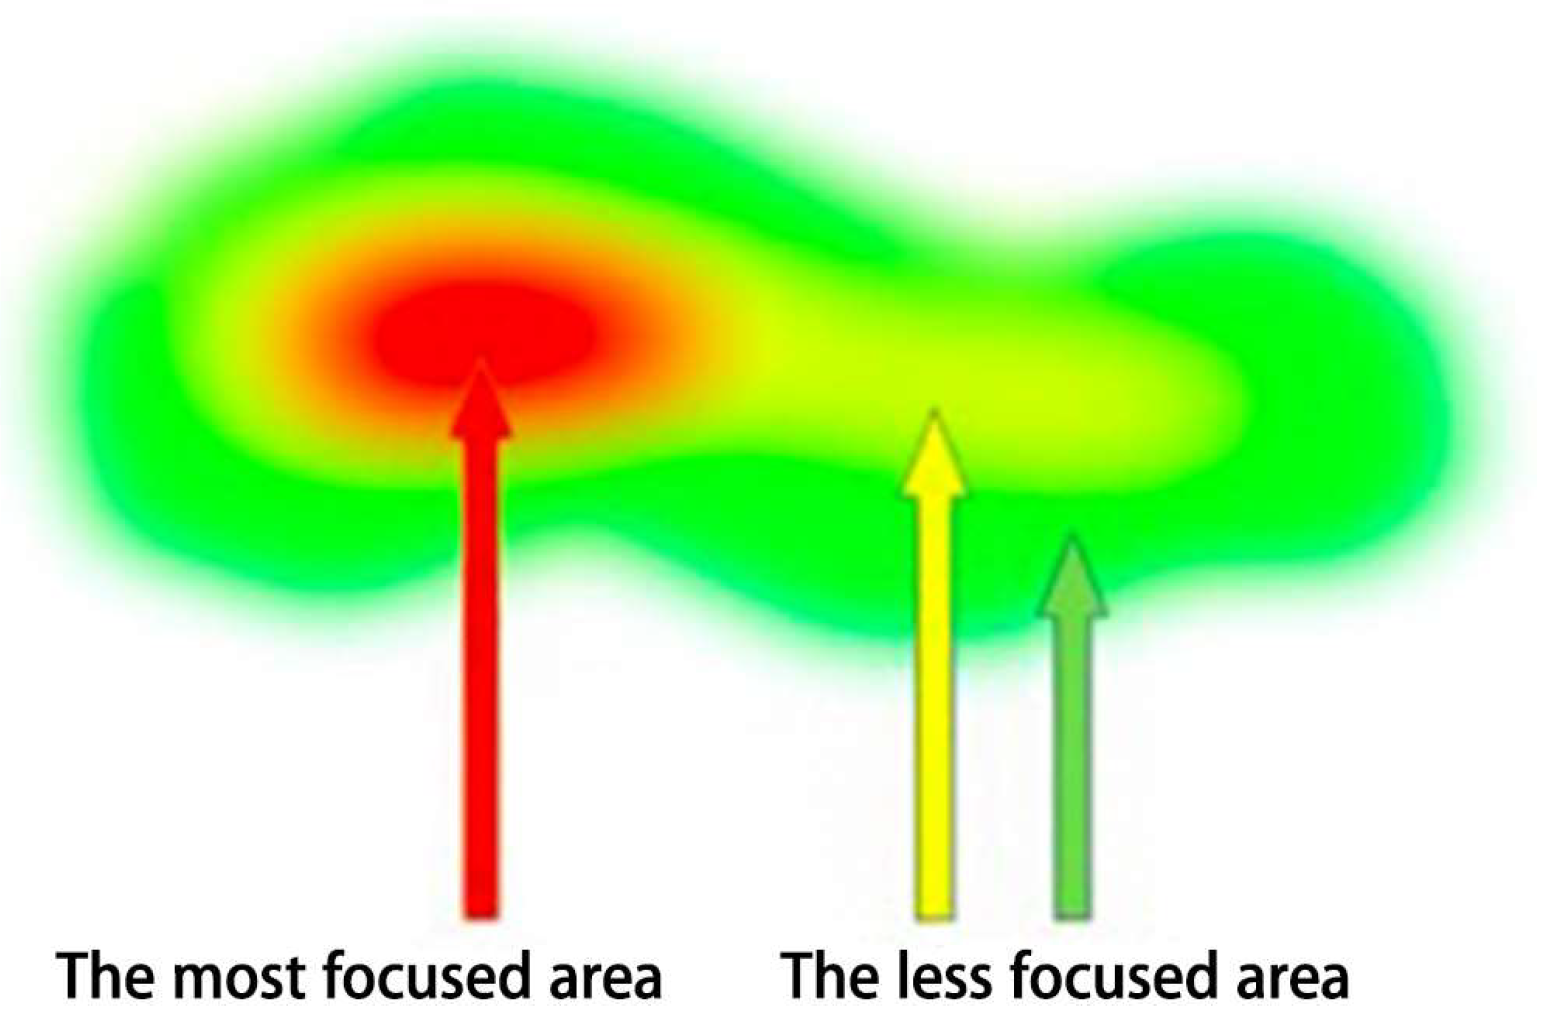
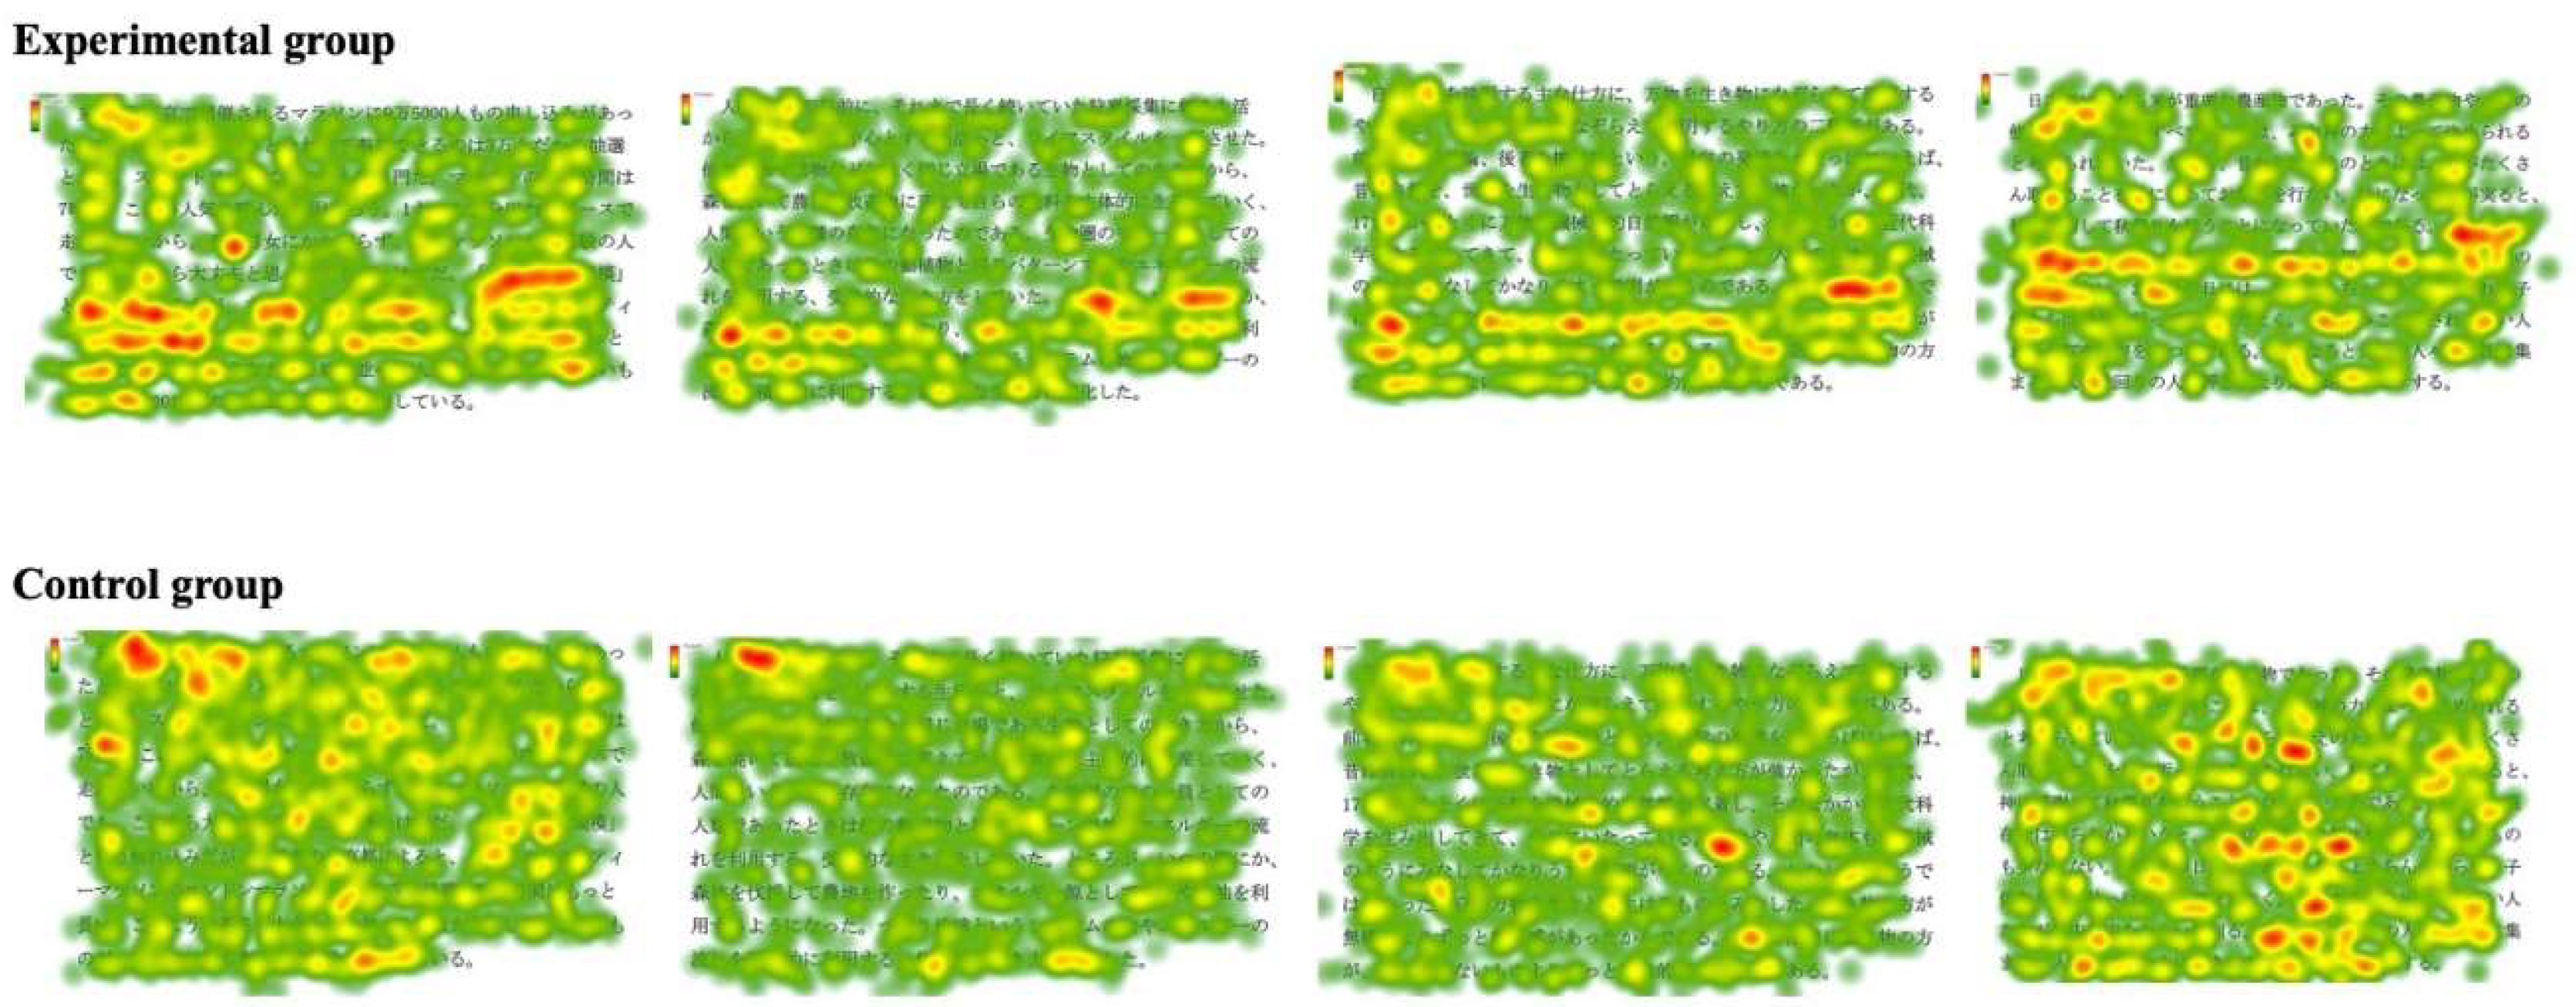
3.5.5. Heat Map
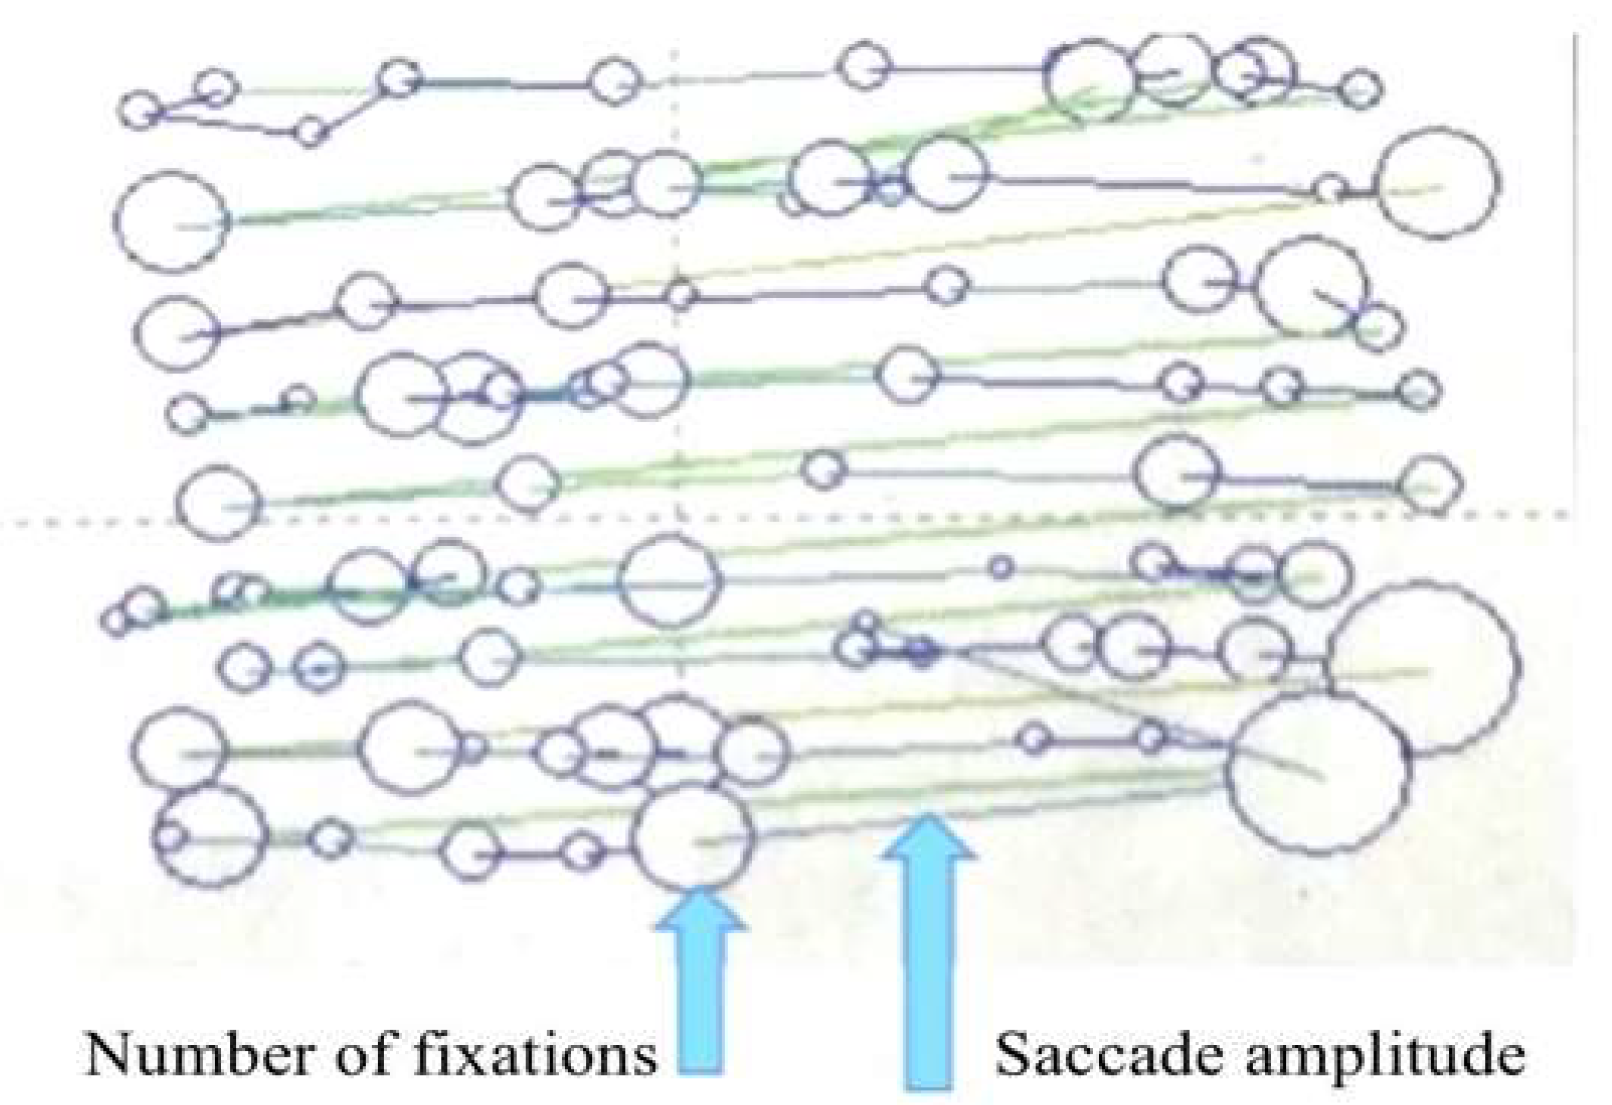
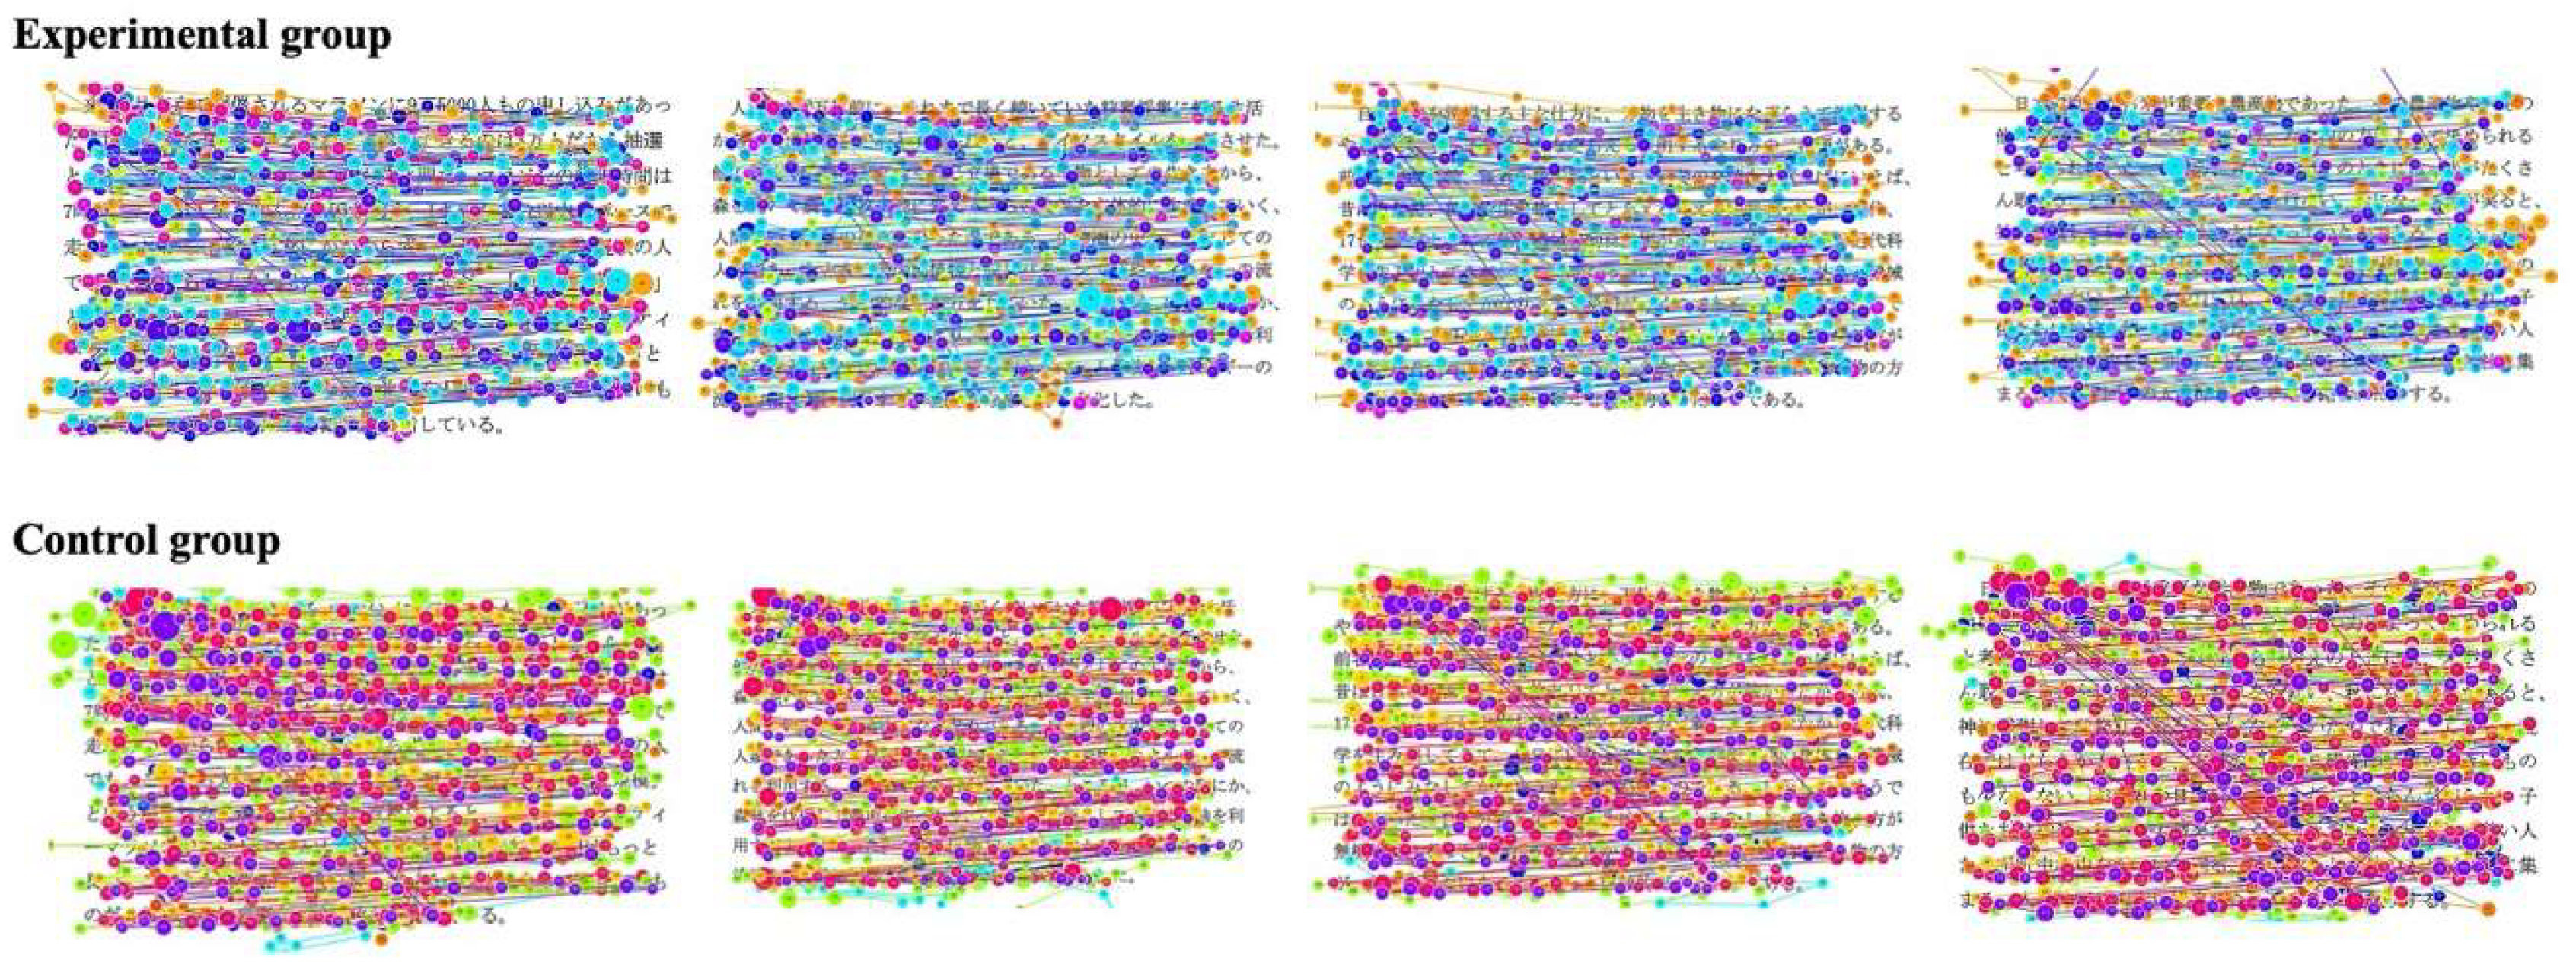
3.5.6. Fixation Trajectory Map
3.6. Reading Comprehension Indicators
4. Findings and Discussions
4.1. Eye Movement Indicators Analysis
4.2. Heat Map Analysis
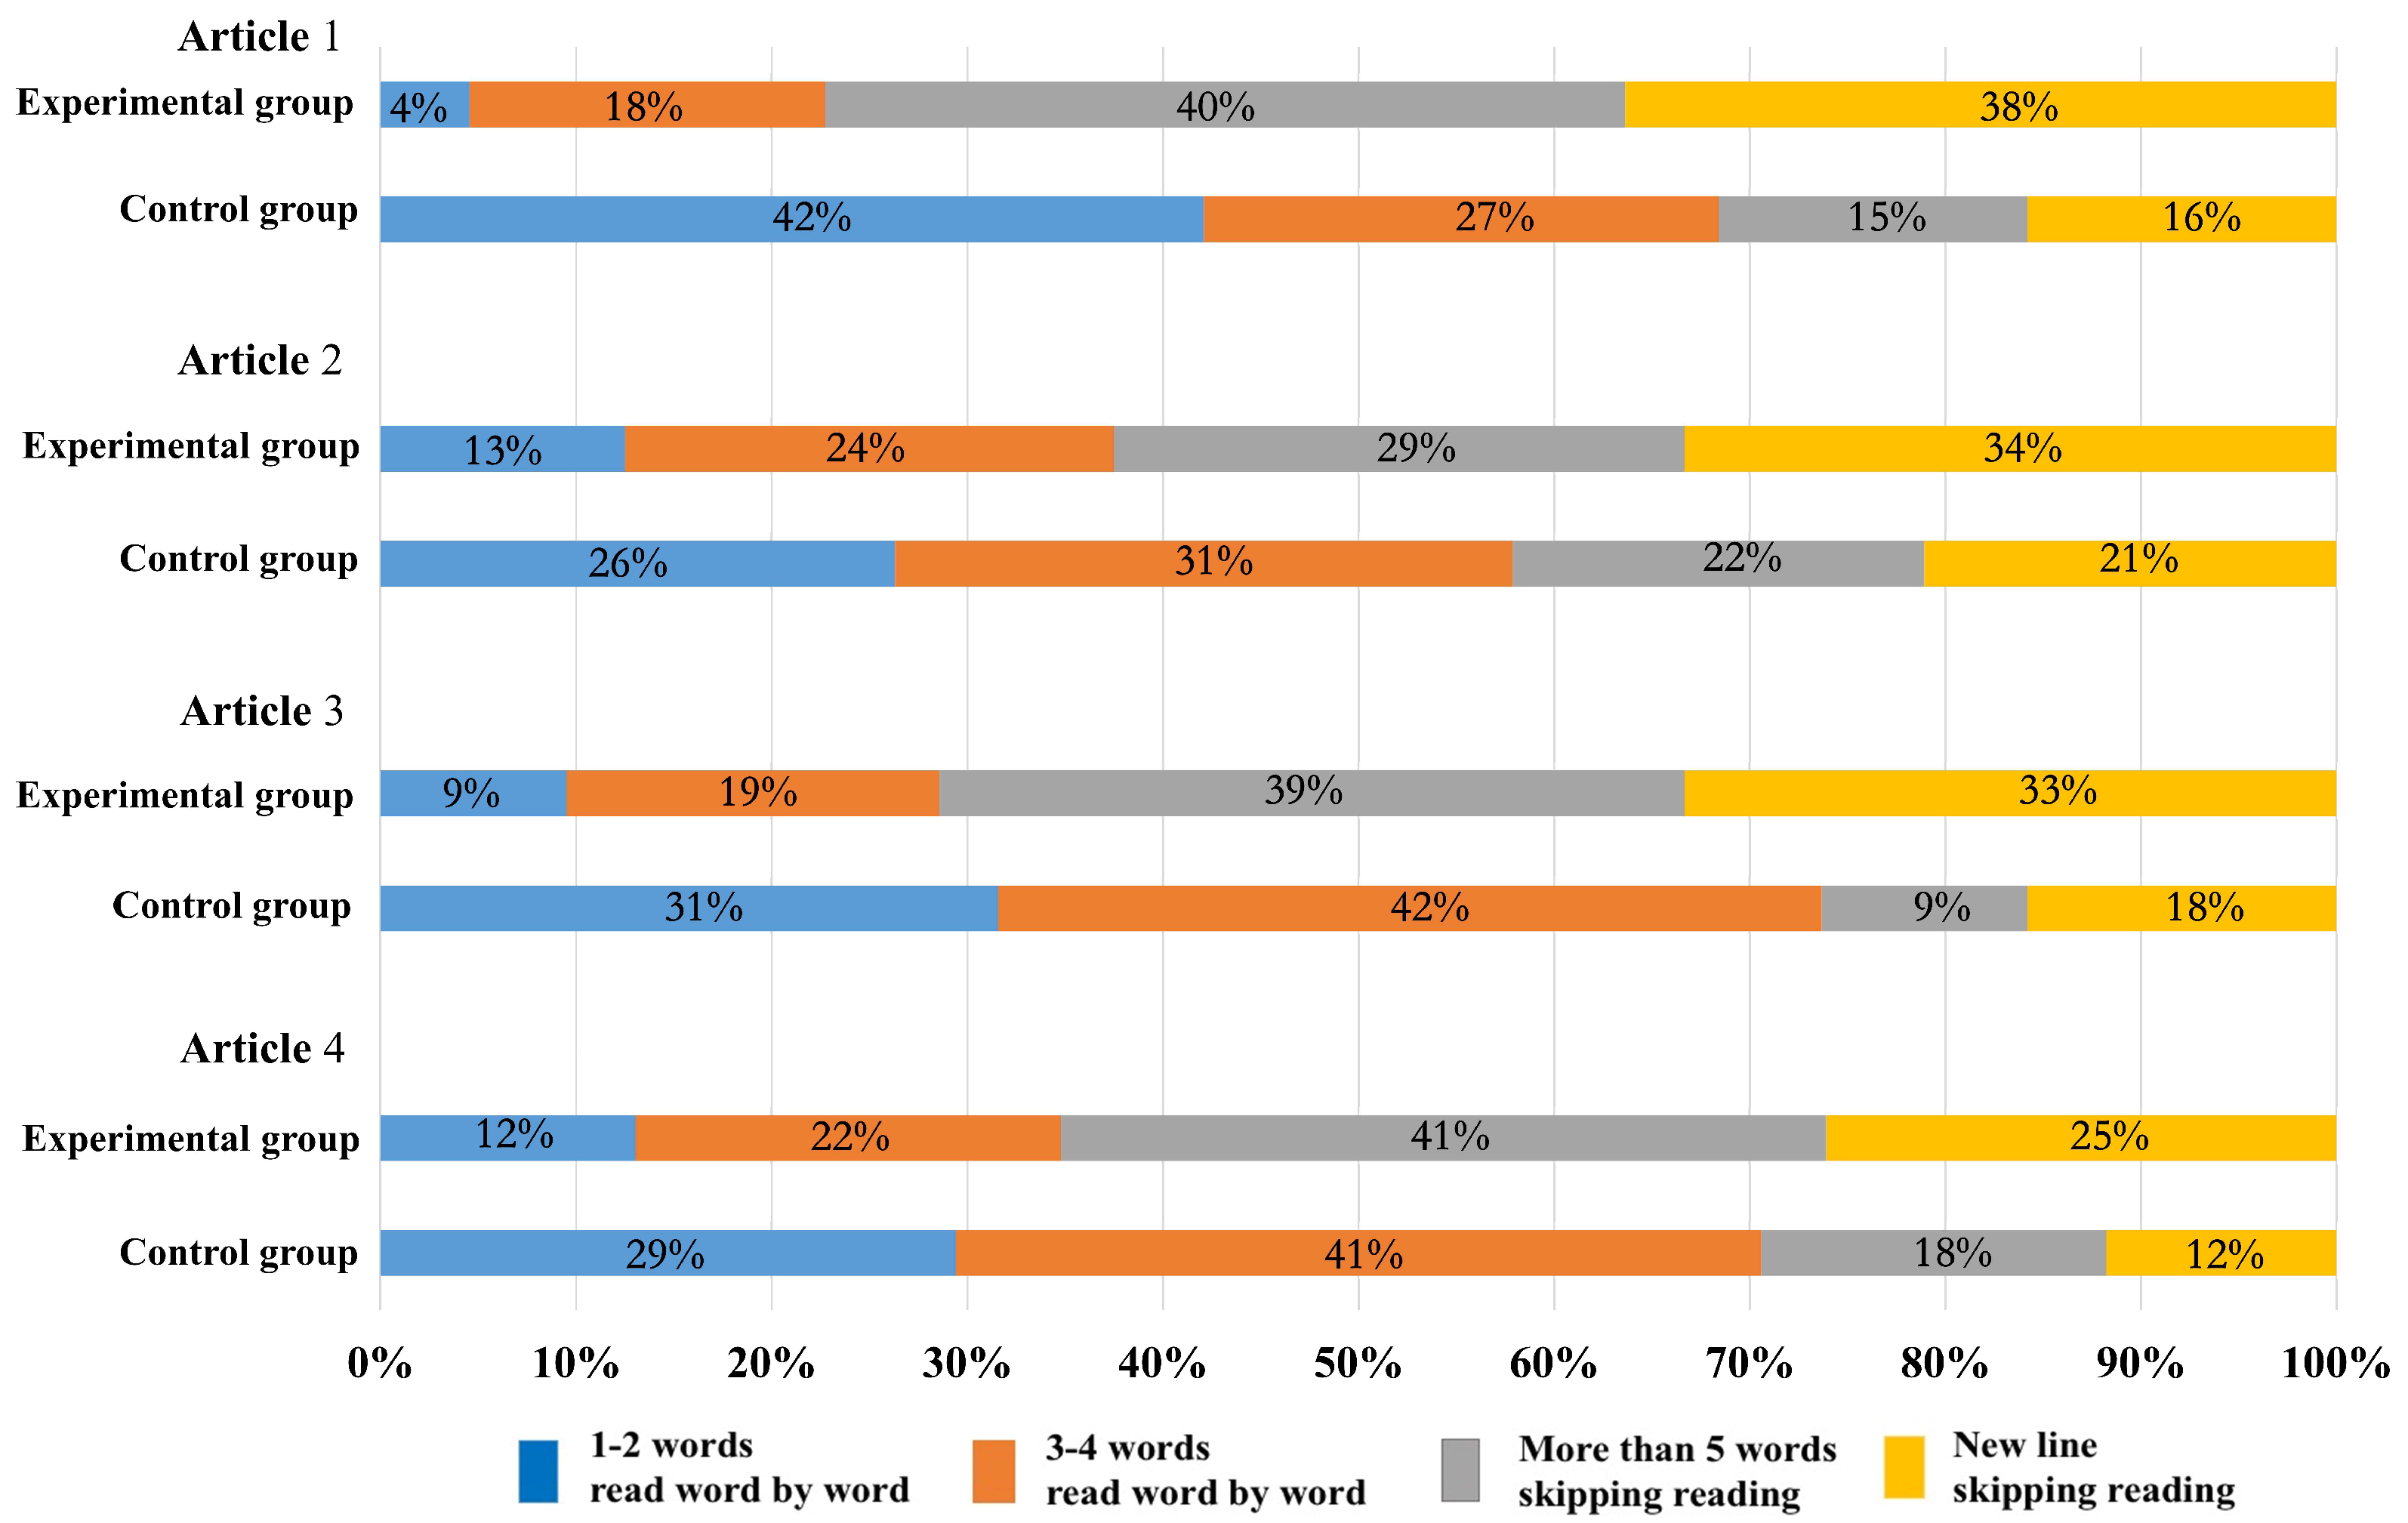
4.3. Fixation Trajectory Map Analysis
4.4. Reading Comprehension Indicators Analysis
5. Conclusions
Author Contributions
Funding
Conflicts of Interest
References
- Nuttel, C. Teaching Reading Skills in a Foreign Language; Heinemann International: London, UK, 1982. [Google Scholar]
- Cohen, A.D. Mentalistic measures in reading strategy research: Some recent findings. Engl. Specif. Purp. 1986, 5, 131–145. [Google Scholar] [CrossRef]
- Buzan, T.; Buzan, B. The Mind Map Book; BBC Active Press: Harlow, UK, 2010. [Google Scholar]
- Hyerle, D. Visual Tools for Constructing Knowledge; Association for Supervision and Curriculum Development: Alexandria, VA, USA, 1996. [Google Scholar]
- Marton, F.; Booth, S. Learning and Awareness; Lawrence Erlbaum Associates Publishers: Mahwah, NJ, USA, 1997. [Google Scholar]
- Bahareh, M.; Abbas, B. The effect of mind mapping strategy on comprehending implicit information in EFL reading texts. Int. J. Educ. Investig. 2015, 2, 81–90. [Google Scholar]
- San, R.R. The use of mind mapping in teaching reading comprehension. ELTIN J. 2013, 1, 32–43. [Google Scholar]
- Andriani, D. The influence of mind mapping in teaching reading comprehension to the eighth grade students of SMP muhammadiyah 1 rawa bening. Titian Ilmu: J. Ilm. Multi Sci. 2017, 9, 66–71. [Google Scholar] [CrossRef]
- Wang, Y.T. A Comparative Study of the Eye Movement Process of English Texts in Chinese and Canadian College Students. J. Qinghai Norm. Univ. (Philos. Soc. Sci. Ed.) 2005, 109, 127–129. [Google Scholar]
- Peng, Y.L. Language Psychology; Beijing Normal University Press: Beijing, China, 1991. [Google Scholar]
- Katarzyna, H.; Pawel, K. Understanding eye movement signal characteristics based on their dynamical and fractal features. Sensors 2019, 19, 626. [Google Scholar]
- Zhan, W.L.; Shen, Z.L.; Wang, J.F. Research on eye movement tracking in ESL reading. Sens. Transducers 2014, 173, 272–278. [Google Scholar]
- Just, M.A.; Carpenter, P.A. A theory of reading: From eye fixation to comprehension. Psychol. Rev. 1980, 87, 329–354. [Google Scholar] [CrossRef]
- Rayner, K.; Sereno, S.C. Eye movements in reading: Psycholinguistic studies. In Handbook of Psycholinguistics; Gernsbacher, M.A., Ed.; Academic: San Diego, CA, USA, 1994. [Google Scholar]
- Rayner, K. Eye movements in reading and information processing: 20 years of research. Psychol. Bull. 1998, 124, 372–422. [Google Scholar] [CrossRef]
- Aurora, B.; Lorenzo, M.; Yuri, B. Observing pictures and videos of creative products: An eye tracking study. Appl. Sci. 2020, 10, 1480. [Google Scholar]
- Keith, R.; Charles, C.J. Handbook of Psychology. In Language Processing; John Wiley & Sons. Inc.: Hoboken, NY, USA, 2003. [Google Scholar]
- Liversedge, S.P.; Findlay, J.M. Saccadic eye movements and cognition. Trends Cogn. Sci. 2000, 4, 6–14. [Google Scholar] [CrossRef]
- Hai, Y.C. The development process of eye tracker and eye movement experiment method. J. Psychol. Sci. 2000, 4, 454–457. [Google Scholar]
- Mancheva, L.; Reichle, E.D.; Lemaire, B.; Valdois, S.; Ecalle, J.; Guérin-Dugué, A. An analysis of reading skill development using E-Z Reader. J. Cogn. Psychol. 2015, 27, 657–676. [Google Scholar] [CrossRef]
- Ikeda, M.; Saida, S. Span of recognition in reading. Vis. Res. 1978, 18, 83–88. [Google Scholar] [CrossRef]
- Balota, D.A.; Pollatsek, A.; Rayner, K. The interaction of contextual constraints and parafoveal visual information in reading. Cogn. Psychol. 1985, 17, 364–390. [Google Scholar] [CrossRef]
- Wu, D.; Shu, H. The application of eye movement technology in reading research. Adv. Psychol. Sci. 2001, 9, 319–322. [Google Scholar]
- Zhan, Z.H. An emotional and cognitive recognition model for distance learners based on intelligent agent-the coupling of eye tracking and expression recognition techniques. Mod. Distance Educ. Res. 2013, 5, 100–105. [Google Scholar]
- Zhan, Z.H.; Liang, T.; Ma, Z.C. Distance learning supporting services based on virtual assistant and its technical difficulties. Mod. Distance Educ. Res. 2014, 6, 95–103. [Google Scholar]
- Zambarbieri, D.T.; Carniglia, E. Eye movement analysis of reading from computer displays, eReaders and printed books. Ophthalmic Physiol. Opt. 2012, 32, 390–396. [Google Scholar] [CrossRef]
- Rivas-Lalaleo, D.R.; Luna, V.; Álvarez, M.; Andaluz, V.H.; Quevedo, W.X.; Santana, A.; Vayas-Ortega, G.; Navas, M.; Huerta, M.; Huang, T.-C.; et al. System of evaluation for reading based on eye tracking. Intell. Tutoring Syst. 2017, 10676, 234–241. [Google Scholar] [CrossRef]
- Krieber, M.; Bartl-Pokorny, K.D.; Pokorny, F.B.; Einspieler, C.; Langmann, A.; Korner, C.; Falck-Ytter, T.; Marschik, P.B. The relation between reading skills and eye movement patterns in adolescent Readers: Evidence from a regular orthography. PLoS ONE 2016, 11, e0145934. [Google Scholar] [CrossRef] [PubMed]
- Rayner, K.; Slattery, T.J.; Bélanger, N.N. Eye movements, the perceptual span, and reading speed. Psychon. Bull. Rev. 2010, 17, 834–839. [Google Scholar] [CrossRef] [PubMed]
- Everatt, J.; Underwood, G. Individual differences in reading subprocesses: Relationships between reading ability, lexical access, and eye movement control. Lang. Speech 1994, 37, 283–297. [Google Scholar] [CrossRef] [PubMed]
- Häikiö, T.; Bertram, R.; Hyönä, J.; Niemi, P. Development of the letter identity span in reading: Evidence from the eye movement moving window paradigm. J. Exp. Child Psychol. 2009, 102, 167–181. [Google Scholar] [CrossRef] [PubMed]
- Ashby, J.; Rayner, K.; Clifton, J.C.; Clifton, J.C. Eye movements of highly skilled and average readers: Differential effects of frequency and predictability. Q. J. Exp. Psychol. Sect. A 2005, 58, 1065–1086. [Google Scholar] [CrossRef]
- Jared, D.; Levy, B.A.; Rayner, K. The role of phonology in the activation of word meanings during reading: Evidence from proofreading and eye movements. J. Exp. Psychol.-Gen. 1999, 128, 219–264. [Google Scholar] [CrossRef]
- Van Gerven, P.W.M.; Paas, F.; Van Merriënboer, J.J.G.; Schmidt, H. Cognitive load theory and aging: Effects of worked examples on training efficiency. Learn. Instr. 2002, 12, 87–105. [Google Scholar] [CrossRef]
- Zhang, X.F.; Ye, W.L. Review of eye movement indexes in current reading research. Psychol. Behav. Res. 2006, 4, 236–240. [Google Scholar]
- Beymer, D.; Russell, D.M.; Orton, P.Z. Wide vs. Narrow paragraphs: An eye tracking analysis. In Engineering Trustworthy Software Systems; Springer: Berlin, Germany, 2005; pp. 741–752. [Google Scholar]
- Chamberlain, L. Eye tracking methodology; theory and practice. Qual. Mark. Res. 2007, 10, 217–220. [Google Scholar] [CrossRef]
- Dong, W.; Ying, Q.; Yang, Y.; Tang, S.; Zhan, Z.; Liu, B.; Meng, L. Using eye tracking to explore the impacts of geography courses on map-based spatial ability. Sustainability 2018, 11, 76. [Google Scholar] [CrossRef]
- Holmqvist, K.; Nyström, M.; Andersson, R.; Dewhurst, R.; Jarodzka, H.; Van de Weijer, J. Eye Tracking: A Comprehensive Guide to Methods and Measures; Oxford University Press: Oxford, UK, 2011. [Google Scholar]
- Radach, R.; Kennedy, A. Theoretical perspectives on eye movements in reading: Past controversies, current issues, and an agenda for future research. Eur. J. Cogn. Psychol. 2004, 16, 3–26. [Google Scholar] [CrossRef]
- Irwin, D.E. Lexical processing during saccadic eye movements. Cogn. Psychol. 1998, 36, 1–27. [Google Scholar] [CrossRef] [PubMed]
- Heo, H.; Lee, W.O.; Shin, K.Y.; Park, K.R. Quantitative measurement of eyestrain on 3D stereoscopic display considering the eye foveation model and edge information. Sensors 2014, 14, 8577–8604. [Google Scholar] [CrossRef] [PubMed]
- Bang, J.W.; Heo, H.; Choi, J.-S.; Park, K.R. Assessment of eye fatigue caused by 3D displays based on multimodal measurements. Sensors 2014, 14, 16467–16485. [Google Scholar] [CrossRef] [PubMed]
- Henderson, J.M. Human gaze control during real-world scene perception. Trends Cogn. Sci. 2003, 7, 498–504. [Google Scholar] [CrossRef] [PubMed]
- Wang, Y.; Liu, S.Q. Research on eye movement characteristics and interface design of multimedia reading for college students. Mod. Distance Educ. 2018, 179, 90–96. [Google Scholar]
- Rayner, K. The 35th sir Frederick Bartlett lecture: Eye movements and attention in reading, scene perception, and visual search. Q. J. Exp. Psychol. 2009, 62, 1457–1506. [Google Scholar] [CrossRef]
- Zuo, Y.F.; Yang, Z.L. Eye tracking research on second language reading in different cultural contexts and difficulties. Psychol. Sci. 2006, 29, 1346–1350. [Google Scholar]
- Bai, X.J.; Li, X.; Yan, G.L. Research on eye movements of English majors reading Chinese and English materials. Psychol. Behav. Res. 2008, 6, 6–10. [Google Scholar]
- Ehmke, C.; Wilson, S.G. Identifying web usability problems from eye-tracking data. In Proceedings of the 21st British HCI Group Annual Conference on People and Computers, Lancaster, UK, 3–7 September 2007. [Google Scholar] [CrossRef]
- Van Orden, K.F.; Limbert, W.; Makeig, S.; Jung, T.P. Eye activity correlates of workload during a visuospatial memory task. Hum. Factors J. Hum. Factors Ergon. Soc. 2001, 43, 111–121. [Google Scholar] [CrossRef]
- Kuperman, V.; Van Dyke, J.A. Effects of individual differences in verbal skills on eye-movement patterns during sentence reading. J. Mem. Lang. 2011, 65, 42–73. [Google Scholar] [CrossRef] [PubMed]
- Rayner, K.; Ardoin, S.P.; Binder, K.S. Children’s eye movements in reading: A commentary. Sch. Psychol. Rev. 2013, 42, 223–233. [Google Scholar]
- Tatler, B.W.; Baddeley, R.J.; Vincent, B. The long and the short of it: Spatial statistics at fixation vary with saccade amplitude and task. Vis. Res. 2006, 46, 1857–1862. [Google Scholar] [CrossRef] [PubMed]
- Hutton, S.B. Cognitive control of saccadic eye movements. Brain Cogn. 2008, 68, 327–340. [Google Scholar] [CrossRef] [PubMed]
- Osaka, R.; Koga, K.; Nakazawa, Y. Eyeball Dynamic Psychology; Nagoya University Press: Nagoya, Japan, 1993. [Google Scholar]


| Item | Group | Pre-Test | Post-Test | t | p | ||
|---|---|---|---|---|---|---|---|
| M | SD | M | SD | ||||
| Reading comprehension test | Experimental group | 78.31 | 2.35 | 84.65 | 2.52 | −2.12 ** | 0.006 |
| Control group | 78.22 | 2.76 | 80.20 | 2.68 | −1.85 | 0.064 | |
| Eye Movement Indicators | Experimental Group | Control Group | t | p | ||
|---|---|---|---|---|---|---|
| M | SD | M | SD | |||
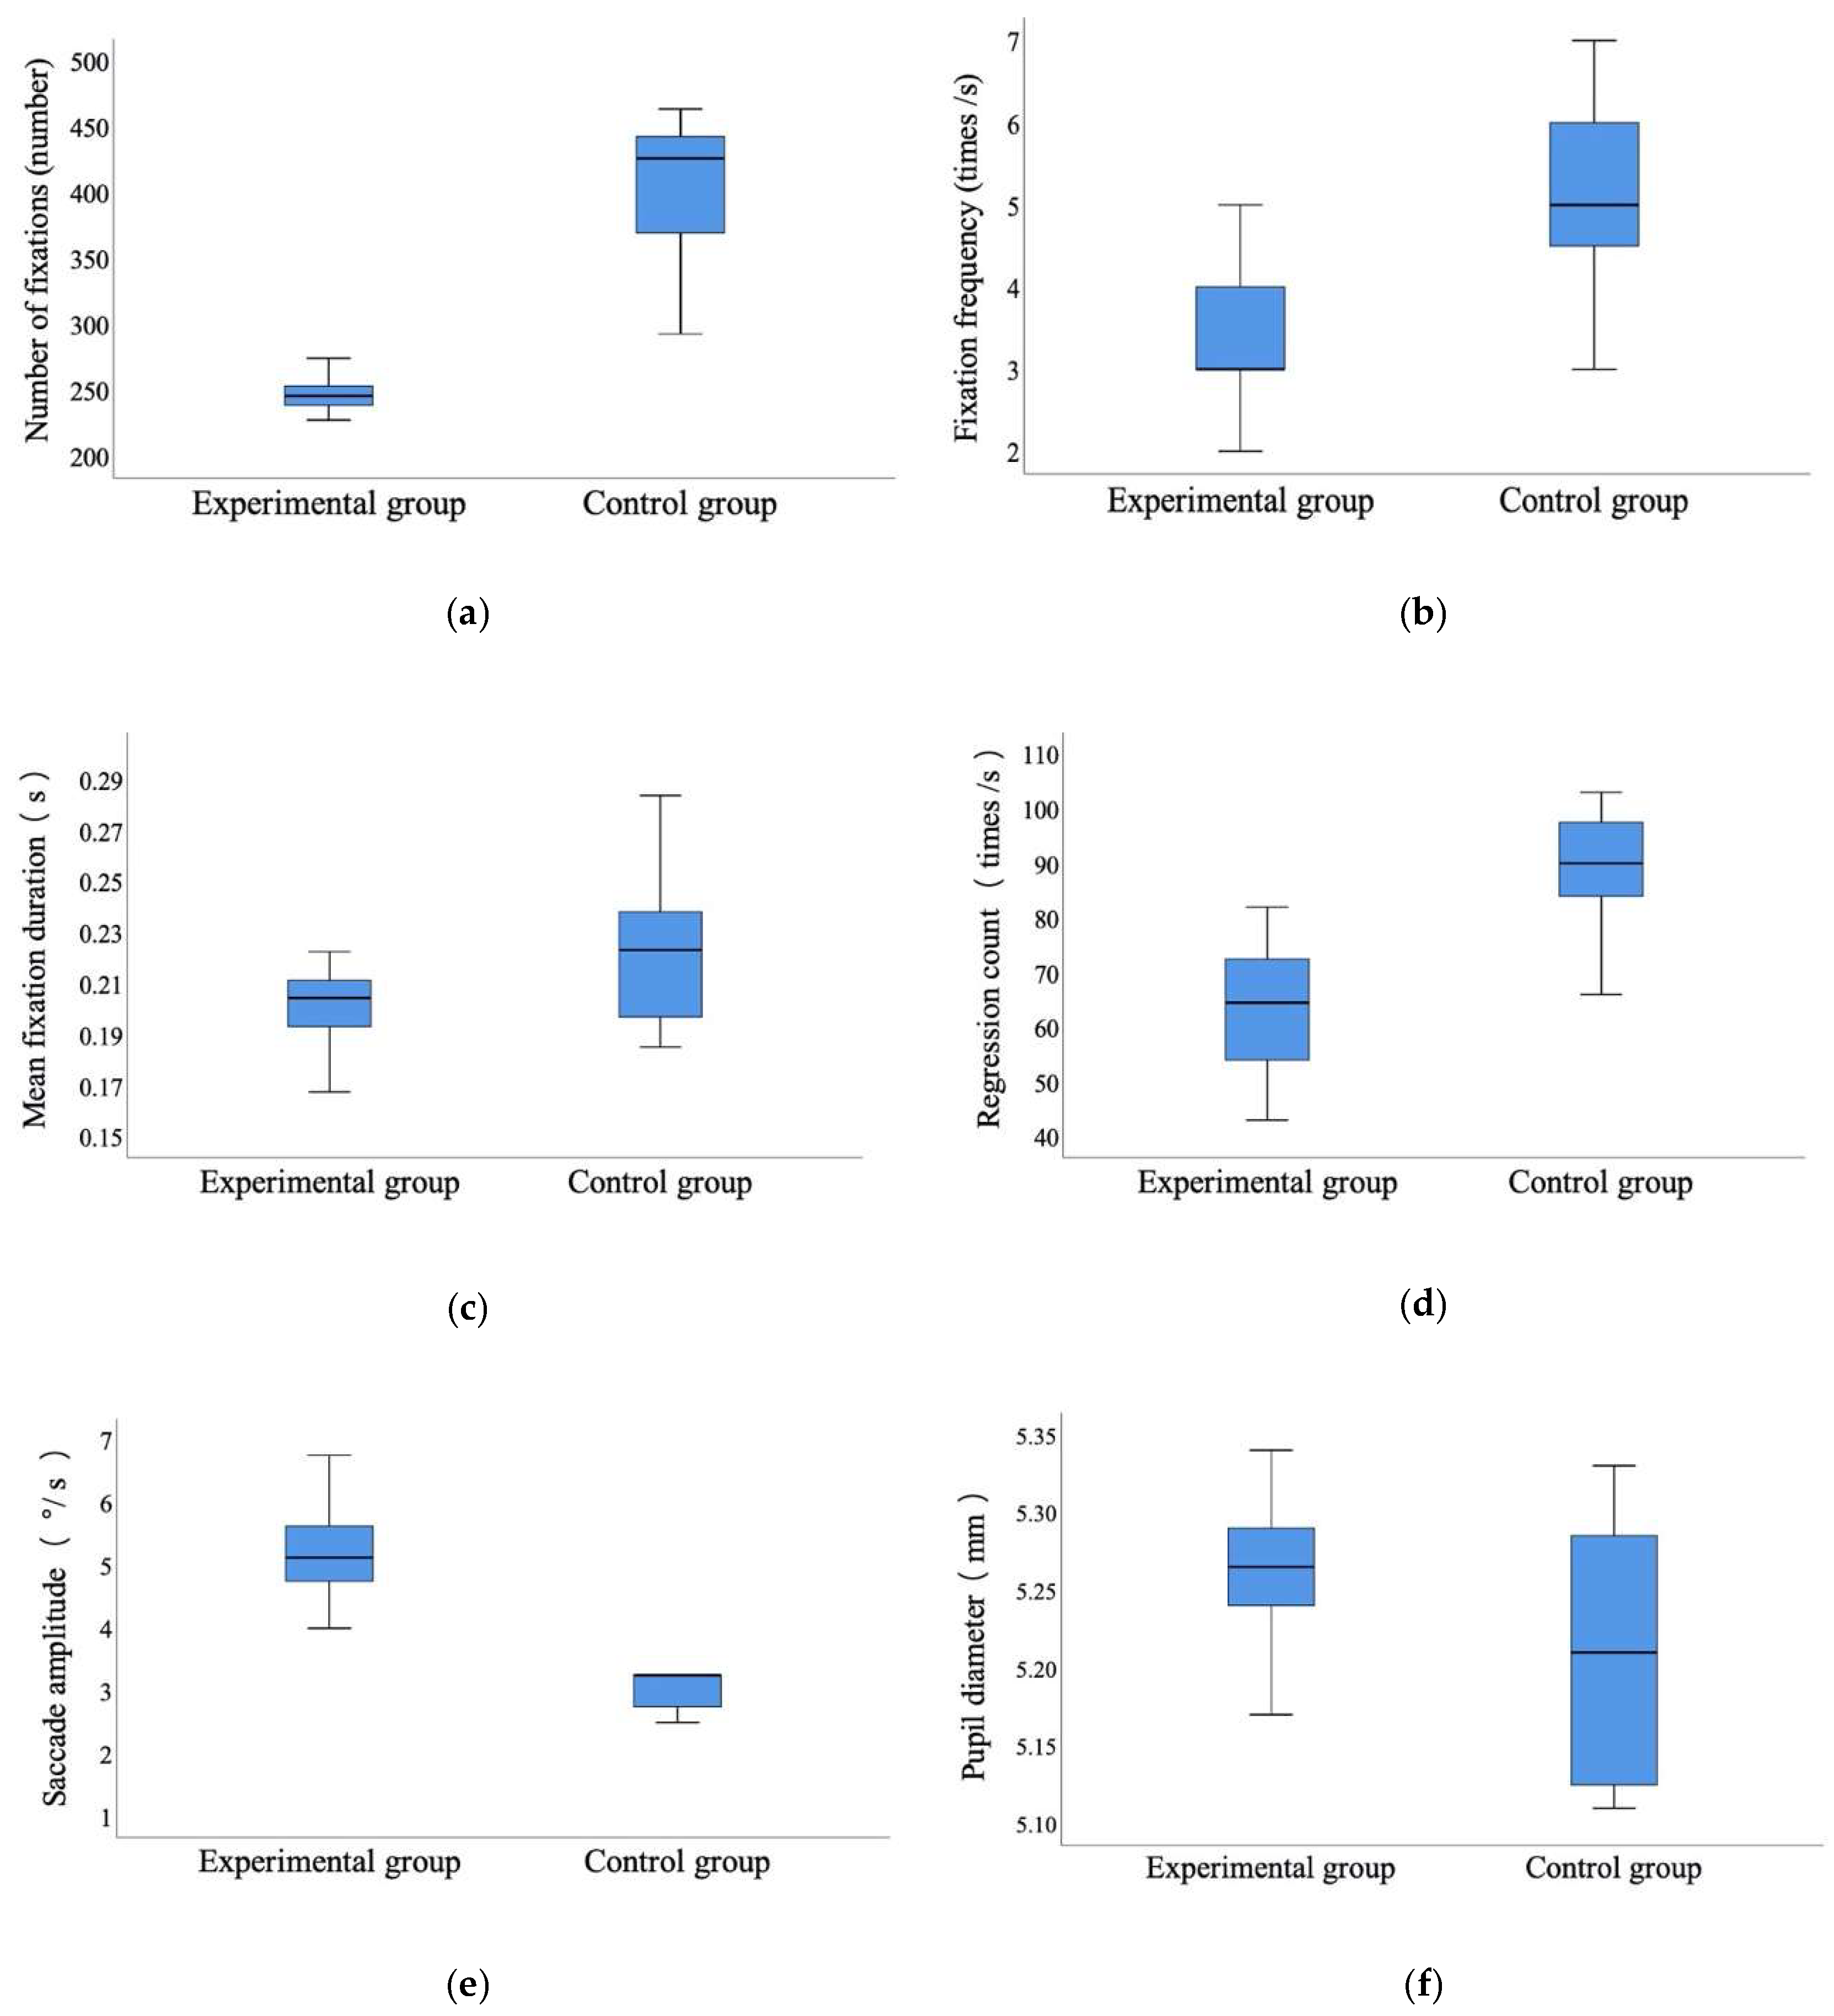
| Number of fixations | 250.91 | 19.16 | 404.70 | 47.78 | 13.375 *** | 0.000 |
| Fixation frequency | 3.60 | 1.19 | 5.10 | 1.12 | −4.094 ** | 0.001 |
| Mean fixation duration | 0.20 | 0.01 | 0.22 | 0.03 | 2.663 * | 0.015 |
| Regression count | 63.15 | 11.80 | 90.00 | 8.94 | 8.062 *** | 0.000 |
| Saccade amplitude | 5.06 | 0.93 | 3.34 | 1.01 | −6.473 *** | 0.000 |
| Pupil diameter | 5.25 | 0.06 | 5.21 | 0.08 | 1.961 | 0.065 |
| Group | Text Area 1 | Text Area 2 | t | p | ||
|---|---|---|---|---|---|---|
| M | SD | M | SD | |||
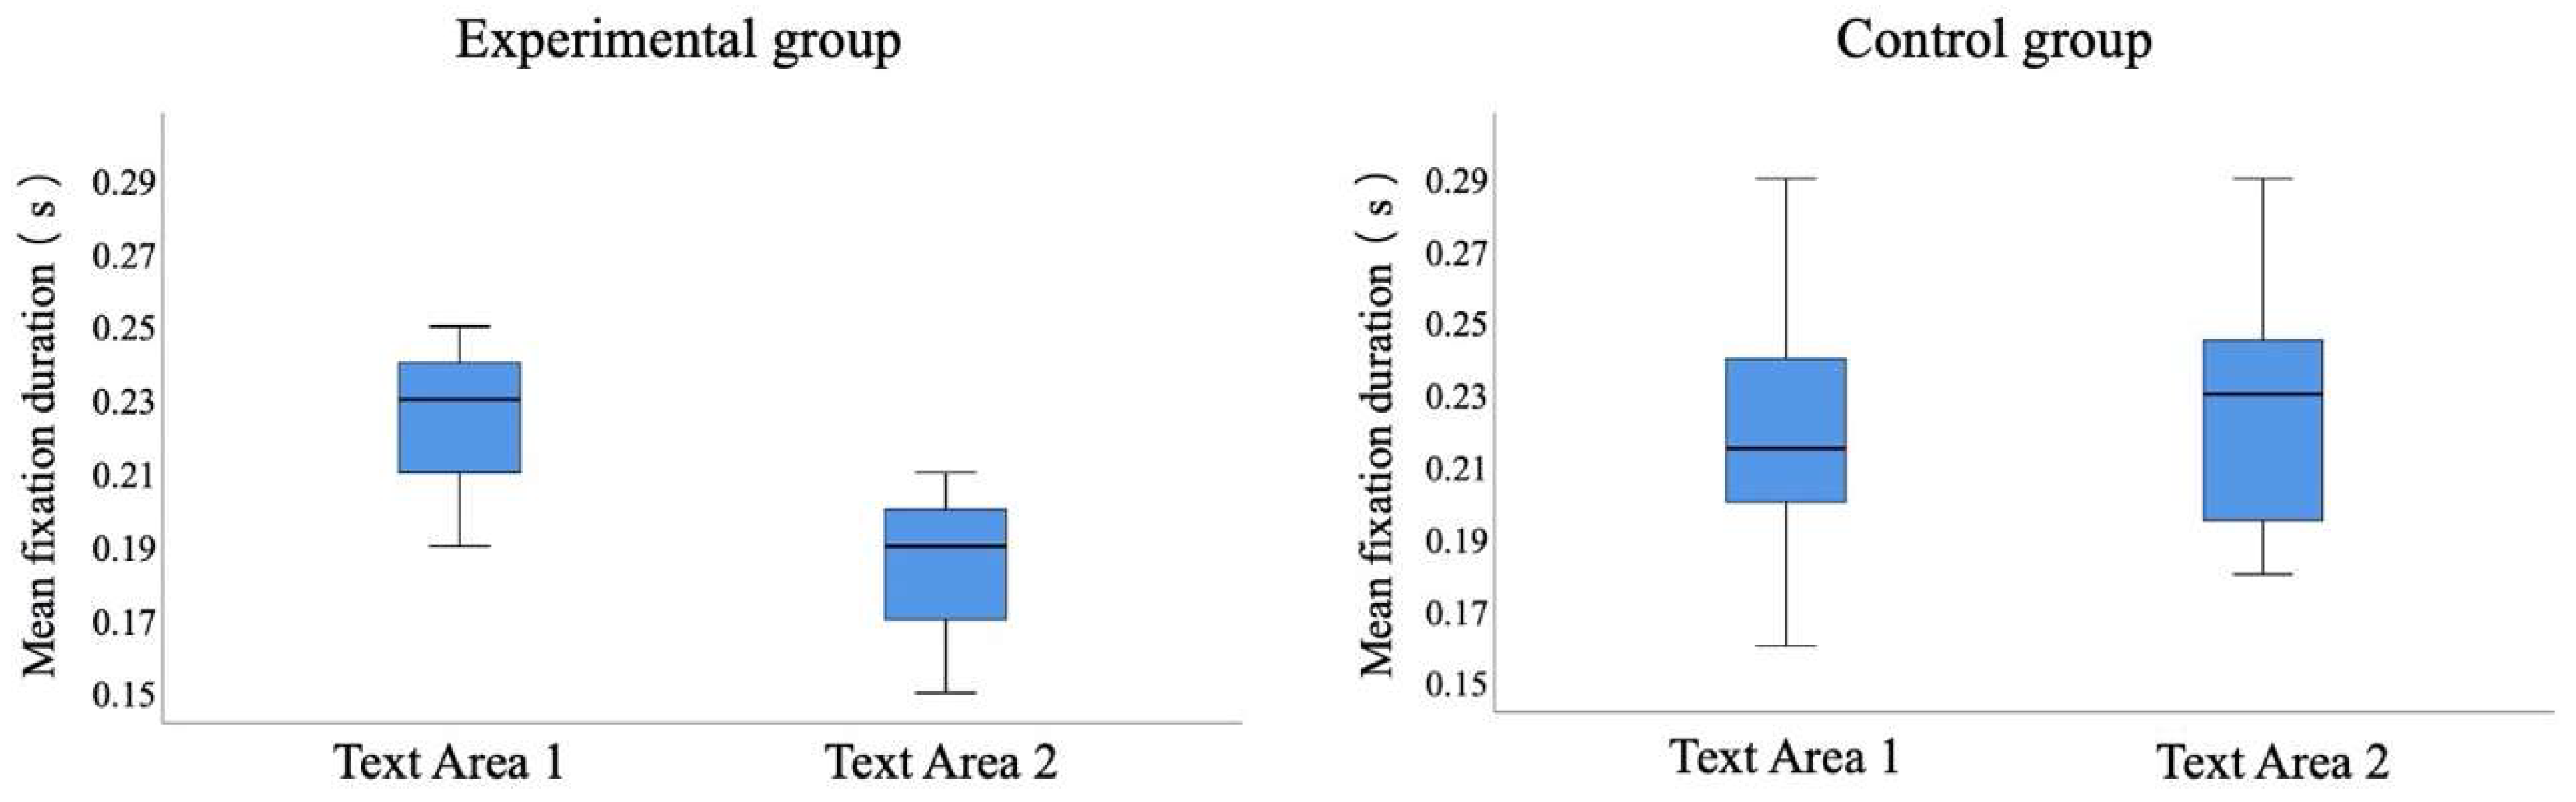
| Experimental group | 0.223 | 0.023 | 0.183 | 0.017 | 6.543 *** | 0.000 |
| Control group | 0.222 | 0.032 | 0.224 | 0.034 | −0.526 | 0.605 |
| Number of fixations | Group | Article 1 | Article 2 | Article 3 | Article 4 | Average |
| Experimental group | 250.50 | 248.70 | 252.85 | 251.60 | 250.91 | |
| Control group | 405.60 | 404.95 | 402.55 | 405.70 | 404.70 | |
| Saccade amplitude | Experimental group | 4.95 | 5.15 | 5.15 | 5.00 | 5.06 |
| Control group | 3.40 | 3.25 | 3.45 | 3.25 | 3.34 |
| Reading Comprehension Indicators | Experimental Group | Control Group | t | p | ||
|---|---|---|---|---|---|---|
| M | SD | M | SD | |||
| Reading time | 1.25 | 0.25 | 1.90 | 0.34 | 6.075 *** | 0.000 |
| Reading speed | 250.90 | 52.87 | 163.52 | 30.89 | −5.674 *** | 0.000 |
| Reading comprehension rate | 0.81 | 0.14 | 0.66 | 0.16 | −3.035 ** | 0.007 |
| Reading efficiency | 200.34 | 49.03 | 109.26 | 38.67 | −5.822 *** | 0.000 |
© 2020 by the authors. Licensee MDPI, Basel, Switzerland. This article is an open access article distributed under the terms and conditions of the Creative Commons Attribution (CC BY) license (http://creativecommons.org/licenses/by/4.0/).
Share and Cite
Liu, T.; Yuizono, T. Mind Mapping Training’s Effects on Reading Ability: Detection Based on Eye Tracking Sensors. Sensors 2020, 20, 4422. https://doi.org/10.3390/s20164422
Liu T, Yuizono T. Mind Mapping Training’s Effects on Reading Ability: Detection Based on Eye Tracking Sensors. Sensors. 2020; 20(16):4422. https://doi.org/10.3390/s20164422
Chicago/Turabian StyleLiu, Ting, and Takaya Yuizono. 2020. "Mind Mapping Training’s Effects on Reading Ability: Detection Based on Eye Tracking Sensors" Sensors 20, no. 16: 4422. https://doi.org/10.3390/s20164422
APA StyleLiu, T., & Yuizono, T. (2020). Mind Mapping Training’s Effects on Reading Ability: Detection Based on Eye Tracking Sensors. Sensors, 20(16), 4422. https://doi.org/10.3390/s20164422