Dimensionality Reduction of Hyperspectral Images Based on Improved Spatial–Spectral Weight Manifold Embedding


Abstract
1. Introduction
- A new weight matrix is constructed to describe the structure between samples, in which the product of the spatial–spectral distance weight matrix and the structure weight matrix is taken as a new data weight matrix. Compared with the previous weight matrix, which only considers spectral distance or spatial distance, the new weight matrix integrates the spatial–spectral information and structural characteristic of the data.
- The model not only makes the manifold structure invariant, but also preserves the nearest neighbor relationship of the samples, when the high-dimensional data are projecting to the low-dimensional space.
2. Related Works
2.1. Local Linear Embedding
2.2. Laplacian Eigenmaps
3. Improved Spatial–Spectral Weight Manifold Embedding
3.1. Spatial–Spectral Weight Setting
3.2. ISS-WME Model
| Algorithm 1 Process of the ISS-WME Algorithm |
| Input: HSI data set and , low-dimensional space , K is the nearest neighbor. 1: HSI is segmented into superpixels using the SLIC segmentation method and randomly select training samples (for Pavia University, training samples are 2%, 4%, 6%, 8%, 10%), and then use Equations (7) and (8) to calculate the spatial–spectral distance matrix between superpixels. In addition, make sure the number of superpixels and training samples is the same. 2: Then, use Equations (12) and (13) to obtain the structure representation matrix between training samples. The product of the two types of matrices is taken as the new matrix Equation (14). 3: According to the local manifold structure and nearest neighbor relationship of the samples, the objective function of Equation (16) is constructed. 4: By solving the generalized feature of Equation (18), the corresponding eigenvector is obtained. 5: Learn a projection matrix P. Output: The data in low-dimensional space is |
4. Experiments and Discussion
4.1. Data Sets and Parameter Setting
4.1.1. Data Sets
4.1.2. Experimental Parameter Settings
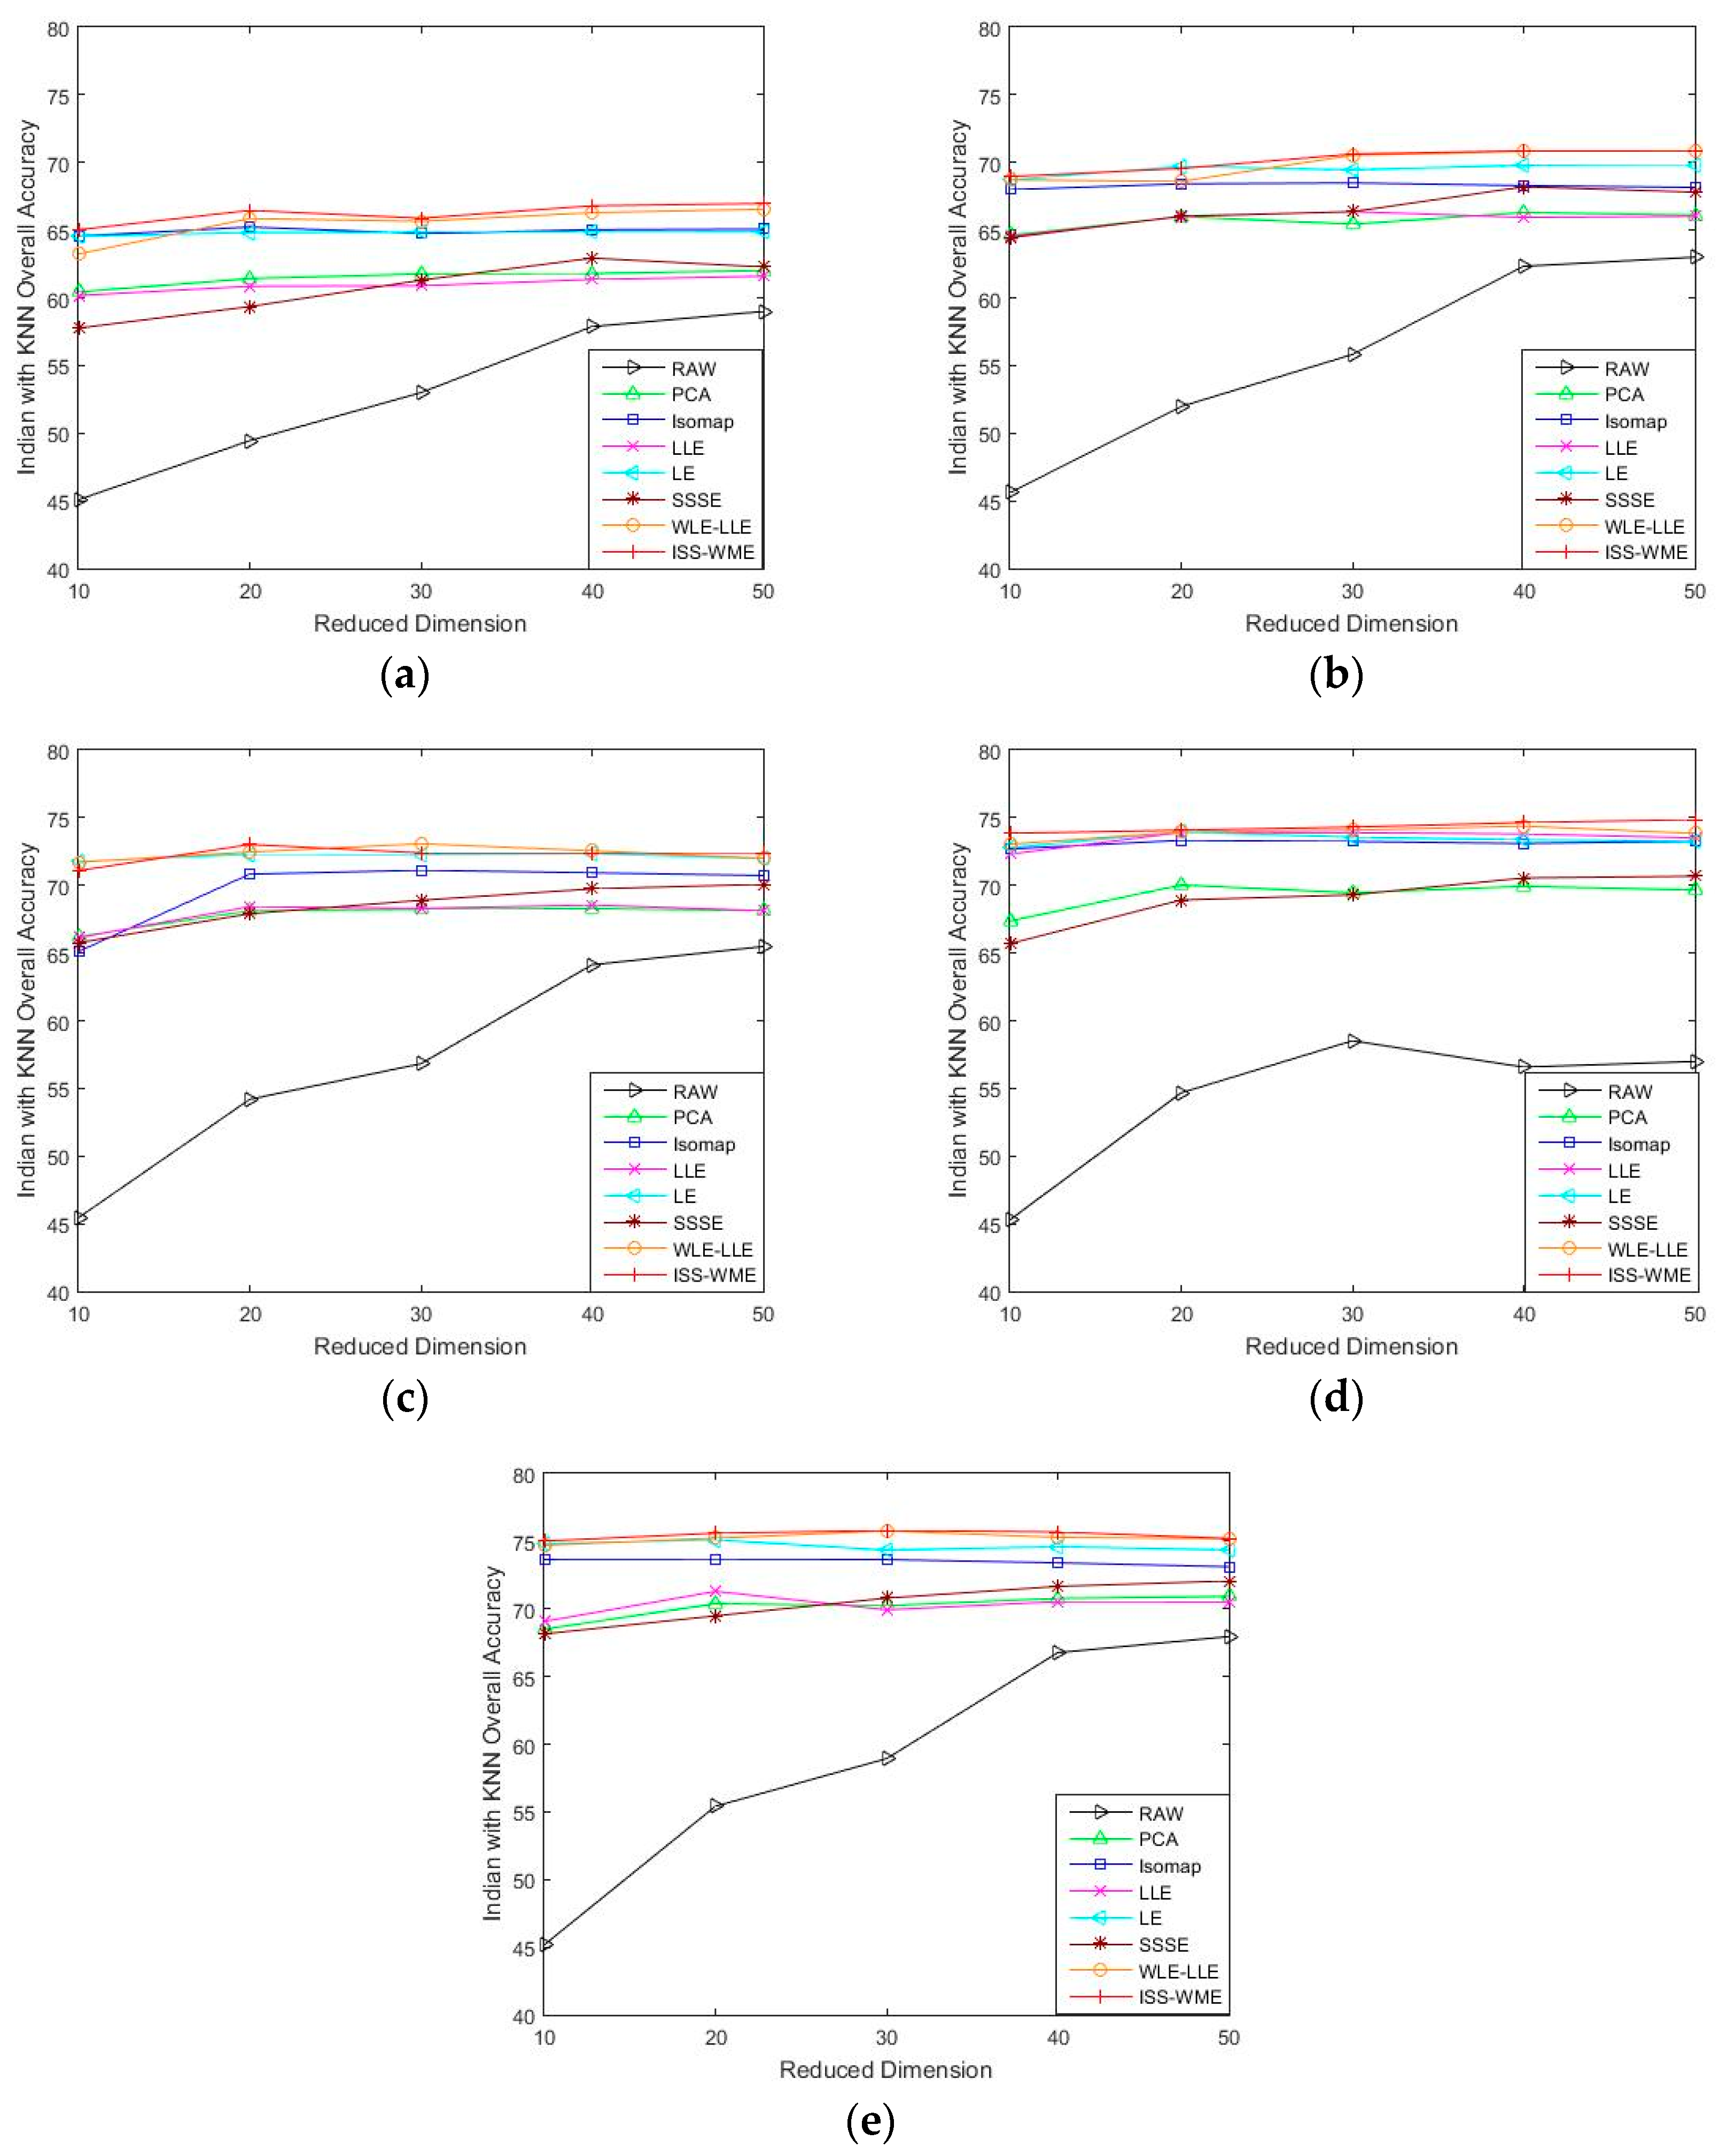
4.2. Results for the Indian Pines Data Set
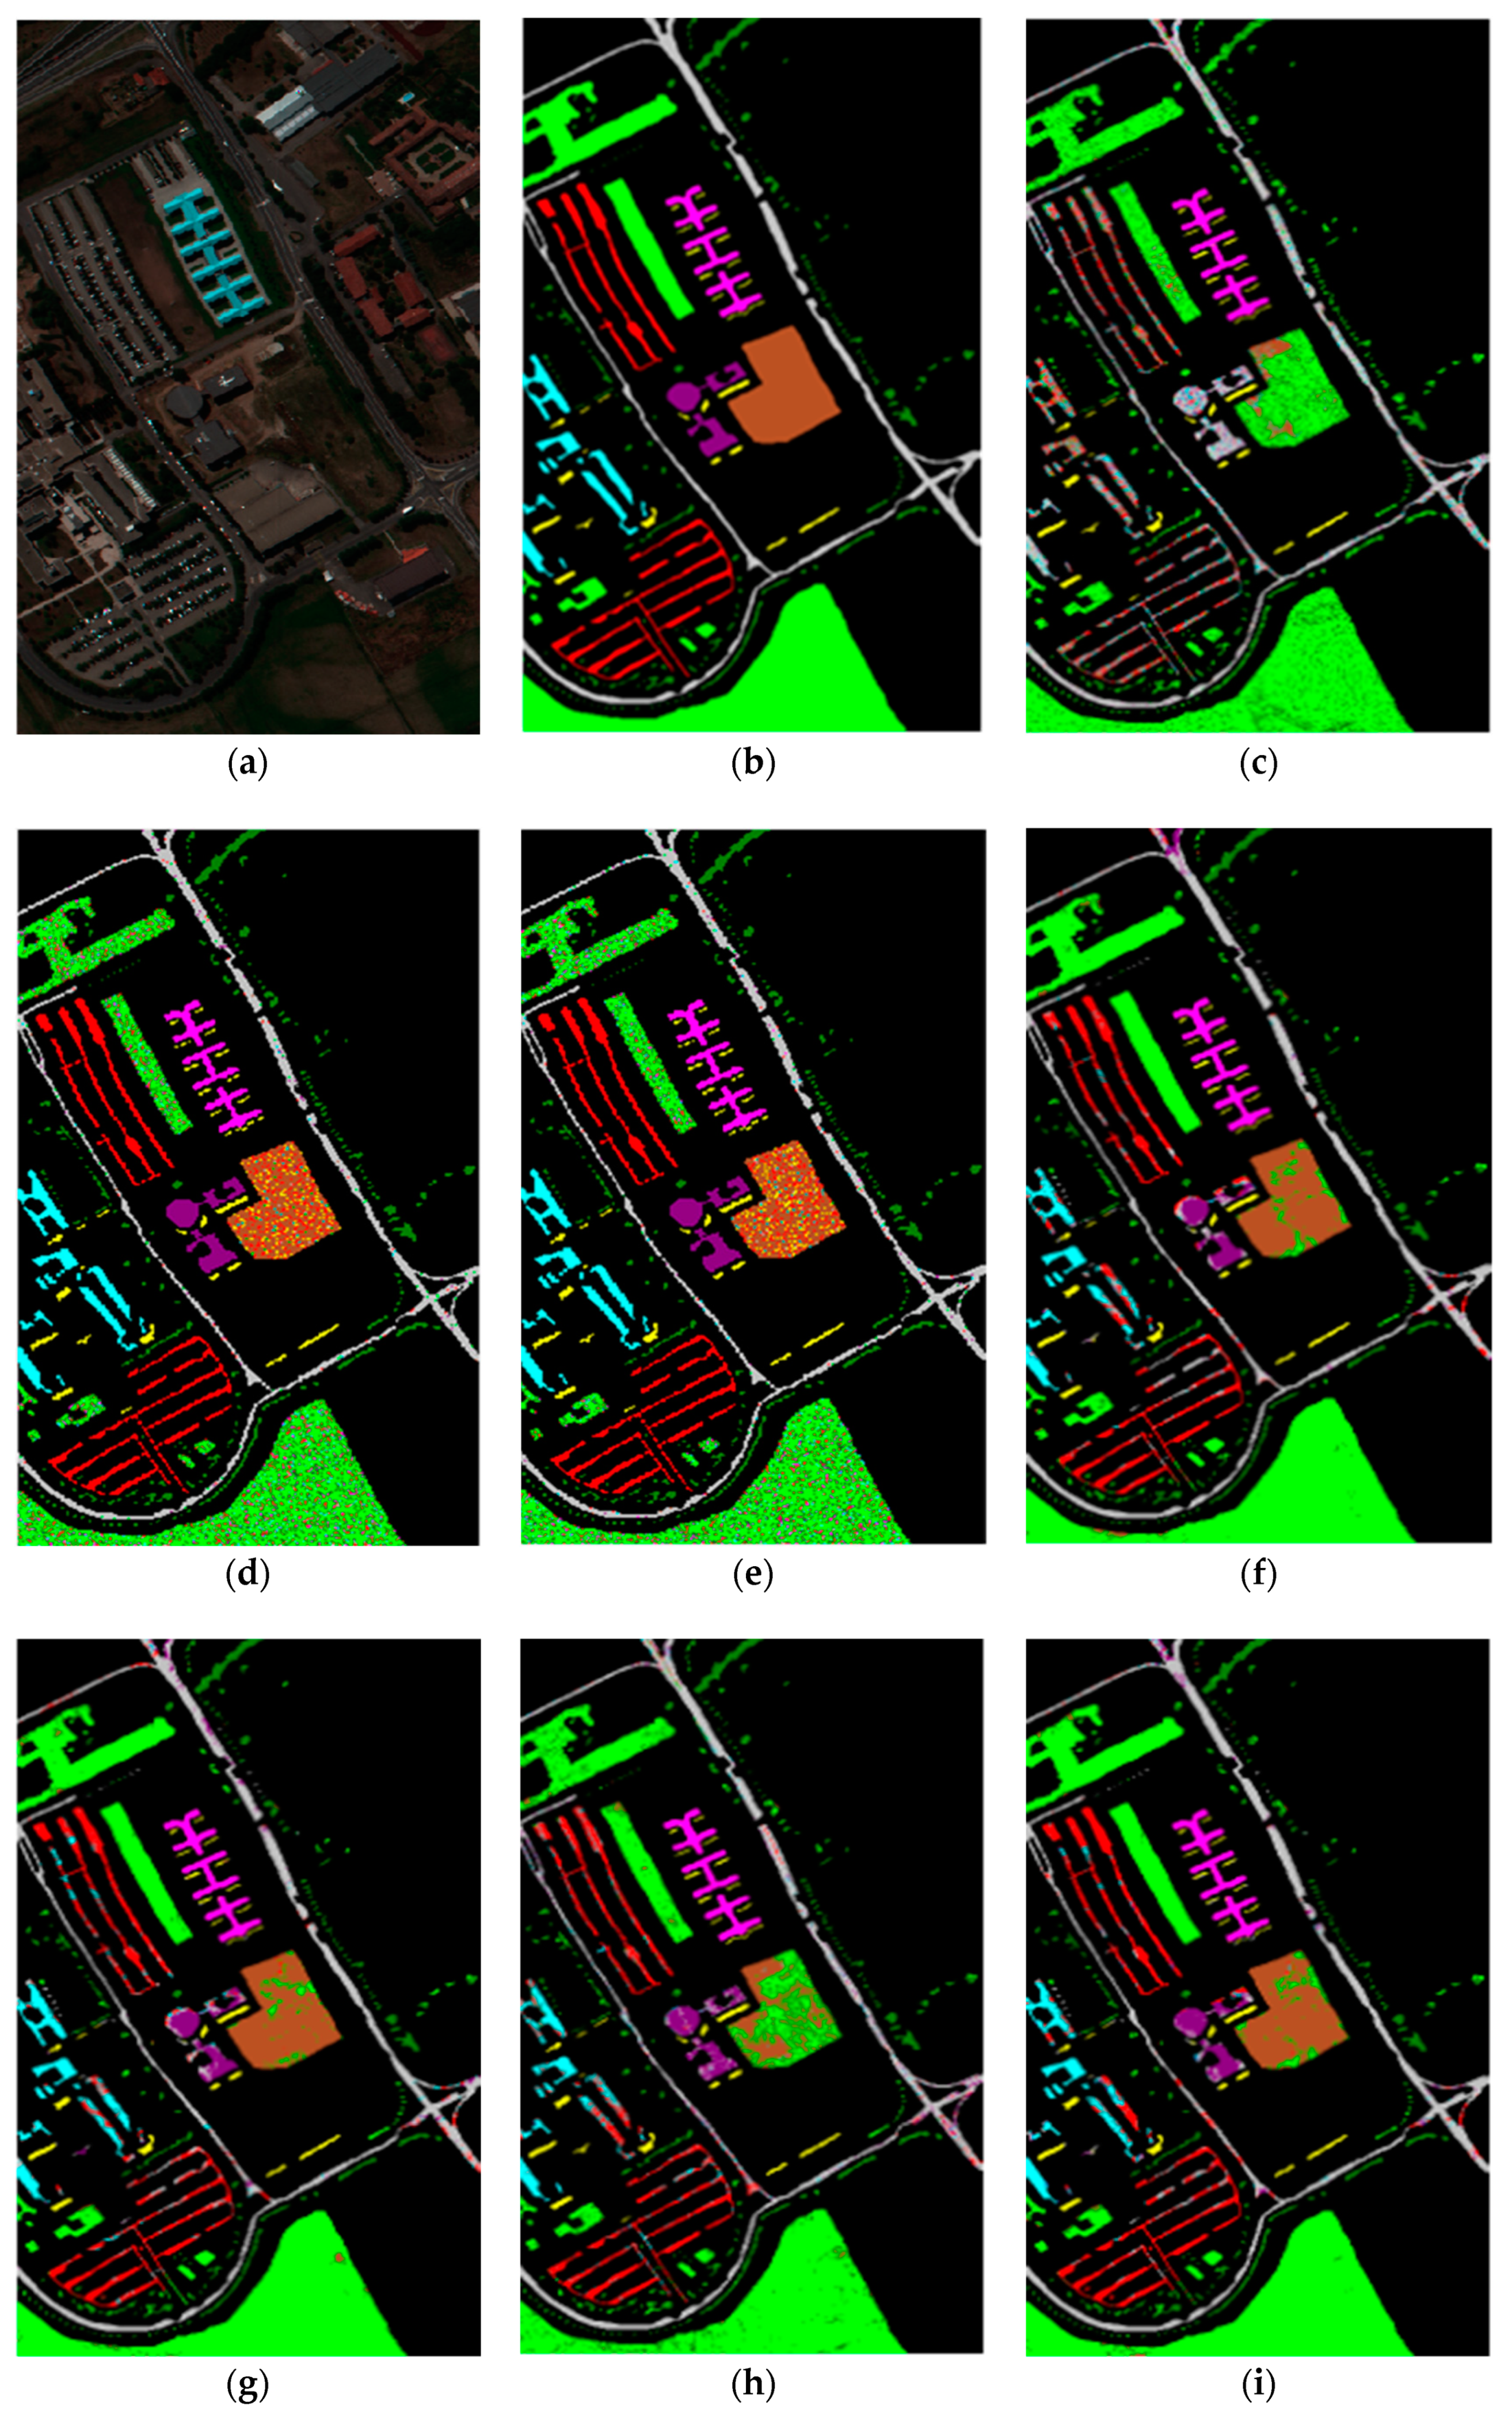
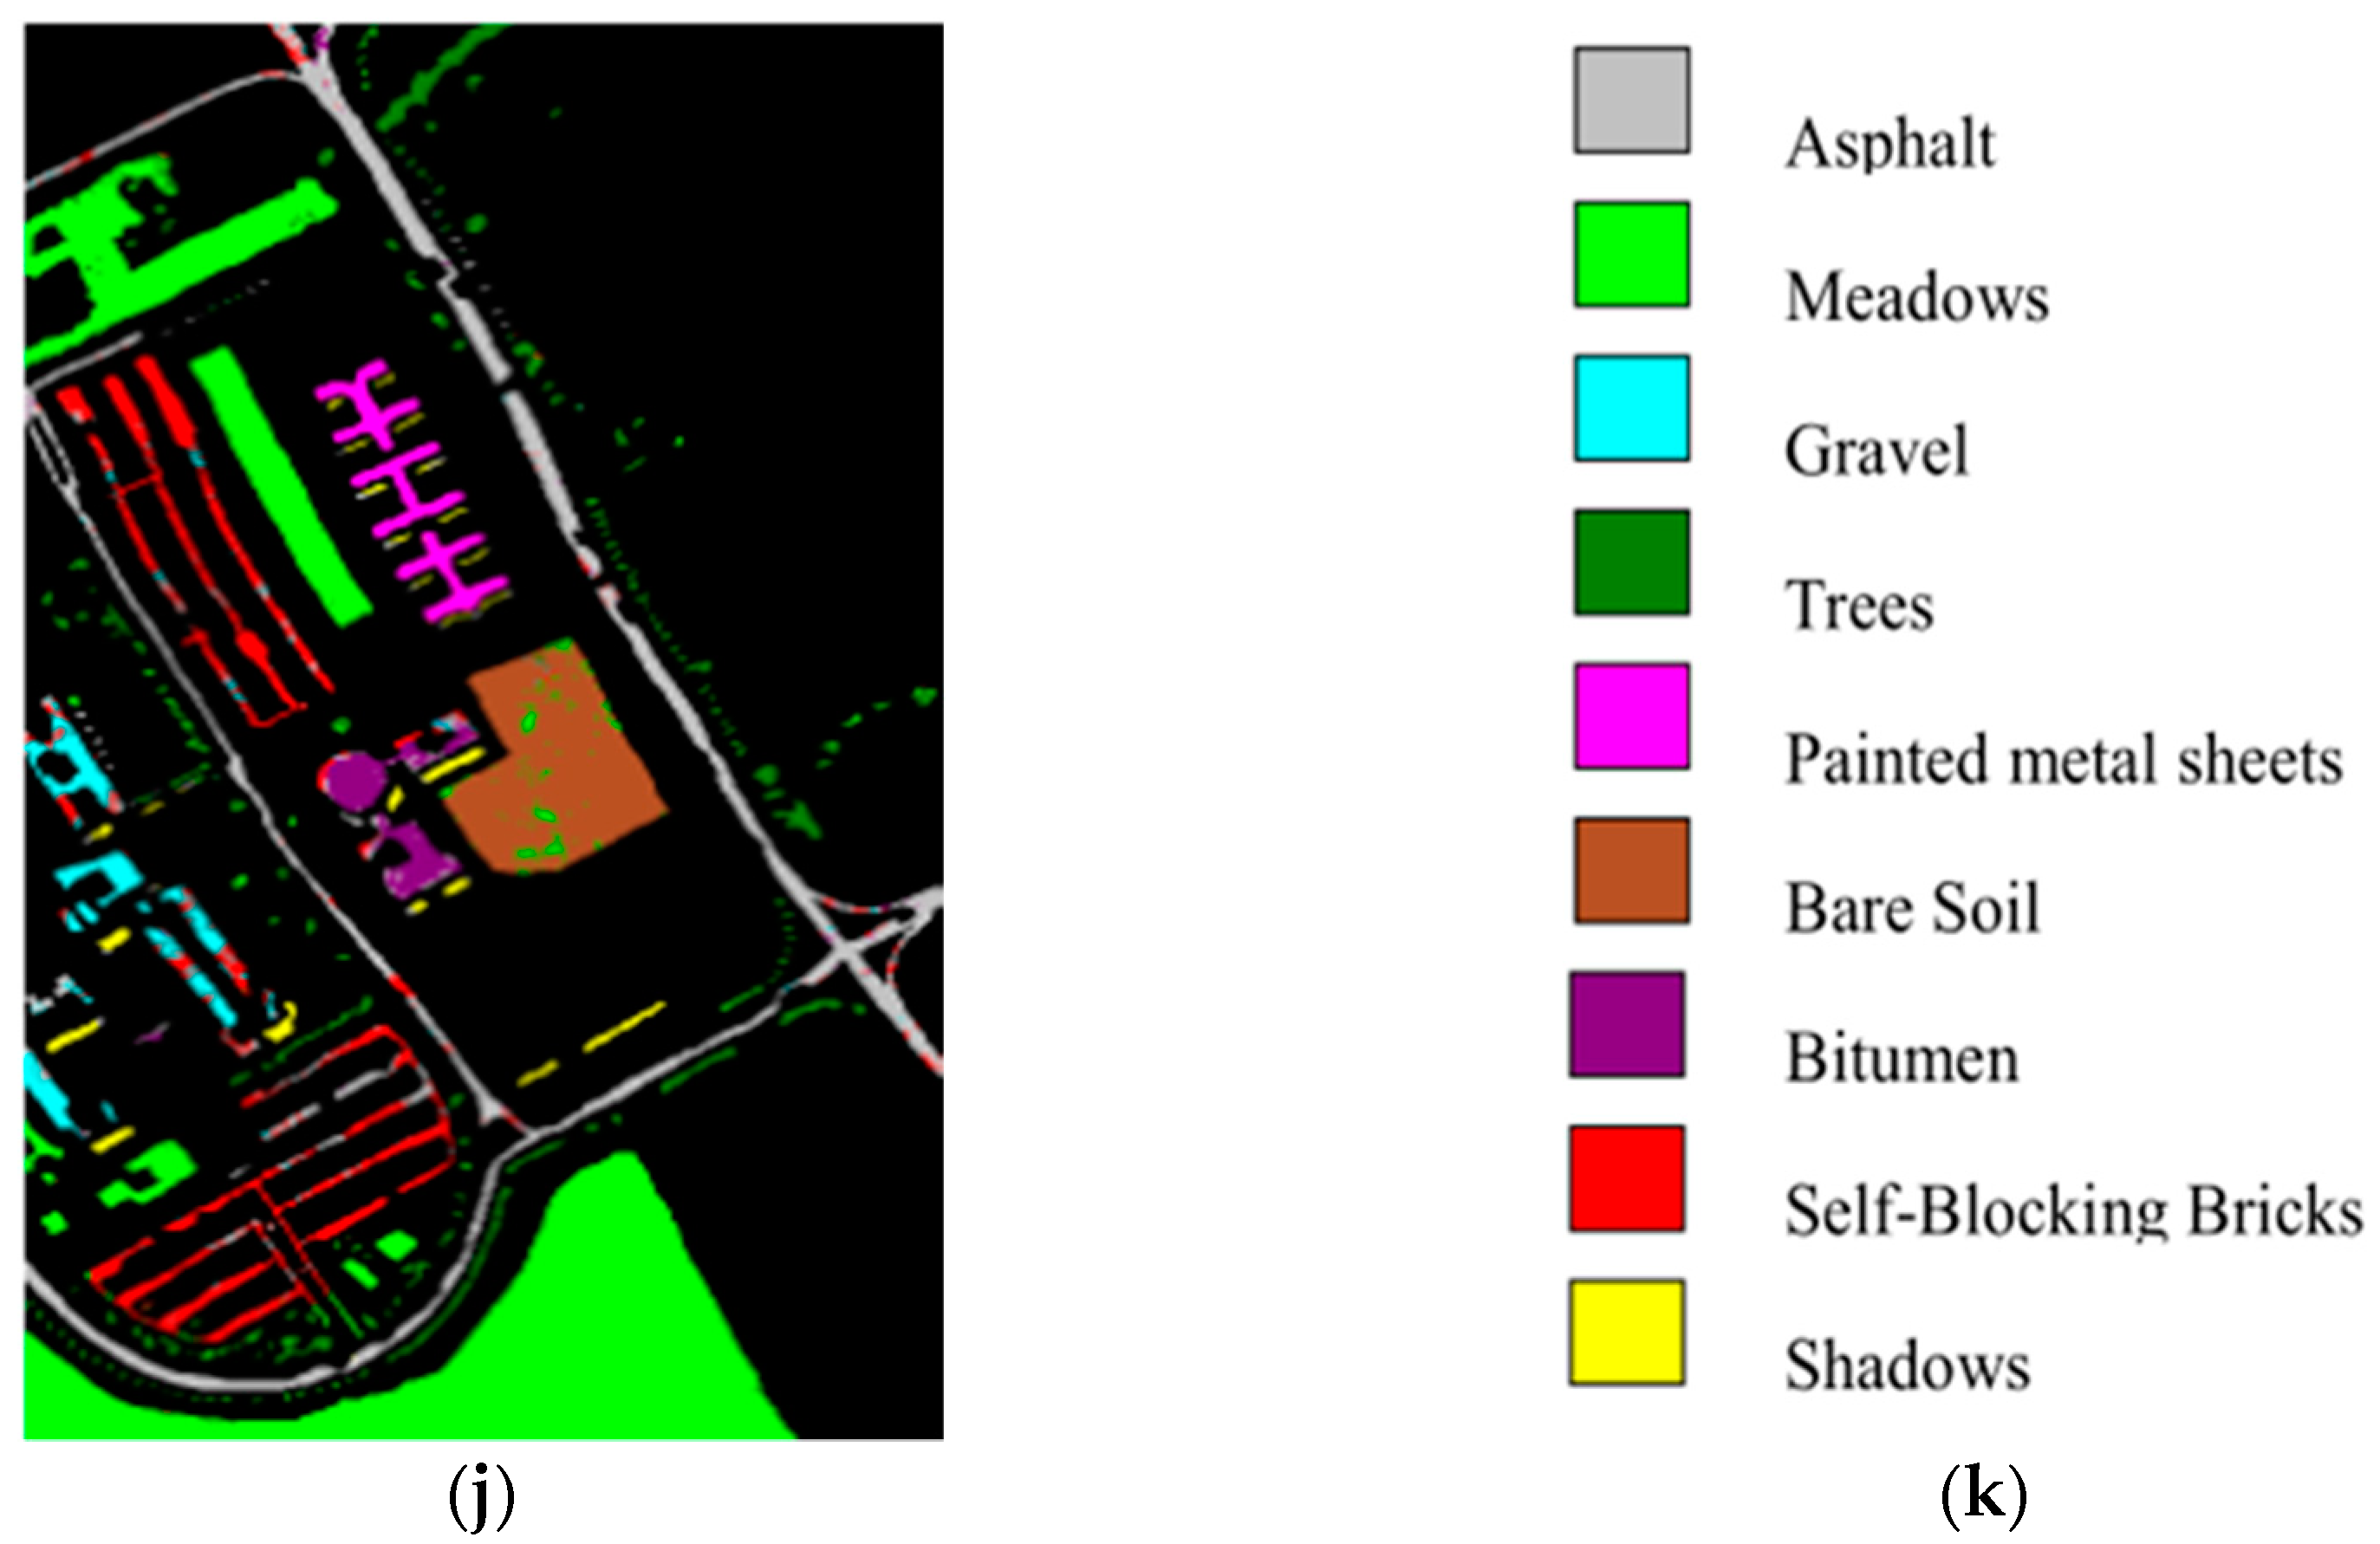
4.3. Results for the Pavia University Data Set
4.4. Results for the Salinas Scene Data Set
5. Conclusions
Author Contributions
Funding
Conflicts of Interest
Appendix A


References
- Gao, F.; Wang, Q.; Dong, J. Spectral and Spatial Classification of Hyperspectral Images Based on Random Multi-Graphs. Remote Sens. 2018, 10, 1271. [Google Scholar] [CrossRef]
- Zu, B.; Xia, K.; Du, W.; Li, Y.; Ali, A.; Chakraborty, S. Classification of Hyperspectral Images with Robust Regularized Block Low-Rank Discriminant Analysis. Remote Sens. 2018, 10, 817. [Google Scholar] [CrossRef]
- Feng, Z.; Yang, S.; Wang, S.; Jiao, L. Discriminative Spectral–Spatial Margin-Based Semisupervised Dimensionality Reduction of Hyperspectral Data. IEEE Geosci. Remote Sens. Lett. 2014, 12, 224–228. [Google Scholar] [CrossRef]
- Xu, H.; Zhang, H.; He, W.; Zhang, L. Superpixel based dimension reduction for hyperspectral imagery. In Proceedings of the 2018 IEEE International Geoscience and Remote Sensing Symposium, IGARSS 2018, Valencia, Spain, 22–27 July 2018; pp. 2575–2578. [Google Scholar]
- Zu, B.; Xia, K.; Li, T.; He, Z.; Li, Y.; Hou, J.; Du, W. SLIC Superpixel-based l2, 1-norm robust principal component analysis for hyperspectral image classification. Sensors 2019, 19, 479. [Google Scholar] [CrossRef] [PubMed]
- Zeng, S.; Wang, Z.; Gao, C.; Kang, Z.; Feng, D.D. Hyperspectral image classification with global-local discriminant analysis and spatial-spectral context. IEEE J. Sel. Top. Appl. Earth Obs. Remote Sens. 2018, 11, 5005–5018. [Google Scholar] [CrossRef]
- Huang, H.; Chen, M.; Duan, Y. Dimensionality Reduction of Hyperspectral Image Using Spatial-Spectral Regularized Sparse Hypergraph Embedding. Remote Sens. 2019, 11, 1039. [Google Scholar] [CrossRef]
- Wold, S.; Esbensen, K.; Geladi, P. Principal component analysis. Chemom. Intell. Lab. Syst. 1987, 2, 37–52. [Google Scholar] [CrossRef]
- Chen, H.T.; Chang, H.W.; Liu, T.L. Local discriminant embedding and its variants. In Proceedings of the 2005 IEEE Computer Society Conference on Computer Vision and Pattern Recognition (CVPR’05), San Diego, CA, USA, 20–25 June 2005; pp. 846–853. [Google Scholar]
- Stone, J.V. Independent component analysis: An introduction. Trends Cogn. Sci. 2002, 6, 59–64. [Google Scholar] [CrossRef]
- Roweis, S.T.; Saul, L.K. Nonlinear dimensionality reduction by locally linear embedding. Science 2000, 290, 2323–2326. [Google Scholar] [CrossRef]
- Wang, Z.Y.; He, B.B. Locality perserving projections algorithm for hyperspectral image dimensionality reduction. In Proceedings of the 2011 19th International Conference on Geoinformatics, Shanghai, China, 24–26 June 2011; pp. 1–4. [Google Scholar]
- Hou, B.; Zhang, X.; Ye, Q. A Novel Method for Hyperspectral Image Classification Based on Laplacian Eigenmap Pixels Distribution-Flow. IEEE J. Sel. Top. Appl. Earth Obs. Remote Sens. 2013, 6, 1602–1618. [Google Scholar] [CrossRef]
- Huang, K.K.; Dai, D.Q.; Ren, C.X. Regularized coplanar discriminant analysis for dimensionality reduction. Pattern Recognit. 2017, 62, 87–98. [Google Scholar] [CrossRef]
- Rajaguru, H.; Prabhakar, K.S. Performance analysis of local linear embedding (LLE) and Hessian LLE with Hybrid ABC-PSO for Epilepsy classification from EEG signals. In Proceedings of the 2018 International Conference on Inventive Research in Computing Applications(ICIRCA), Coimbatore, India, 11–12 July 2018; pp. 1084–1088. [Google Scholar]
- Wu, Q.; Qi, Z.X.; Wang, Z.C. An improved weighted local linear embedding algorithm. In Proceedings of the 2018 14th International Conference on Computational Intelligence and Security(CIS), Hangzhou, China, 16–19 November 2018; pp. 378–381. [Google Scholar]
- Huang, H.; Luo, F.L.; Liu, J.M. Dimensionality reduction of hyperspectral images based on sparse discriminant manifold embedding. ISPRS J. Photogramm. Remote Sens. 2015, 106, 42–54. [Google Scholar] [CrossRef]
- Xu, H.; Zhang, H.; He, W.; Zhang, L. Superpixel-based spatial-spectral dimension reduction for hyperspectral imagery classification. Neurocomputing 2019, 360, 138–150. [Google Scholar] [CrossRef]
- Wu, P.; Xia, K.; Yu, H. Correlation Coefficient based Supervised Locally Linear Embedding for Pulmonary Nodule Recognition. Comput. Methods Programs Biomed. 2016, 136, 97–106. [Google Scholar] [CrossRef] [PubMed]
- Zhang, X.W.; Chew, S.E.; Xu, Z.L. SLIC superpixels for efficient graph-based dimensionality reduction of hyperspectral imagery. In Proceedings of the XXI Algorithms and Technologies for Multispectral, Hyperspectral, and Ultraspectral Imagery, Baltimore, MD, USA, 21–23 April 2015; pp. 947209–947225. [Google Scholar]
- Sun, L.; Wu, Z.B.; Liu, J.J. Supervised spectral-spatial hyperspectral image classification with weighted markov random fields. IEEE Trans. Geosci. Remote Sens. 2015, 53, 1490–1503. [Google Scholar] [CrossRef]
- Yu, W.B.; Zhang, M.; Shen, Y. Learning a local manifold representation based on improved neighborhood rough set and LLE for hyperspectral dimensionality reduction. Signal Process. 2019, 164, 20–29. [Google Scholar] [CrossRef]
- Yang, Y.; Hu, Y.L.; Wu, F. Sparse and low-rank subspace data clustering with manifold regularization learned by local linear embedding. Appl. Sci. 2018, 8, 2175. [Google Scholar] [CrossRef]
- Hong, D.F.; Yokoya, N.; Zhu, X.X. Learning a robust local manifold representation for hyperspectral dimensionality reduction. IEEE J. Sel. Top. Appl. Earth Obs. Remote Sens. 2017, 10, 2960–2975. [Google Scholar] [CrossRef]
- Arena, P.; Patané, L.; Spinosa, A.G. Data-based analysis of Laplacian Eigenmaps for manifold reduction in supervised Liquid State classifiers. Inf. Sci. 2019, 478, 28–39. [Google Scholar] [CrossRef]
- Cahill, N.D.; Chew, S.E.; Wenger, P.S. Spatial-spectral dimensionality reduction of hyperspectral imagery with partial knowledge of class labels. In Proceedings of the XXI Algorithms and Technologies for Multispectral, Hyperspectral, and Ultraspectral Imagery, Baltimore, MD, USA, 21–23 April 2015; pp. 9472–9486. [Google Scholar]
- Kang, X.D.; Xiang, X.L.; Li, S.T. PCA-Based Edge-Preserving Features for Hyperspectral Image Classification. IEEE Trans. Geosci. Remote Sens. 2017, 55, 7140–7151. [Google Scholar] [CrossRef]
- Yang, W.K.; Wang, Z.Y.; Sun, C.Y. A collaborative representation based projections method for feature extraction. Pattern Recognit. 2015, 48, 20–27. [Google Scholar] [CrossRef]
- Tenenbaum, J.B.; De Silva, V.; Langford, J.C. A global geometric framework for nonlinear dimensionality reduction. Science 2000, 290, 2319–2323. [Google Scholar] [CrossRef]
- Hyperspectral Remote Sensing Scenes. Available online: http://www.ehu.eus/ccwintco/index.php/Hyperspectral_Remote_Sensing_Scenes (accessed on 6 August 2020).
- Ou, D.P.; Tan, K.; Du, Q. A novel tri-training technique for the semi-supervised classification of hyperspectral images based on regularized local discriminant embedding feature extraction. Remote Sens. 2019, 11, 654. [Google Scholar] [CrossRef]
- Zhai, H.; Zhang, H.; Zhang, L.; Li, P. Total variation regularized collaborative representation clustering with a locally adaptive dictionary for hyperspectral imagery. IEEE Trans. Geosci. Remote Sens. 2018, 57, 166–180. [Google Scholar] [CrossRef]


| Samples | Classifier | Index | RAW | PCA | Isomap | LLE | LE | SSSE | WLE-LLE | ISS-WME |
|---|---|---|---|---|---|---|---|---|---|---|
| 10% | KNN | OA | 49.44 ± 1.94 | 61.42 ± 1.35 | 65.23 ± 1.62 | 60.85 ± 1.30 | 64.82 ± 1.47 | 59.35 ± 1.96 | 65.86 ± 1.39 | 66.46 ± 1.90 |
| Kappa | 32.79 ± 1.65 | 44.98 ± 1.15 | 49.26 ± 1.59 | 44.21 ± 1.59 | 49.42 ± 1.89 | 42.95 ± 2.11 | 48.31 ± 1.56 | 48.86 ± 1.85 | ||
| SVM | OA | 49.82 ± 1.37 | 68.40 ± 1.14 | 64.12 ± 1.62 | 65.93 ± 1.71 | 71.77 ± 1.61 | 68.17 ± 1.10 | 75.03 ± 1.26 | 75.38 ± 1.47 | |
| Kappa | 33.19 ± 1.35 | 52.82 ± 1.11 | 48.26 ± 1.65 | 51.94 ± 1.23 | 56.19 ± 1.51 | 52.93 ± 1.03 | 59.71 ± 1.35 | 62.08 ± 1.56 | ||
| 20% | KNN | OA | 51.97 ± 1.17 | 66.00 ± 1.48 | 68.42 ± 1.35 | 66.00 ± 1.20 | 69.72 ± 1.35 | 66.03 ± 1.74 | 68.60 ± 1.43 | 69.56 ± 1.71 |
| Kappa | 32.56 ± 1.52 | 50.10 ± 1.59 | 52.90 ± 1.25 | 50.20 ± 1.23 | 54.37 ± 1.36 | 50.44 ± 1.71 | 53.42 ± 1.41 | 54.27 ± 1.75 | ||
| SVM | OA | 51.86 ± 1.59 | 72.34 ± 1.47 | 71.36 ± 1.62 | 71.42 ± 1.27 | 75.01 ± 1.75 | 73.22 ± 1.45 | 77.80 ± 1.93 | 81.25 ± 1.51 | |
| Kappa | 35.08 ± 1.65 | 57.15 ± 1.42 | 55.74 ± 1.79 | 56.15 ± 1.39 | 58.56 ± 1.67 | 58.13 ± 1.53 | 62.83 ± 1.92 | 66.29 ± 1.42 | ||
| 30% | KNN | OA | 54.19 ± 1.28 | 68.13 ± 1.64 | 70.83 ± 1.53 | 68.43 ± 1.66 | 72.30 ± 1.32 | 67.91 ± 1.03 | 72.46 ± 1.35 | 73.02 ± 1.43 |
| Kappa | 37.55 ± 1.36 | 52.60 ± 1.74 | 55.54 ± 1.56 | 52.94 ± 1.51 | 57.29 ± 1.22 | 52.48 ± 1.87 | 57.34 ± 1.18 | 57.84 ± 1.55 | ||
| SVM | OA | 53.11 ± 1.35 | 74.82 ± 1.69 | 74.72 ± 1.33 | 74.37 ± 1.48 | 77.83 ± 1.54 | 77.54 ± 1.33 | 80.48 ± 1.76 | 83.83 ± 1.73 | |
| Kappa | 36.51 ± 1.63 | 59.63 ± 1.66 | 59.45 ± 1.34 | 59.07 ± 1.56 | 63.60 ± 1.55 | 60.53 ± 1.19 | 65.57 ± 1.71 | 69.73 ± 1.71 | ||
| 40% | KNN | OA | 54.67 ± 1.62 | 70.03 ± 1.13 | 73.33 ± 1.84 | 75.91 ± 1.47 | 73.94 ± 1.20 | 68.92 ± 1.14 | 73.94 ± 1.79 | 74.08 ± 1.44 |
| Kappa | 38.36 ± 1.14 | 54.64 ± 1.10 | 58.26 ± 1.79 | 60.86 ± 1.43 | 59.05 ± 1.15 | 53.58 ± 1.35 | 58.99 ± 1.77 | 59.25 ± 1.50 | ||
| SVM | OA | 54.28 ± 1.81 | 76.07 ± 1.44 | 75.91 ± 1.37 | 75.98 ± 1.21 | 80.02 ± 1.65 | 76.31 ± 0.96 | 82.07 ± 1.53 | 84.80 ± 1.80 | |
| Kappa | 37.72 ± 1.71 | 61.13 ± 1.46 | 60.94 ± 1.42 | 60.86 ± 1.23 | 63.00 ± 1.63 | 61.45 ± 0.93 | 67.35 ± 1.57 | 70.36 ± 2.34 | ||
| 50% | KNN | OA | 55.41 ± 1.50 | 70.38 ± 1.44 | 73.67 ± 1.29 | 71.29 ± 1.47 | 75.10 ± 1.56 | 69.48 ± 1.51 | 75.22 ± 1.47 | 74.56 ± 1.36 |
| Kappa | 39.14 ± 1.44 | 55.19 ± 1.40 | 58.71 ± 1.24 | 55.93 ± 1.41 | 60.31 ± 1.44 | 54.28 ± 1.50 | 60.27 ± 1.48 | 59.73 ± 1.24 | ||
| SVM | OA | 54.77 ± 1.39 | 76.65 ± 1.76 | 76.93 ± 1.38 | 76.67 ± 1.27 | 81.84 ± 1.24 | 78.46 ± 1.59 | 82.54 ± 1.27 | 84.71 ± 0.93 | |
| Kappa | 38.12 ± 1.35 | 61.75 ± 1.76 | 61.89 ± 1.49 | 61.63 ± 1.34 | 66.89 ± 1.21 | 63.51 ± 1.77 | 67.74 ± 1.37 | 70.11 ± 1.06 |
| Class | Sample | DR + SVM Classifier (%) | ||||||||
|---|---|---|---|---|---|---|---|---|---|---|
| Train | Test | RAW | PCA | Isomap | LLE | LE | SSSE | WLE-LLE | ISS-WME | |
| Alfalfa | 23 | 23 | 13.04 | 52.17 | 26.09 | 30.77 | 40.58 | 52.17 | 56.52 | 86.96 |
| Corn-N | 714 | 714 | 38.42 | 69.37 | 69.42 | 40.06 | 70.07 | 65.92 | 77.08 | 72.17 |
| Corn-M | 415 | 415 | 25.06 | 48.76 | 49.96 | 44.34 | 62.33 | 58.47 | 62.25 | 56.47 |
| Corn | 119 | 118 | 14.41 | 77.11 | 38.14 | 26.27 | 47.74 | 46.05 | 62.15 | 53.95 |
| Grass-P | 242 | 241 | 59.06 | 90.87 | 89.21 | 62.38 | 89.76 | 89.35 | 94.47 | 94.65 |
| Grass-T | 365 | 365 | 86.48 | 97.81 | 97.63 | 97.90 | 97.44 | 97.63 | 98.26 | 98.86 |
| Grass-P-M | 14 | 14 | 35.71 | 76.19 | 52.38 | 50.28 | 90.48 | 76.19 | 83.33 | 83.81 |
| Hay-W | 239 | 239 | 88.70 | 99.86 | 99.72 | 97.13 | 99.44 | 98.61 | 99.72 | 99.68 |
| Oats | 10 | 10 | 11.24 | 43.33 | 60.00 | 30.00 | 80.00 | 80.00 | 70.00 | 86.67 |
| Soybean-N | 486 | 486 | 25.17 | 63.51 | 69.82 | 94.24 | 78.26 | 79.08 | 75.03 | 75.17 |
| Soybean-M | 1228 | 1227 | 71.15 | 83.32 | 81.83 | 73.62 | 87.48 | 83.46 | 86.66 | 79.52 |
| Soybean-C | 297 | 296 | 56.41 | 64.75 | 57.32 | 52.70 | 67.91 | 60.47 | 73.99 | 74.07 |
| Wheat | 103 | 102 | 74.51 | 94.12 | 98.69 | 75.21 | 97.06 | 97.39 | 99.67 | 99.87 |
| Woods | 633 | 632 | 94.57 | 97.68 | 97.63 | 86.71 | 97.31 | 96.78 | 97.42 | 97.66 |
| Buildings-G-T-D Stone-S-T | 193 | 193 | 29.02 | 45.77 | 45.60 | 34.20 | 43.52 | 44.39 | 51.81 | 52.85 |
| 47 | 46 | 91.30 | 90.58 | 94.20 | 88.70 | 86.96 | 92.03 | 96.38 | 98.41 | |
| OA | 54.77 | 76.65 | 76.93 | 76.67 | 81.84 | 78.46 | 82.54 | 84.71 | ||
| AA | 54.04 | 74.70 | 70.47 | 61.53 | 77.27 | 76.12 | 80.30 | 81.92 | ||
| kappa | 38.12 | 61.75 | 61.89 | 61.63 | 66.89 | 63.51 | 67.74 | 70.11 | ||
| Samples | Classifier | Index | RAW | PCA | Isomap | LLE | LE | SSSE | WLE-LLE | ISS-WME |
|---|---|---|---|---|---|---|---|---|---|---|
| 2% | KNN | OA | 61.55 ± 1.64 | 69.75 ± 0.90 | 68.29 ± 2.20 | 63.25 ± 1.81 | 73.92 ± 1.27 | 73.70 ± 1.10 | 75.65 ± 1.47 | 75.84 ± 1.27 |
| Kappa | 44.23 ± 1.23 | 57.78 ± 1.49 | 55.49 ± 3.13 | 47.71 ± 2.94 | 63.99 ± 1.17 | 63.31 ± 1.52 | 66.12 ± 1.29 | 66.38 ± 1.42 | ||
| SVM | OA | 58.42 ± 1.13 | 79.71 ± 1.18 | 71.84 ± 3.22 | 79.05 ± 1.42 | 77.70 ± 1.82 | 78.30 ± 0.88 | 82.86 ± 0.83 | 84.17 ± 0.87 | |
| Kappa | 44.61 ± 2.96 | 71.99 ± 1.60 | 60.66 ± 4.61 | 70.84 ± 1.71 | 69.24 ± 2.66 | 69.91 ± 1.23 | 76.65 ± 1.13 | 78.32 ± 1.19 | ||
| 4% | KNN | OA | 61.83 ± 1.46 | 76.32 ± 1.23 | 72.89 ± 1.76 | 68.69 ± 1.76 | 78.44 ± 1.70 | 72.45 ± 1.33 | 78.99 ± 1.26 | 80.64 ± 1.51 |
| Kappa | 45.04 ± 1.06 | 67.18 ± 1.48 | 62.40 ± 1.25 | 56.39 ± 1.45 | 70.09 ± 1.84 | 61.89 ± 1.27 | 70.09 ± 1.45 | 73.34 ± 1.59 | ||
| SVM | OA | 59.62 ± 1.51 | 82.60 ± 1.74 | 73.84 ± 3.43 | 82.52 ± 1.04 | 81.71 ± 1.21 | 76.63 ± 1.28 | 85.53 ± 1.16 | 85.96 ± 0.99 | |
| Kappa | 42.32 ± 1.19 | 76.07 ± 2.51 | 63.60 ± 5.03 | 76.12 ± 1.44 | 74.96 ± 1.25 | 67.80 ± 1.74 | 80.34 ± 1.29 | 80.95 ± 1.16 | ||
| 6% | KNN | OA | 71.73 ± 1.39 | 79.08 ± 1.18 | 72.35 ± 1.83 | 71.35 ± 1.37 | 80.48 ± 1.29 | 71.74 ± 2.39 | 80.51 ± 1.50 | 82.38 ± 1.44 |
| Kappa | 63.93 ± 1.80 | 71.16 ± 1.63 | 61.88 ± 1.96 | 59.82 ± 2.44 | 73.03 ± 1.42 | 60.56 ± 3.58 | 73.18 ± 1.58 | 75.76 ± 1.64 | ||
| SVM | OA | 71.81 ± 1.27 | 84.98 ± 1.84 | 75.06 ± 1.86 | 85.32 ± 1.32 | 83.45 ± 1.46 | 78.05 ± 2.06 | 85.93 ± 1.69 | 87.13 ± 1.49 | |
| Kappa | 65.34 ± 1.61 | 79.49 ± 1.20 | 65.34 ± 2.78 | 77.38 ± 1.49 | 77.52 ± 1.71 | 69.81 ± 2.94 | 80.92 ± 1.93 | 82.56 ± 1.68 | ||
| 8% | KNN | OA | 71.80 ± 1.51 | 80.45 ± 1.36 | 73.72 ± 1.89 | 73.81 ± 1.23 | 81.65 ± 1.16 | 76.63 ± 2.25 | 81.54 ± 1.51 | 83.09 ± 1.19 |
| Kappa | 65.14 ± 1.83 | 73.11 ± 1.54 | 63.93 ± 2.61 | 63.96 ± 1.38 | 74.74 ± 1.23 | 62.39 ± 2.55 | 74.47 ± 1.74 | 76.79 ± 1.28 | ||
| SVM | OA | 70.14 ± 1.22 | 85.52 ± 0.87 | 77.23 ± 2.55 | 84.56 ± 1.21 | 84.55 ± 1.30 | 79.03 ± 1.43 | 86.75 ± 1.30 | 86.91 ± 1.40 | |
| Kappa | 61.92 ± 1.46 | 80.31 ± 1.23 | 68.58 ± 3.72 | 78.96 ± 1.29 | 79.06 ± 1.42 | 71.17 ± 1.64 | 82.08 ± 1.43 | 80.20 ± 1.55 | ||
| 10% | KNN | OA | 71.96 ± 1.18 | 81.36 ± 1.47 | 75.48 ± 1.56 | 74.15 ± 0.95 | 81.74 ± 0.72 | 73.11 ± 1.73 | 82.62 ± 1.46 | 83.83 ± 0.59 |
| Kappa | 65.60 ± 1.46 | 74.21 ± 1.00 | 66.23 ± 2.24 | 64.20 ± 1.43 | 74.85 ± 1.02 | 62.48 ± 2.84 | 76.11 ± 1.69 | 77.85 ± 0.86 | ||
| SVM | OA | 70.99 ± 1.31 | 85.75 ± 1.29 | 76.42 ± 0.65 | 75.02 ± 0.73 | 85.07 ± 1.18 | 79.24 ± 1.00 | 86.15 ± 0.24 | 86.98 ± 1.12 | |
| Kappa | 63.95 ± 1.29 | 80.68 ± 1.77 | 67.42 ± 1.19 | 59.69 ± 0.86 | 79.80 ± 1.31 | 71.46 ± 1.40 | 82.65 ± 0.93 | 82.37 ± 1.12 |
| Class | Sample | DR+SVM Classifier (%) | ||||||||
|---|---|---|---|---|---|---|---|---|---|---|
| Train | Test | RAW | PCA | Isomap | LLE | LE | SSSE | WLE-LLE | ISS-WME | |
| Asphalt | 657 | 6565 | 62.96 | 88.41 | 74.41 | 86.10 | 95.19 | 81.98 | 84.93 | 88.03 |
| Meadows | 1846 | 18463 | 91.90 | 97.72 | 95.76 | 96.66 | 98.78 | 96.19 | 96.50 | 97.42 |
| Gravel | 208 | 2078 | 45.72 | 50.71 | 47.89 | 59.04 | 80.93 | 52.38 | 64.55 | 84.23 |
| Trees | 303 | 3033 | 39.96 | 84.75 | 79.55 | 86.34 | 87.00 | 75.25 | 89.90 | 89.65 |
| Metal sheets | 133 | 1332 | 98.51 | 99.61 | 99.94 | 99.72 | 100.00 | 99.23 | 100.00 | 100.00 |
| Bare Soil | 498 | 4979 | 46.54 | 66.36 | 80.77 | 48.25 | 87.39 | 58.26 | 65.56 | 87.44 |
| Bitumen | 132 | 1317 | 45.02 | 49.72 | 42.47 | 65.27 | 79.88 | 66.16 | 74.02 | 80.38 |
| Bricks | 365 | 3645 | 54.43 | 84.45 | 75.44 | 83.27 | 84.25 | 80.57 | 82.78 | 86.38 |
| Shadows | 94 | 937 | 46.57 | 99.37 | 62.50 | 99.68 | 95.88 | 99.84 | 93.38 | 100.00 |
| OA | 70.99 | 85.75 | 76.42 | 75.02 | 85.07 | 79.24 | 86.15 | 86.98 | ||
| AA | 59.07 | 80.12 | 73.19 | 80.48 | 89.92 | 78.87 | 83.51 | 90.39 | ||
| kappa | 63.95 | 80.68 | 67.42 | 59.69 | 79.80 | 71.46 | 82.65 | 82.37 | ||
| Samples | Classifier | Index | RAW | PCA | Isomap | LLE | LE | SSSE | WLE-LLE | ISS-WME |
|---|---|---|---|---|---|---|---|---|---|---|
| 2% | KNN | OA | 75.23 ± 1.64 | 75.98 ± 2.90 | 76.52 ± 2.20 | 82.56 ± 2.81 | 78.56 ± 1.27 | 80.12 ± 1.10 | 81.53 ± 1.47 | 82.67 ± 1.43 |
| Kappa | 59.89 ± 1.23 | 65.12 ± 1.49 | 63.29 ± 3.13 | 72.69 ± 2.94 | 65.23 ± 1.17 | 69.96 ± 1.22 | 70.69 ± 2.29 | 69.12 ± 1.96 | ||
| SVM | OA | 63.34 ± 1.13 | 75.12 ± 2.18 | 78.22 ± 3.22 | 89.23 ± 2.42 | 86.23 ± 1.72 | 86.23 ± 1.88 | 88.93 ± 0.83 | 88.53 ± 1.23 | |
| Kappa | 50.96 ± 2.96 | 64.36 ± 1.60 | 69.35 ± 4.61 | 79.96 ± 1.71 | 75.69 ± 2.66 | 74.15 ± 1.03 | 80.63 ± 1.53 | 75.63 ± 1.56 | ||
| 4% | KNN | OA | 78.20 ± 1.86 | 76.52 ± 1.23 | 75.89 ± 1.66 | 83.63 ± 1.76 | 79.23 ± 1.70 | 81.23 ± 1.33 | 83.56 ± 1.16 | 83.84 ± 1.51 |
| Kappa | 60.93 ± 2.06 | 64.78 ± 1.48 | 63.25 ± 1.85 | 72.56 ± 1.45 | 66.36 ± 1.84 | 70.36 ± 1.27 | 72.12 ± 2.05 | 70.34 ± 1.09 | ||
| SVM | OA | 66.47 ± 1.51 | 77.25 ± 1.54 | 79.94 ± 2.43 | 89.38 ± 2.94 | 88.23 ± 1.71 | 89.23 ± 1.88 | 88.99 ± 1.06 | 90.22 ± 0.99 | |
| Kappa | 55.63 ± 2.19 | 65.23 ± 1.51 | 67.89 ± 4.03 | 78.96 ± 3.44 | 75.63 ± 1.85 | 75.63 ± 1.74 | 80.34 ± 1.29 | 80.95 ± 1.16 | ||
| 6% | KNN | OA | 78.91 ± 1.39 | 76.23 ± 1.18 | 78.59 ± 1.83 | 85.26 ± 2.37 | 80.23 ± 2.29 | 83.23 ± 2.39 | 85.13 ± 1.23 | 85.02 ± 1.64 |
| Kappa | 62.36 ± 2.80 | 63.63 ± 2.63 | 62.56 ± 1.96 | 74.23 ± 2.44 | 69.36 ± 2.42 | 70.32 ± 3.28 | 73.25 ± 1.78 | 72.76 ± 1.64 | ||
| SVM | OA | 68.01 ± 1.27 | 77.56 ± 1.84 | 80.49 ± 1.86 | 91.61 ± 2.32 | 89.56 ± 1.86 | 90.12 ± 2.26 | 89.96 ± 1.29 | 91.90 ± 1.29 | |
| Kappa | 59.13 ± 1.61 | 68.96 ± 1.20 | 72.06 ± 1.78 | 80.65 ± 2.49 | 77.96 ± 1.71 | 76.12 ± 2.48 | 78.92 ± 1.63 | 82.56 ± 1.68 | ||
| 8% | KNN | OA | 78.82 ± 1.51 | 76.63 ± 1.36 | 81.56 ± 1.89 | 85.96 ± 1.23 | 81.63 ± 2.16 | 84.63 ± 2.25 | 85.17 ± 1.31 | 86.23 ± 1.19 |
| Kappa | 65.34 ± 1.83 | 63.59 ± 1.54 | 65.75 ± 2.61 | 75.26 ± 1.38 | 70.23 ± 1.23 | 72.12 ± 2.55 | 73.69 ± 1.54 | 73.79 ± 1.28 | ||
| SVM | OA | 68.96 ± 2.22 | 77.96 ± 1.87 | 81.20 ± 2.55 | 91.92 ± 3.21 | 90.05 ± 1.30 | 88.96 ± 1.73 | 89.69 ± 1.30 | 91.16 ± 1.04 | |
| Kappa | 57.69 ± 2.46 | 65.36 ± 2.23 | 73.96 ± 3.72 | 79.86 ± 3.29 | 81.02 ± 1.42 | 78.02 ± 1.64 | 76.08 ± 1.23 | 80.20 ± 1.55 | ||
| 10% | KNN | OA | 80.21 ± 1.18 | 77.69 ± 1.47 | 84.72 ± 1.56 | 86.95 ± 0.95 | 81.23 ± 1.72 | 85.23 ± 1.73 | 86.33 ± 1.46 | 86.78 ± 1.72 |
| Kappa | 68.23 ± 1.46 | 65.26 ± 2.00 | 69.89 ± 2.24 | 67.36 ± 1.43 | 71.53 ± 2.02 | 72.36 ± 2.84 | 76.11 ± 1.69 | 72.19 ± 1.02 | ||
| SVM | OA | 69.13 ± 1.21 | 79.02 ± 2.29 | 80.99 ± 0.65 | 92.16 ± 2.73 | 89.92 ± 2.18 | 90.13 ± 1.20 | 90.57 ± 1.24 | 92.19 ± 1.02 | |
| Kappa | 58.63 ± 1.09 | 68.32 ± 2.77 | 79.63 ± 2.19 | 81.96 ± 2.86 | 78.69 ± 1.91 | 76.98 ± 1.40 | 82.65 ± 1.93 | 84.23 ± 1.62 |
| Class | Sample | DR+SVM Classifier (%) | ||||||||
|---|---|---|---|---|---|---|---|---|---|---|
| Train | Test | RAW | PCA | Isomap | LLE | LE | SSSE | WLE-LLE | ISS-WME | |
| Brocoil_green_weeds_1 | 201 | 1808 | 91.26 | 93.14 | 99.34 | 96.68 | 99.23 | 98.23 | 99.56 | 98.01 |
| Brocoil_green_weeds_2 | 373 | 3353 | 99.22 | 99.28 | 99.88 | 95.53 | 99.64 | 91.65 | 99.88 | 99.88 |
| Fallow | 198 | 1778 | 61.75 | 81.33 | 94.60 | 93.59 | 99.52 | 96.29 | 99.78 | 93.36 |
| Fallow_rough_plow | 139 | 1255 | 96.49 | 97.29 | 97.63 | 95.37 | 98.34 | 97.61 | 99.36 | 99.20 |
| Fallow_smooth | 268 | 2410 | 80.00 | 83.24 | 97.42 | 83.65 | 99.88 | 89.46 | 98.34 | 98.34 |
| Stubble | 396 | 3563 | 95.29 | 96.07 | 94.50 | 86.59 | 99.94 | 94.39 | 100.00 | 99.94 |
| Celery | 358 | 3221 | 97.21 | 89.67 | 90.18 | 88.33 | 88.62 | 98.63 | 99.44 | 99.75 |
| Grapes_untrained | 113 | 11158 | 75.75 | 83.28 | 88.86 | 83.59 | 97.82 | 87.38 | 84.27 | 99.48 |
| Soil_vinyard_develop | 620 | 5583 | 98.64 | 90.69 | 99.25 | 97.13 | 94.58 | 94.75 | 99.86 | 99.89 |
| Corn_senesced_green_weed | 328 | 2950 | 83.12 | 84.61 | 93.42 | 95.25 | 96.20 | 98.31 | 99.17 | 99.17 |
| Lettuce_romaine_4wk | 107 | 961 | 10.19 | 81.50 | 97.30 | 83.58 | 92.77 | 89.81 | 91.89 | 99.77 |
| Lettuce_romaine_5wk | 193 | 1734 | 90.26 | 92.17 | 99.88 | 91.47 | 98.79 | 94.23 | 96.77 | 99.77 |
| Lettuce_romaine_6wk | 92 | 824 | 94.90 | 97.57 | 98.06 | 92.73 | 90.23 | 97.09 | 98.06 | 98.79 |
| Lettuce_romaine_7wk | 107 | 963 | 78.17 | 99.38 | 97.77 | 89.81 | 58.45 | 94.39 | 92.52 | 92.72 |
| Vinyard_untrained | 727 | 6541 | 41.36 | 54.32 | 64.72 | 56.23 | 58.45 | 66.73 | 57.11 | 67.25 |
| Vinyard_vertical_trellis | 181 | 1626 | 87.71 | 98.40 | 98.65 | 98.53 | 97.26 | 97.54 | 96.65 | 98.77 |
| OA | 69.13 | 79.02 | 80.99 | 92.16 | 89.92 | 90.13 | 90.57 | 92.19 | ||
| AA | 80.08 | 88.87 | 94.47 | 89.25 | 91.86 | 92.91 | 94.54 | 96.51 | ||
| kappa | 58.63 | 68.32 | 79.63 | 81.96 | 78.69 | 76.98 | 82.65 | 84.23 | ||
© 2020 by the authors. Licensee MDPI, Basel, Switzerland. This article is an open access article distributed under the terms and conditions of the Creative Commons Attribution (CC BY) license (http://creativecommons.org/licenses/by/4.0/).
Share and Cite
Liu, H.; Xia, K.; Li, T.; Ma, J.; Owoola, E. Dimensionality Reduction of Hyperspectral Images Based on Improved Spatial–Spectral Weight Manifold Embedding. Sensors 2020, 20, 4413. https://doi.org/10.3390/s20164413
Liu H, Xia K, Li T, Ma J, Owoola E. Dimensionality Reduction of Hyperspectral Images Based on Improved Spatial–Spectral Weight Manifold Embedding. Sensors. 2020; 20(16):4413. https://doi.org/10.3390/s20164413
Chicago/Turabian StyleLiu, Hong, Kewen Xia, Tiejun Li, Jie Ma, and Eunice Owoola. 2020. "Dimensionality Reduction of Hyperspectral Images Based on Improved Spatial–Spectral Weight Manifold Embedding" Sensors 20, no. 16: 4413. https://doi.org/10.3390/s20164413
APA StyleLiu, H., Xia, K., Li, T., Ma, J., & Owoola, E. (2020). Dimensionality Reduction of Hyperspectral Images Based on Improved Spatial–Spectral Weight Manifold Embedding. Sensors, 20(16), 4413. https://doi.org/10.3390/s20164413