Design of the VRLA Battery Real-Time Monitoring System Based on Wireless Communication


Abstract
1. Introduction
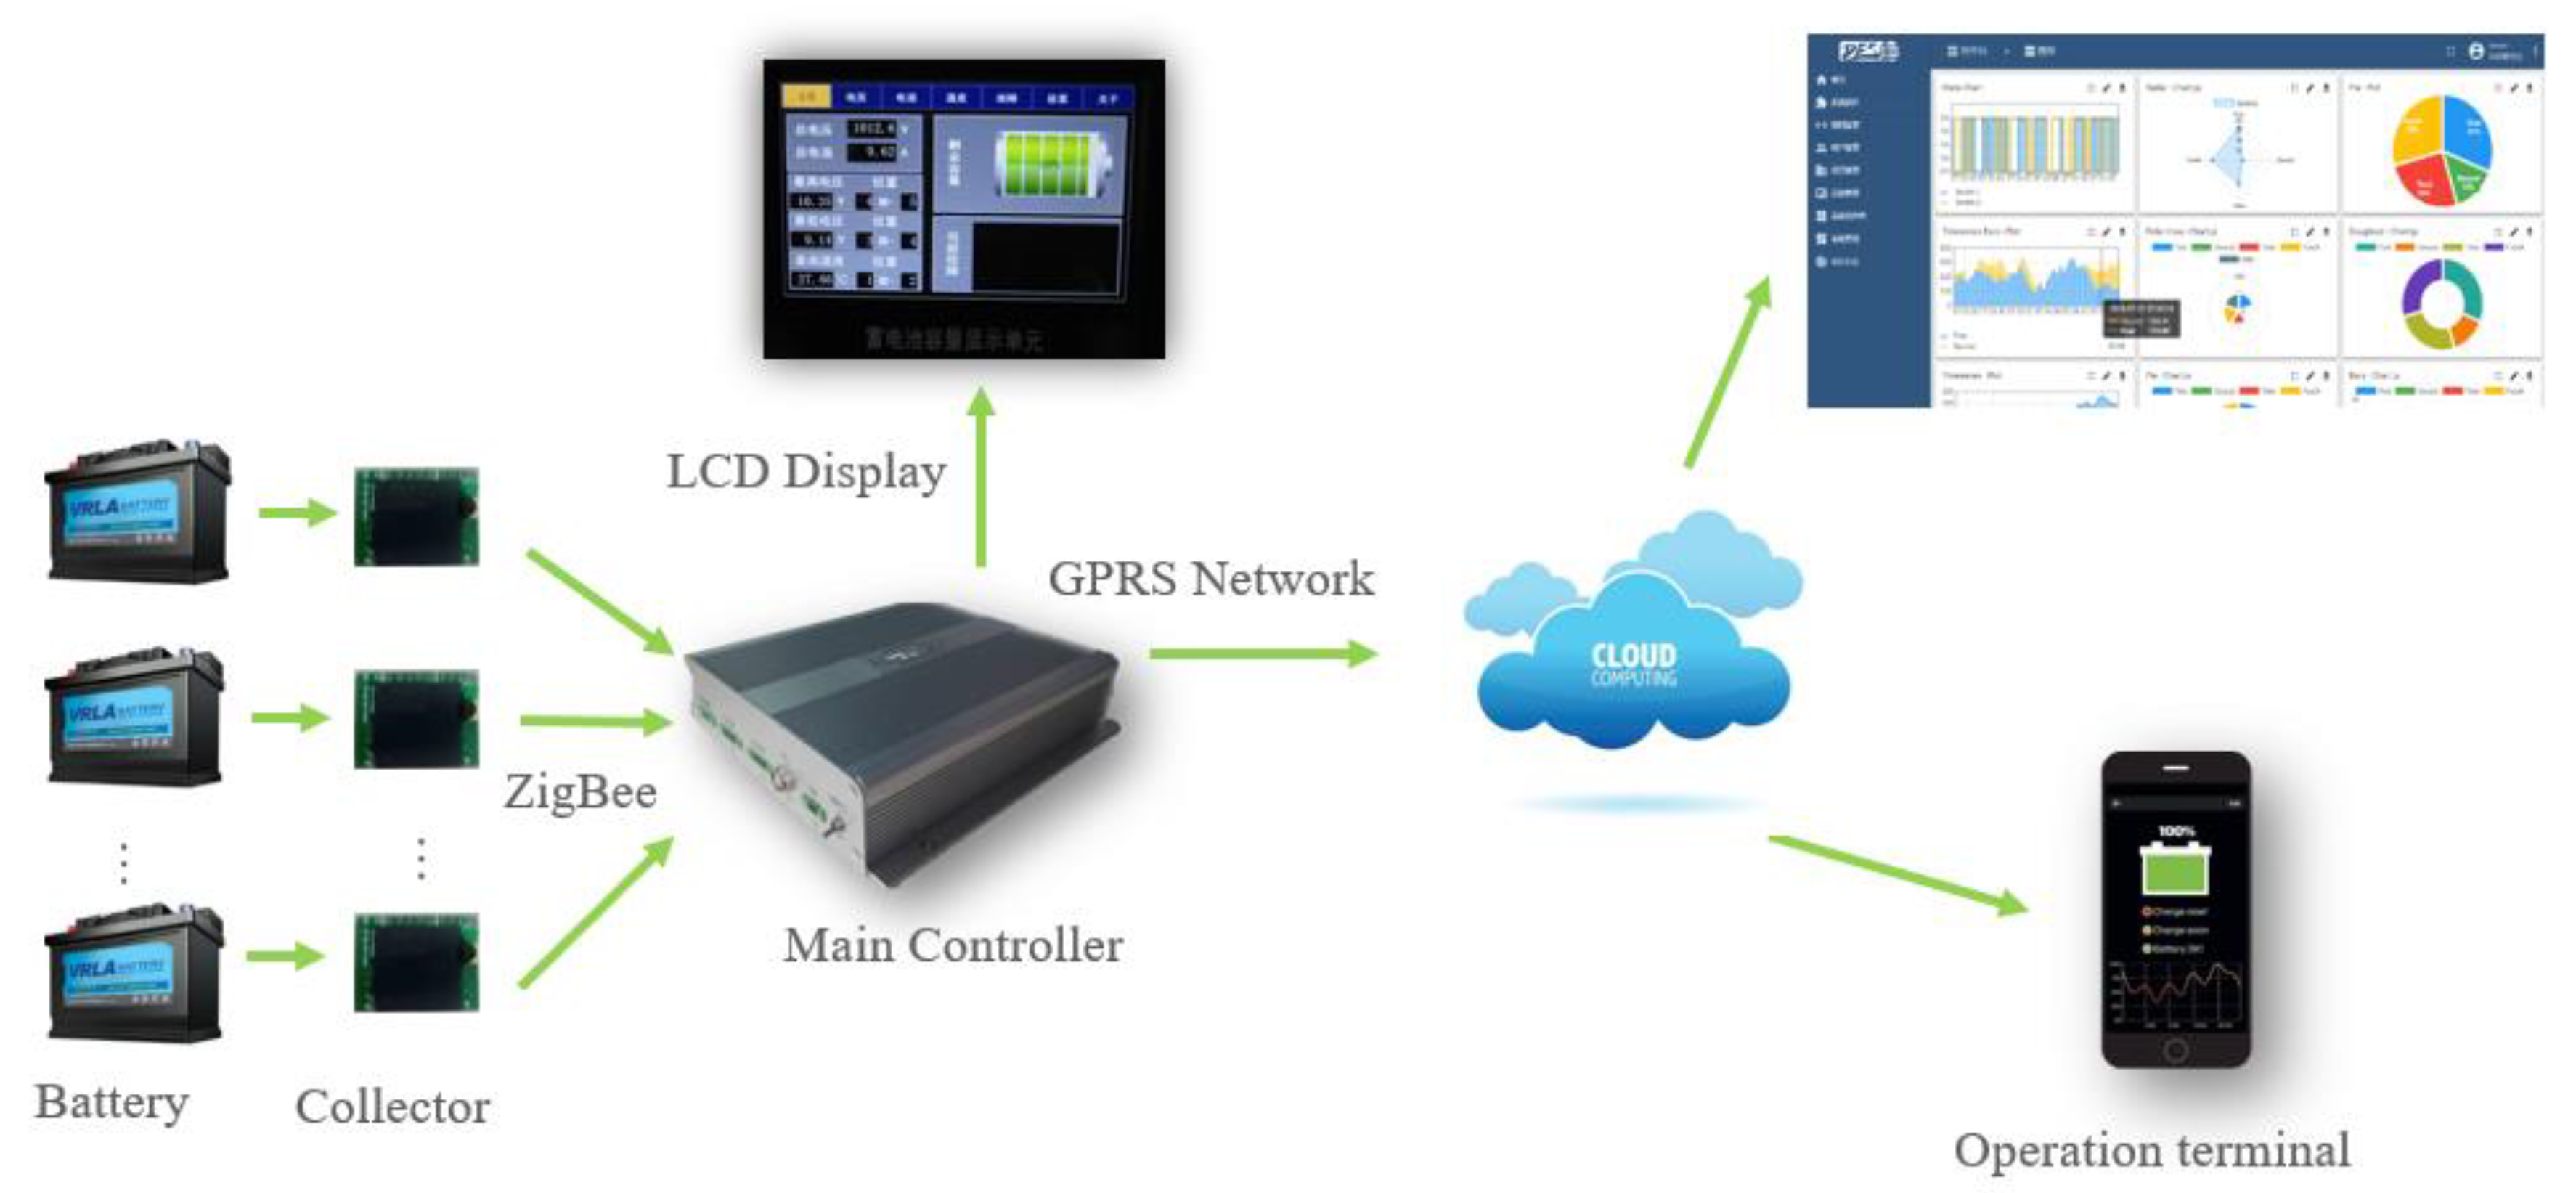
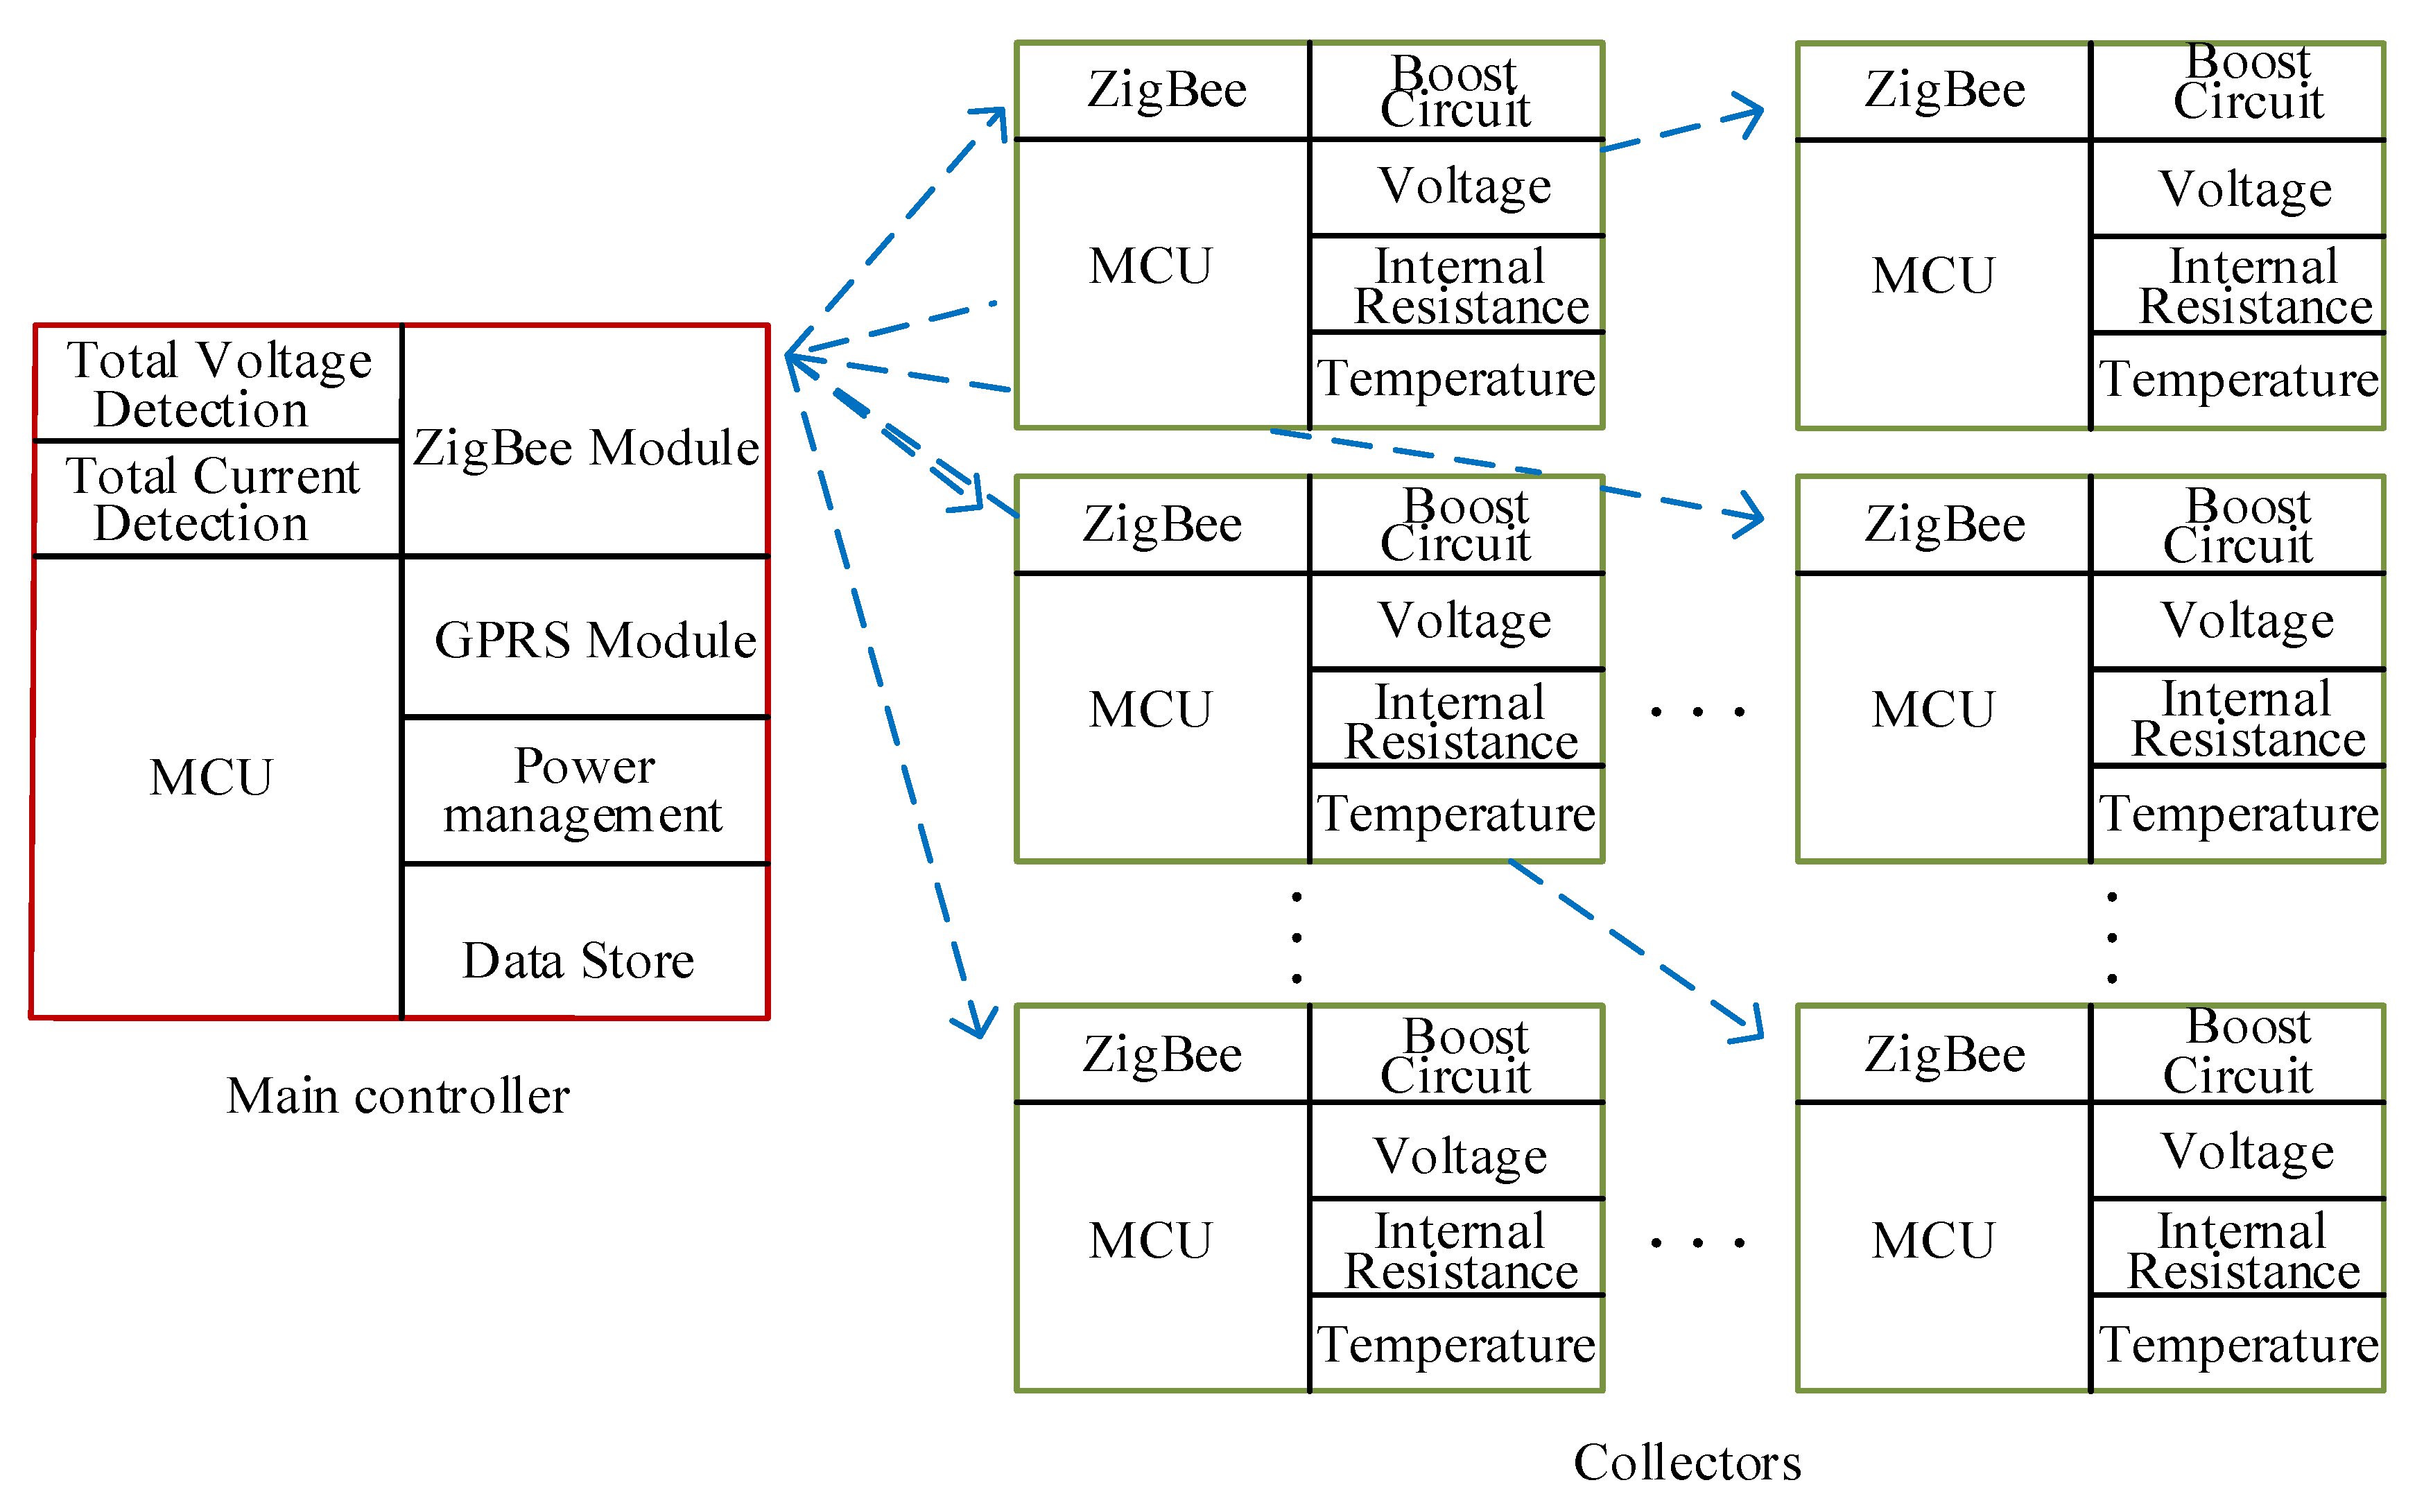
2. Design of the System
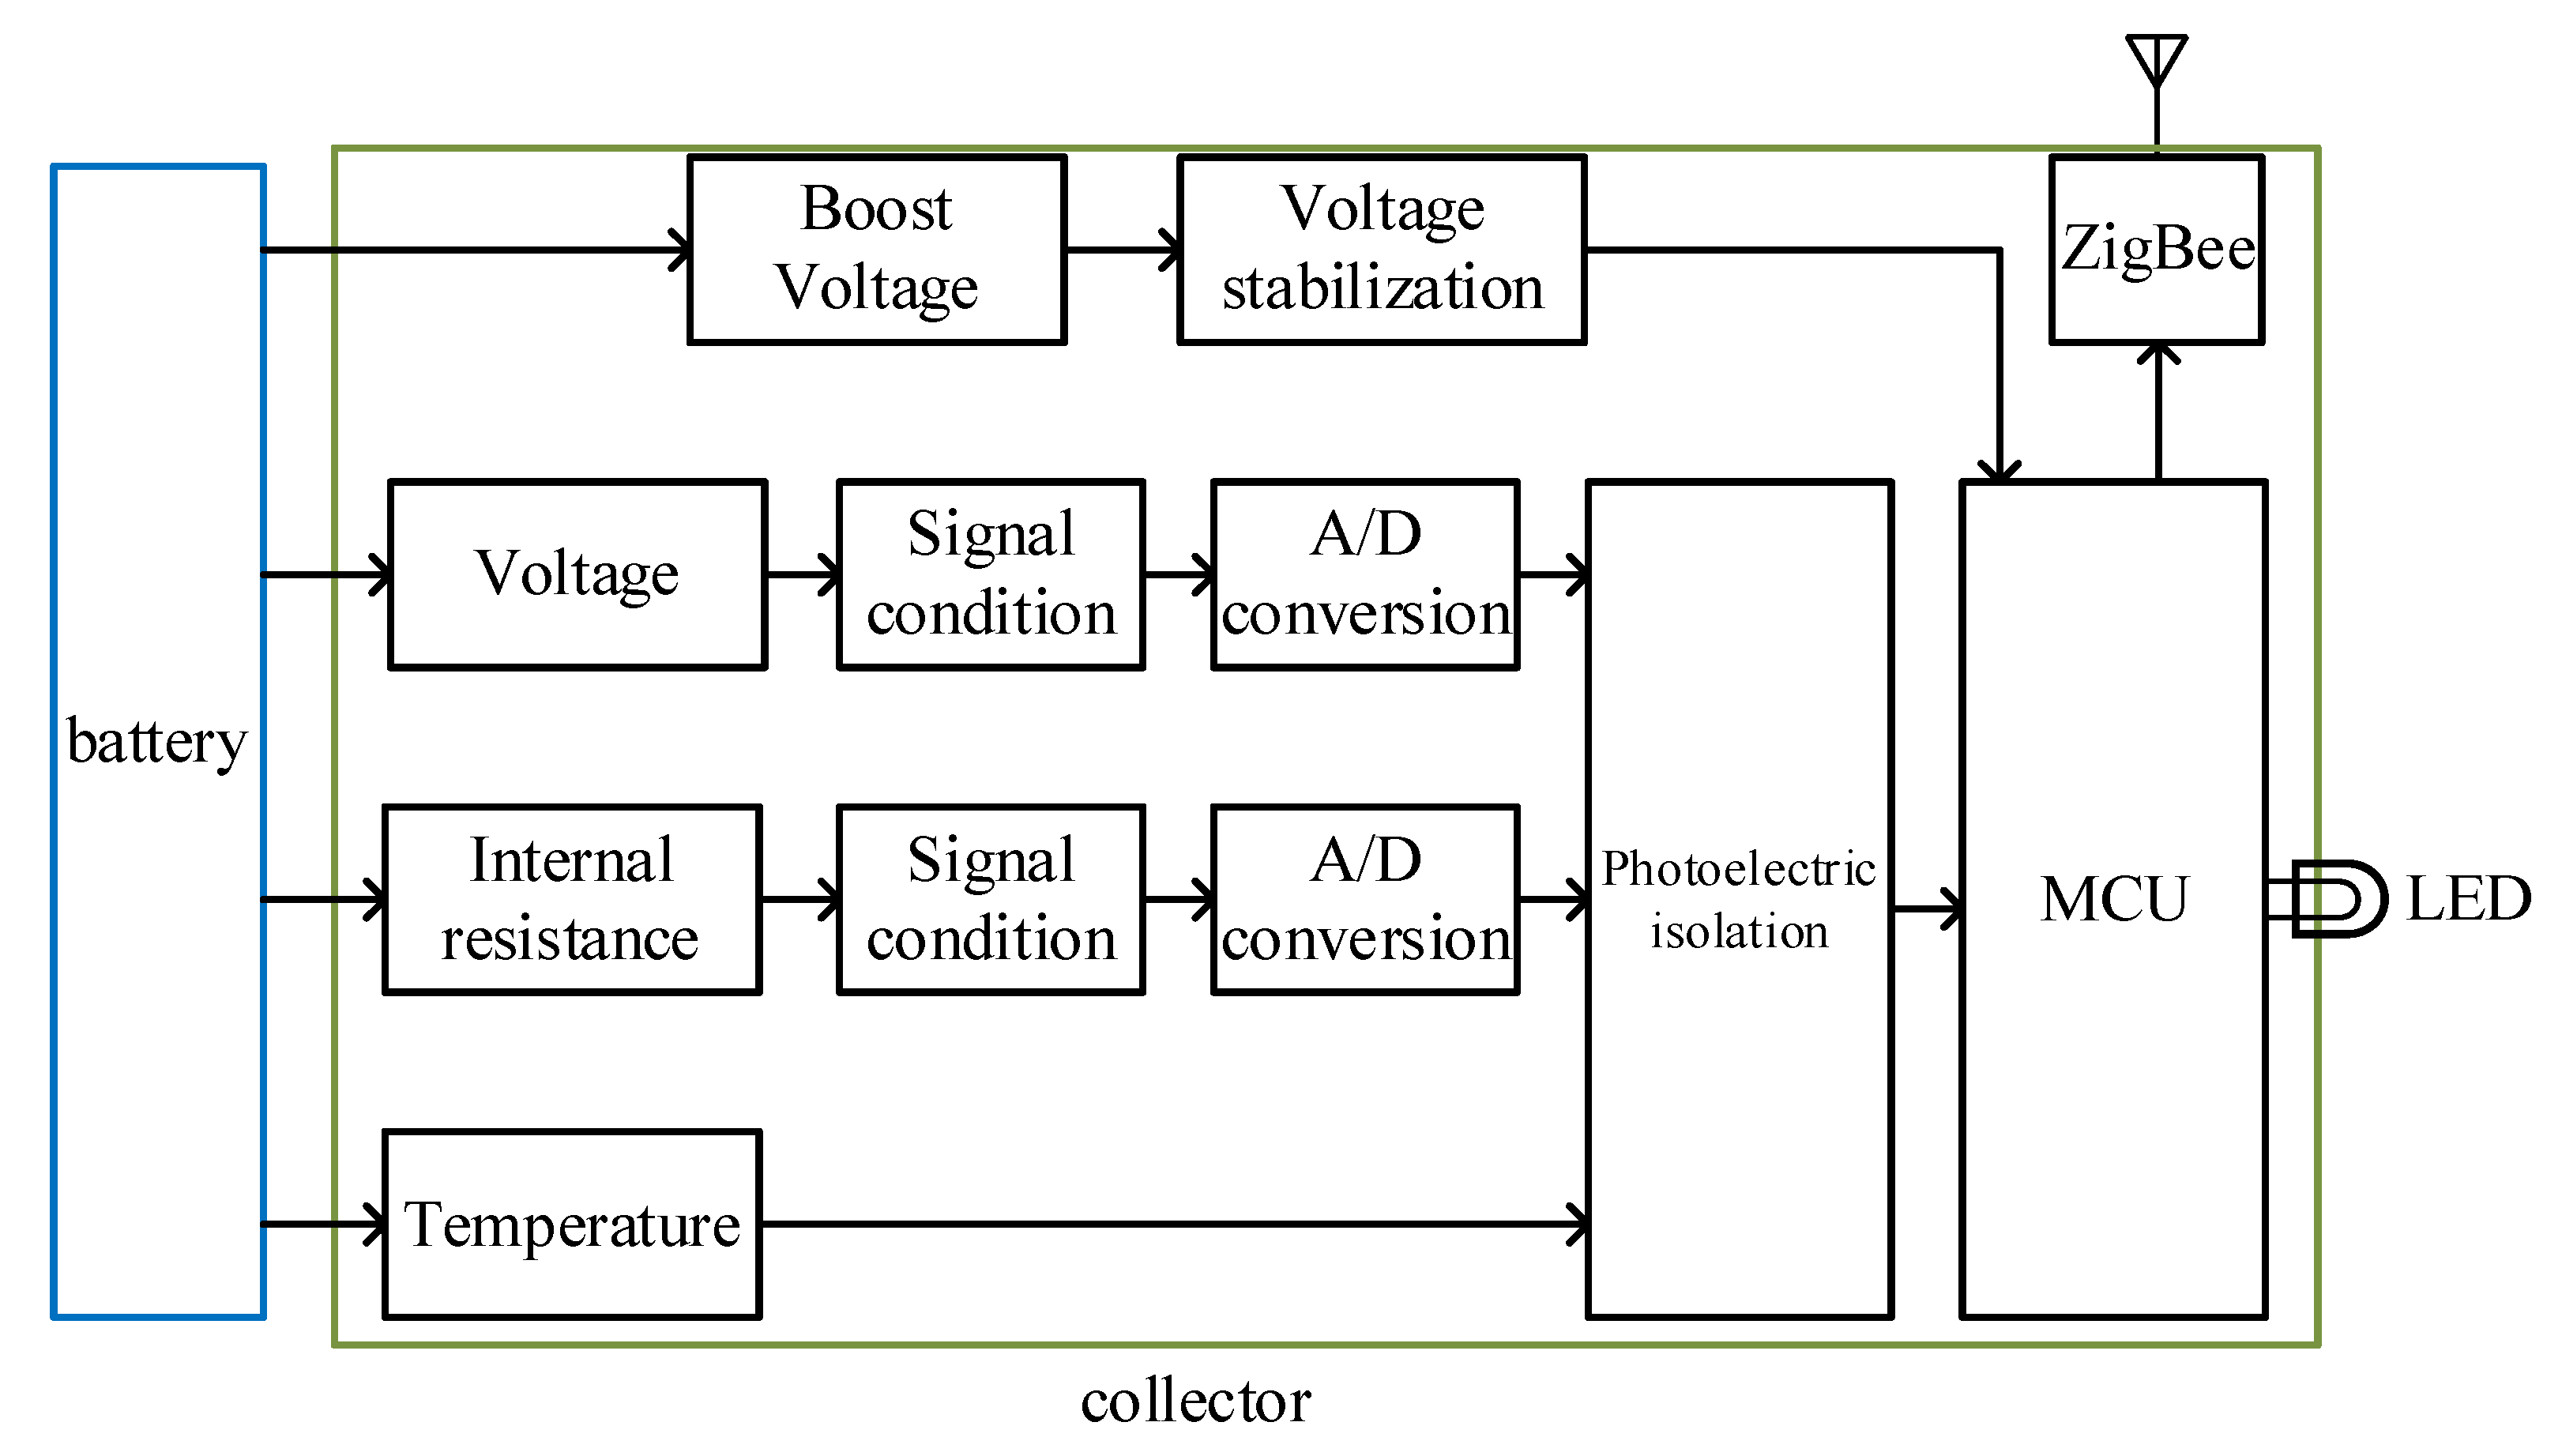
2.1. Design of the System Hardware
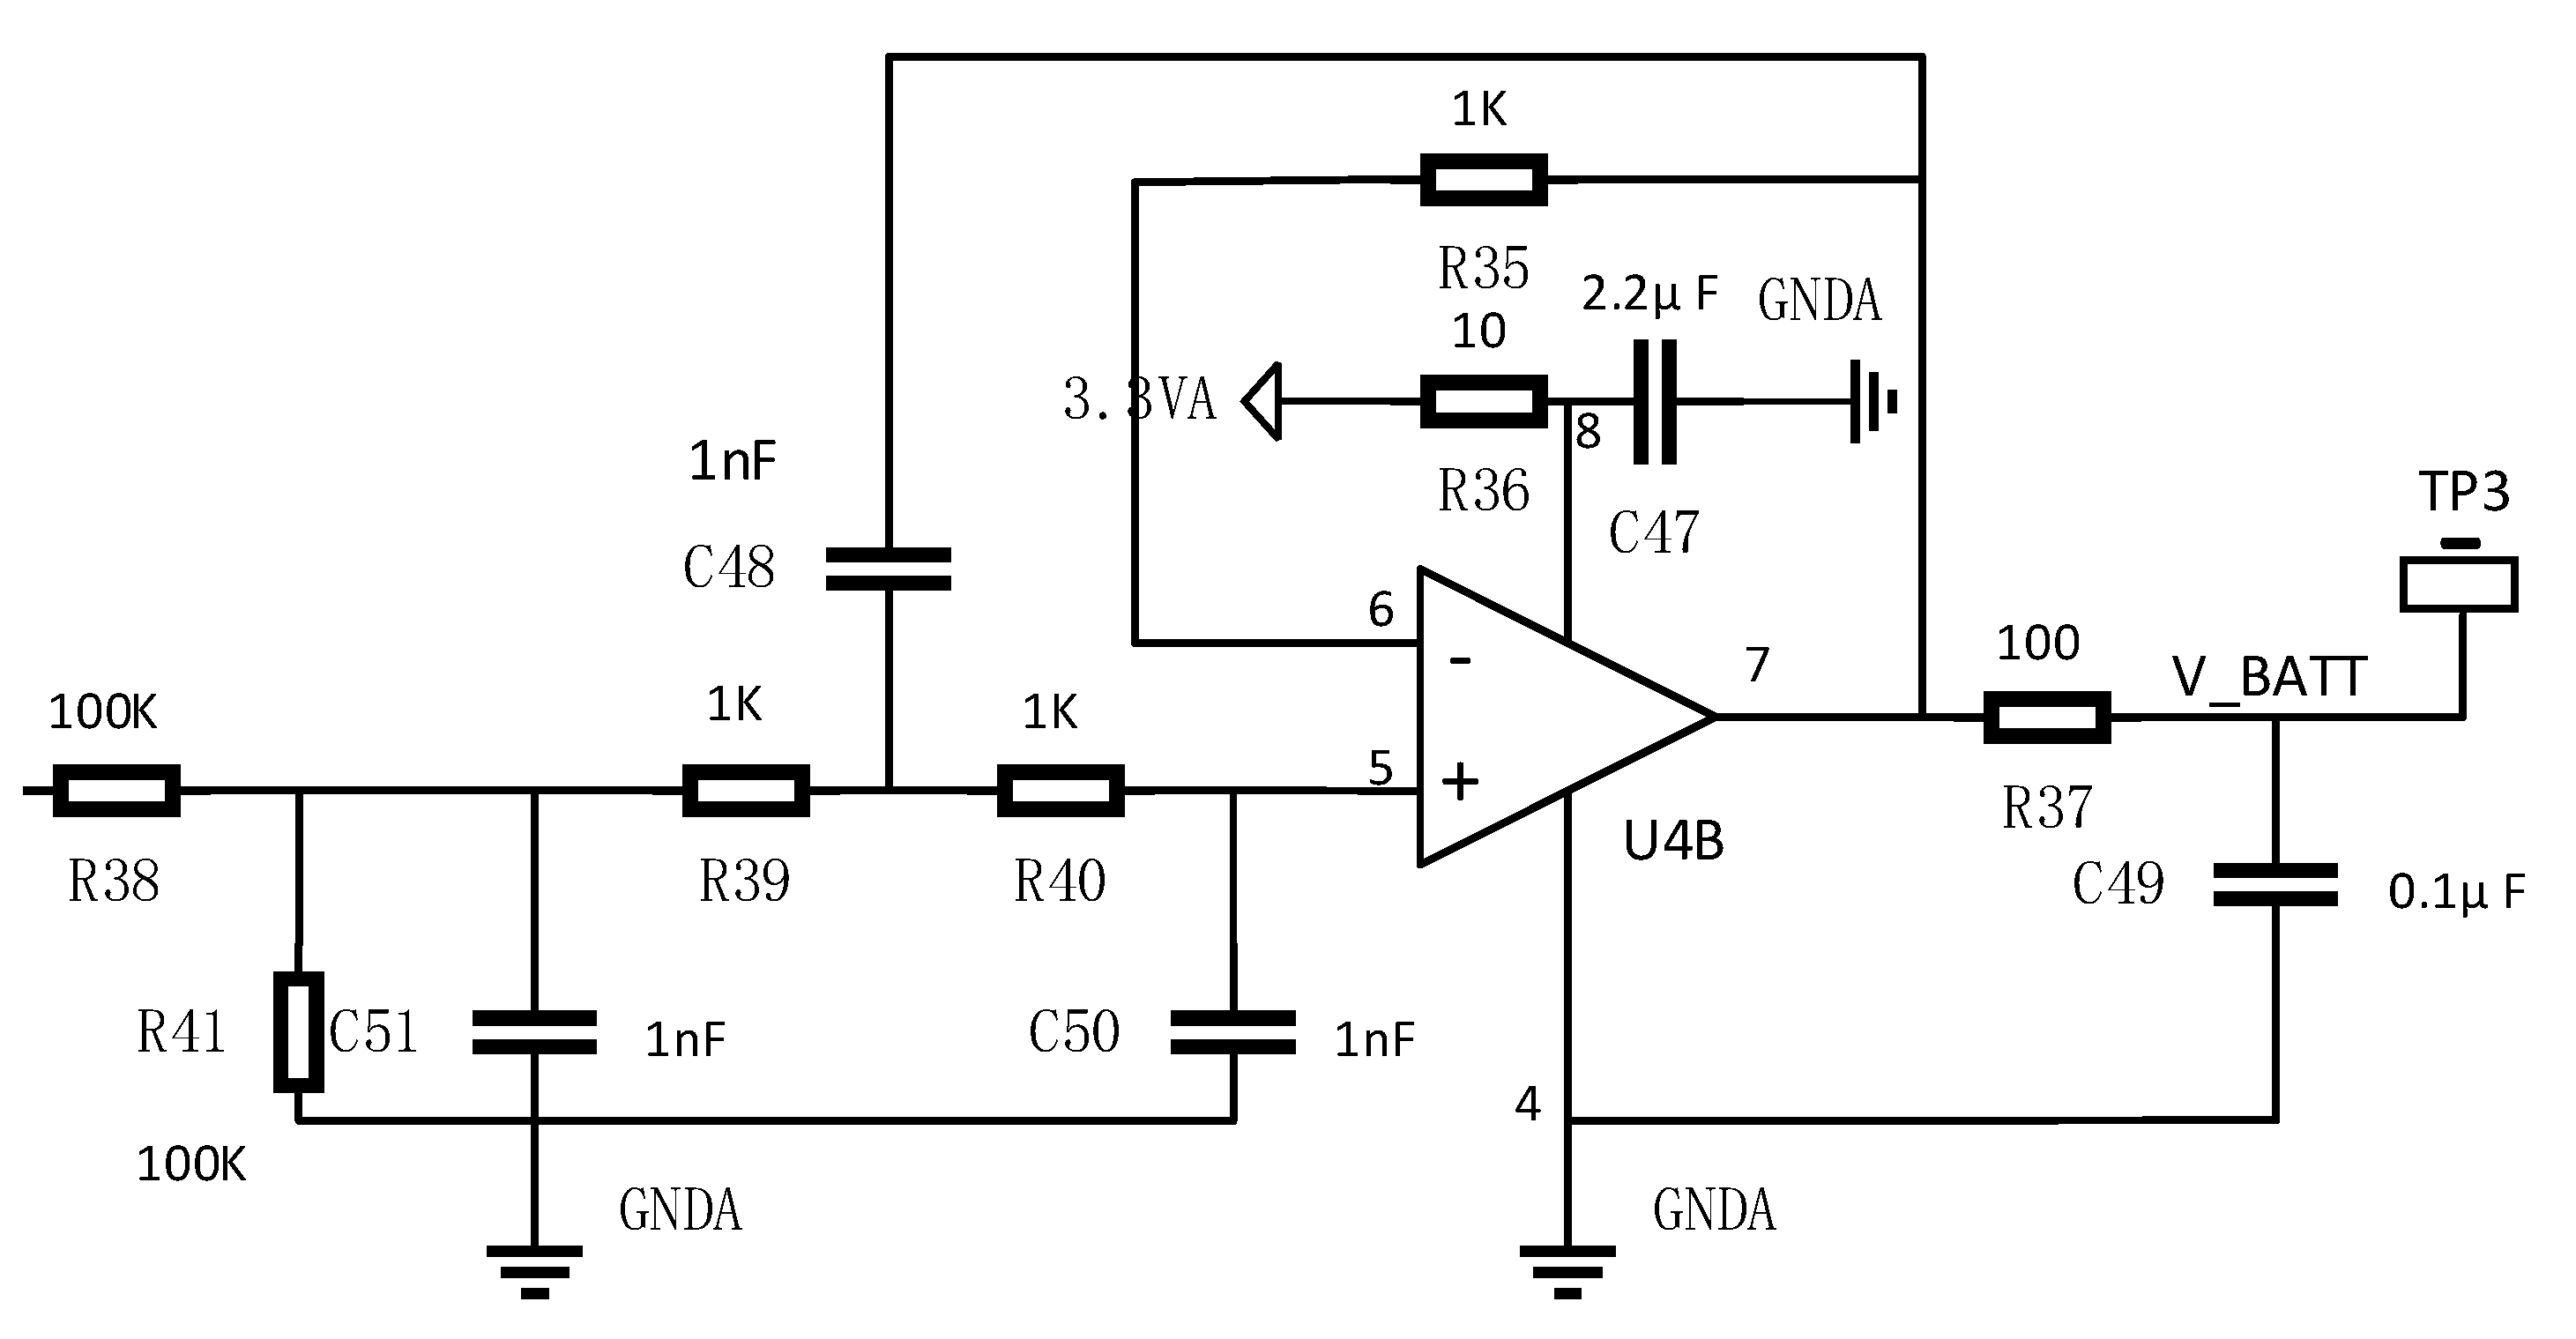
2.1.1. Voltage Sampling Module
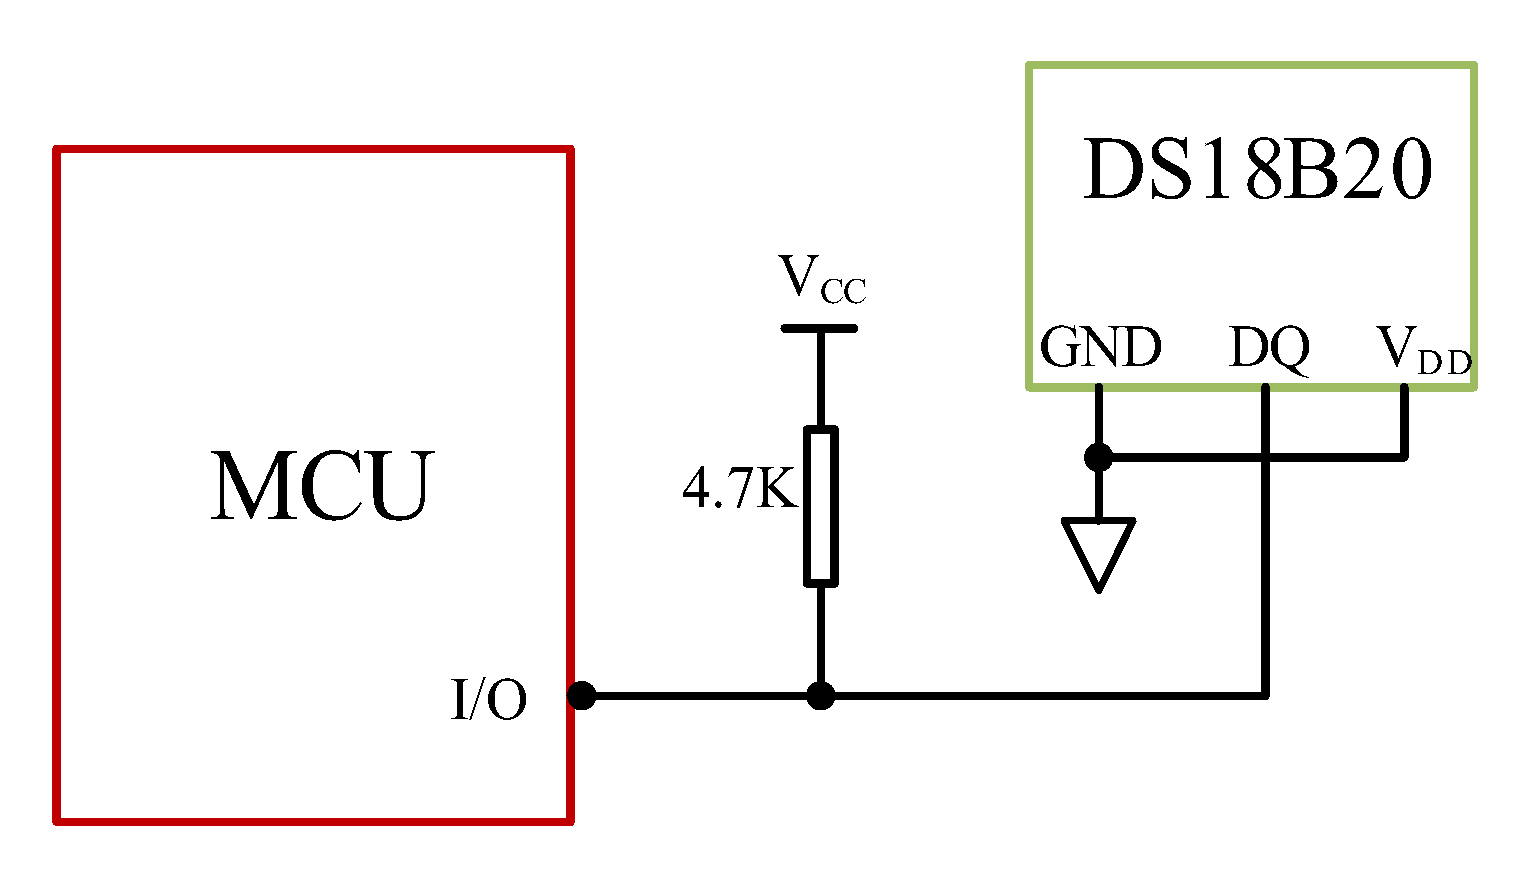
2.1.2. Temperature Sampling Module
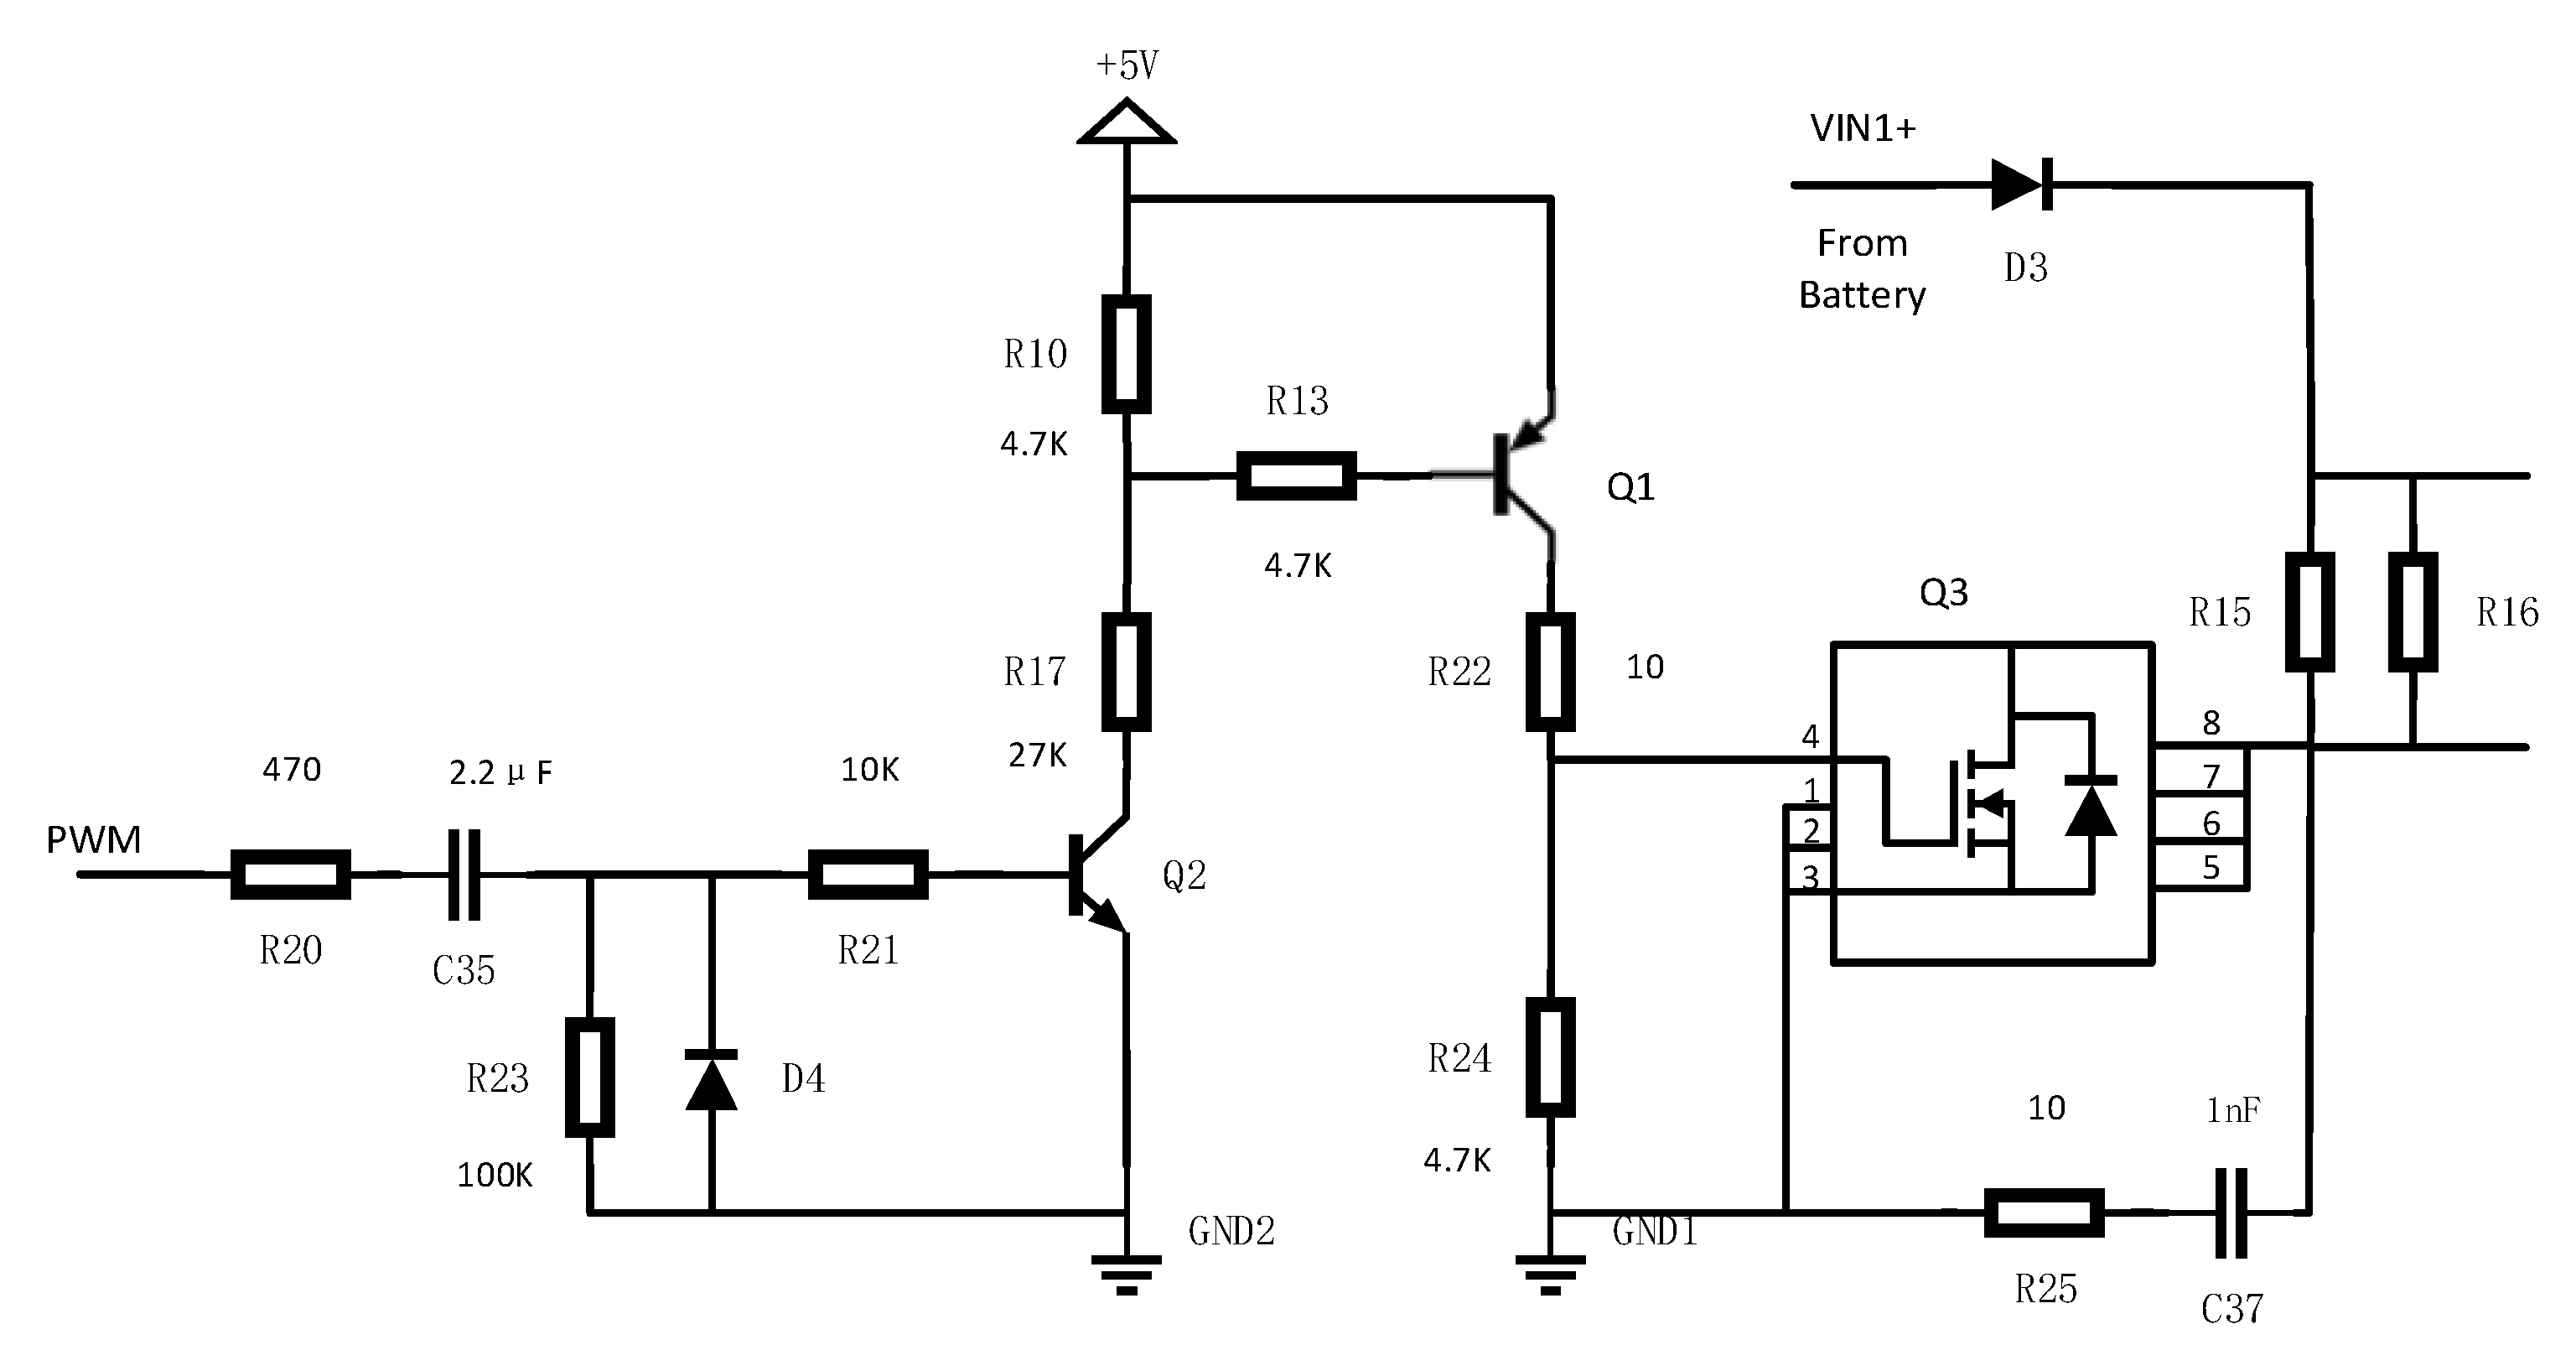
2.1.3. Internal Resistance Sampling Module
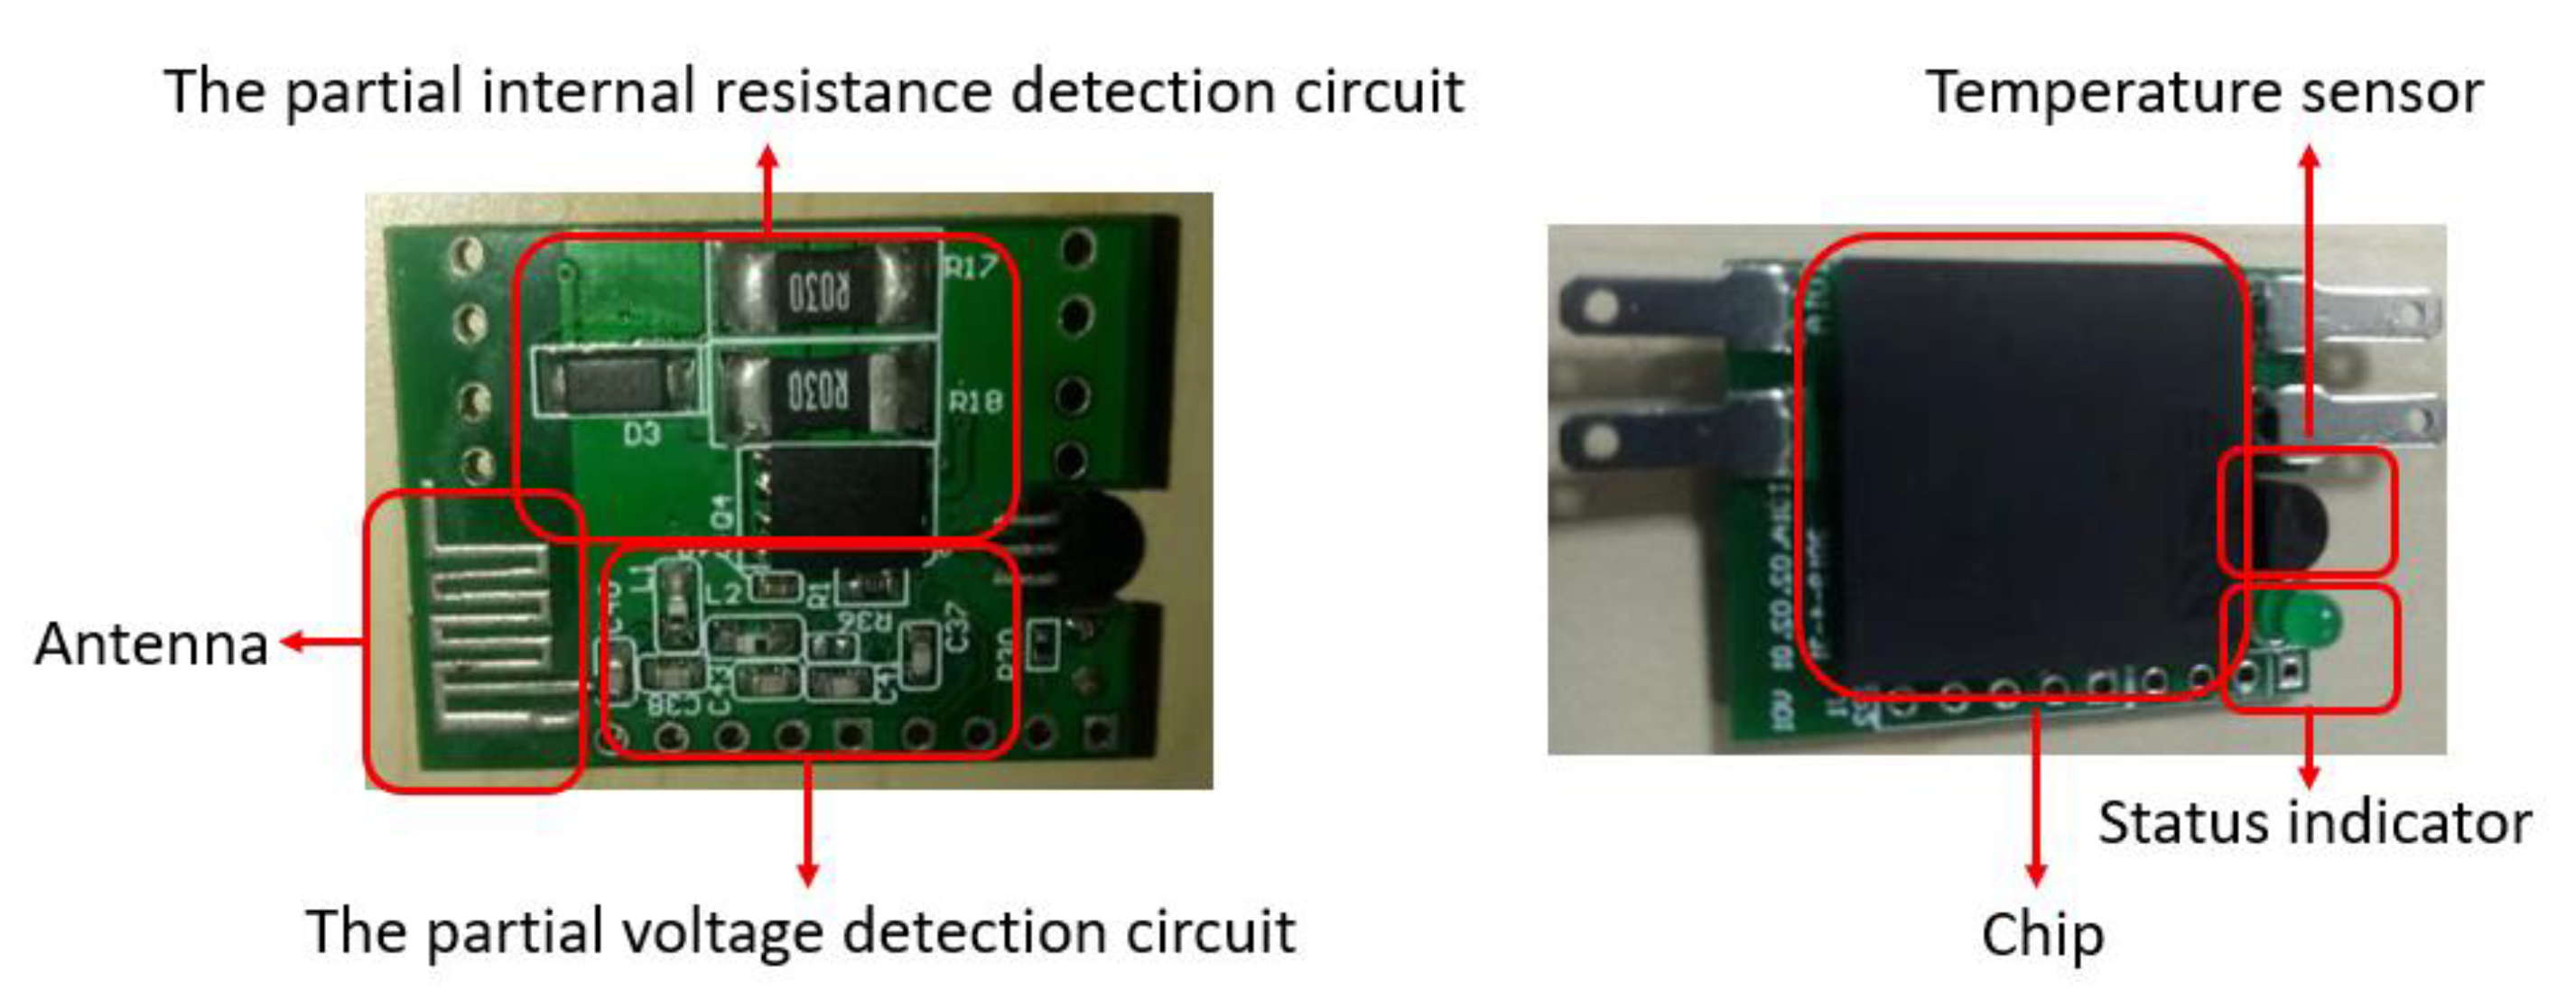
2.1.4. Chip Design of Acquisition Terminal
2.2. Design of the System Software
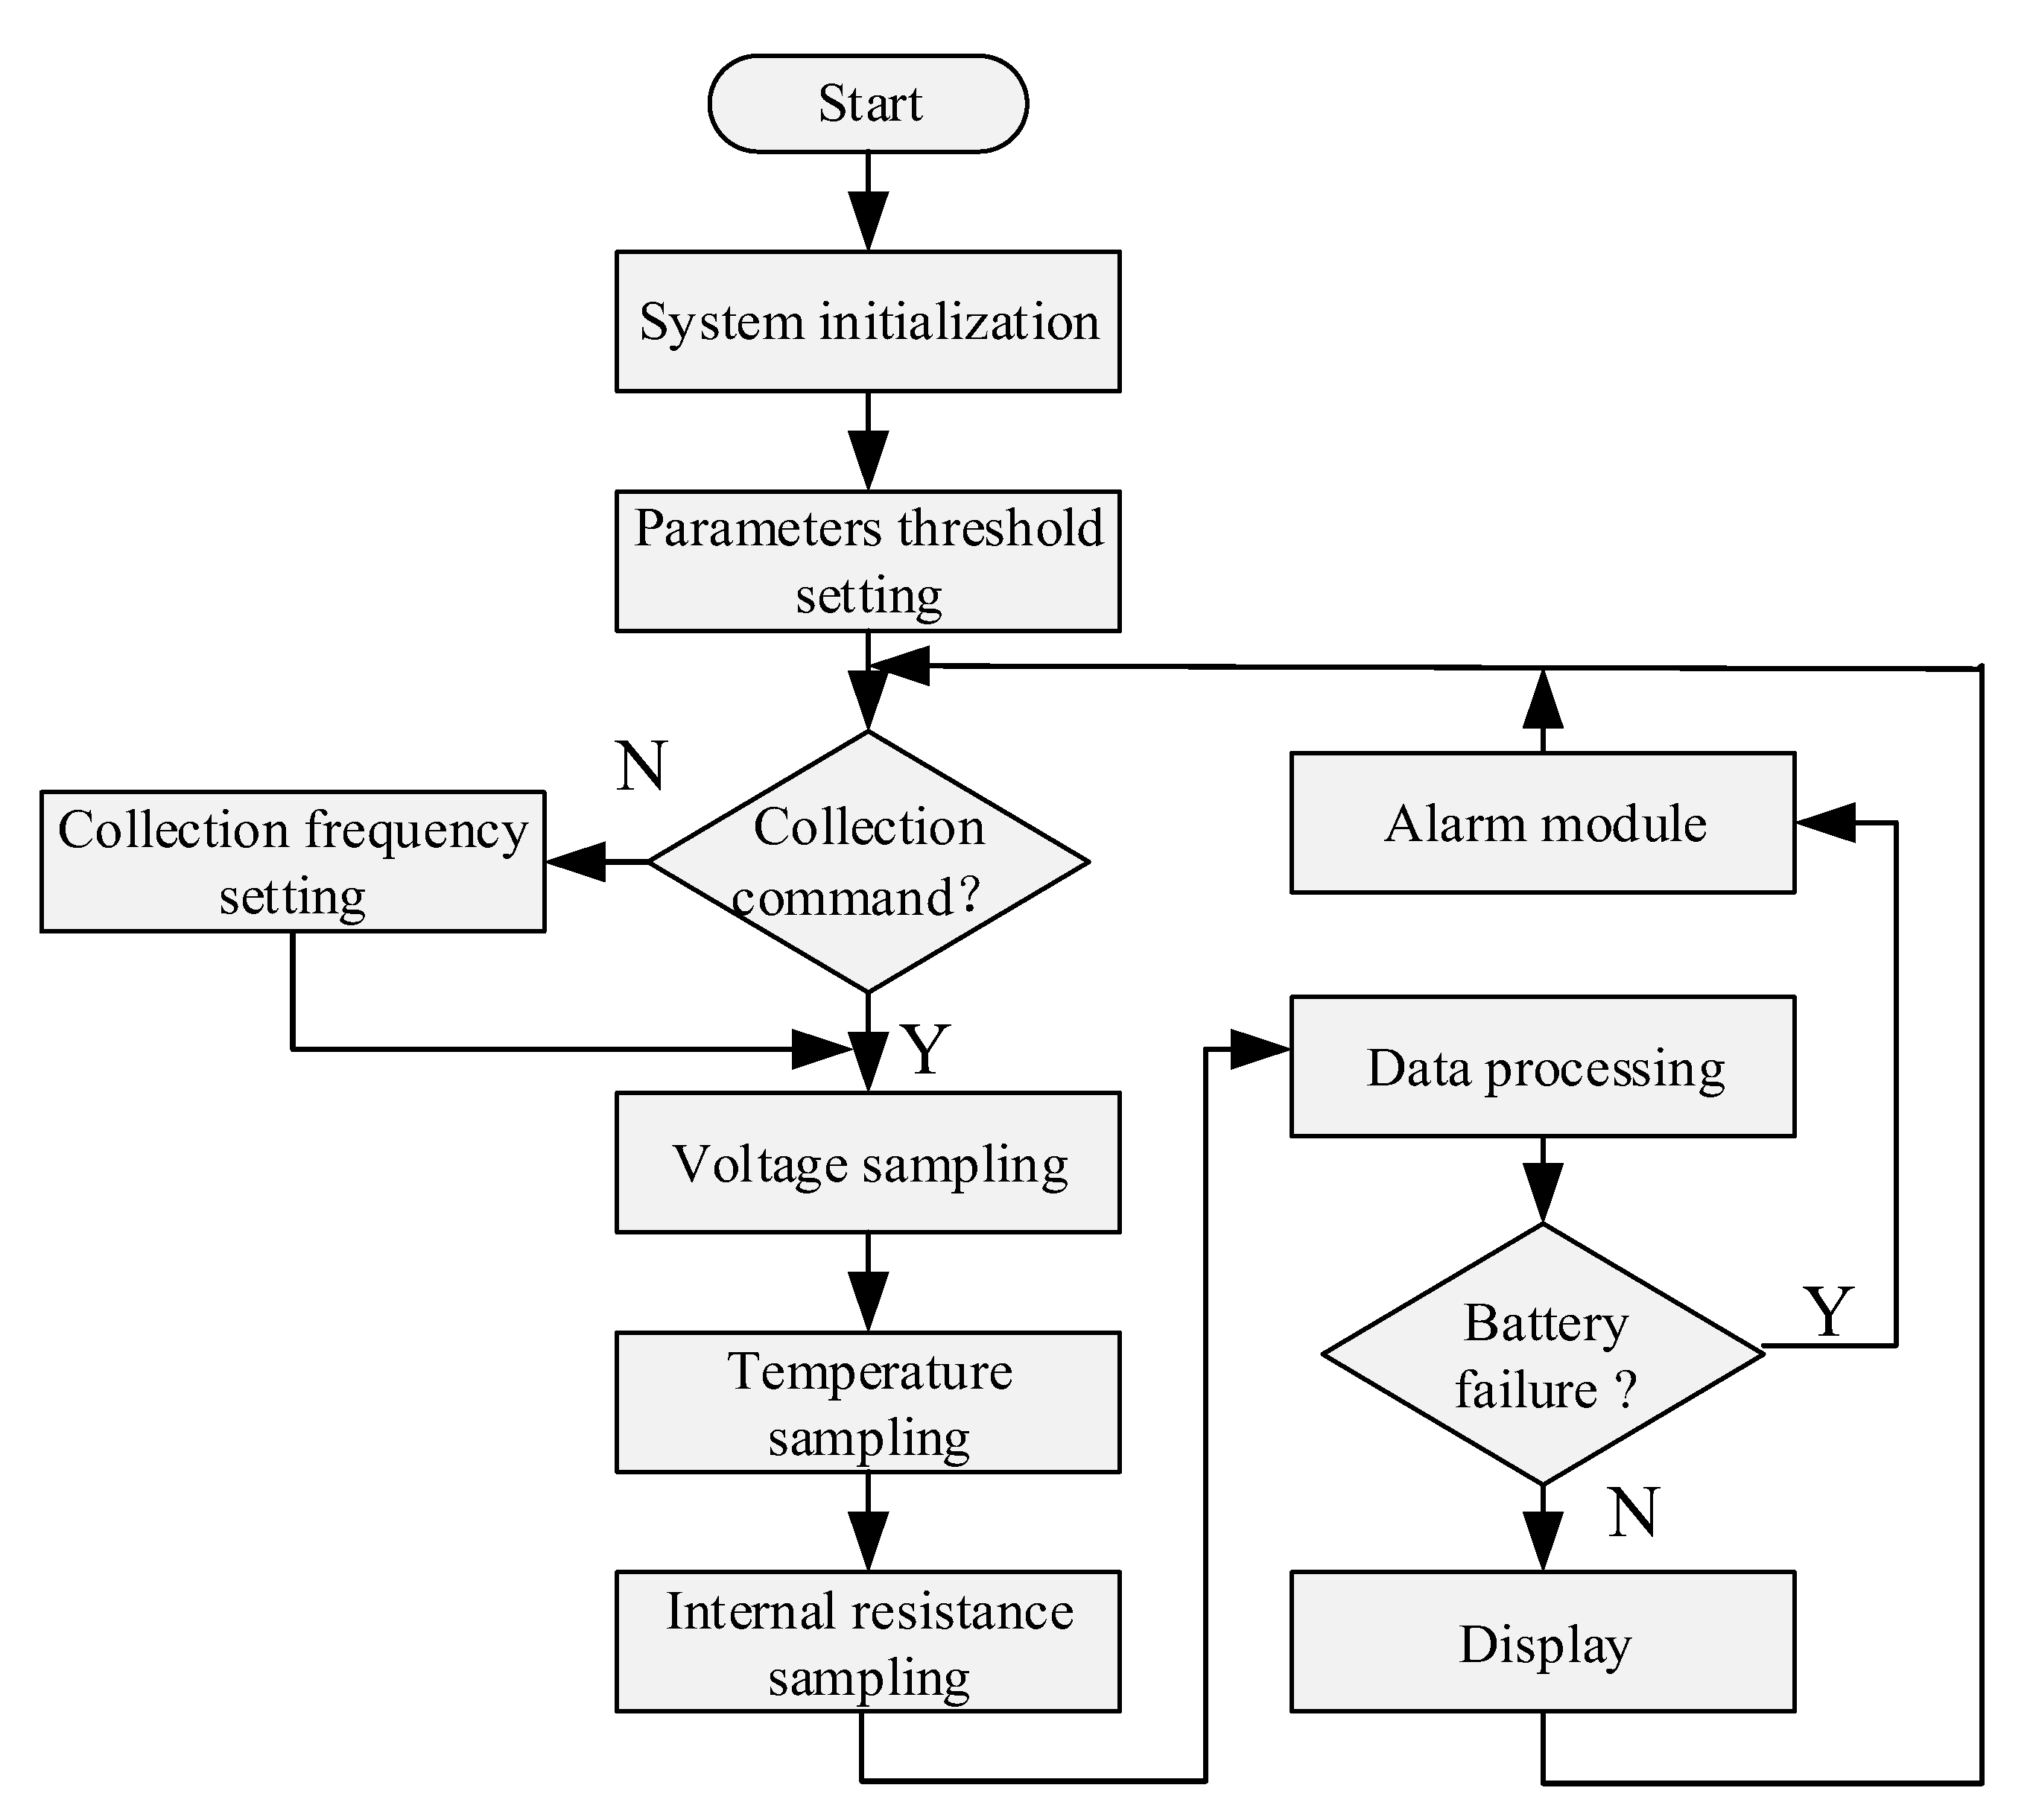
2.2.1. Design of Parameter Acquisition Software
2.2.2. Design of ZigBee Wireless Module Software
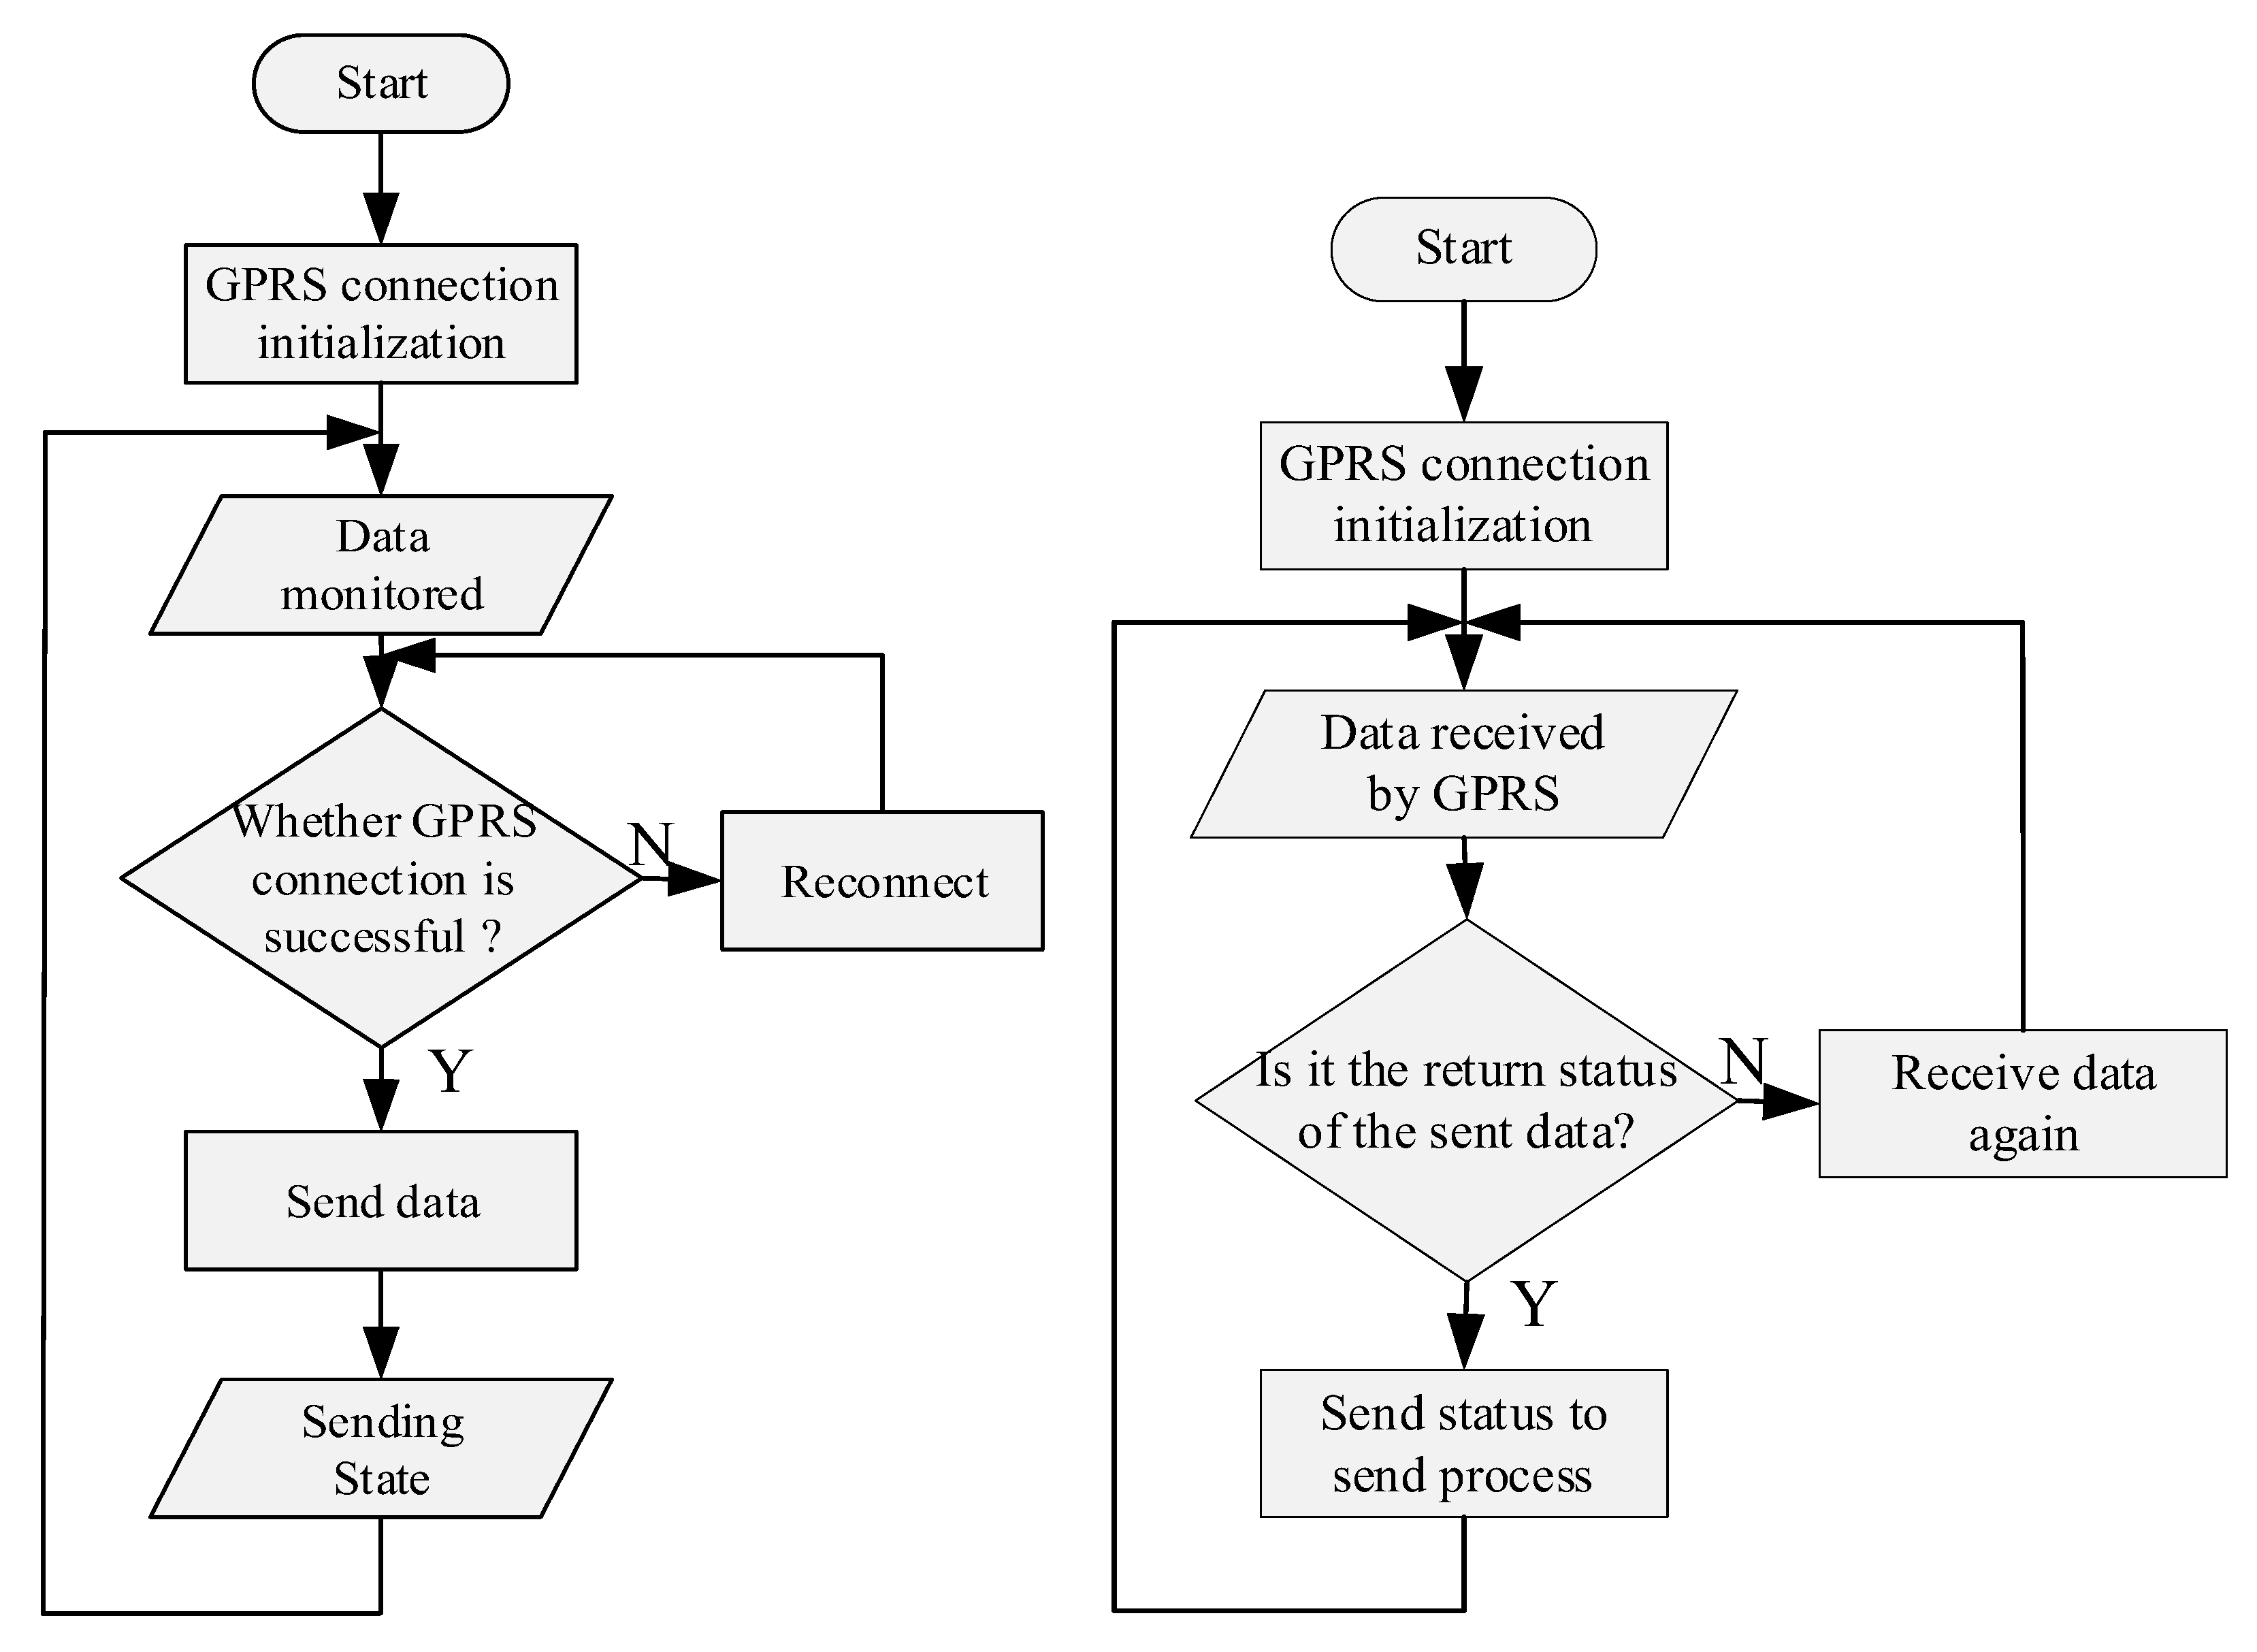
2.2.3. Design of GPRS Data Sending and Receiving Software
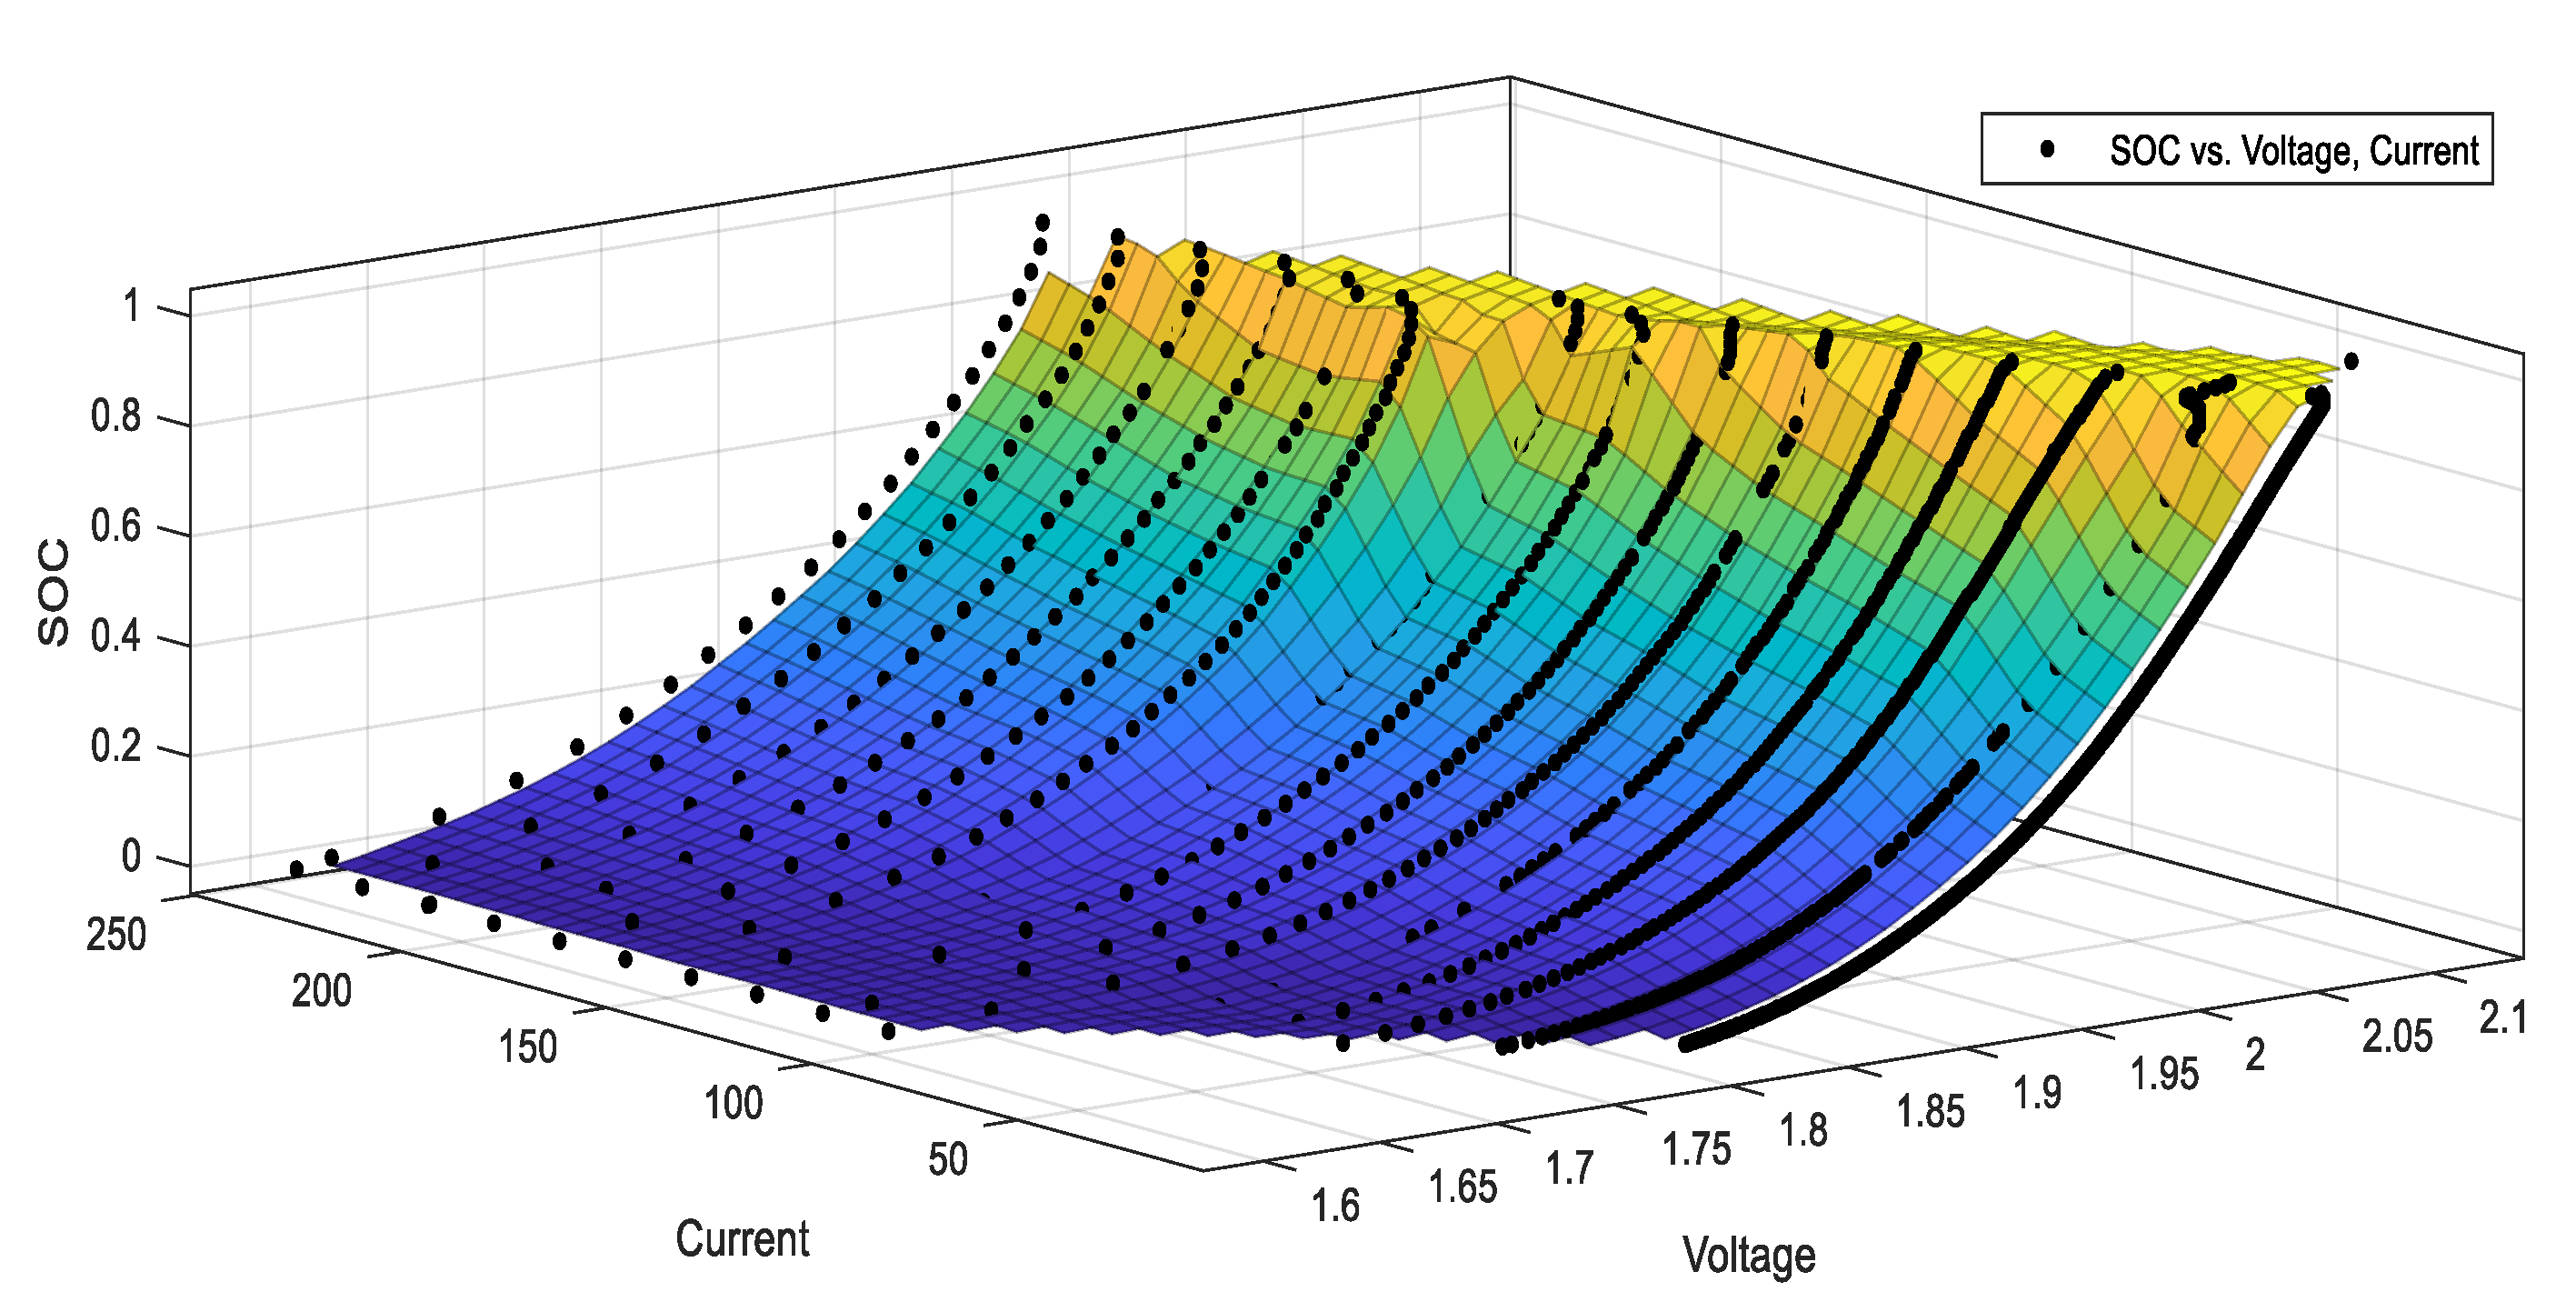
2.2.4. Remaining Battery Capacity Estimation
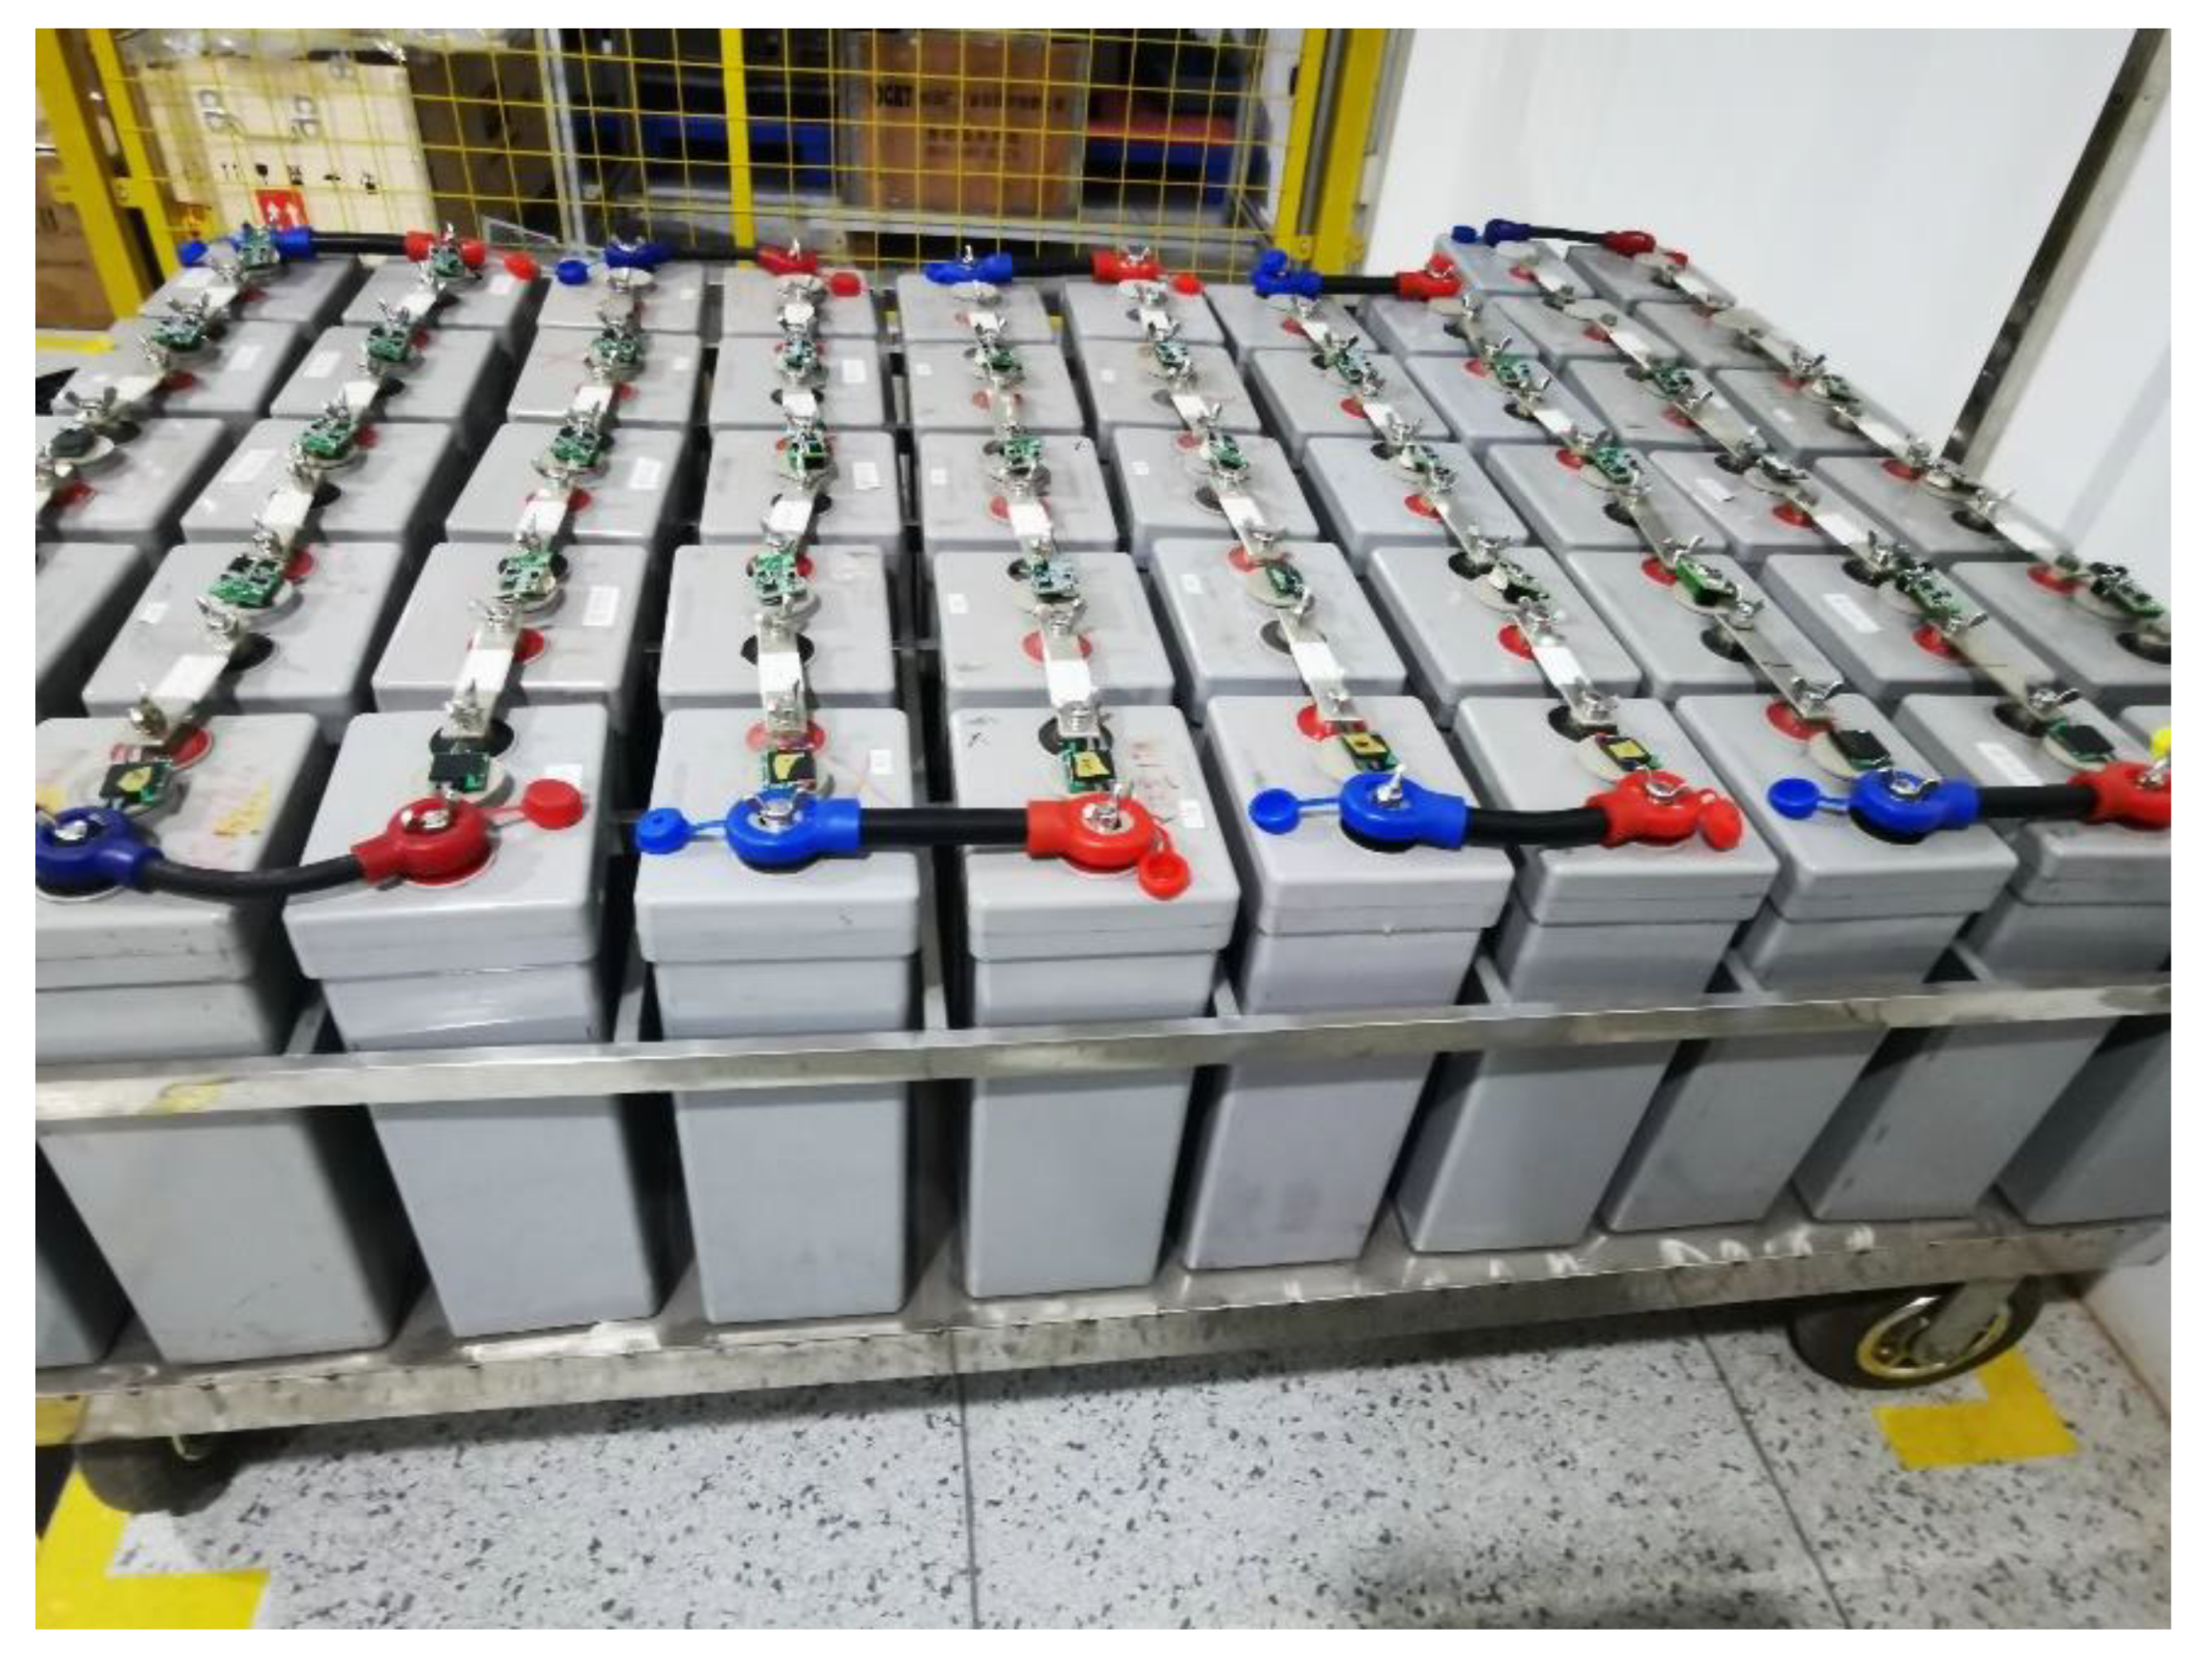
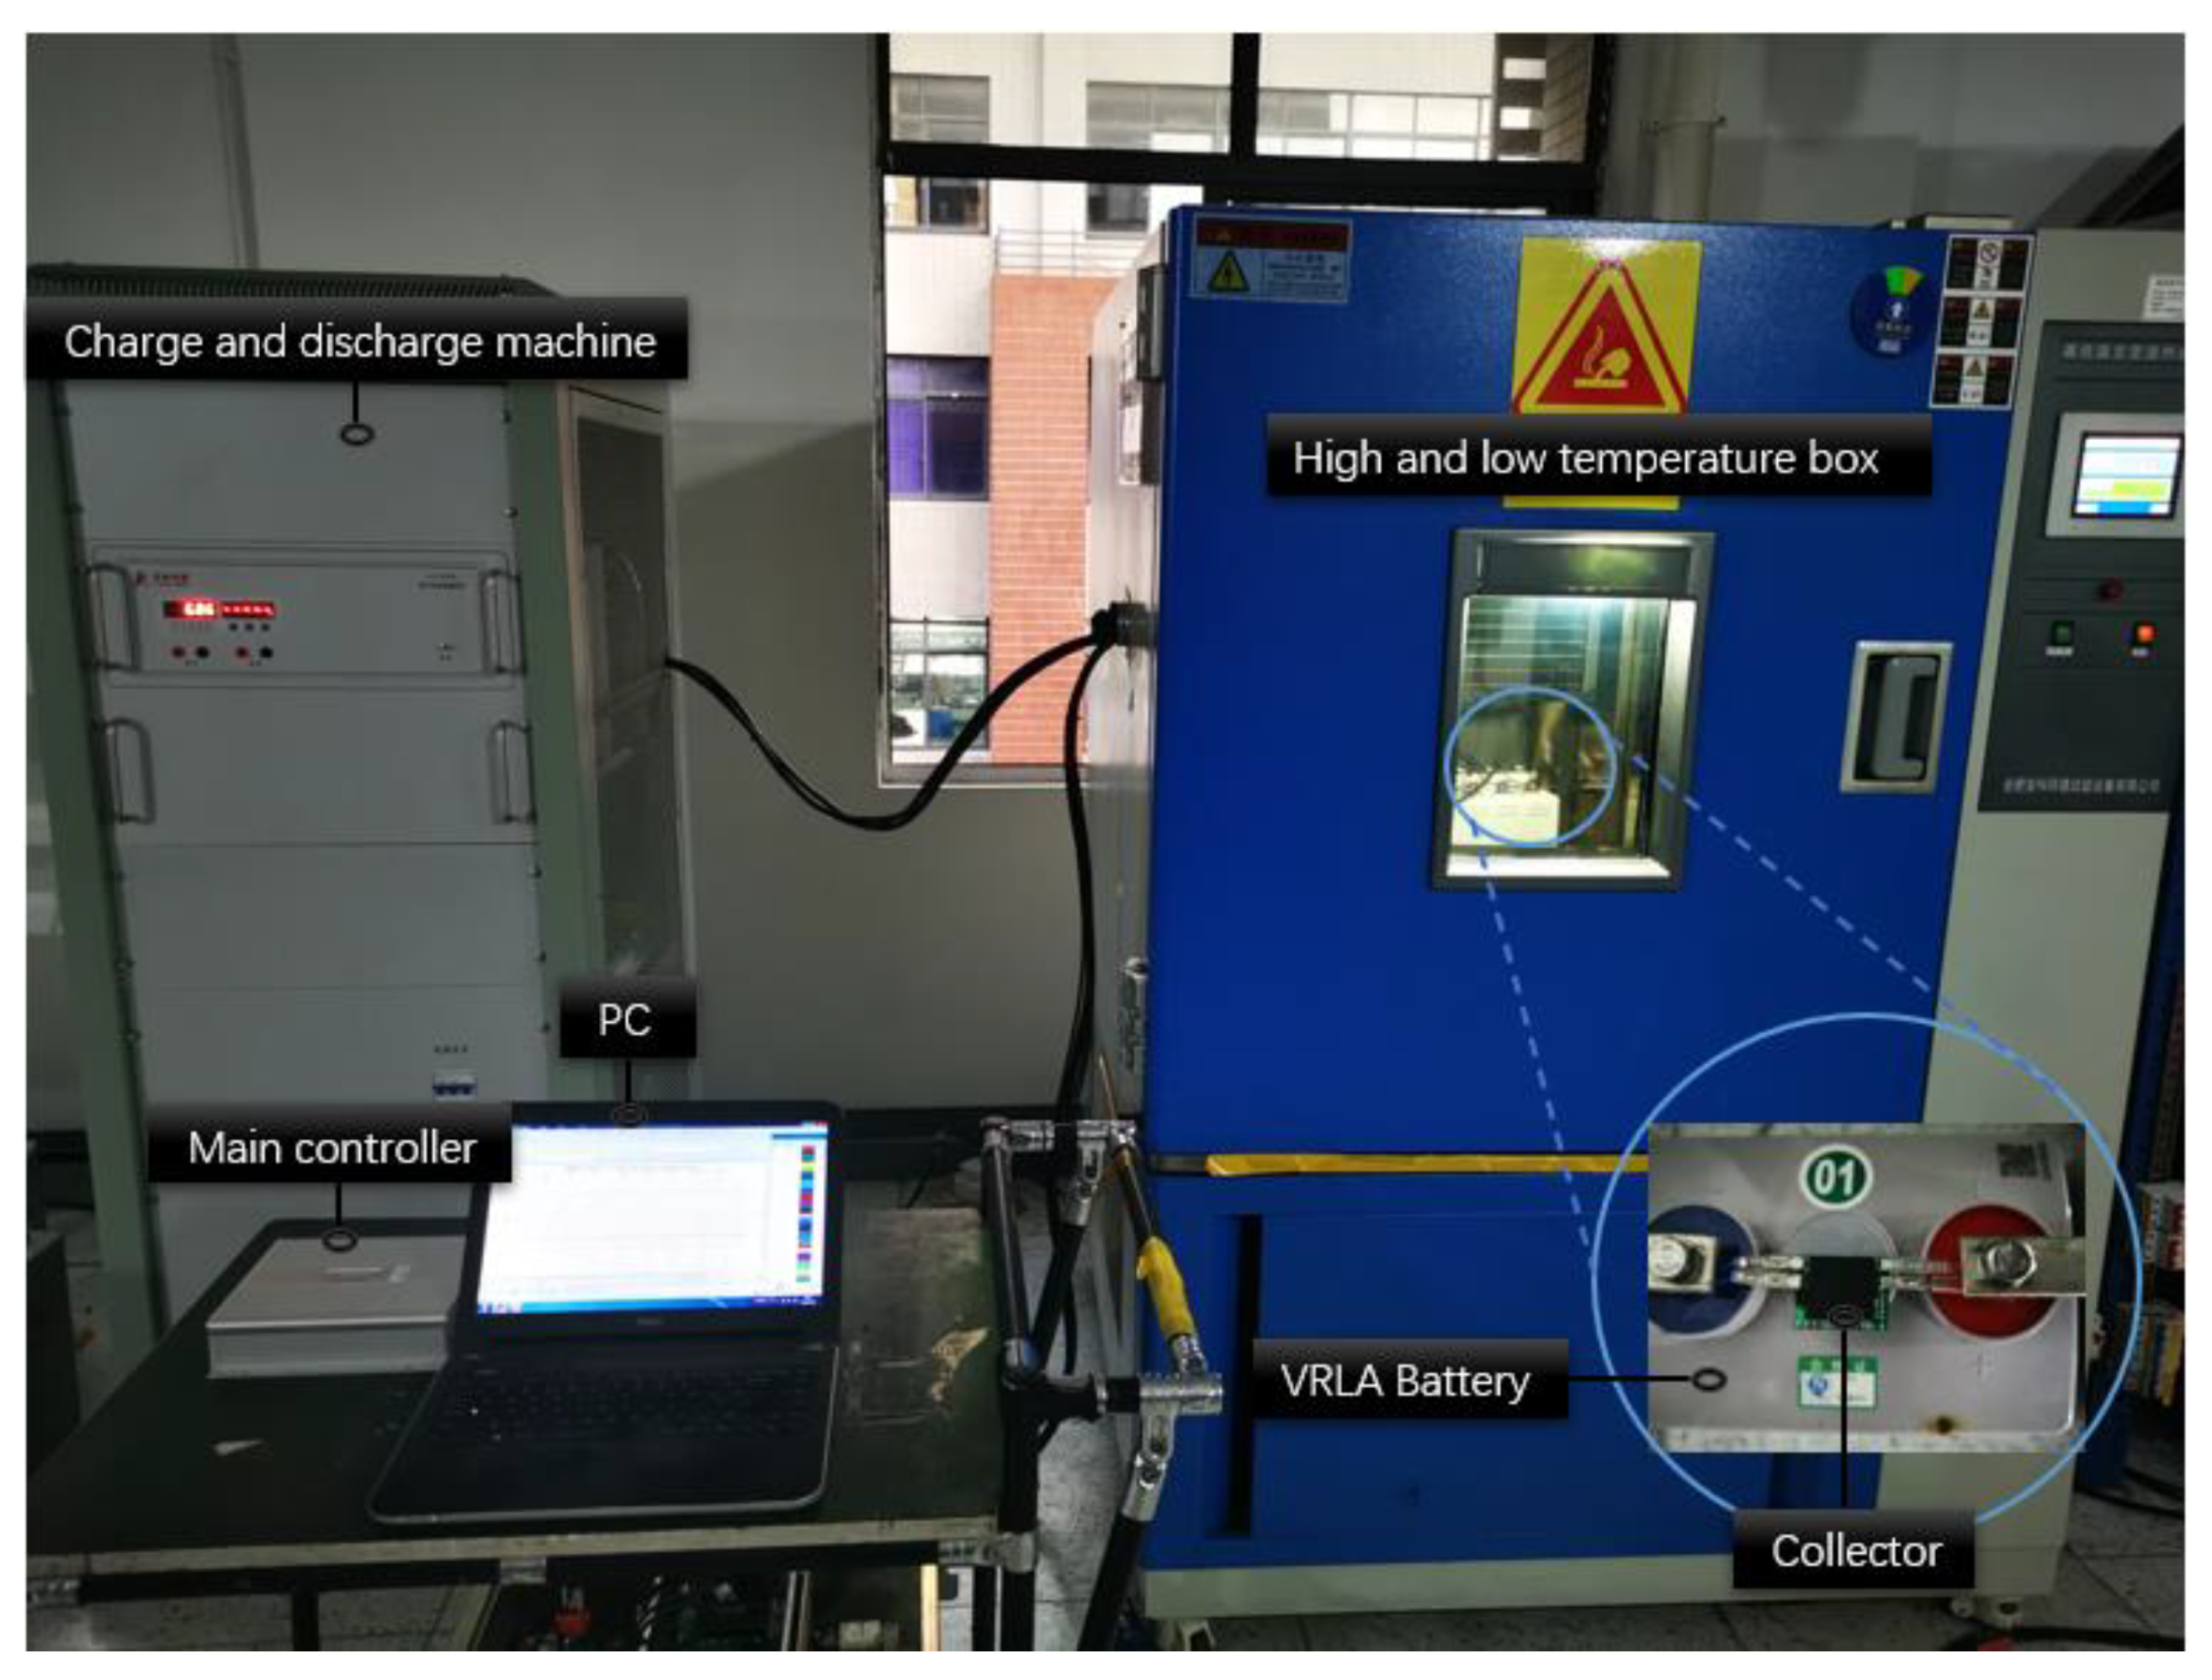
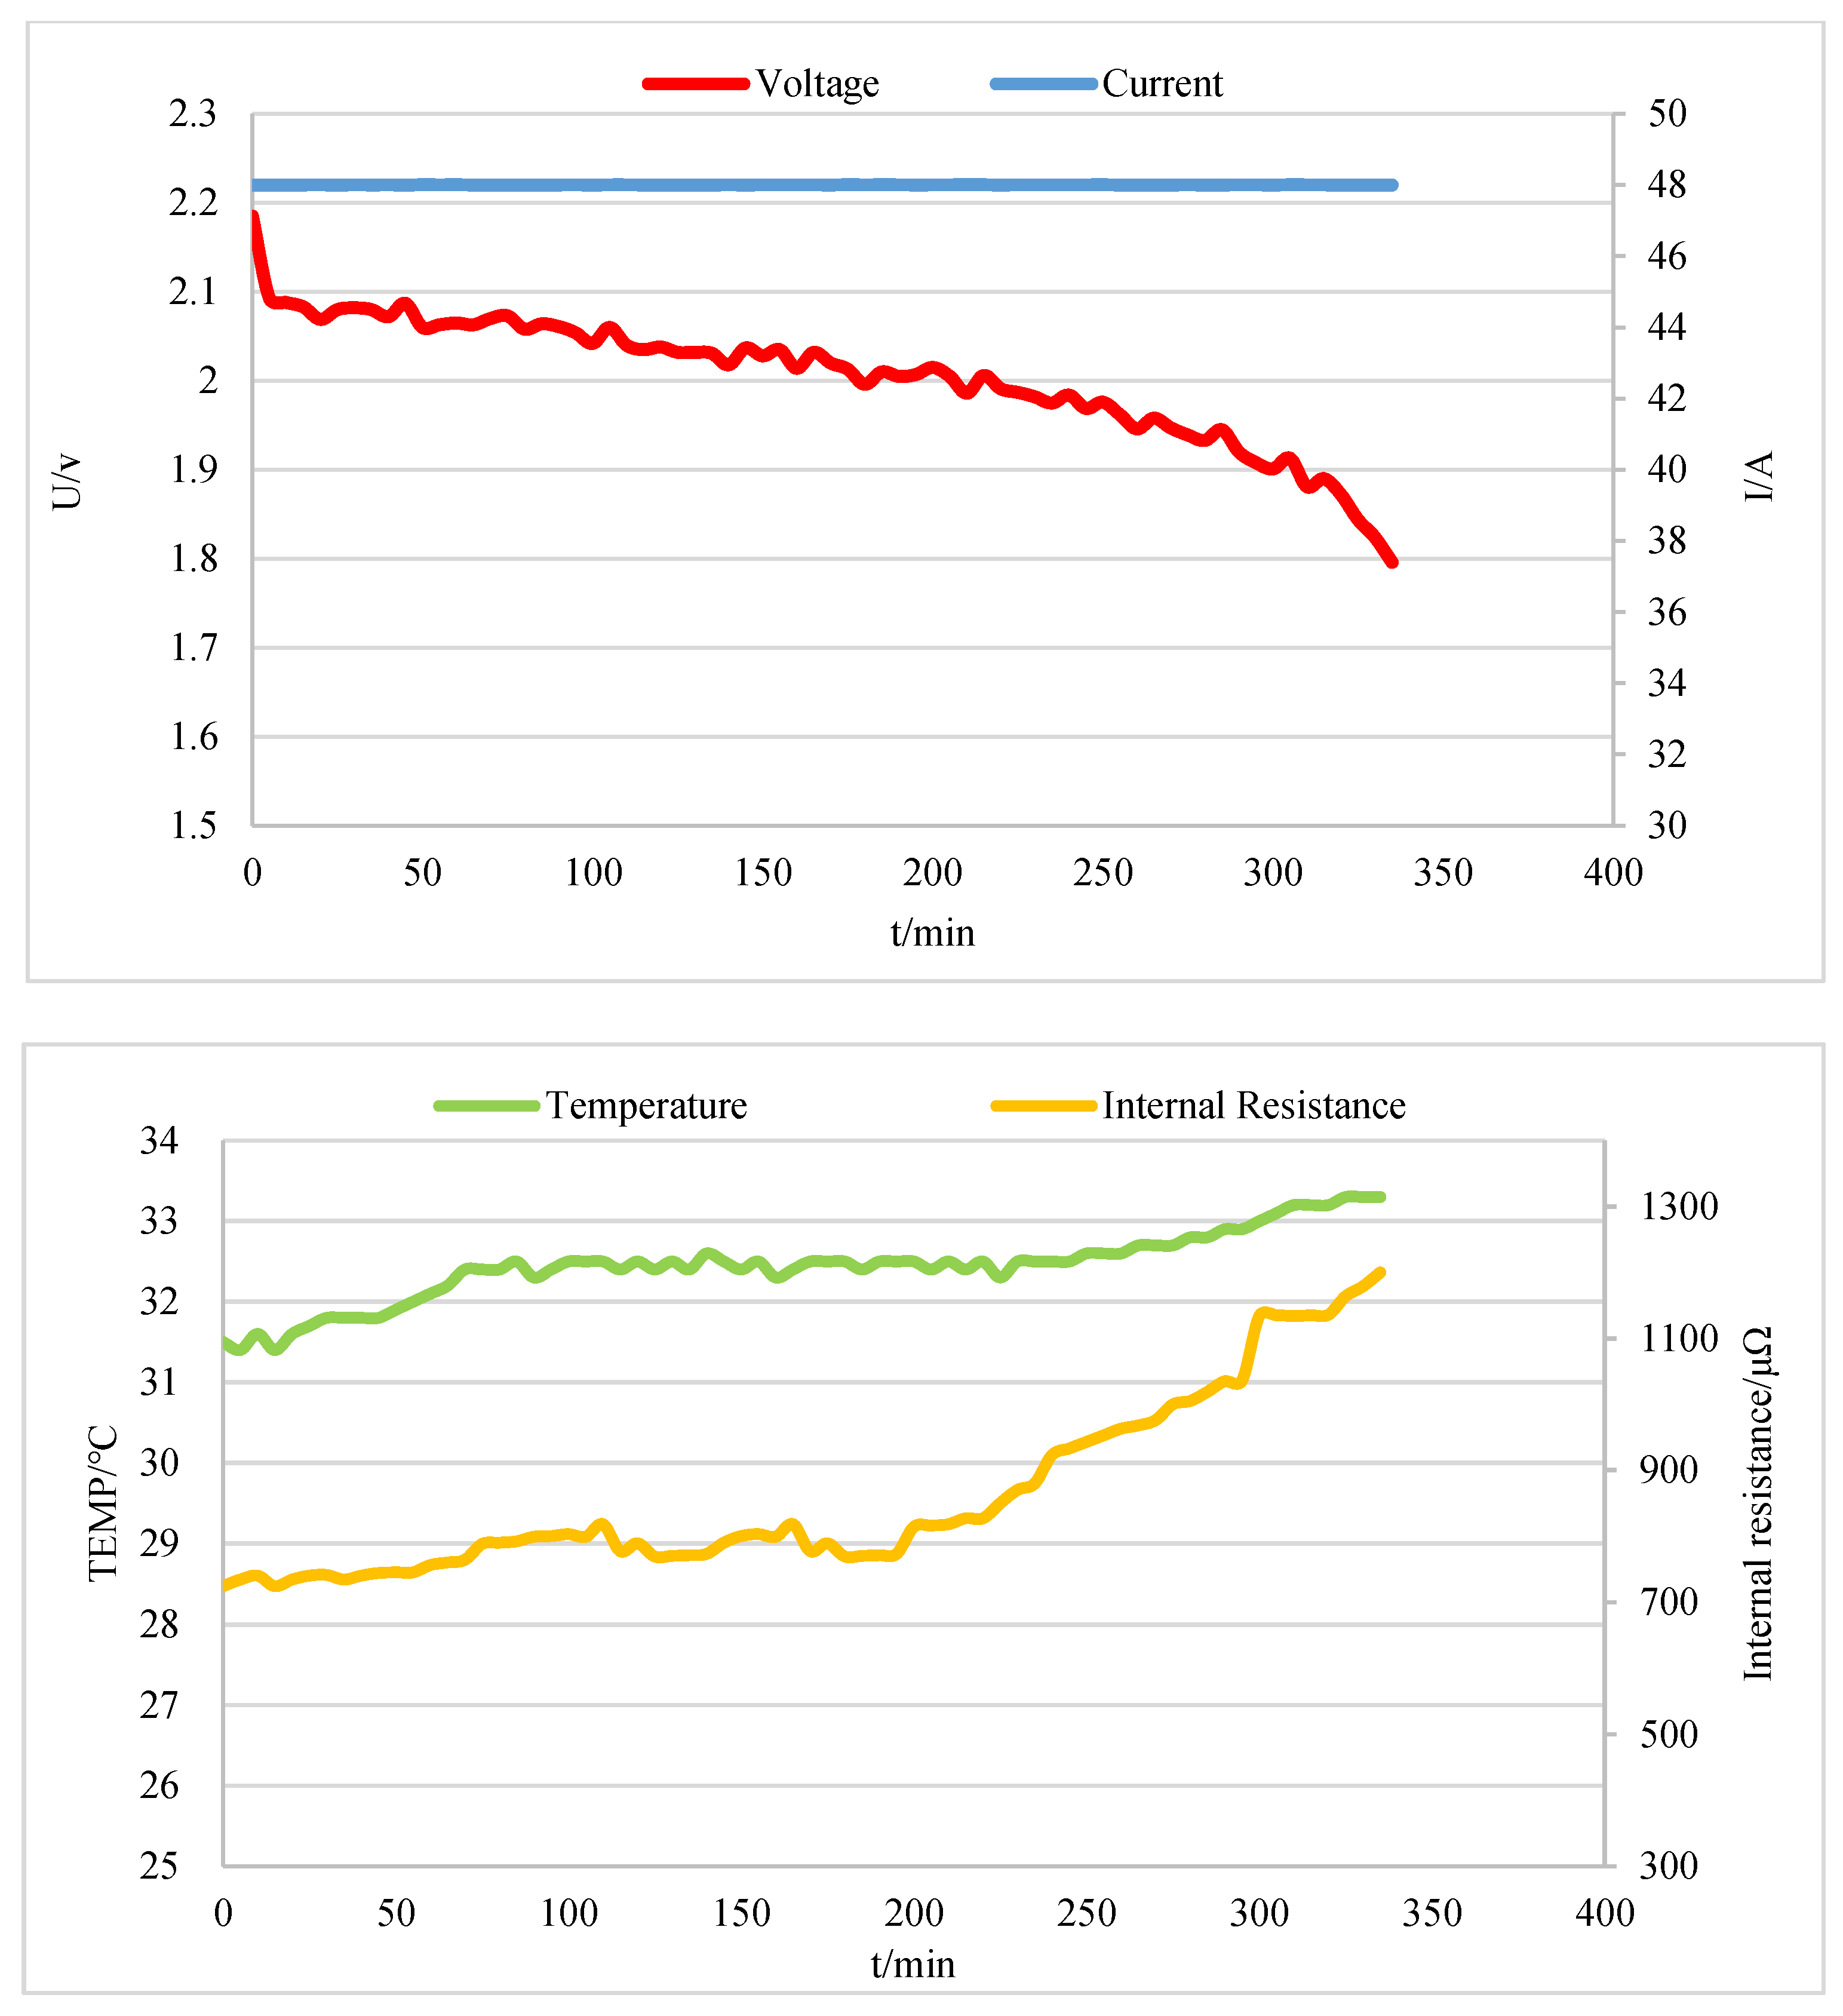
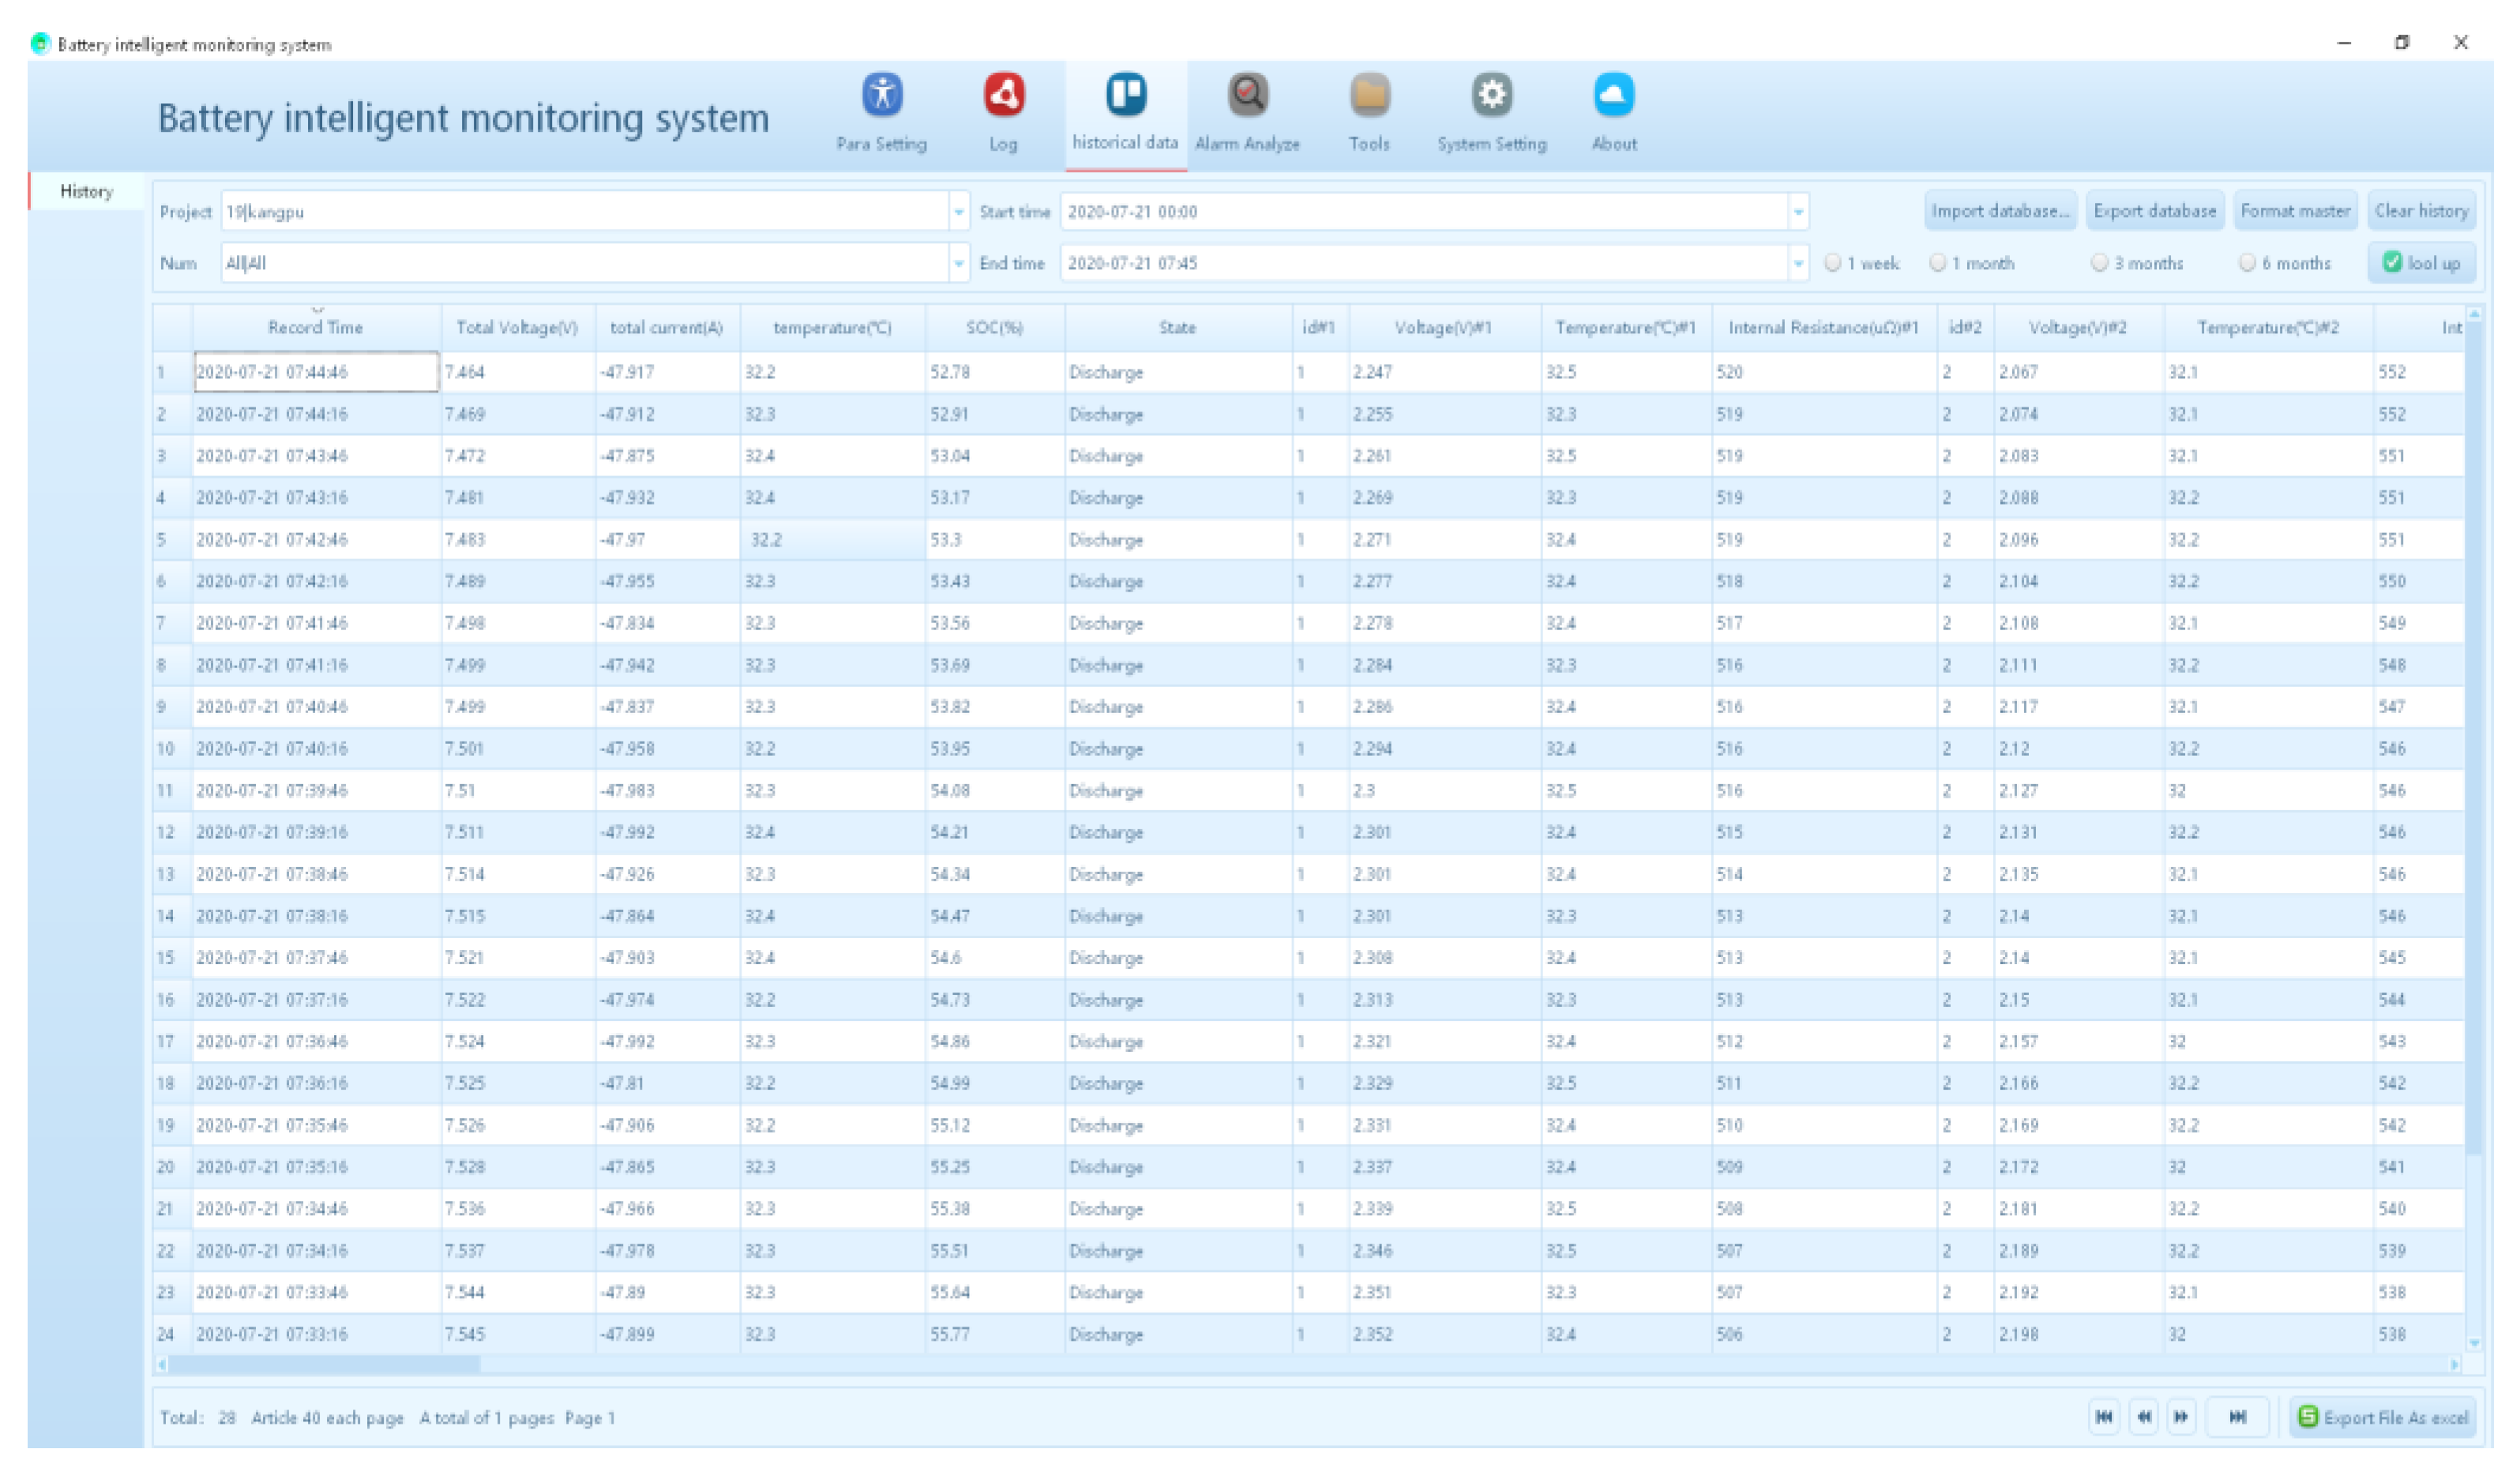
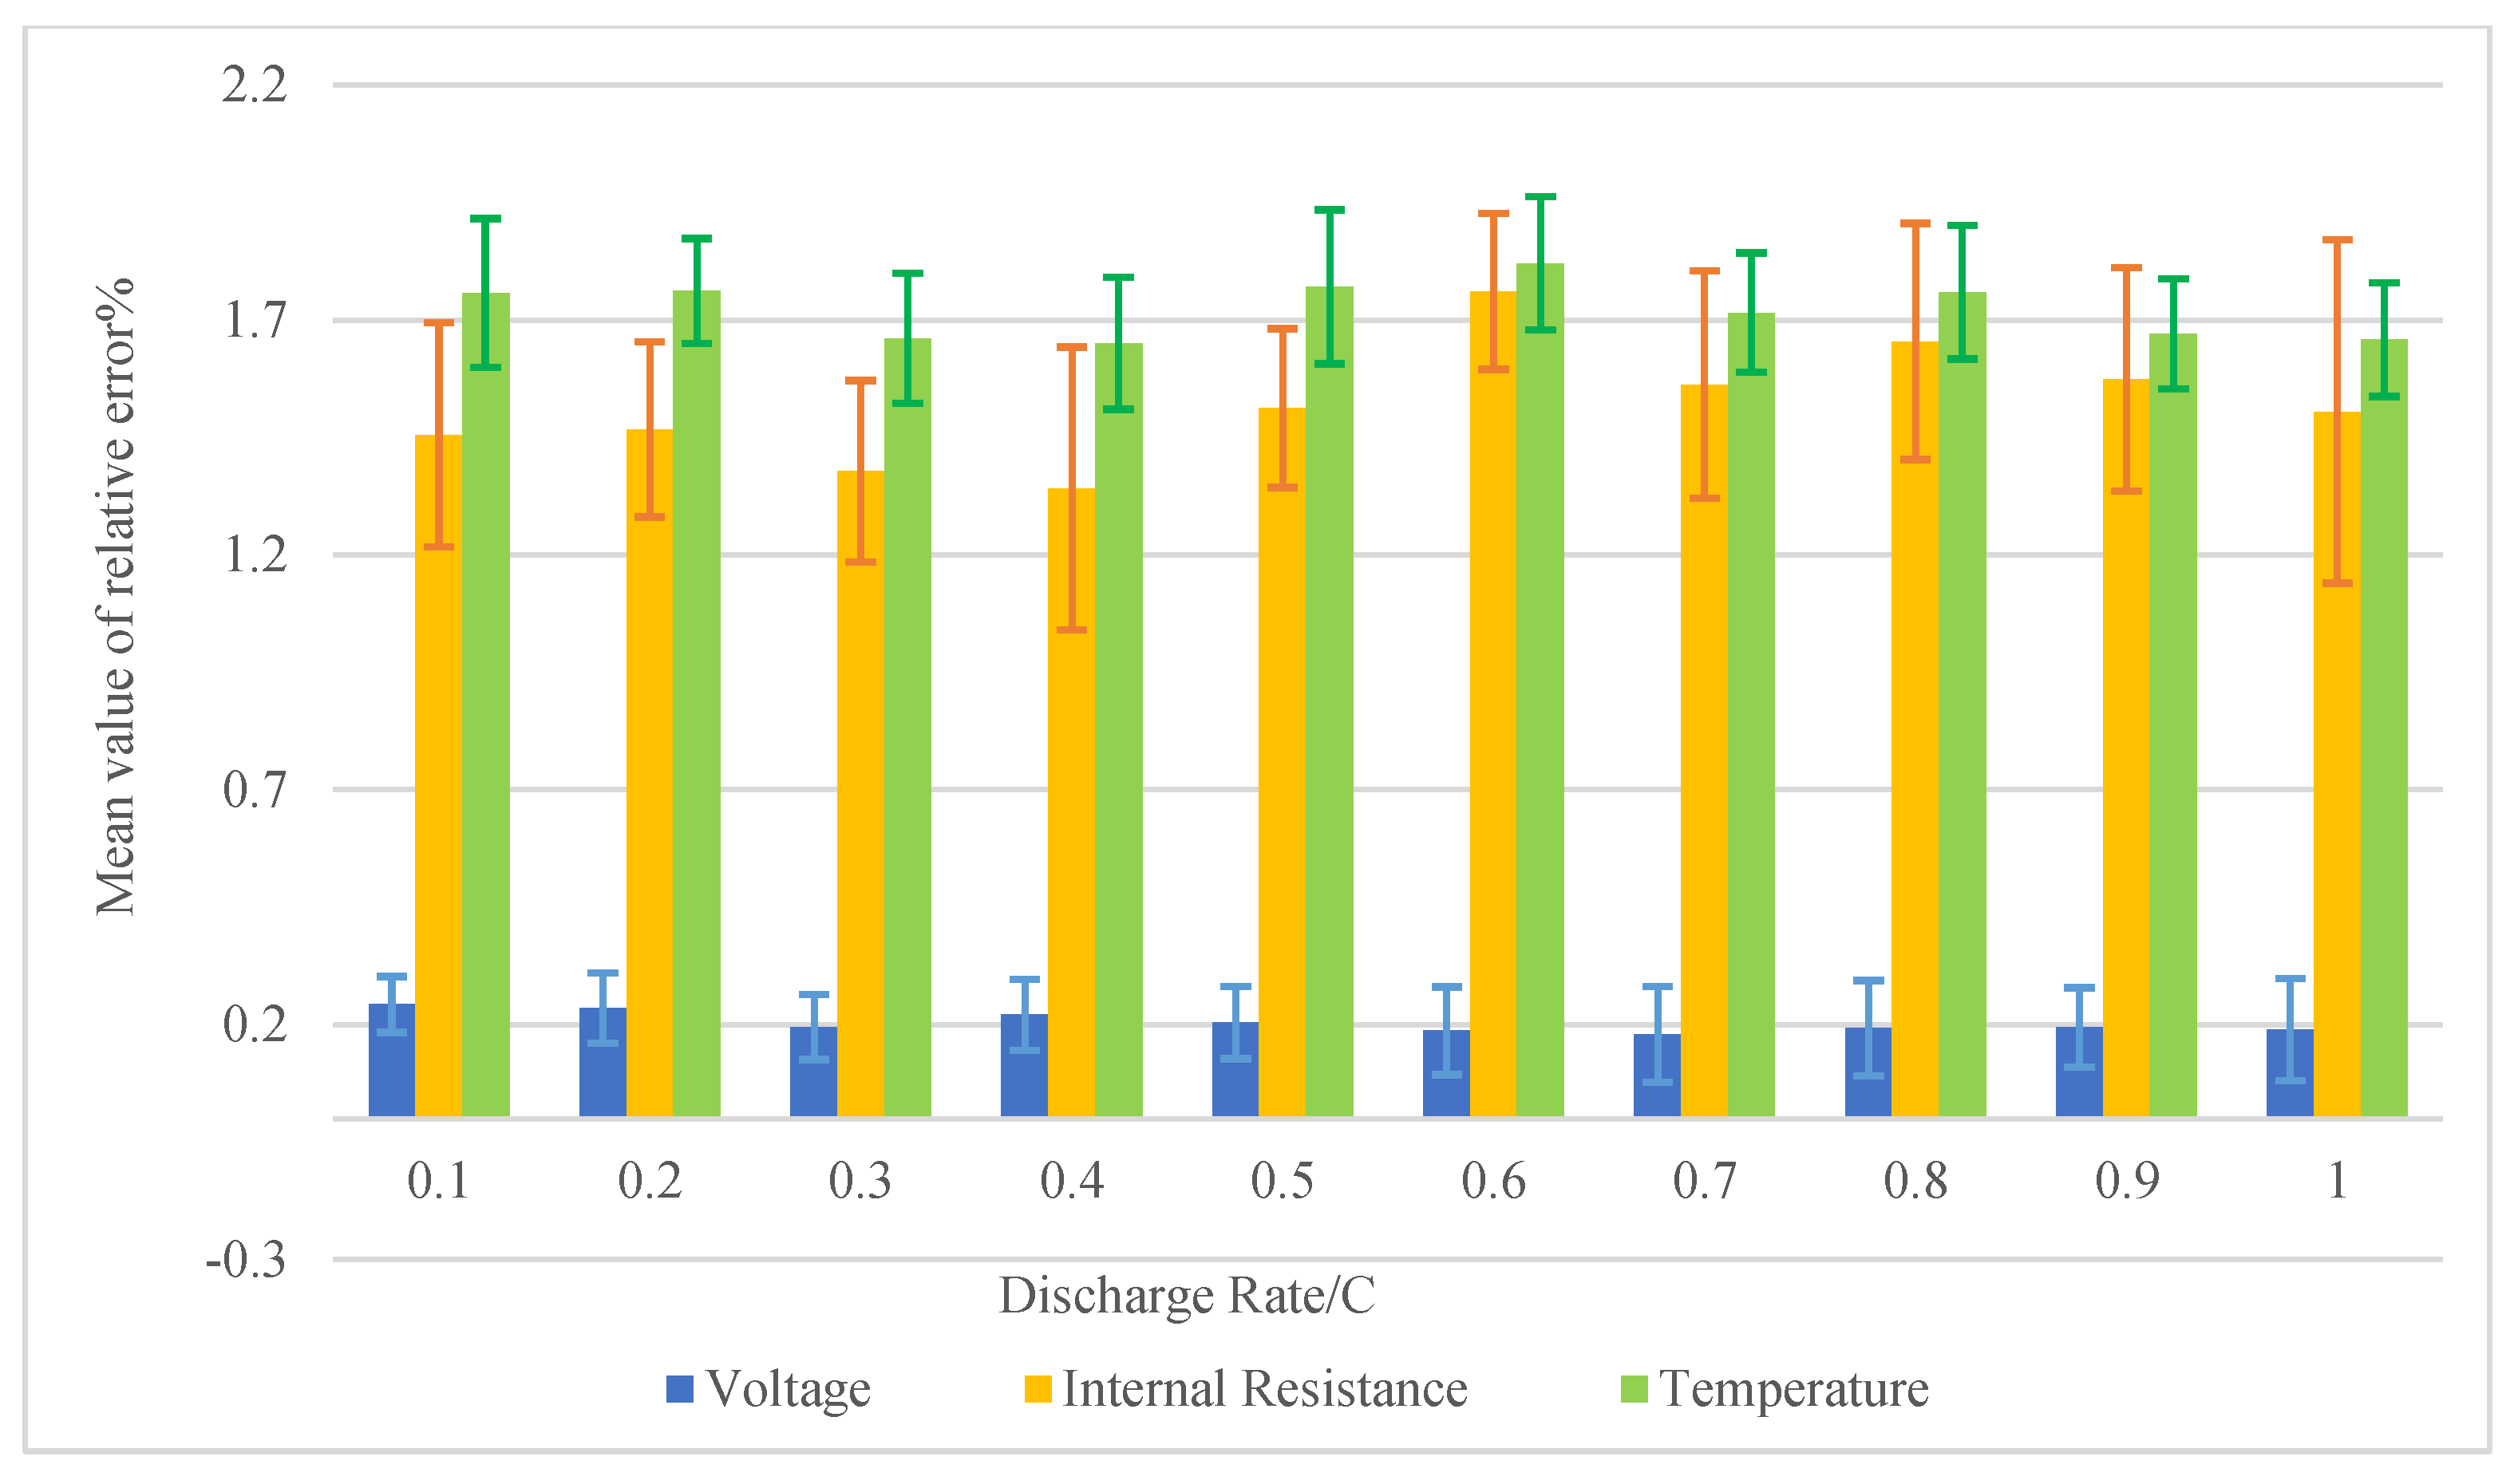
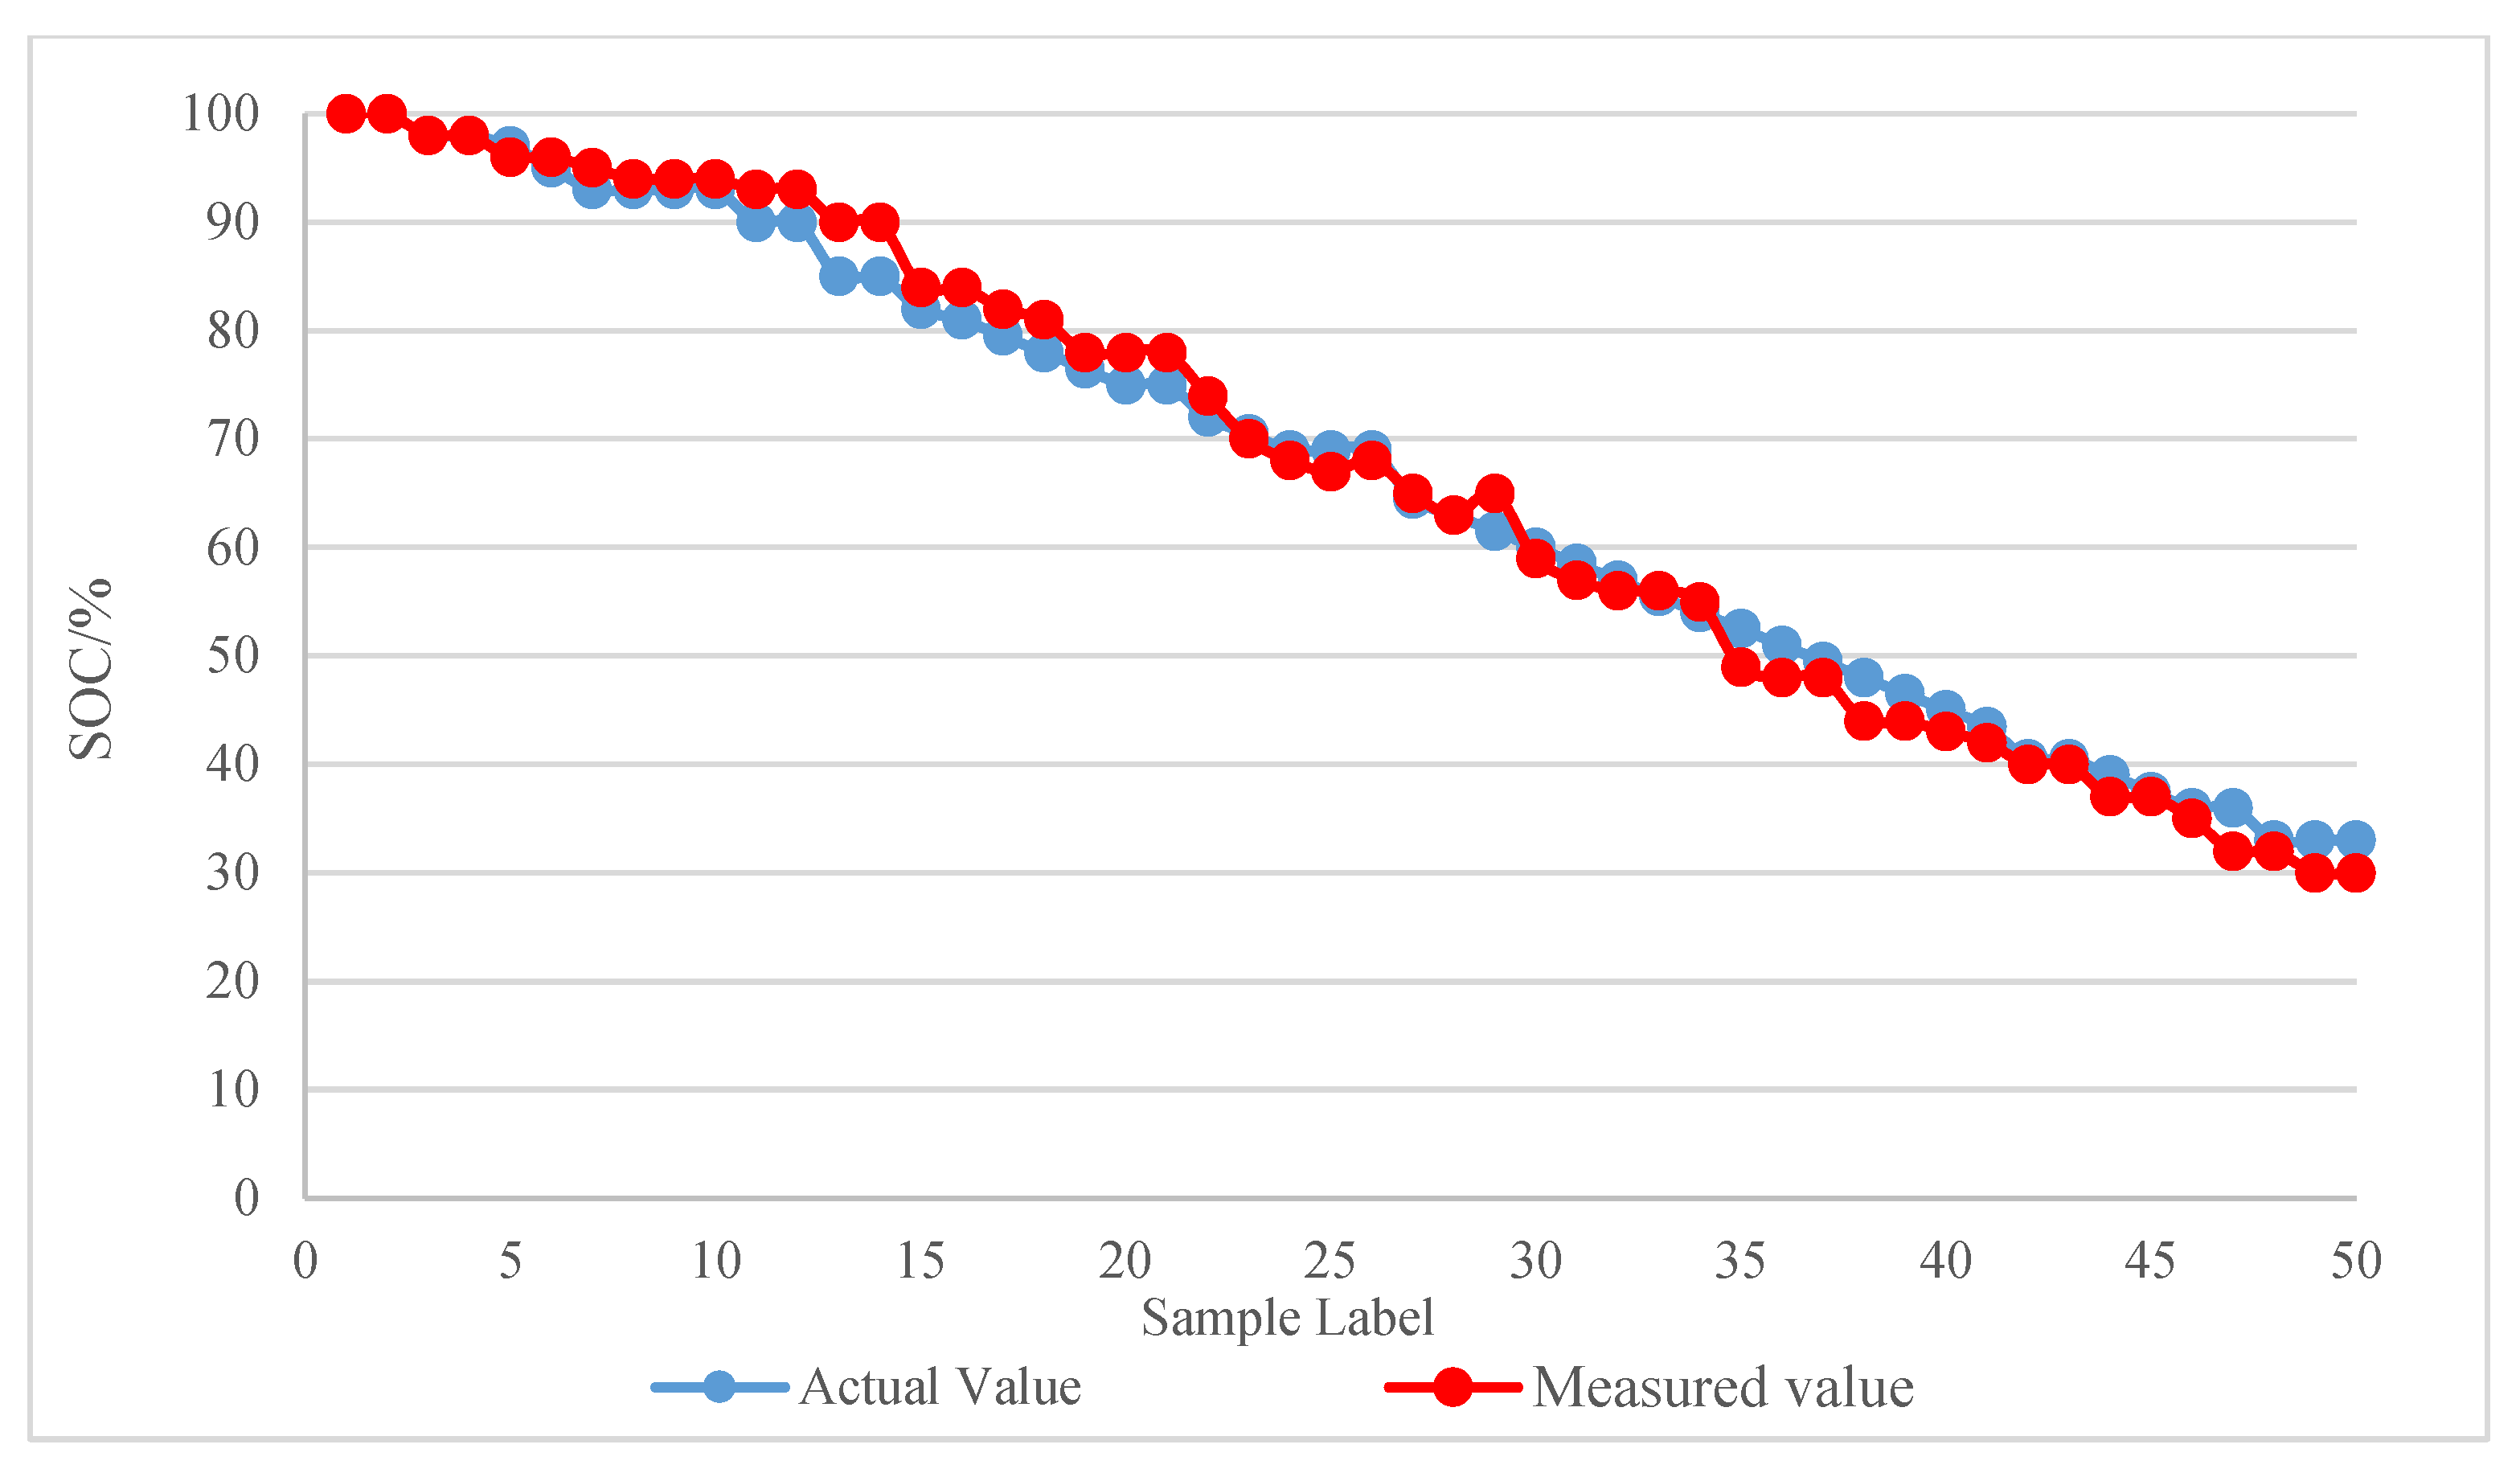
3. Results and Discussion
4. Conclusions
Author Contributions
Funding
Acknowledgments
Conflicts of Interest
References
- Hsiao, T.C.; Chen, T.L.; Liu, C.H.; Lee, C.M.; Yu, H.C.; Chen, T.S. Quality control of lead-acid battery according to its condition test for ups supplier and manufacturers. Math. Probl. Eng. 2014, 2014, 1–10. [Google Scholar] [CrossRef]
- Hariprakash, B.; Martha, S.K.; Ambalavanan, S.; Gaffoor, S.A.; Shukla, A.K. Comparative study of lead-acid batteries for photovoltaic stand-alone lighting systems. J. Appl. Electrochem. 2008, 38, 77–82. [Google Scholar] [CrossRef]
- Stamatescu, G.; Stamatescu, I.; Arghira, N.; Fagarasan, I.; Iliescu, S.S. Embedded networked monitoring and control for renewable energy storage systems. In Proceedings of the 2014 International Conference on Development and Application Systems (DAS), Suceava, Romania, 15–17 May 2014; pp. 1–6. [Google Scholar]
- Carpio, J.N.; Nalunat, J.C.; Tolentino, E.V.N.; Carlos, K.M.R.; Castaneda, C.I.; Catajay, D.G.; Maguddatu, I.J.S.; Rodriguez, R.H.R.; Jose, E.M.L.S. Real-Time Monitoring Device for Car Battery with Remote Switching Capability Via Mobile Application. In Proceedings of the 2019 34th International Technical Conference on Circuits/Systems, Computers and Communications (ITC-CSCC), JeJu, Korea, 23–26 June 2019; pp. 1–4. [Google Scholar]
- Lan, C.; Su, J. The Design of Online Monitoring System of VRLA Battery. In Proceedings of the 2013 International Conference on Computational and Information Sciences, Shiyan, China, 21–23 June 2013; pp. 1261–1264. [Google Scholar]
- Luo, M.; Xiao, Y.; Sun, W.M.; Wang, Z.M. Online Battery Monitoring System Based on GPRS for Electric Vehicles. In Proceedings of the 2013 5th International Conference on Intelligent Human-Machine Systems and Cybernetics, Hangzhou, China, 26–27 August 2013; pp. 122–125. [Google Scholar]
- Friansa, K.; Haq, I.N.; Santi, B.M.; Kurniadi, D.; Leksono, E.; Yuliarto, B. Development of Battery Monitoring System in Smart Microgrid Based on Internet of Things (IoT). Procedia Eng. 2017, 170, 482–487. [Google Scholar] [CrossRef]
- Schneider, M.; Ilgin, S.; Jegenhorst, N.; Kube, R.; Vollmer, J. Automotive battery monitoring by wireless cell sensors. In Proceedings of the 2012 IEEE International Instrumentation and Measurement Technology Conference Proceedings, Graz, Austria, 13–16 May 2012; pp. 816–820. [Google Scholar]
- Rauniyar, A.; Irfan, M.; Saputra, O.D.; Kim, J.W.; Lee, A.R.; Jang, J.M.; Shin, S.Y. Design and Development of a Real-Time Monitoring System for Multiple Lead–Acid Batteries Based on Internet of Things. Future Internet 2017, 9, 28. [Google Scholar] [CrossRef]
- Shell, C.; Henderson, J.; Verra, H.; Dyer, J. Implementation of a wireless battery management system (WBMS). In Proceedings of the 2015 IEEE International Instrumentation and Measurement Technology Conference (I2MTC), Pisa, Italy, 11–14 May 2015; pp. 1954–1959. [Google Scholar]
- Xia, Z.; Su, H.; Liu, T. Remote Monitoring System of Lead-Acid Battery Group Based on GPRS. In Proceedings of the 2010 International Conference on Electrical and Control Engineering, Wuhan, China, 25–27 June 2010; pp. 4023–4026. [Google Scholar]
- Yang, P.; Yu, H.Y.; Yan, Y.G. Implementation of the Li-Ion Battery Management System Based on DS2438. Appl. Mech. Mater. 2015, 733, 714–717. [Google Scholar] [CrossRef]
- Xiong, R.; Cao, J.; Yu, Q.; He, H.; Sun, F. Critical review on the battery state of charge estimation methods for electric vehicles. IEEE Access 2018, 6, 1832–1843. [Google Scholar] [CrossRef]
- Aggoun, G.; Mansouri, R.; Abdeslam, D.O. SOC estimation based on OCV and online identification parameters of lithium ion batteries with ADALINE. In Proceedings of the 2016 8th International Conference on Modelling, Identification and Control (ICMIC), Algiers, Algeria, 15–17 November 2016; pp. 538–543. [Google Scholar]
- Chiasson, J.; Vairamohan, B. Estimating the state of charge of a battery. IEEE Trans. Control Syst. Technol. 2005, 13, 465–470. [Google Scholar] [CrossRef]
- Soomro, A.; Xiang, W.; Samo, K.A.; Chen, S.; Ma, S. Development of a simplified method for the determination of ampere-hour capacity of lead–acid battery. Energy Environ. 2017, 29, 147–161. [Google Scholar] [CrossRef]
- Sedighfar, A.; Moniri, M.R. Battery state of charge and state of health estimation for VRLA batteries using Kalman filter and neural networks. In Proceedings of the 2018 5th International Conference on Electrical and Electronic Engineering (ICEEE), Istanbul, Turkey, 3–5 May 2018; pp. 41–46. [Google Scholar]
- Yan, X.; Yang, Y.; Guo, Q.; Zhang, H.; Qu, W. Electric vehicle battery SOC estimation based on fuzzy Kalman filter. In Proceedings of the 2013 2nd International Symposium on Instrumentation and Measurement, Sensor Network and Automation (IMSNA), Toronto, ON, Canada, 23–24 December 2013; pp. 863–866. [Google Scholar]
- Li, J.; Ye, M.; Jiao, S.; Shi, D.; Xu, X. State Estimation of Lithium Battery Based on Least Squares Support Vector Machine. DEStech Trans. Environ. Energy Earth Sci. 2019. [Google Scholar] [CrossRef]
- Ramadan, H.S.; Becherif, M.; Claude, F. Extended kalman filter for accurate state of charge estimation of lithium-based batteries: A comparative analysis. Int. J. Hydrog. Energy 2017, 42, 29033–29046. [Google Scholar] [CrossRef]
- Tran, N.-T.; Khan, A.B.; Choi, W. State of Charge and State of Health Estimation of AGM VRLA Batteries by Employing a Dual Extended Kalman Filter and an ARX Model for Online Parameter Estimation. Energies 2017, 10, 137. [Google Scholar] [CrossRef]
- Majchrzycki, W.; Jankowska, E.; Baraniak, M.; Handzlik, P.; Samborski, R. Electrochemical Impedance Spectroscopy and Determination of the Internal Resistance as a Way to Estimate Lead-Acid Batteries Condition. Batteries 2018, 4, 70. [Google Scholar] [CrossRef]
- Meng, J.; Stroe, D.; Ricco, M.; Luo, G.; Teodorescu, R. A Simplified Model-Based State-of-Charge Estimation Approach for Lithium-Ion Battery with Dynamic Linear Model. IEEE Trans. Ind. Electronics 2019, 66, 7717–7727. [Google Scholar] [CrossRef]
- Meng, J.; Ricco, M.; Acharya, A.B.; Luo, G.; Swierczynski, M.J.; Stroe, D.; Teodorescu, R. Low-complexity online estimation for LiFePO4 battery state of charge in electric vehicles. J. Power Sources 2018, 395, 280–288. [Google Scholar] [CrossRef]
- Meng, J.; Luo, G.; Ricco, M.; Swierczynski, M.J.; Stroe, D.; Teodorescu, R. Overview of Lithium-Ion Battery Modeling Methods for State-of-Charge Estimation in Electrical Vehicles. Appl. Sci. 2018, 8, 659. [Google Scholar] [CrossRef]
- Lin, J.; Liu, C. A monitoring system based on wireless sensor network and an SoC platform in precision agriculture. In Proceedings of the International Conference on Communication Technology, Hangzhou, China, 10–12 November 2008; pp. 101–104. [Google Scholar]
- Tirelli, P.; Borghese, N.A.; Pedersini, F.; Galassi, G.; Oberti, R. Automatic monitoring of pest insects traps by Zigbee-based wireless networking of image sensors. In Proceedings of the Instrumentation and Measurement Technology Conference, Binjiang, China, 10–12 May 2011; pp. 1–5. [Google Scholar]
- Gutierrez, J.; Villamedina, J.F.; Nietogaribay, A.; Portagandara, M.A. Automated Irrigation System Using a Wireless Sensor Network and GPRS Module. IEEE Trans. Instrum. Meas. 2014, 63, 166–176. [Google Scholar] [CrossRef]
- Zhao, S.; Wu, F.; Yang, L.; Gao, L.; Burke, A. A measurement method for determination of dc internal resistance of batteries and supercapacitors. Electrochem. Commun. 2010, 12, 242–245. [Google Scholar] [CrossRef]
- Nakajo, K.; Kumarasinghe, S.; Shimamura, Y.; Takahashi, S.; Motegi, K.; Shiraishi, Y. On-line measurement system for internal resistance in lead acid battery. In Proceedings of the 2016 55th Annual Conference of the Society of Instrument and Control Engineers of Japan (SICE), Tsukuba, Japan, 20–23 September 2016; pp. 103–108. [Google Scholar]
- Sun, Y.; Jou, H.; Wu, J. Auxiliary diagnosis method for lead–acid battery health based on sample entropy. Energy Convers. Manag. 2009, 50, 2250–2256. [Google Scholar] [CrossRef]
- Albers, J. Heat tolerance of automotive lead-acid batteries. J. Power Sources 2009, 190, 162–172. [Google Scholar] [CrossRef]
- Electronic, G. BMM. Available online: http://www.china-gold.com/pro13/1.html (accessed on 8 June 2020).
- Huawei. Huawei iBattery Solution Brochure. Available online: https://e.huawei.com/en/material/networkenergy/dcenergy/ae357055692c46f2a0682a65f1169588 (accessed on 8 June 2020).


| 0 | 1.00 | 180 | 1.02 |
| 20 | 1.06 | 200 | 1.01 |
| 40 | 1.08 | 220 | 1.00 |
| 60 | 1.07 | 240 | 0.99 |
| 80 | 1.06 | 260 | 0.98 |
| 100 | 1.05 | 280 | 0.97 |
| 120 | 1.05 | 300 | 0.95 |
| 140 | 1.04 | 400 | 0.87 |
| 160 | 1.03 | 500 | 0.83 |
| BMM Gold Electronic [33] | iBattery Huawei [34] | Proposed System | |
|---|---|---|---|
| Parameters | Voltage (<0.2%) | Voltage (<0.5%) | Voltage (<0.35%) |
| Current (<1%) | Current (<1%) | Current (<1%) | |
| Temperature (±0.5 °C) | Temperature (±0.5 °C) | Temperature (±0.5 °C) | |
| Internal Resistance (<2.5%) | Internal Resistance (<2%) | Internal Resistance (<2%) | |
| SOC (<5%) | SOC (<10%) | SOC (<5%) | |
| Communication Mode | RS485 | Zigbee | Zigbee/GPRS |
| Wire | Complex | Simple | Simple |
| Real-Time | Yes | Yes | Always Yes |
| Remote Monitor | No | No | Yes |
| Integration | Low | Low | High |
© 2020 by the authors. Licensee MDPI, Basel, Switzerland. This article is an open access article distributed under the terms and conditions of the Creative Commons Attribution (CC BY) license (http://creativecommons.org/licenses/by/4.0/).
Share and Cite
Lu, R.; Lu, J.; Liu, P.; He, M.; Liu, J. Design of the VRLA Battery Real-Time Monitoring System Based on Wireless Communication. Sensors 2020, 20, 4350. https://doi.org/10.3390/s20154350
Lu R, Lu J, Liu P, He M, Liu J. Design of the VRLA Battery Real-Time Monitoring System Based on Wireless Communication. Sensors. 2020; 20(15):4350. https://doi.org/10.3390/s20154350
Chicago/Turabian StyleLu, Rui, Jiwu Lu, Ping Liu, Min He, and Jiangwei Liu. 2020. "Design of the VRLA Battery Real-Time Monitoring System Based on Wireless Communication" Sensors 20, no. 15: 4350. https://doi.org/10.3390/s20154350
APA StyleLu, R., Lu, J., Liu, P., He, M., & Liu, J. (2020). Design of the VRLA Battery Real-Time Monitoring System Based on Wireless Communication. Sensors, 20(15), 4350. https://doi.org/10.3390/s20154350