Figure 1.
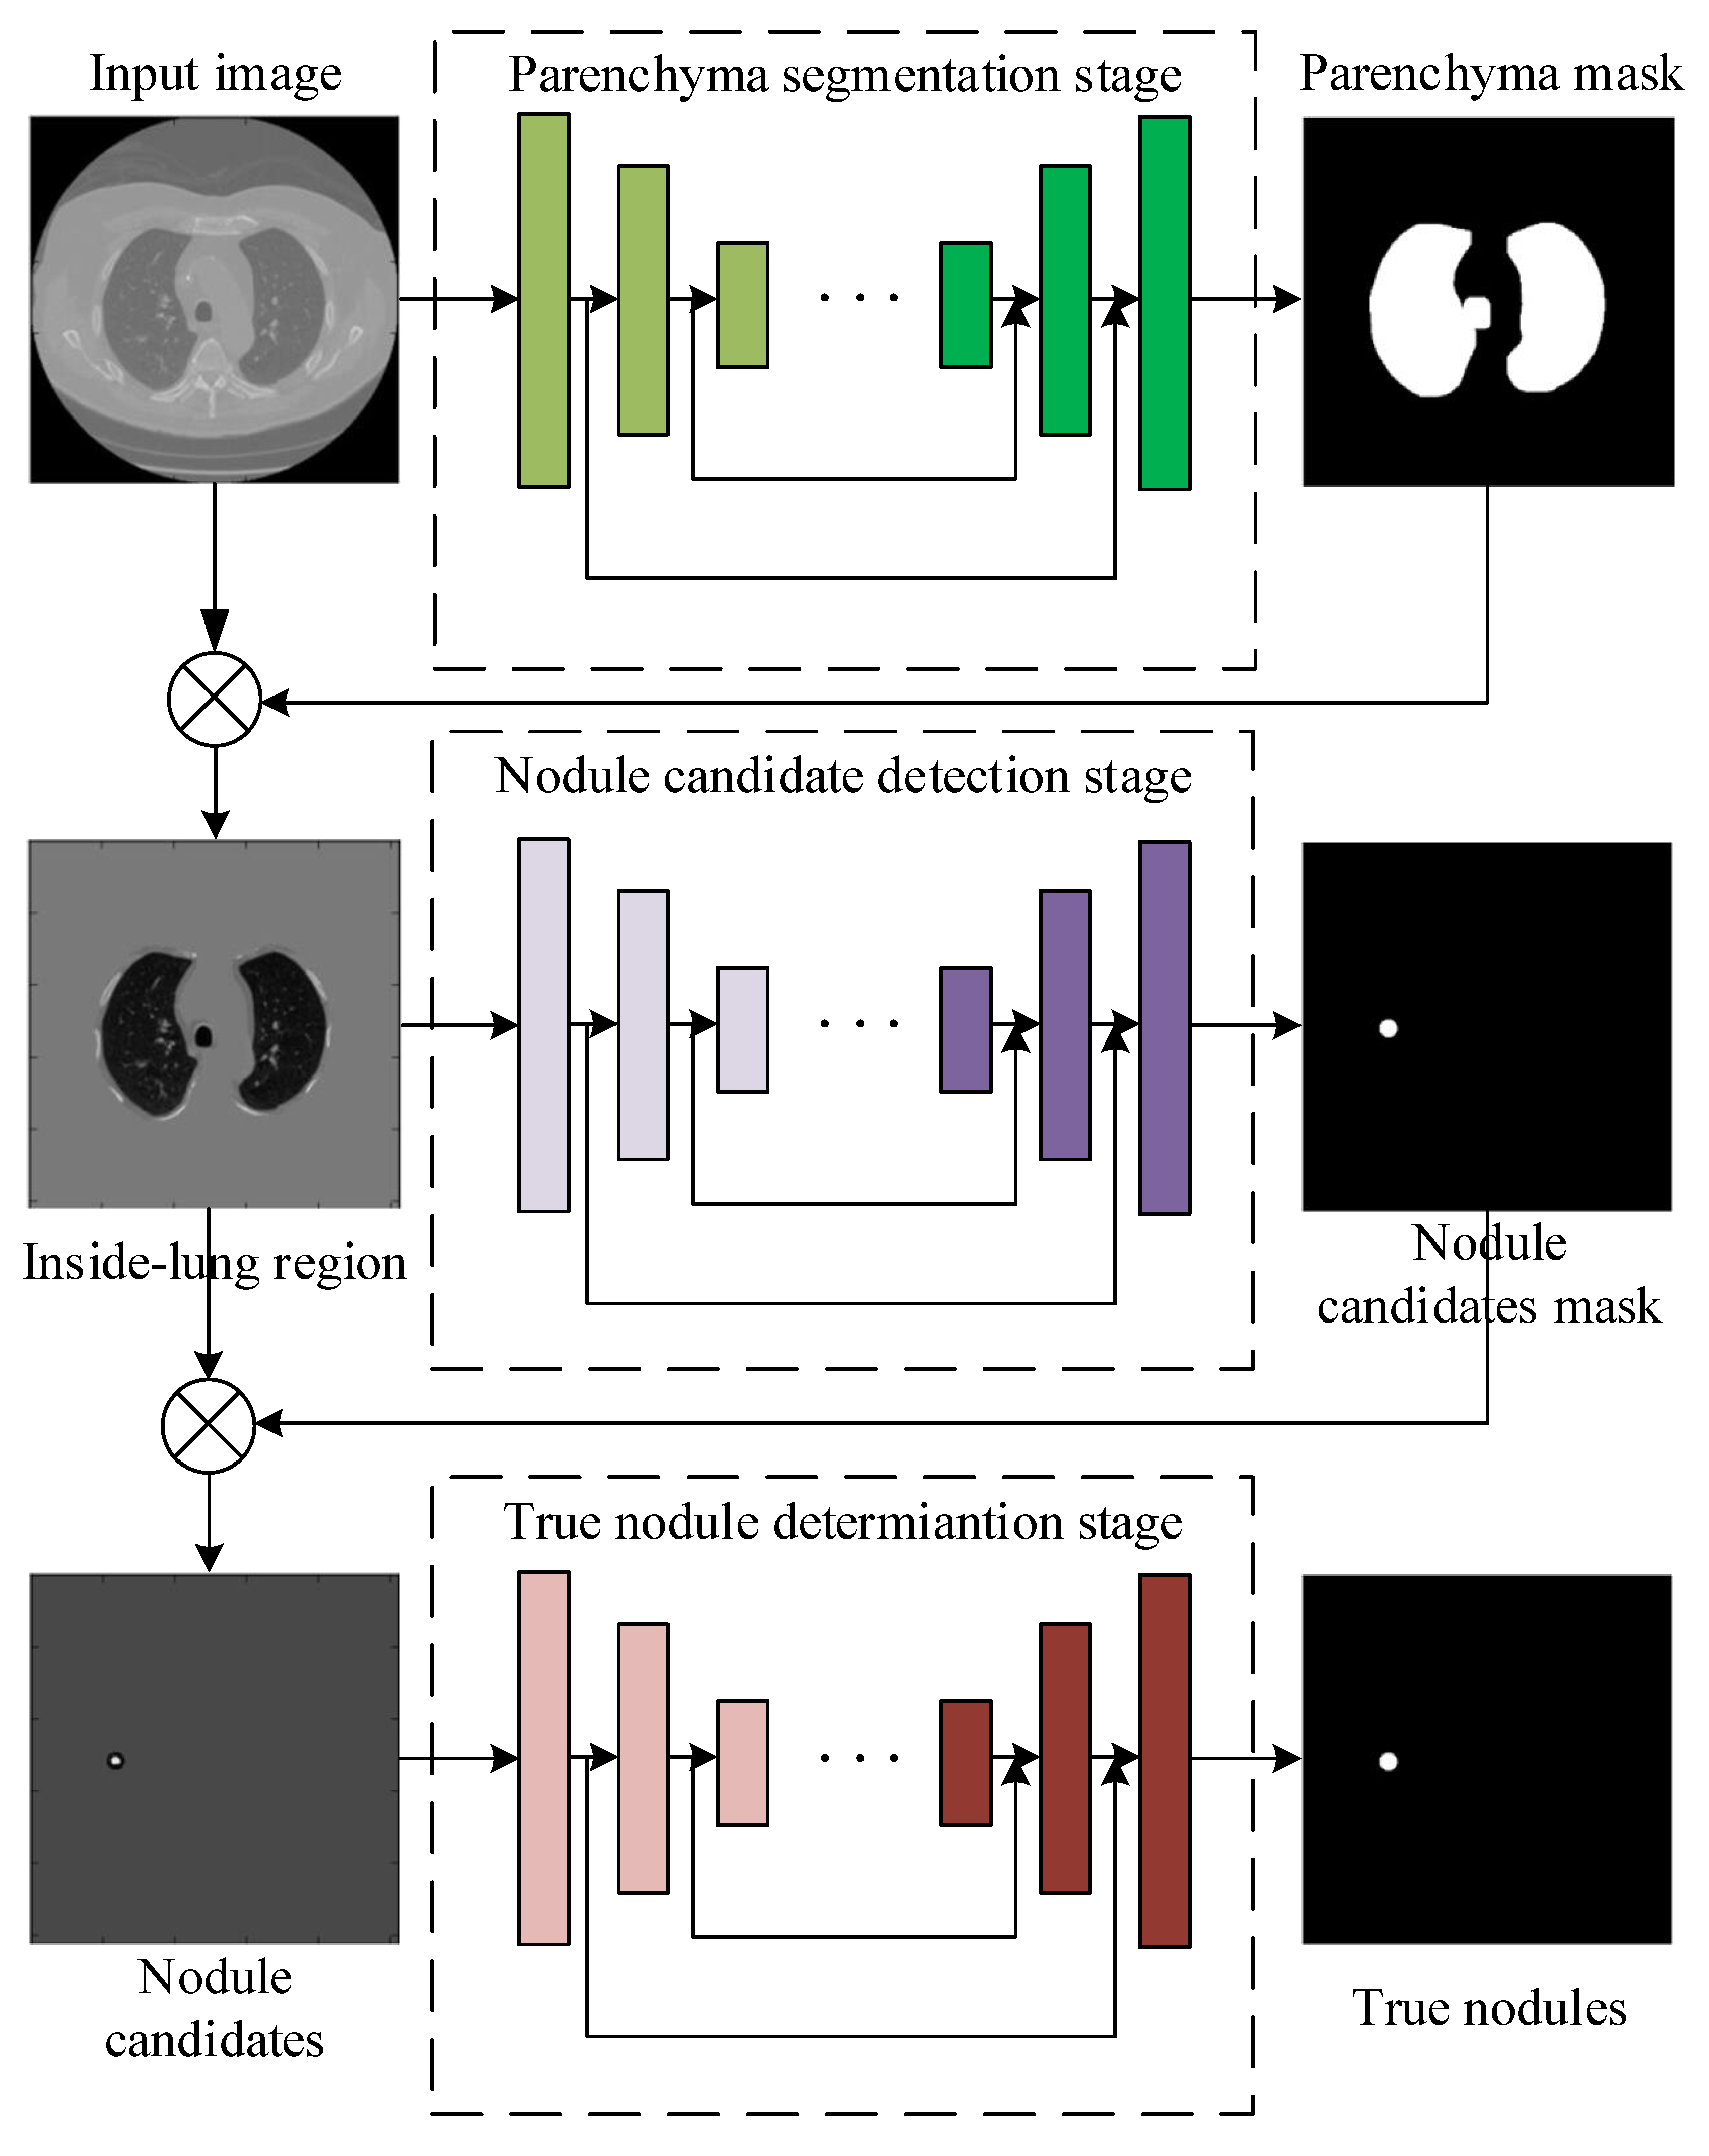
The framework of the proposed pulmonary nodule detection method by cascading three sub-networks for lung parenchyma segmentation, nodule candidate detection and true nodule determination.
Figure 1.
The framework of the proposed pulmonary nodule detection method by cascading three sub-networks for lung parenchyma segmentation, nodule candidate detection and true nodule determination.
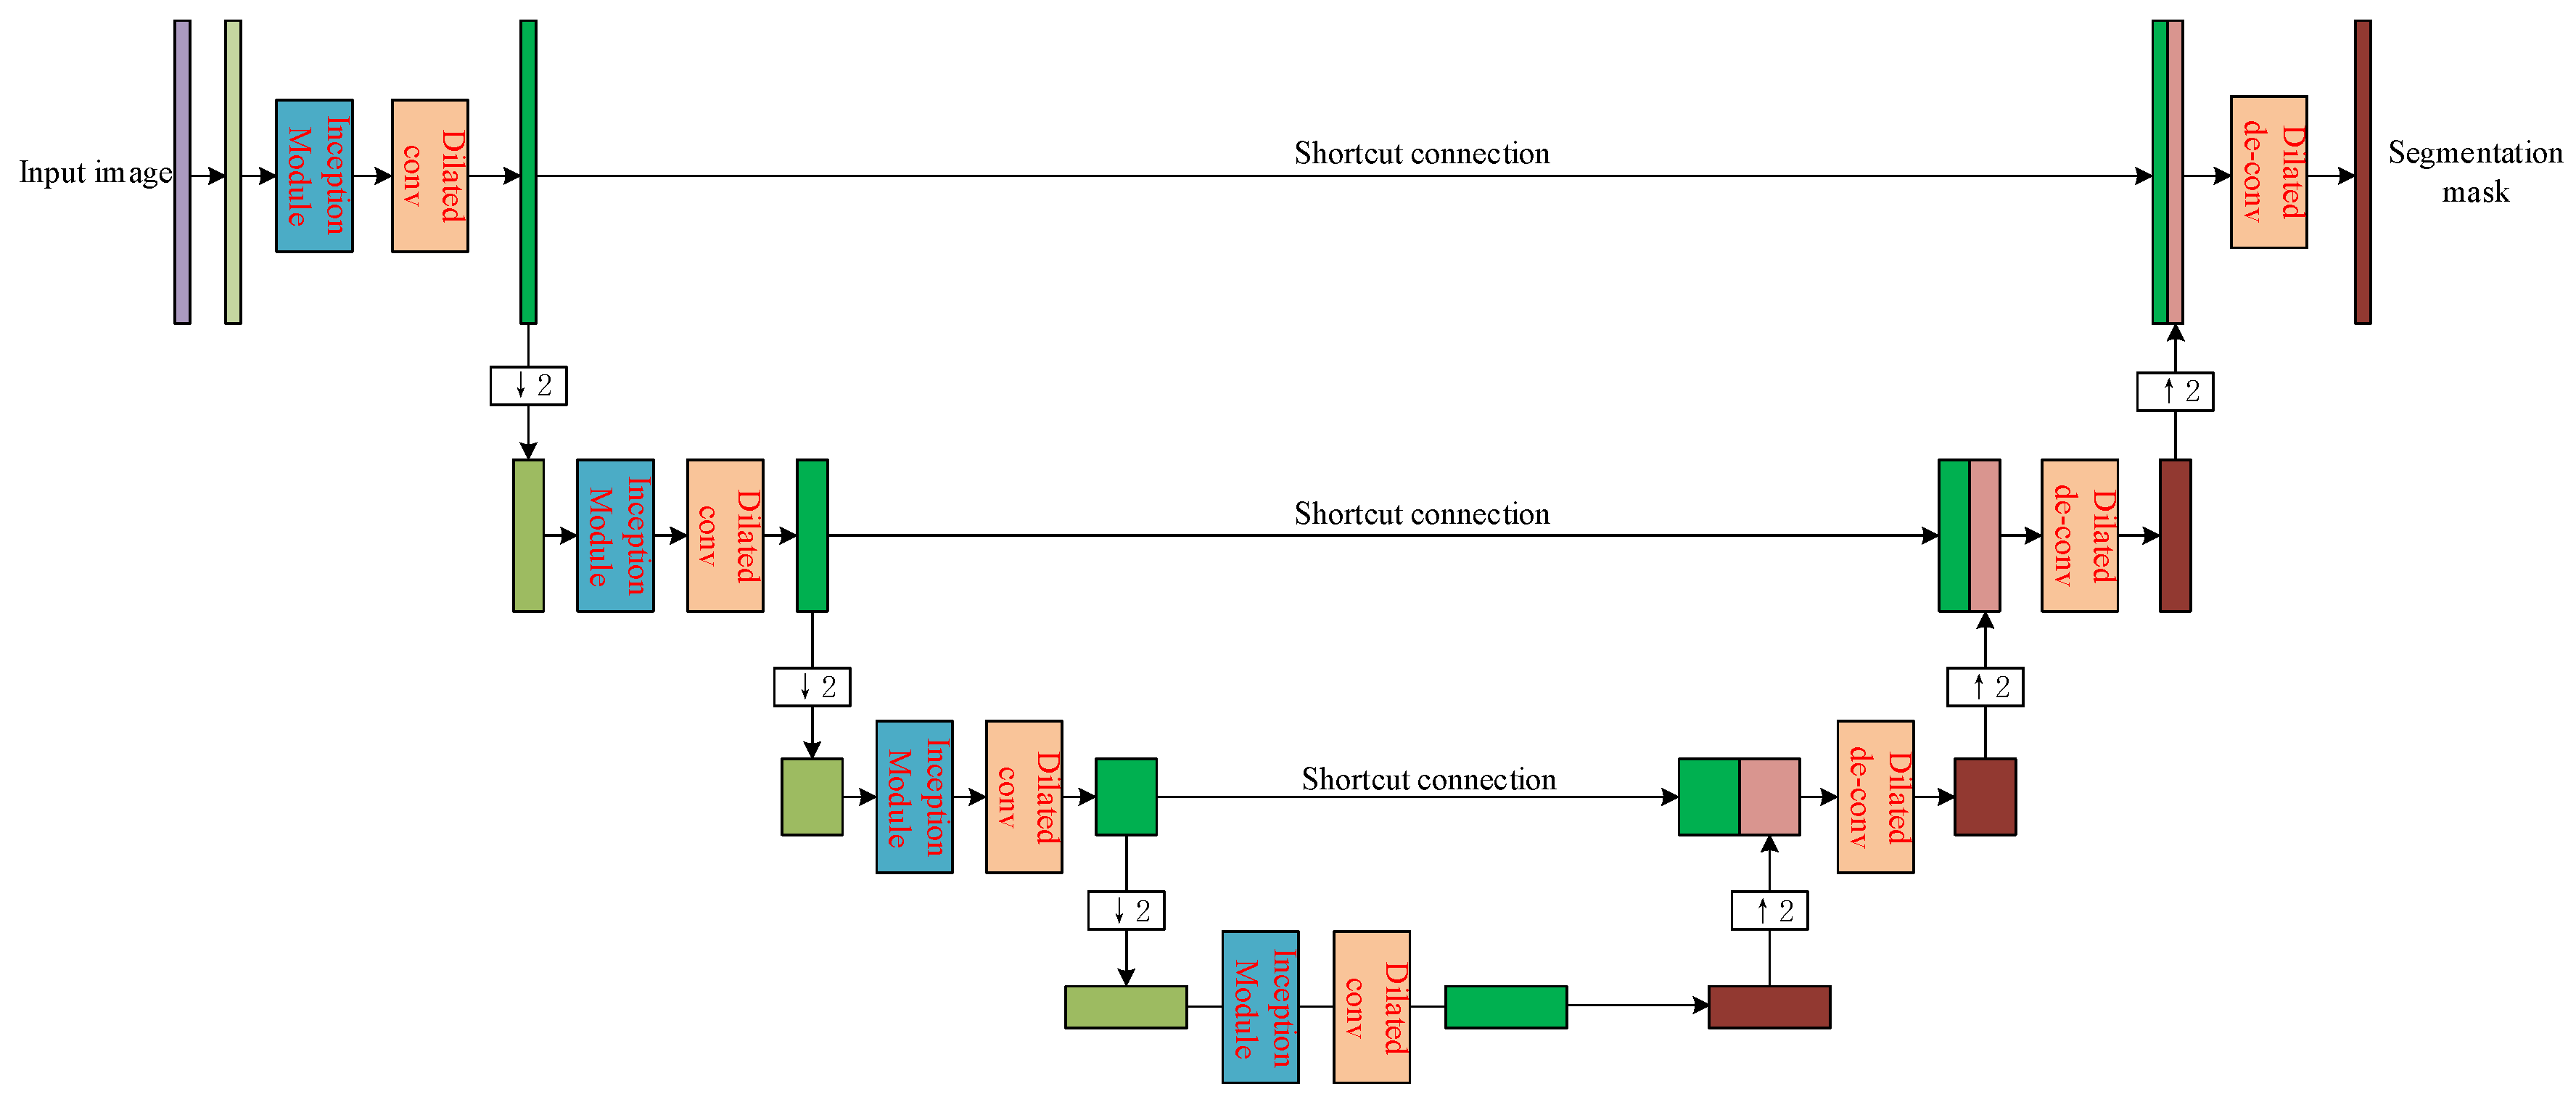
Figure 2.
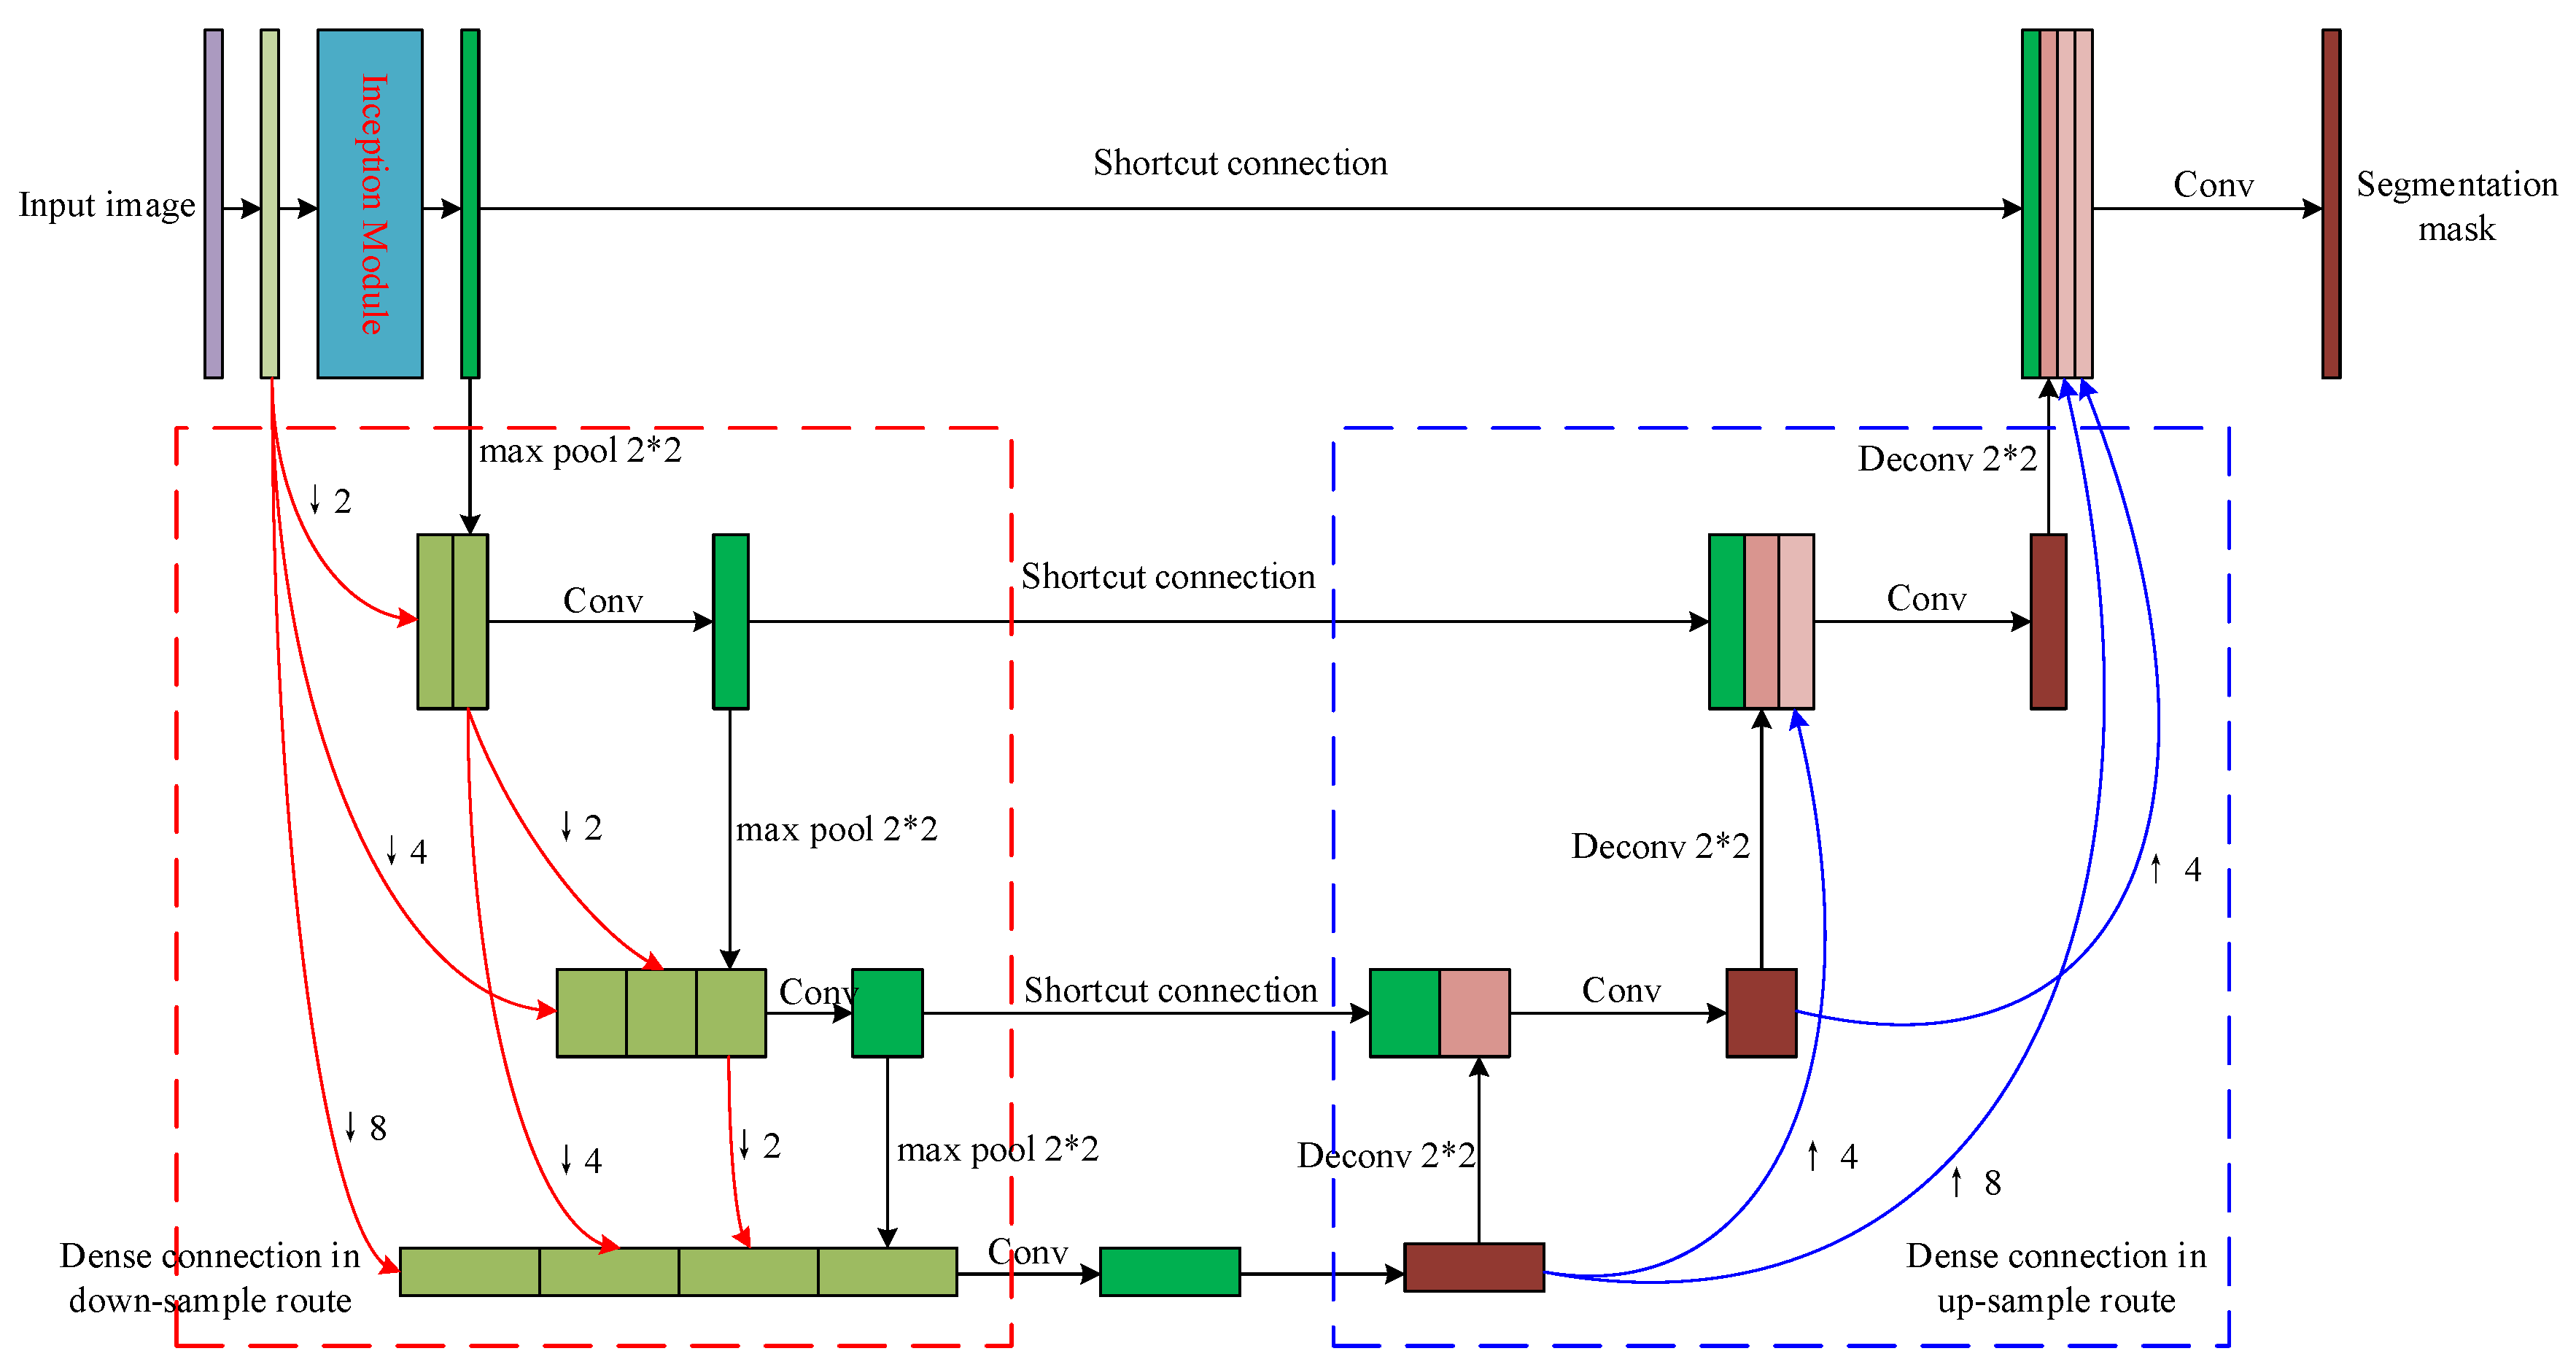
The structure of the proposed sub-network for lung parenchyma segmentation.
Figure 2.
The structure of the proposed sub-network for lung parenchyma segmentation.
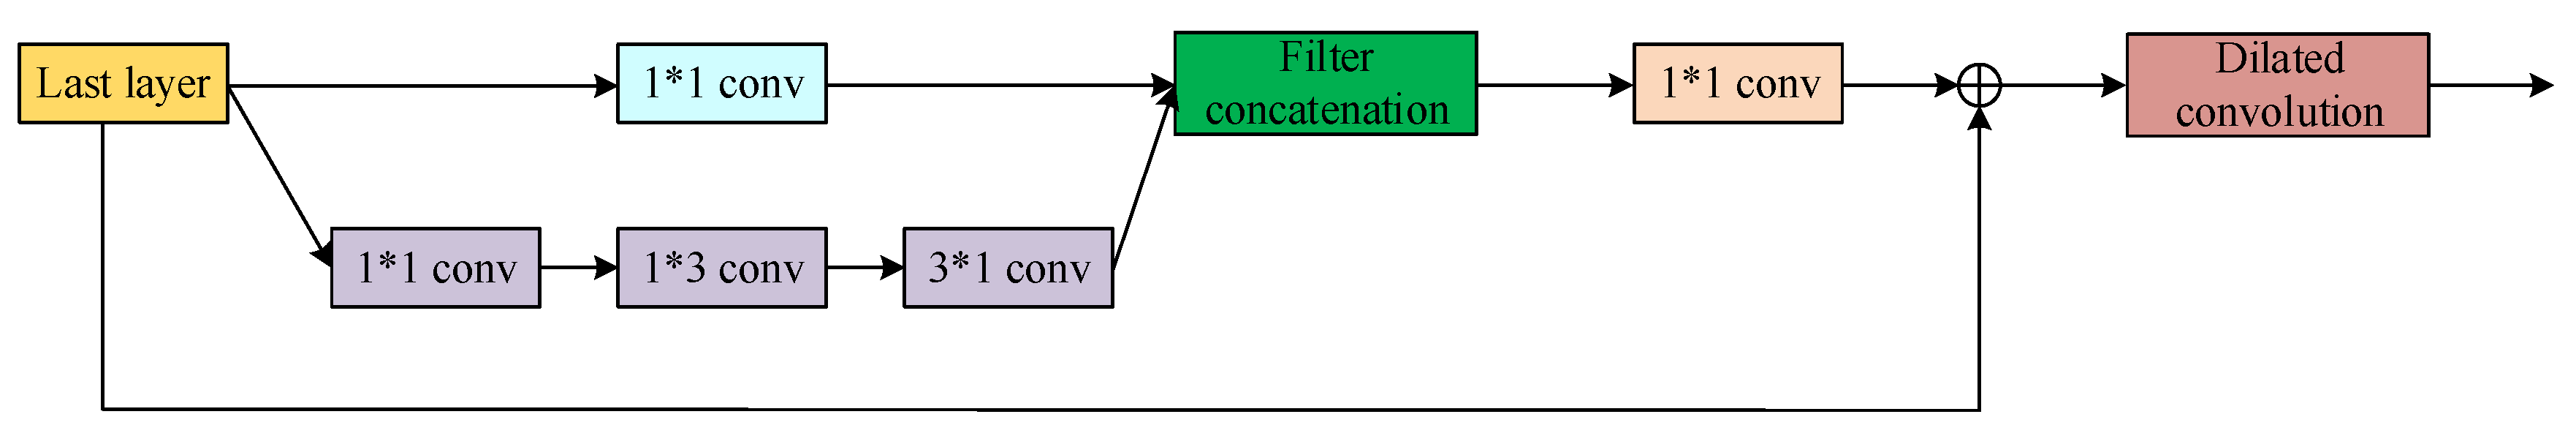
Figure 3.
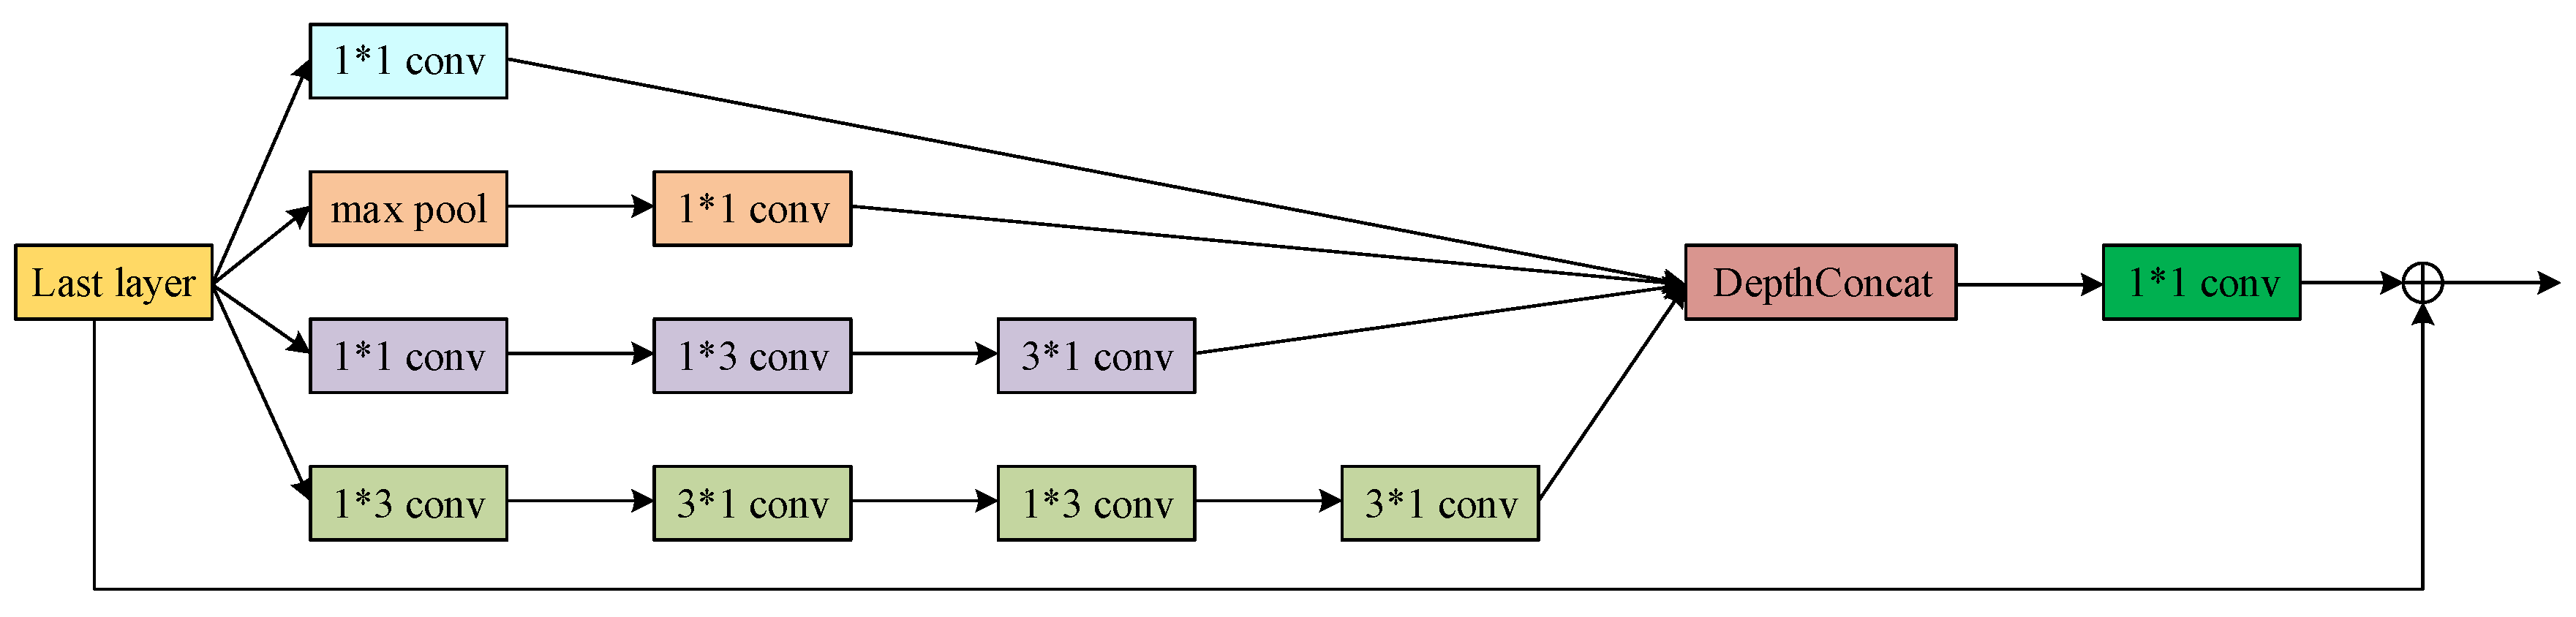
The modified inception module used in the proposed lung parenchyma segmentation sub-network.
Figure 3.
The modified inception module used in the proposed lung parenchyma segmentation sub-network.
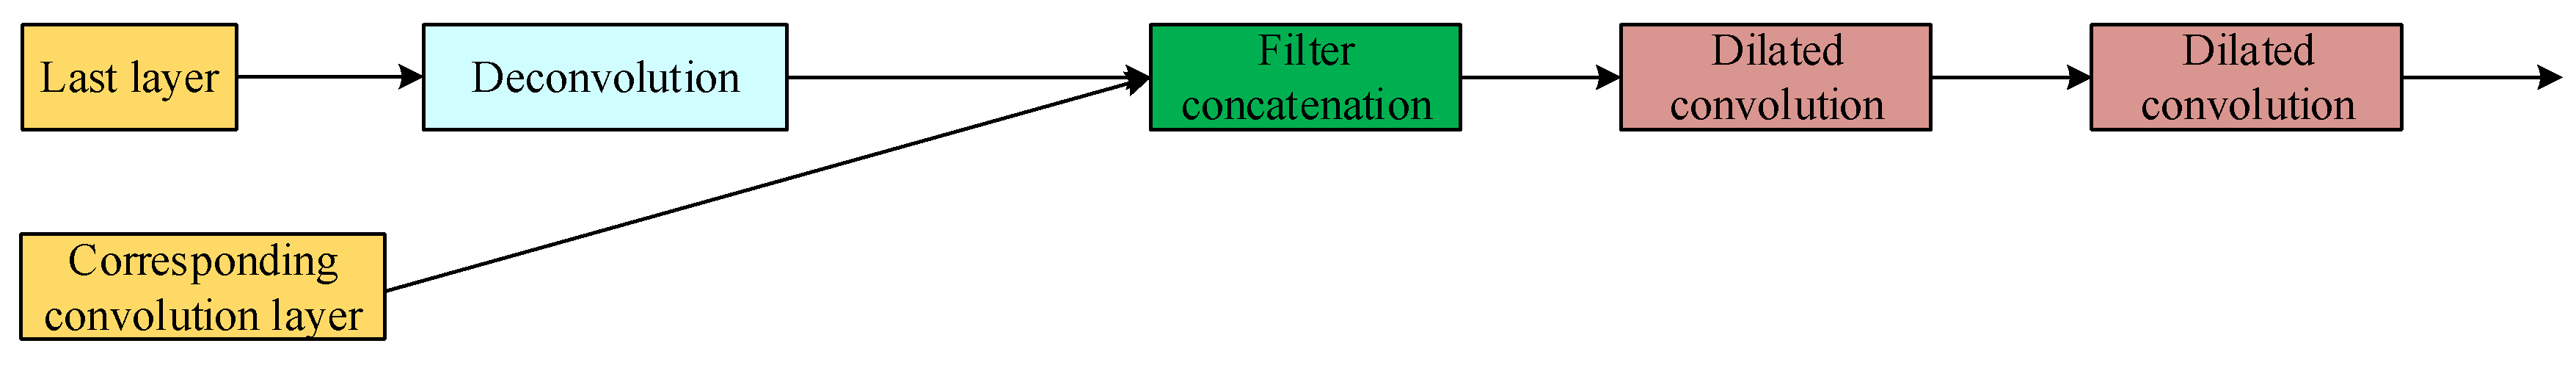
Figure 4.
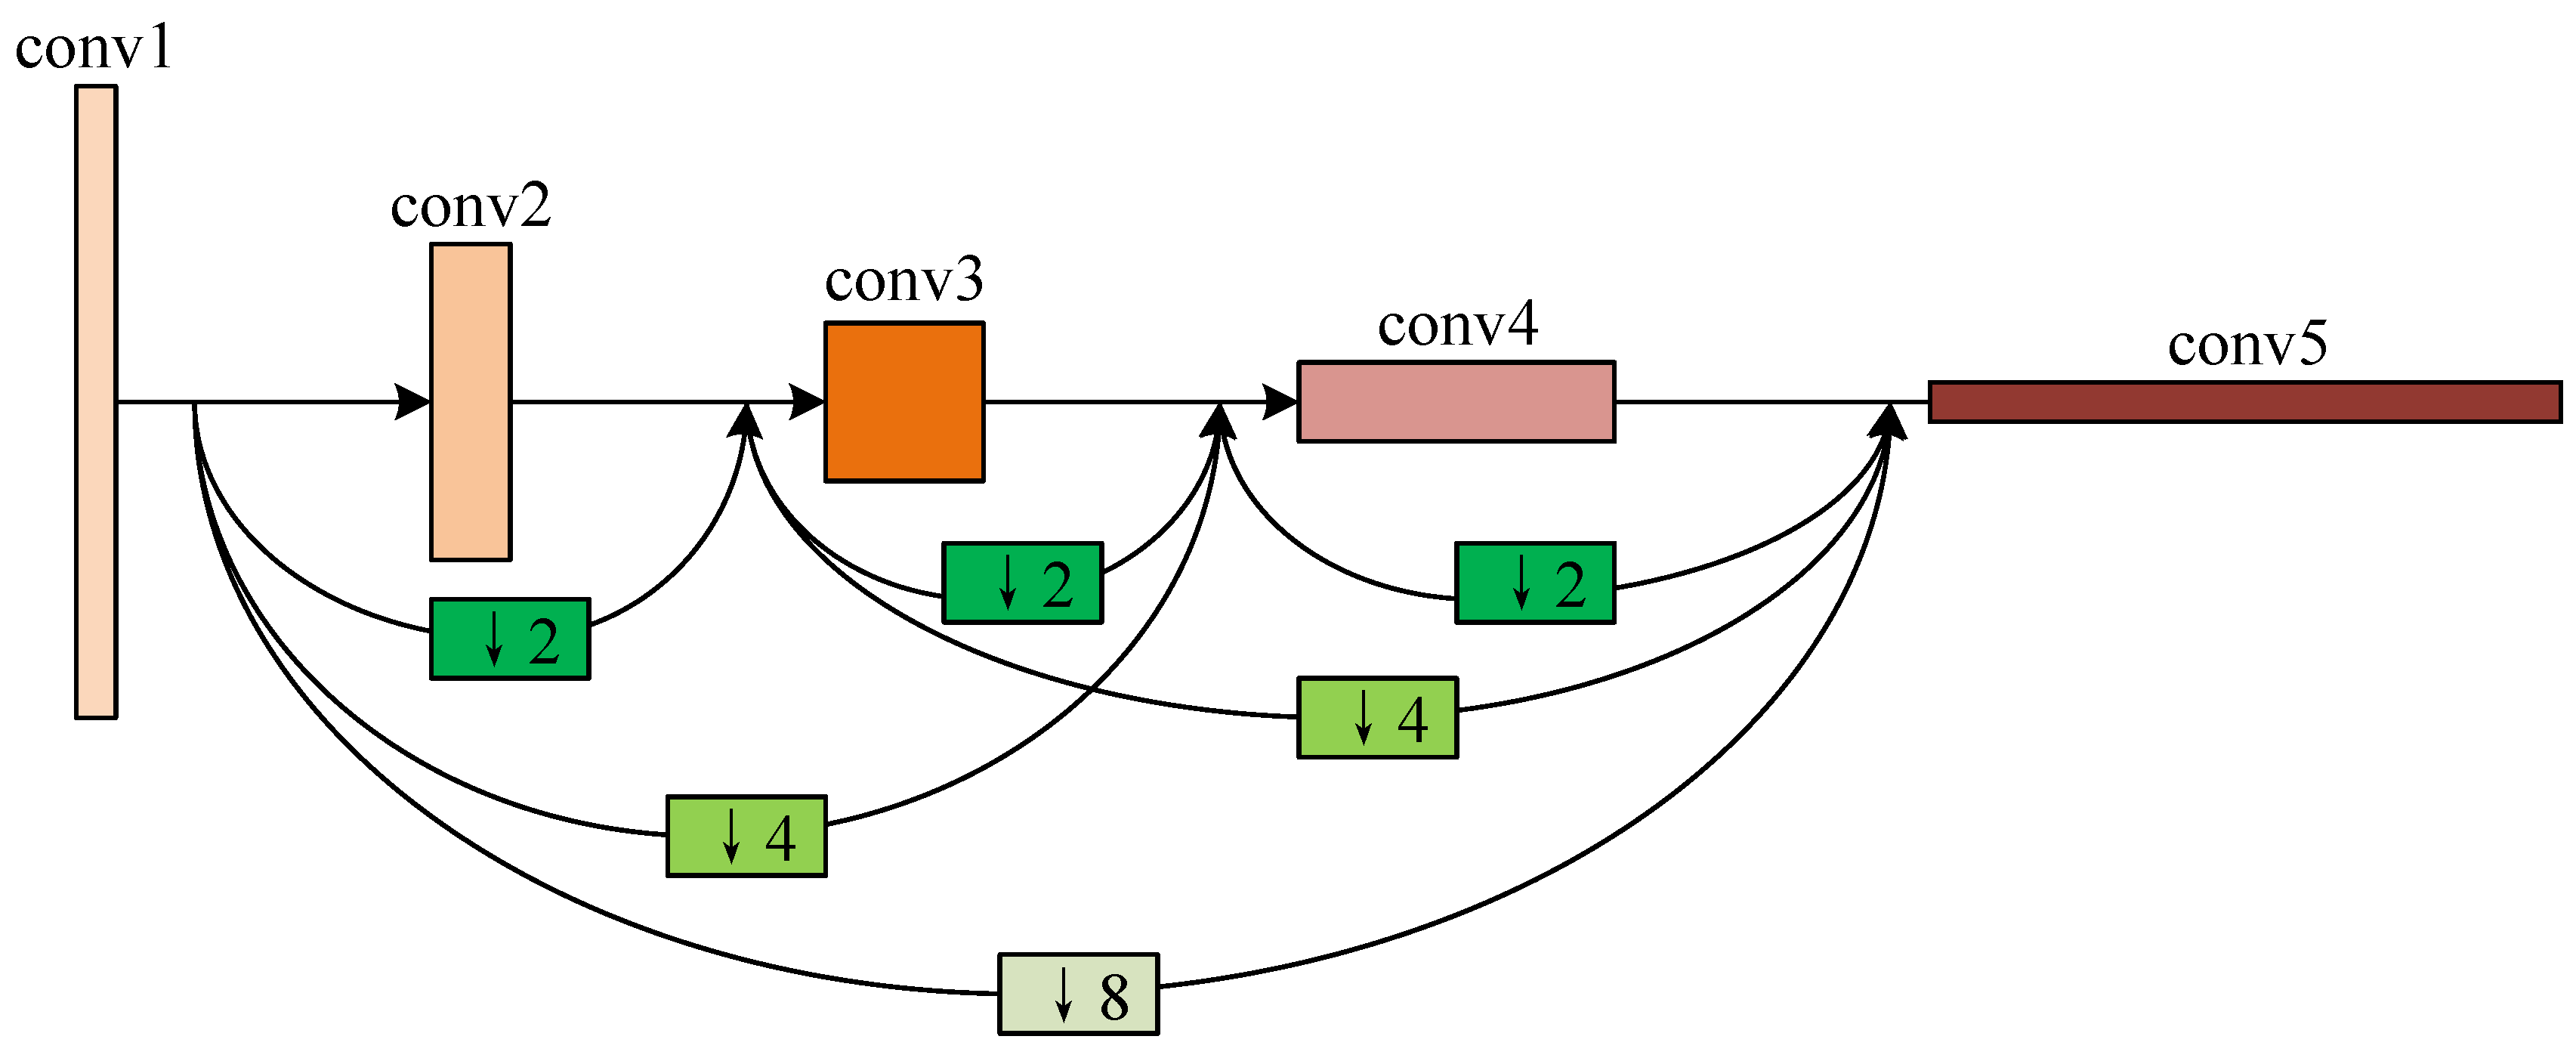
The dense connection of the 4 convolutional layers in the proposed lung parenchyma segmentation sub-network.
Figure 4.
The dense connection of the 4 convolutional layers in the proposed lung parenchyma segmentation sub-network.
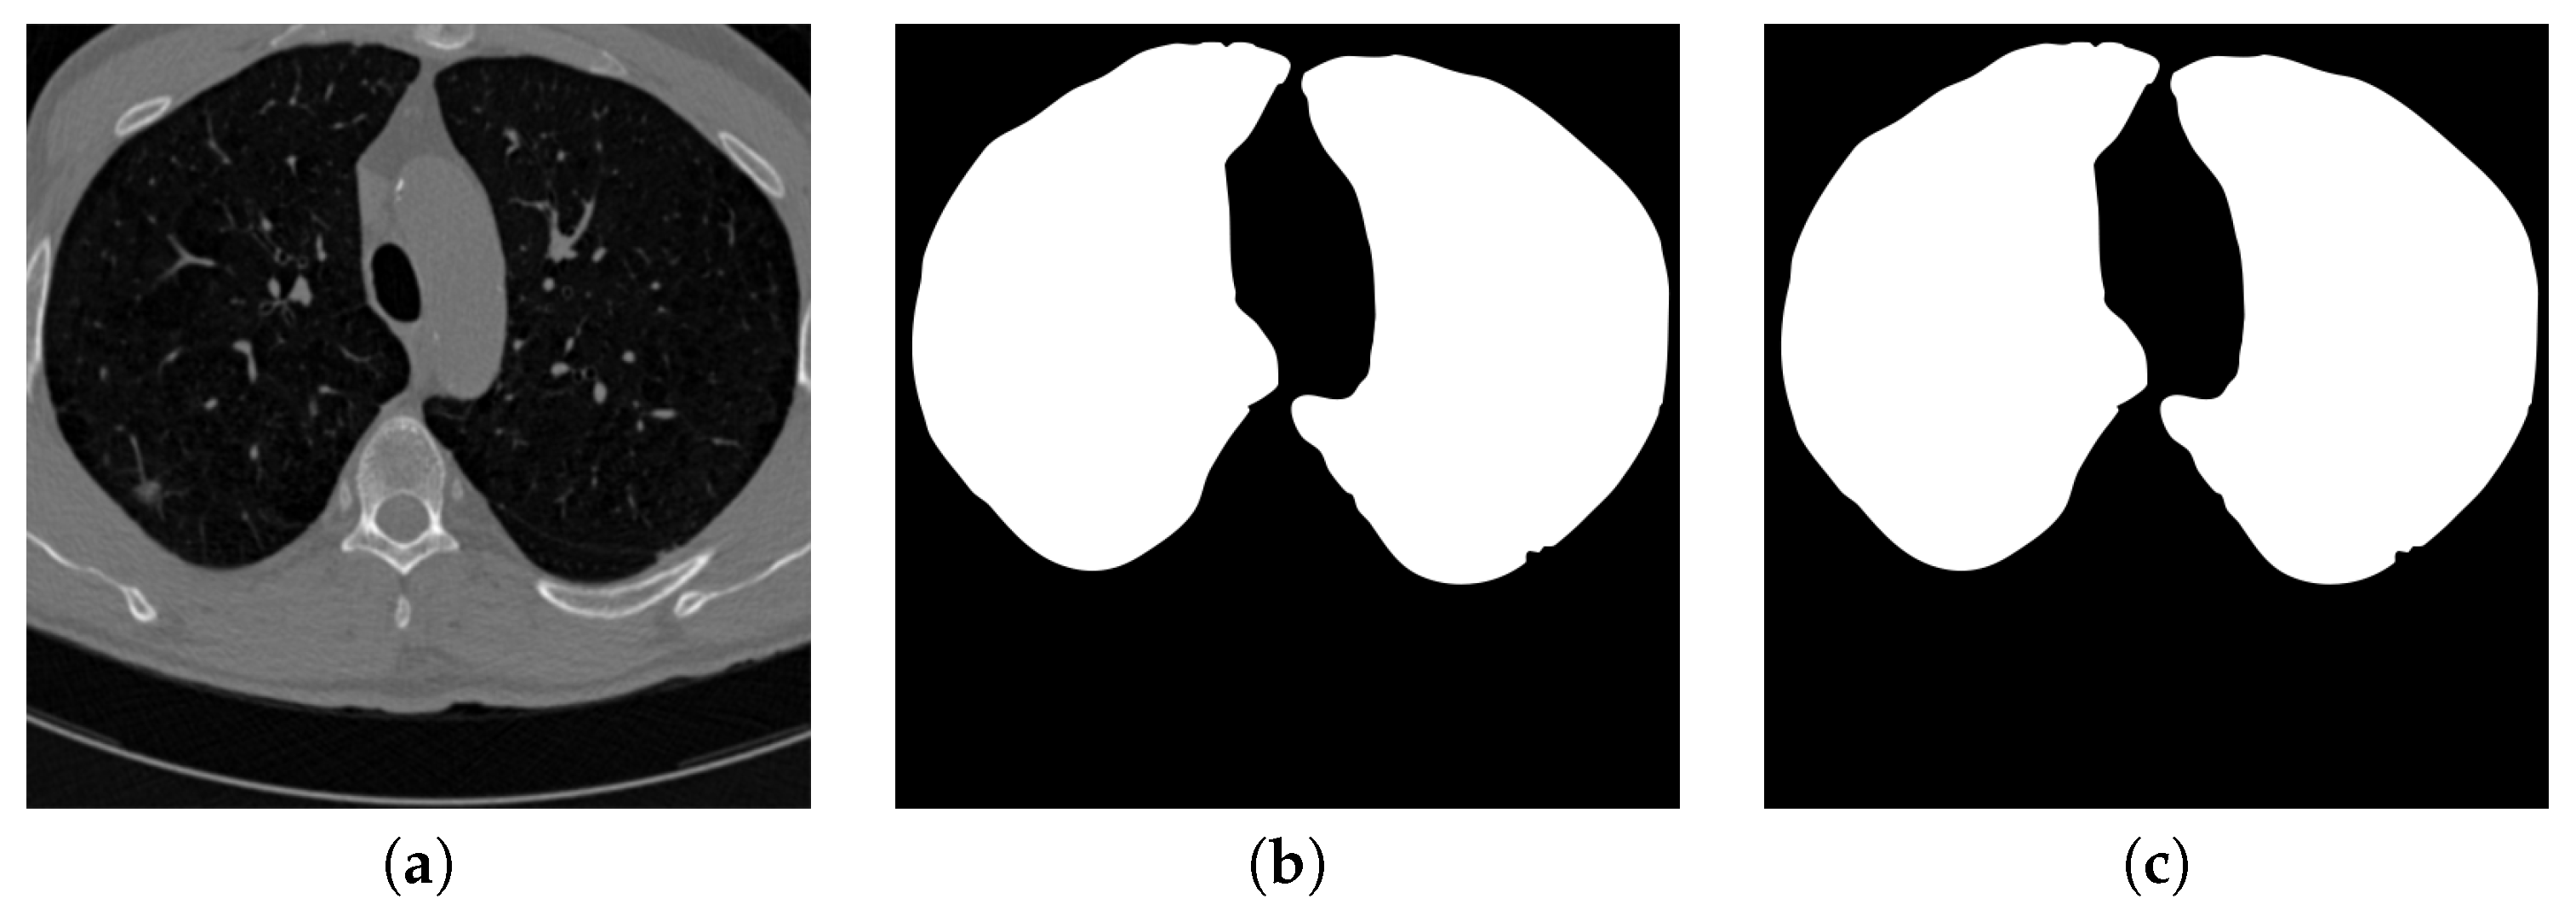
Figure 5.
An example of segmenting parenchyma mask from the chest CT image. (a) is the input chest CT image, (b) is the lung parenchyma mask detected by the proposed parenchyma detection sub-network, (c) is the ground truth lung parenchyma mask.
Figure 5.
An example of segmenting parenchyma mask from the chest CT image. (a) is the input chest CT image, (b) is the lung parenchyma mask detected by the proposed parenchyma detection sub-network, (c) is the ground truth lung parenchyma mask.
Figure 6.
The structure of the proposed sub-network for nodule candidate region detection.
Figure 6.
The structure of the proposed sub-network for nodule candidate region detection.
Figure 7.
The general structure of the convolution block used in the nodule candidate detection sub-network.
Figure 7.
The general structure of the convolution block used in the nodule candidate detection sub-network.
Figure 8.
The general structure of the de-convolution block used in the nodule candidate detection sub-network.
Figure 8.
The general structure of the de-convolution block used in the nodule candidate detection sub-network.
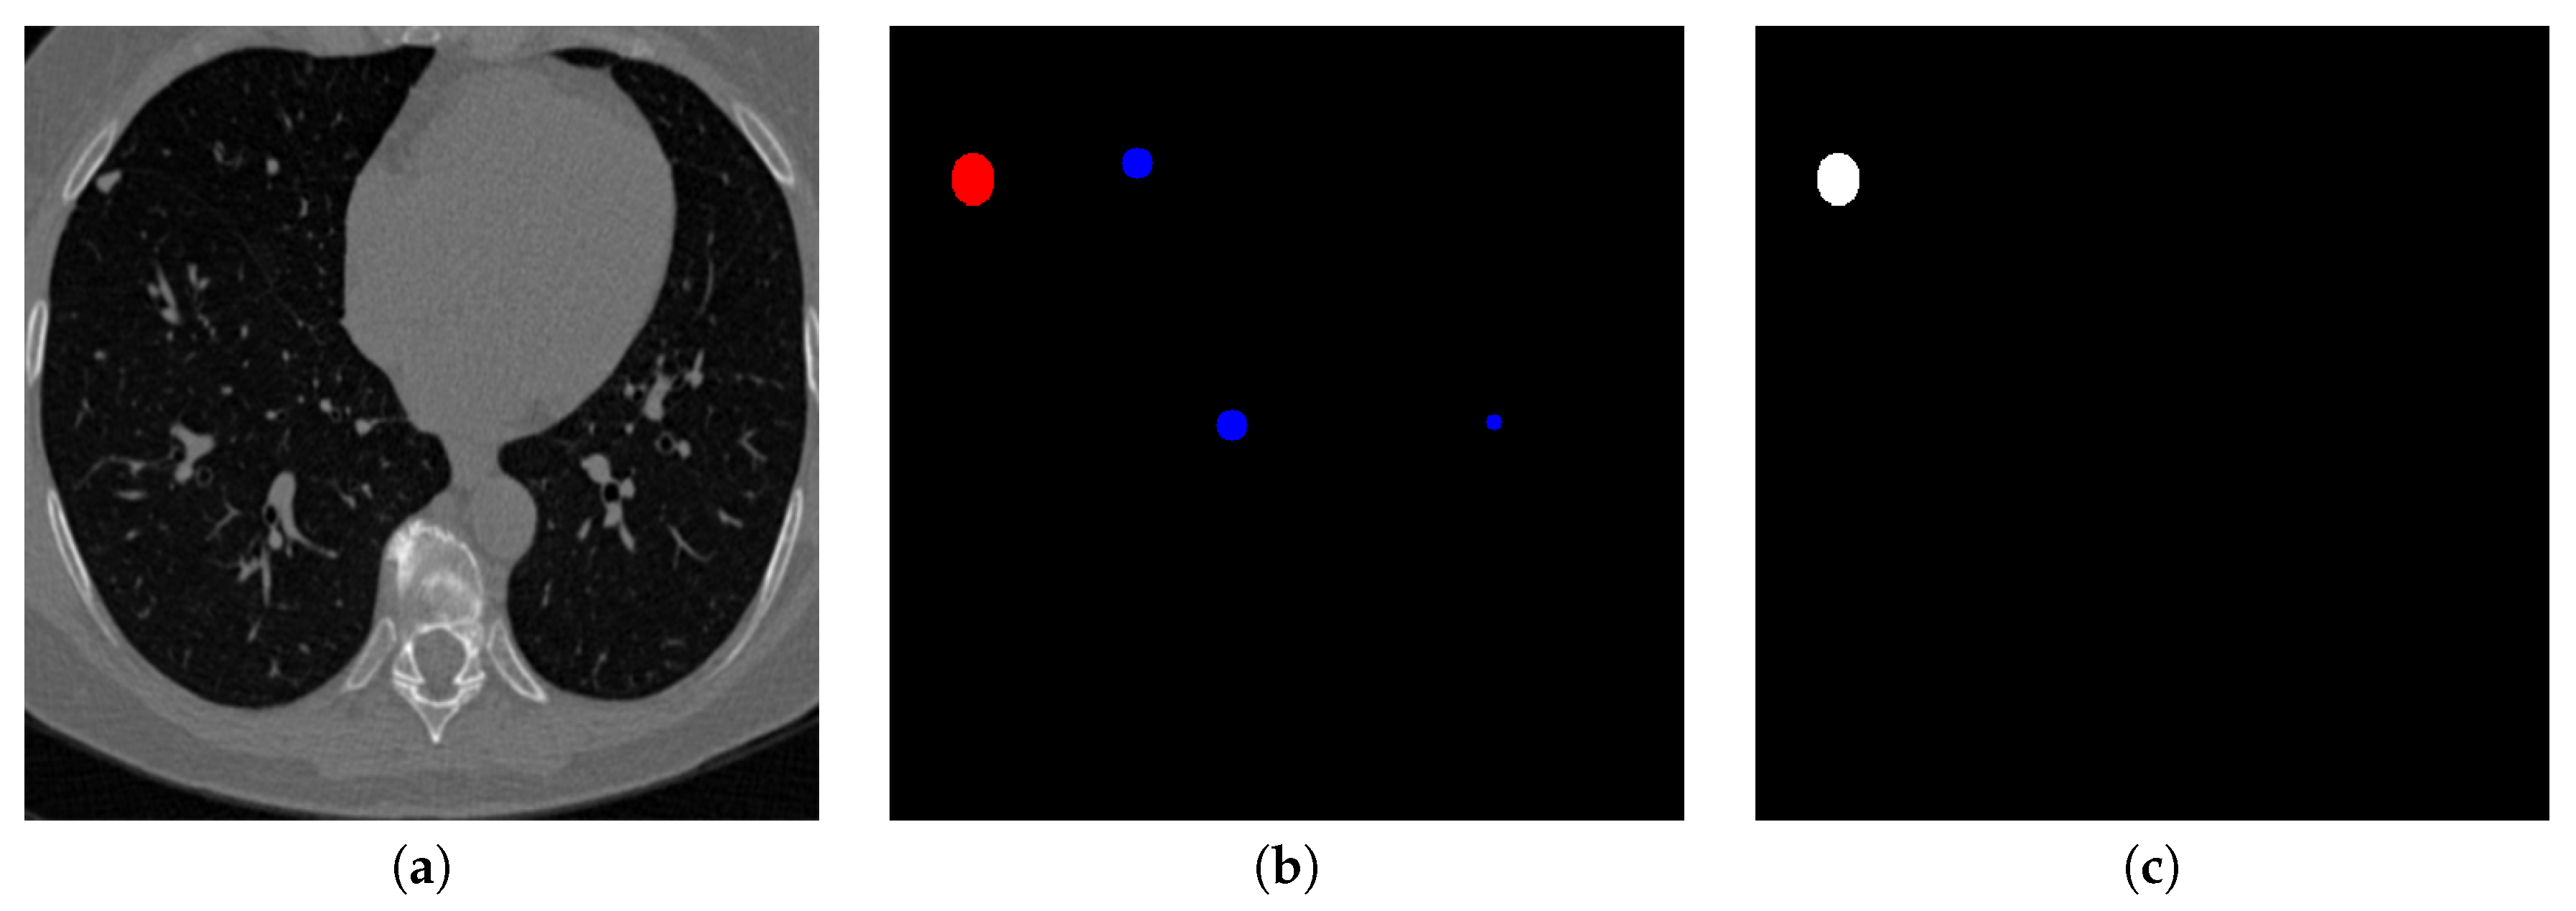
Figure 9.
An example of detecting nodule candidates from the chest CT image. (a) is the input chest CT image, (b) is the nodule candidates detected by the proposed nodule candidate detection sub-network, (c) is the ground truth nodule region.
Figure 9.
An example of detecting nodule candidates from the chest CT image. (a) is the input chest CT image, (b) is the nodule candidates detected by the proposed nodule candidate detection sub-network, (c) is the ground truth nodule region.
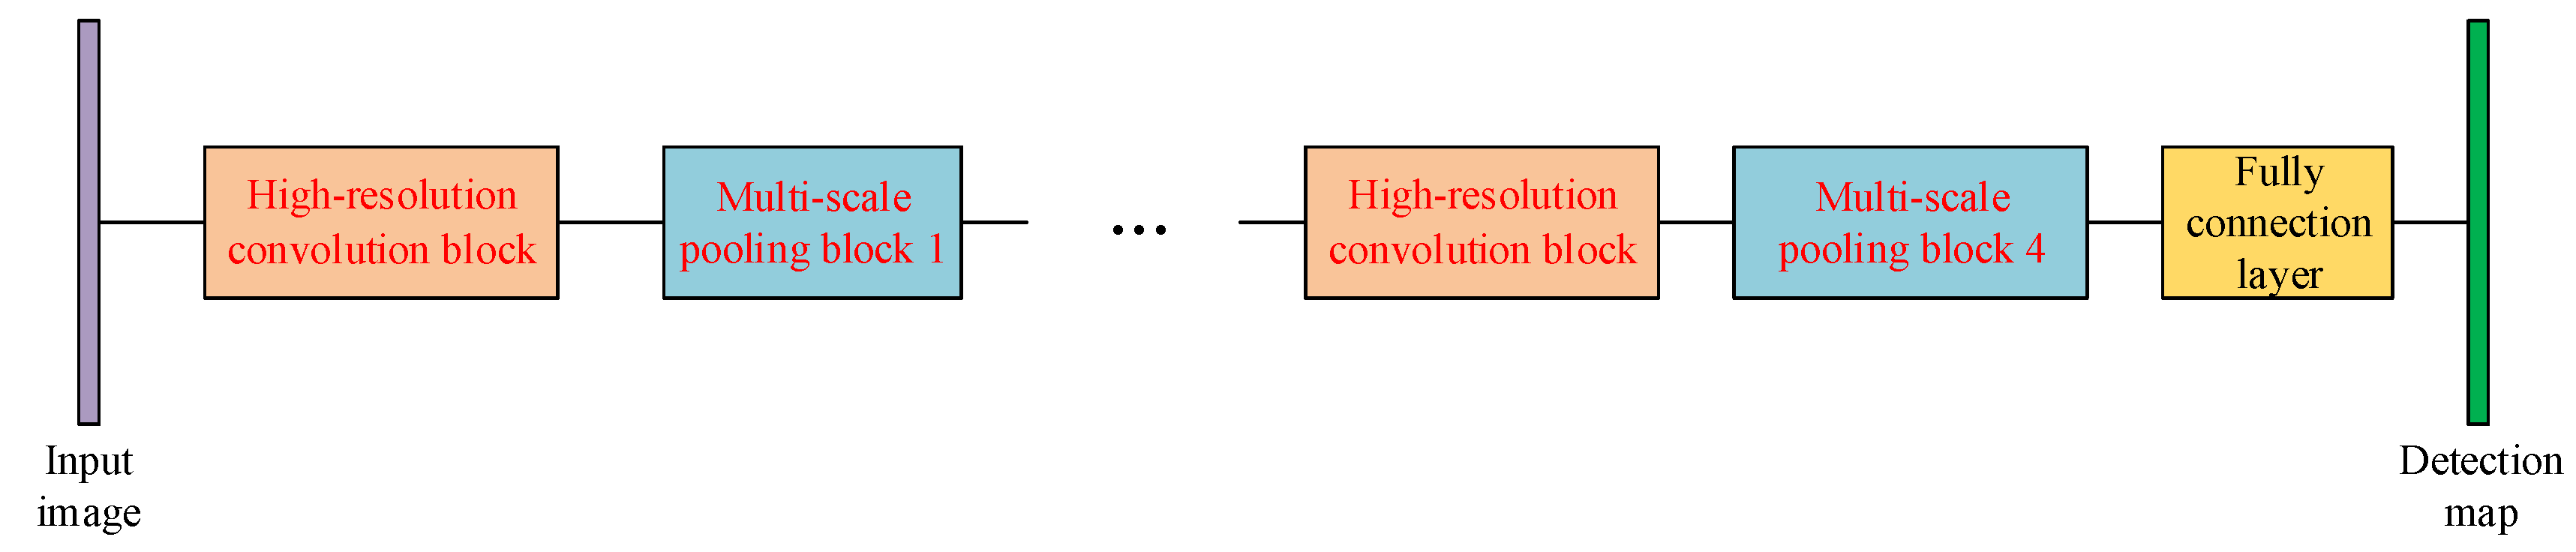
Figure 10.
The structure of the proposed sub-network for nodule determination.
Figure 10.
The structure of the proposed sub-network for nodule determination.
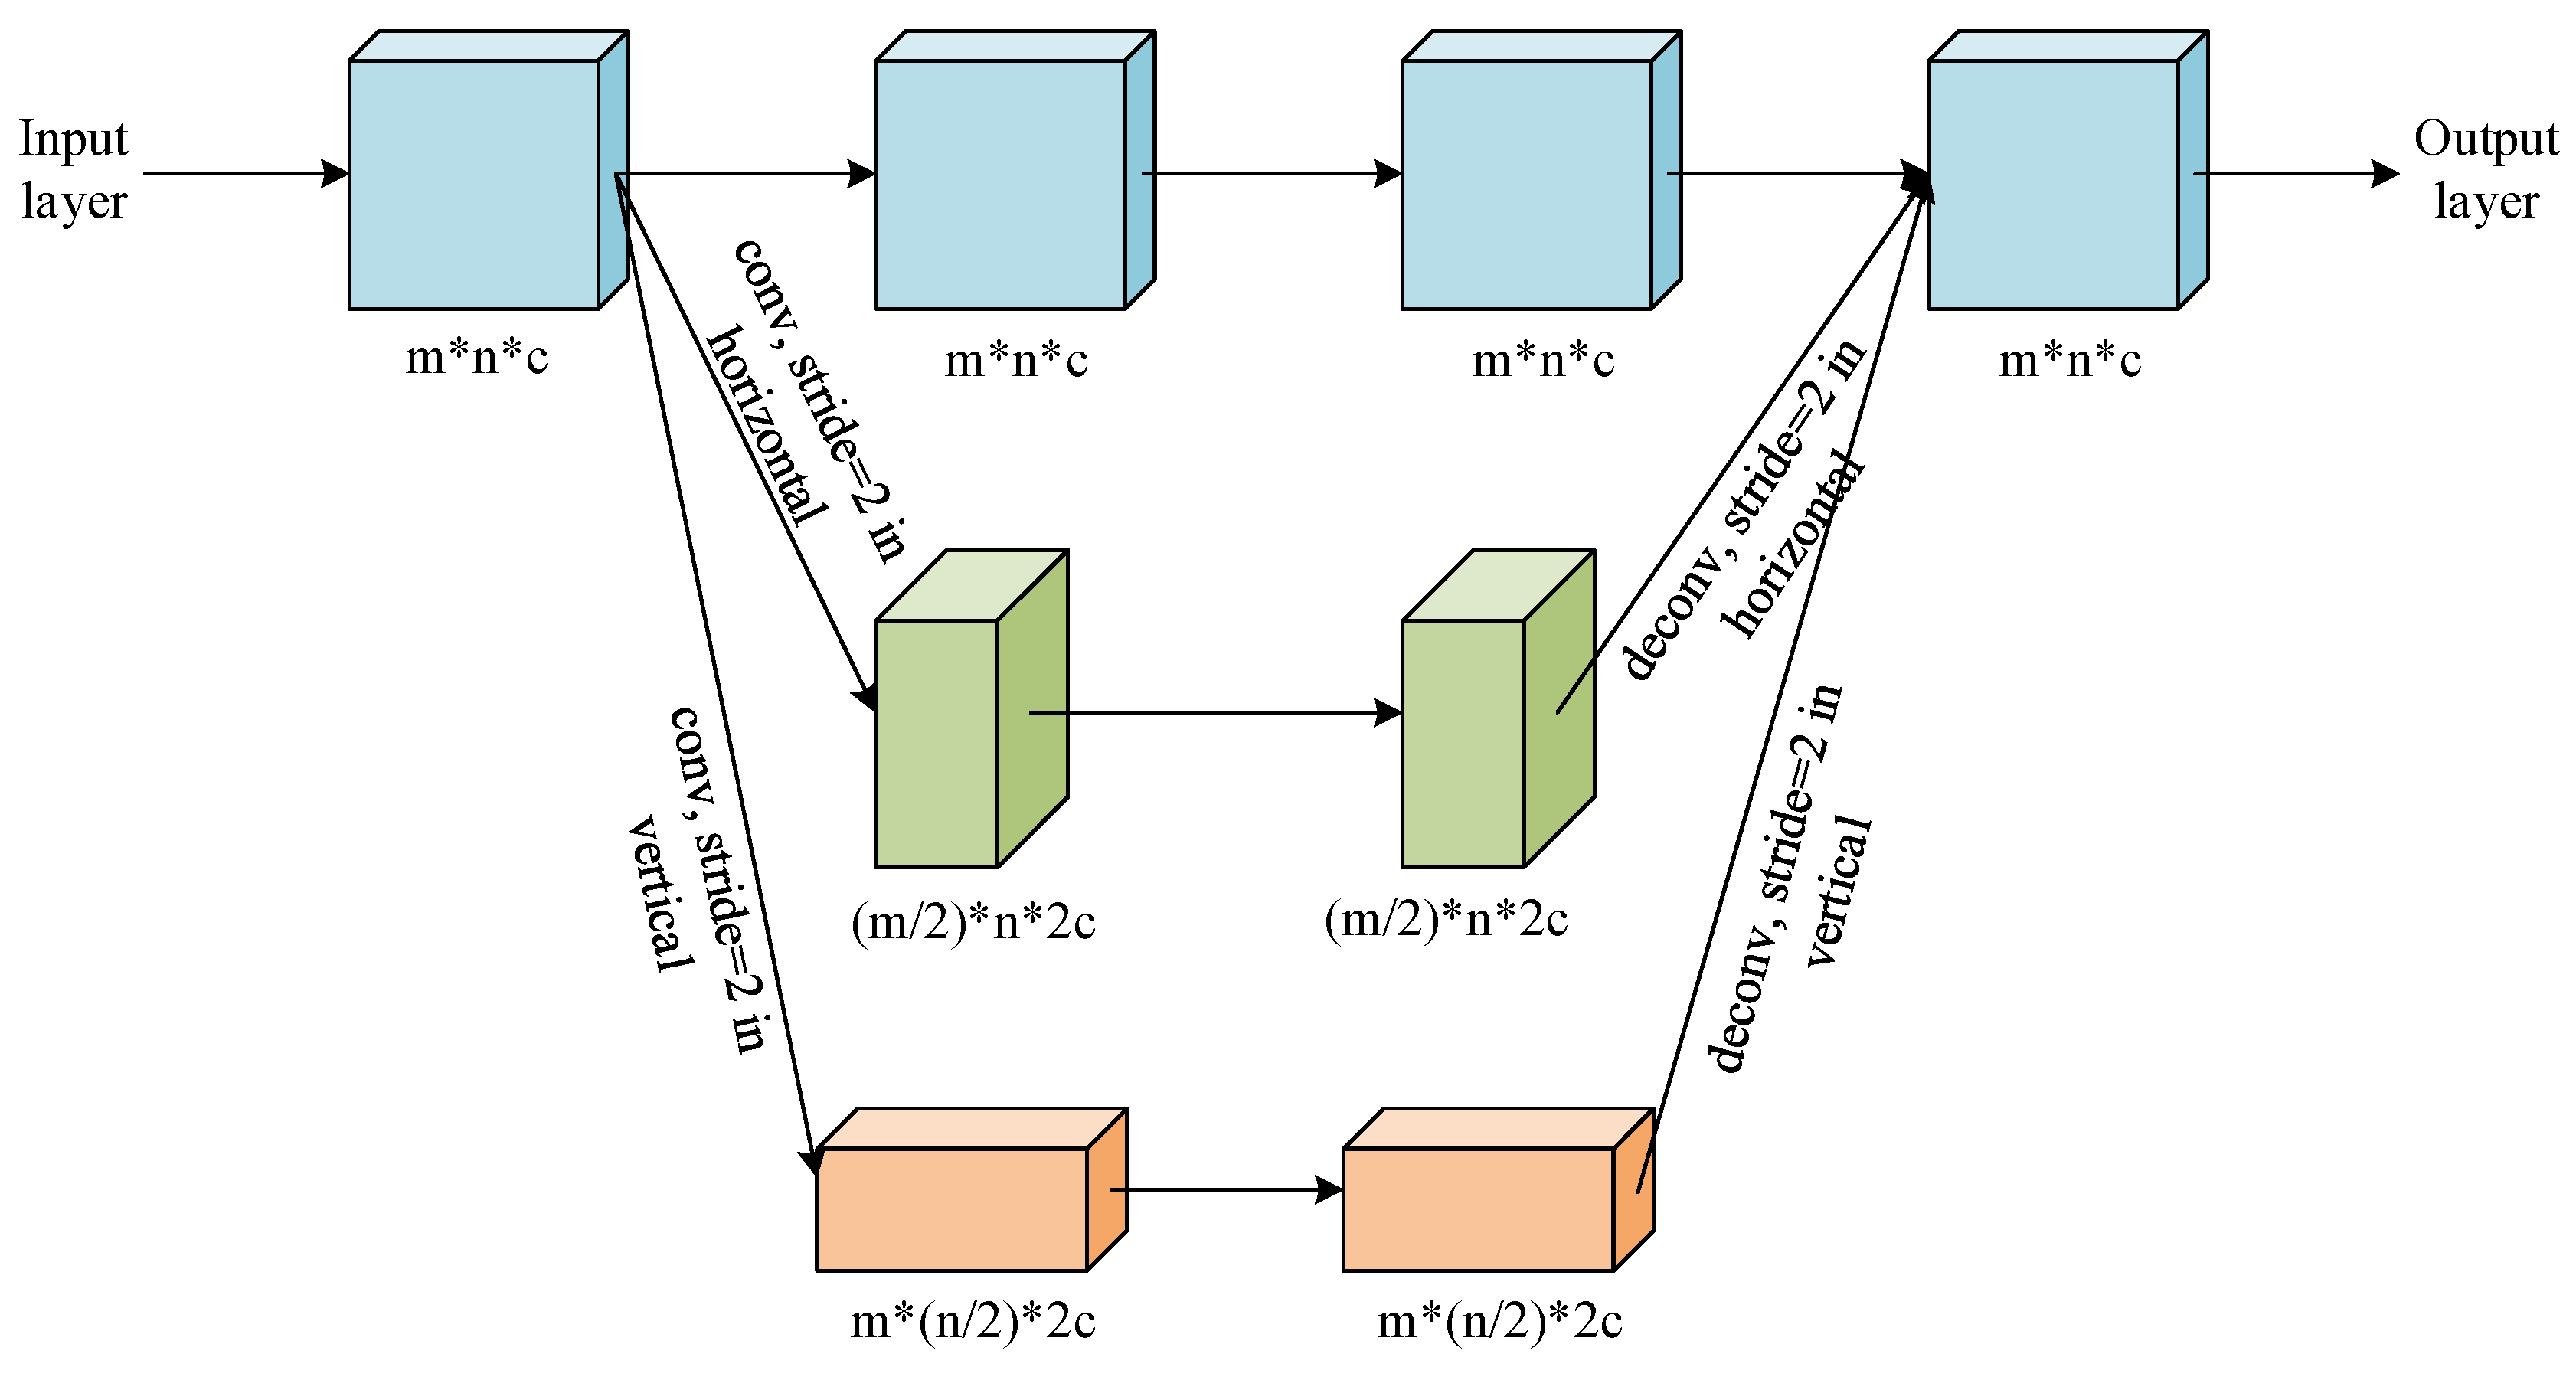
Figure 11.
The multi-resolution feature concatenation module of the proposed determination sub-network.
Figure 11.
The multi-resolution feature concatenation module of the proposed determination sub-network.
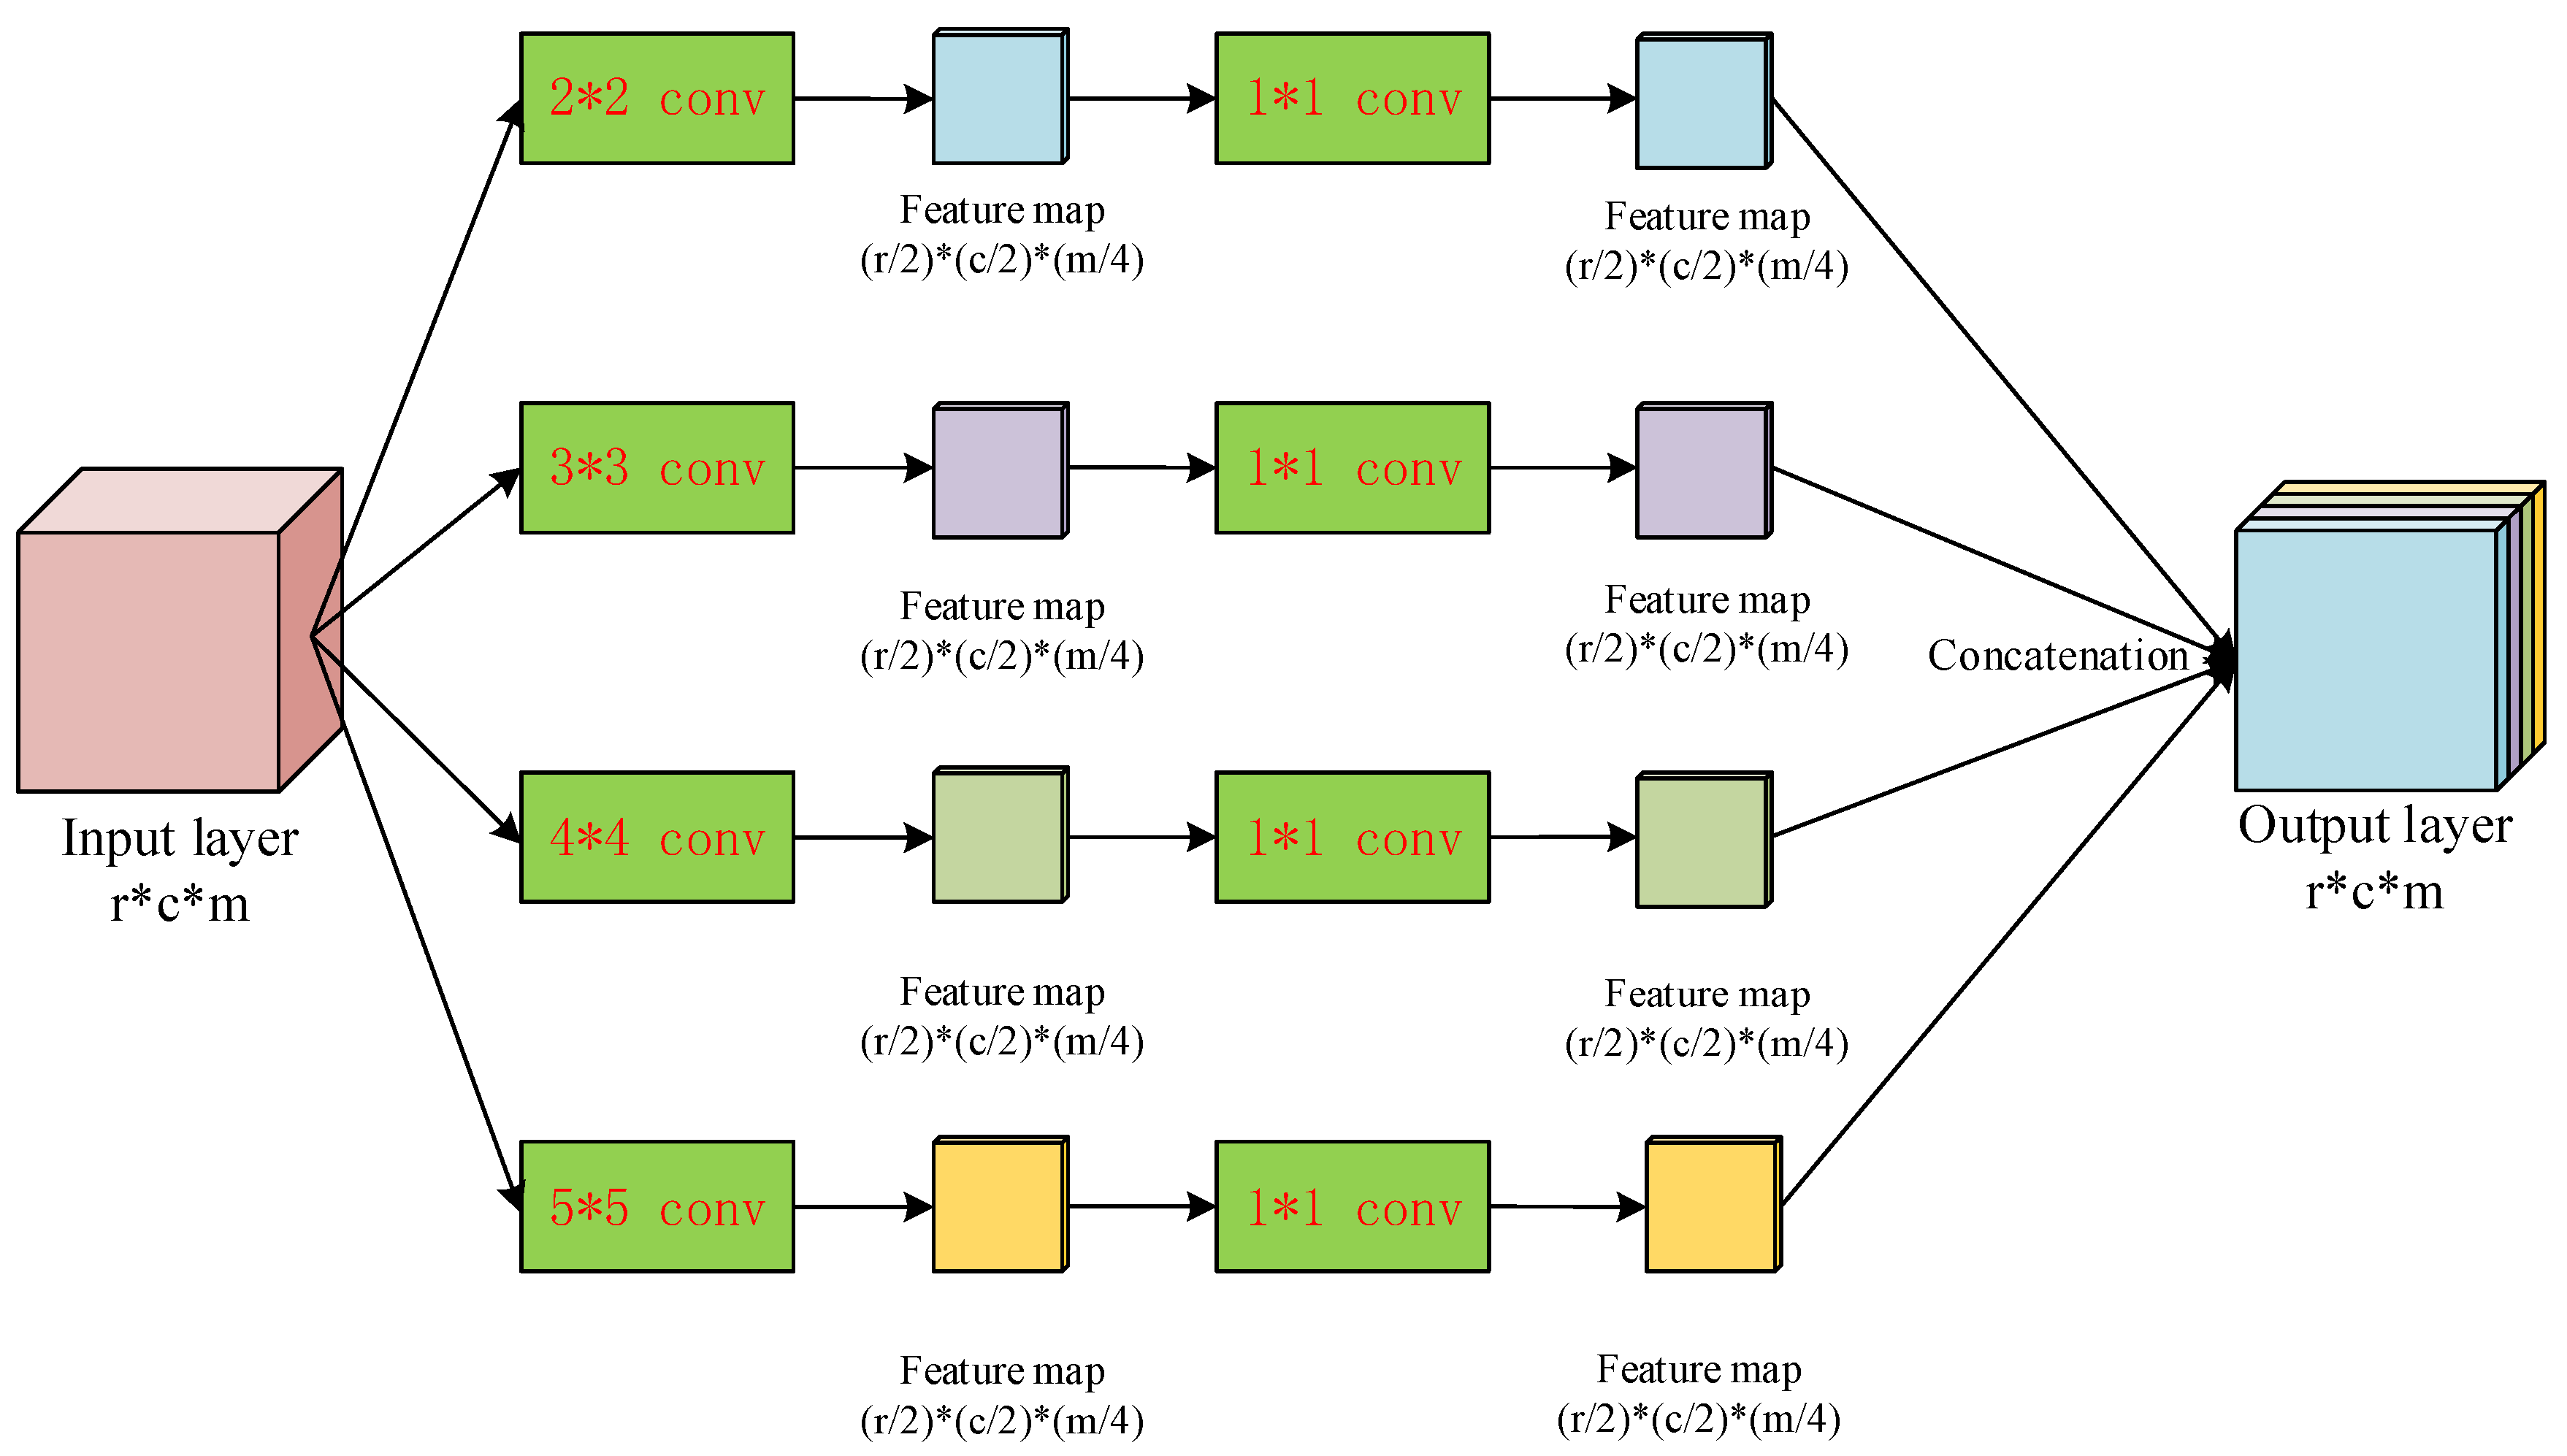
Figure 12.
The multi-scale pooling block used in the proposed determination sub-network.
Figure 12.
The multi-scale pooling block used in the proposed determination sub-network.
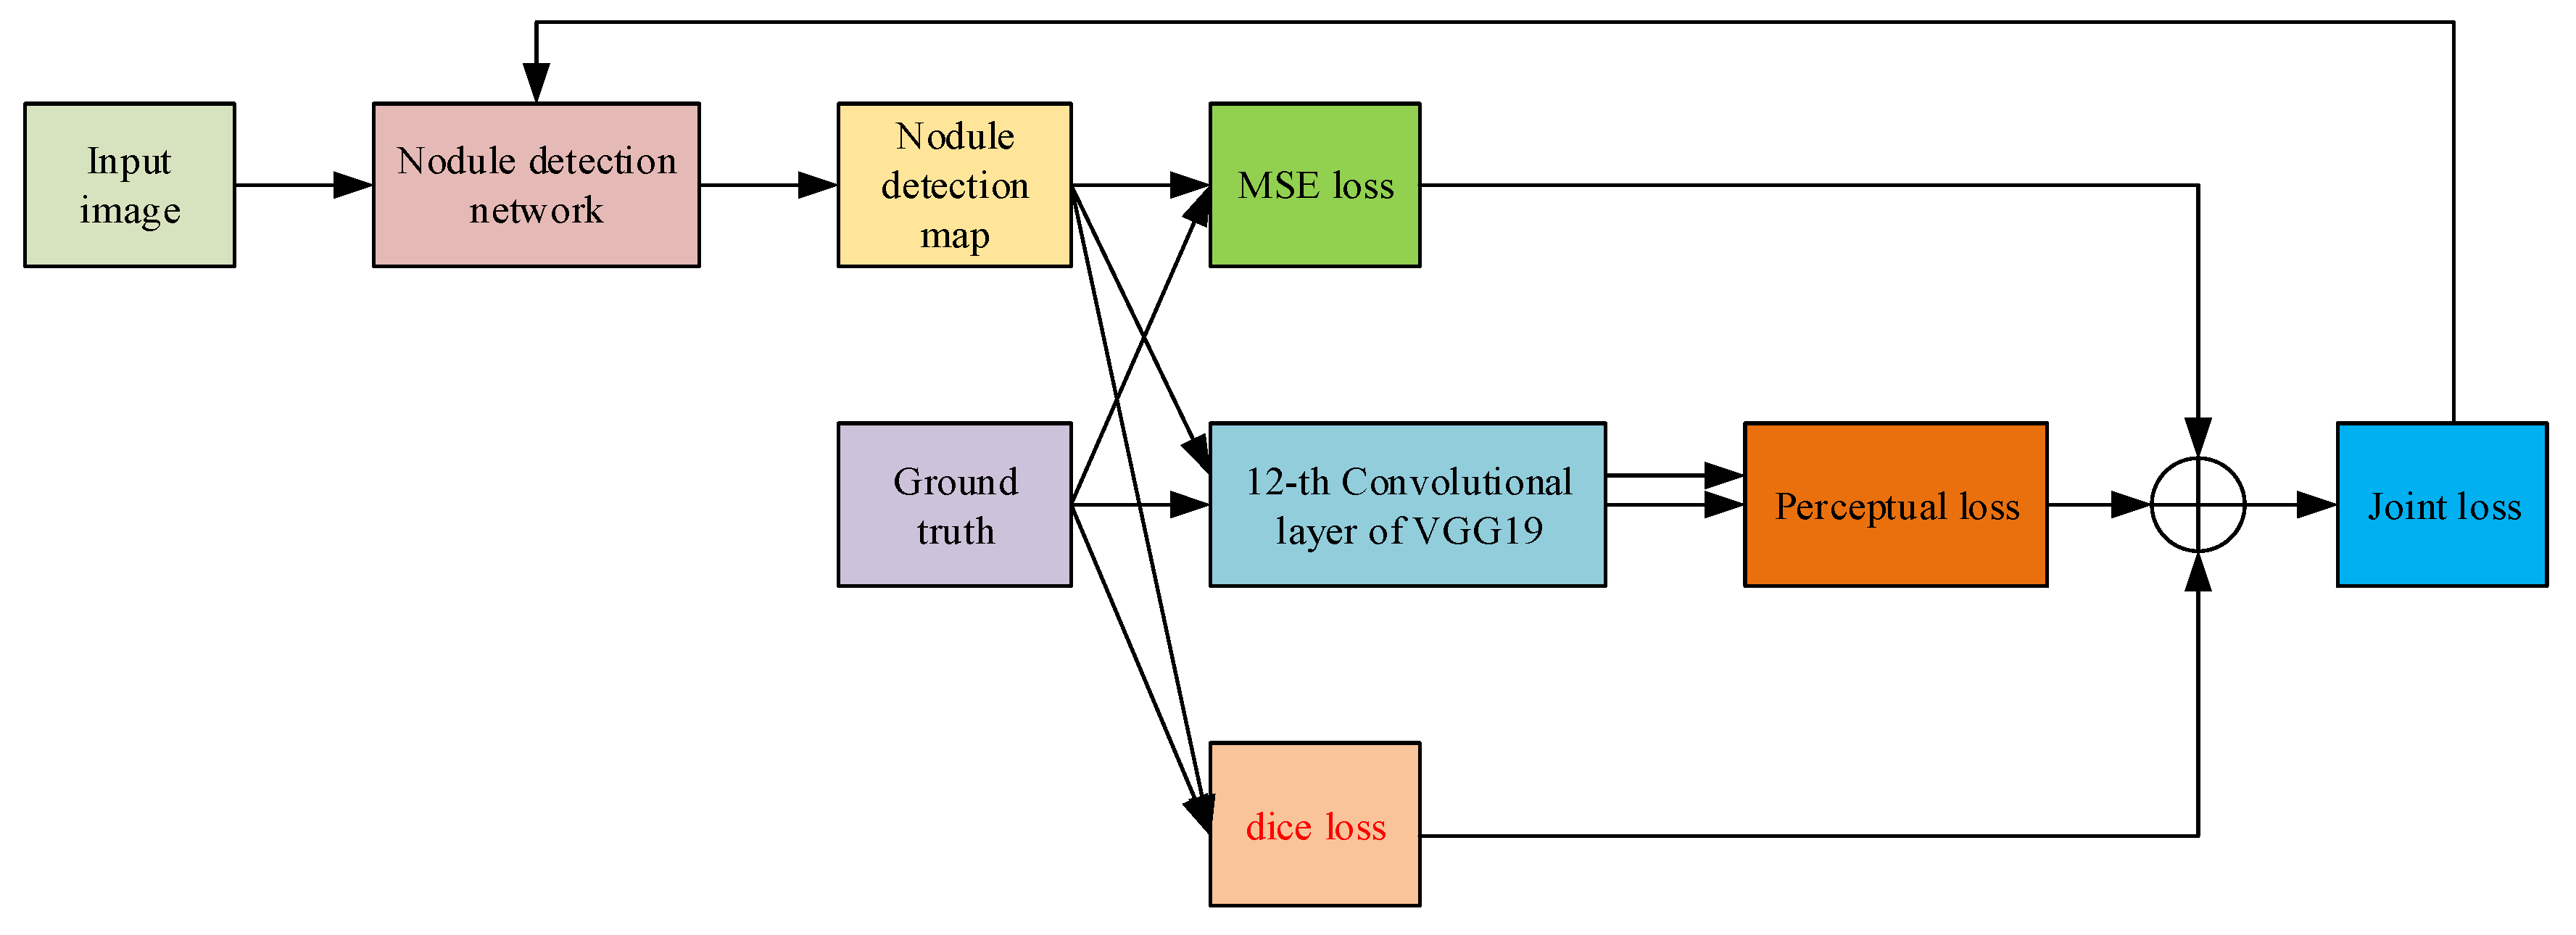
Figure 13.
The flow of calculating the joint loss for optimizing the parameters of the nodule detection network.
Figure 13.
The flow of calculating the joint loss for optimizing the parameters of the nodule detection network.
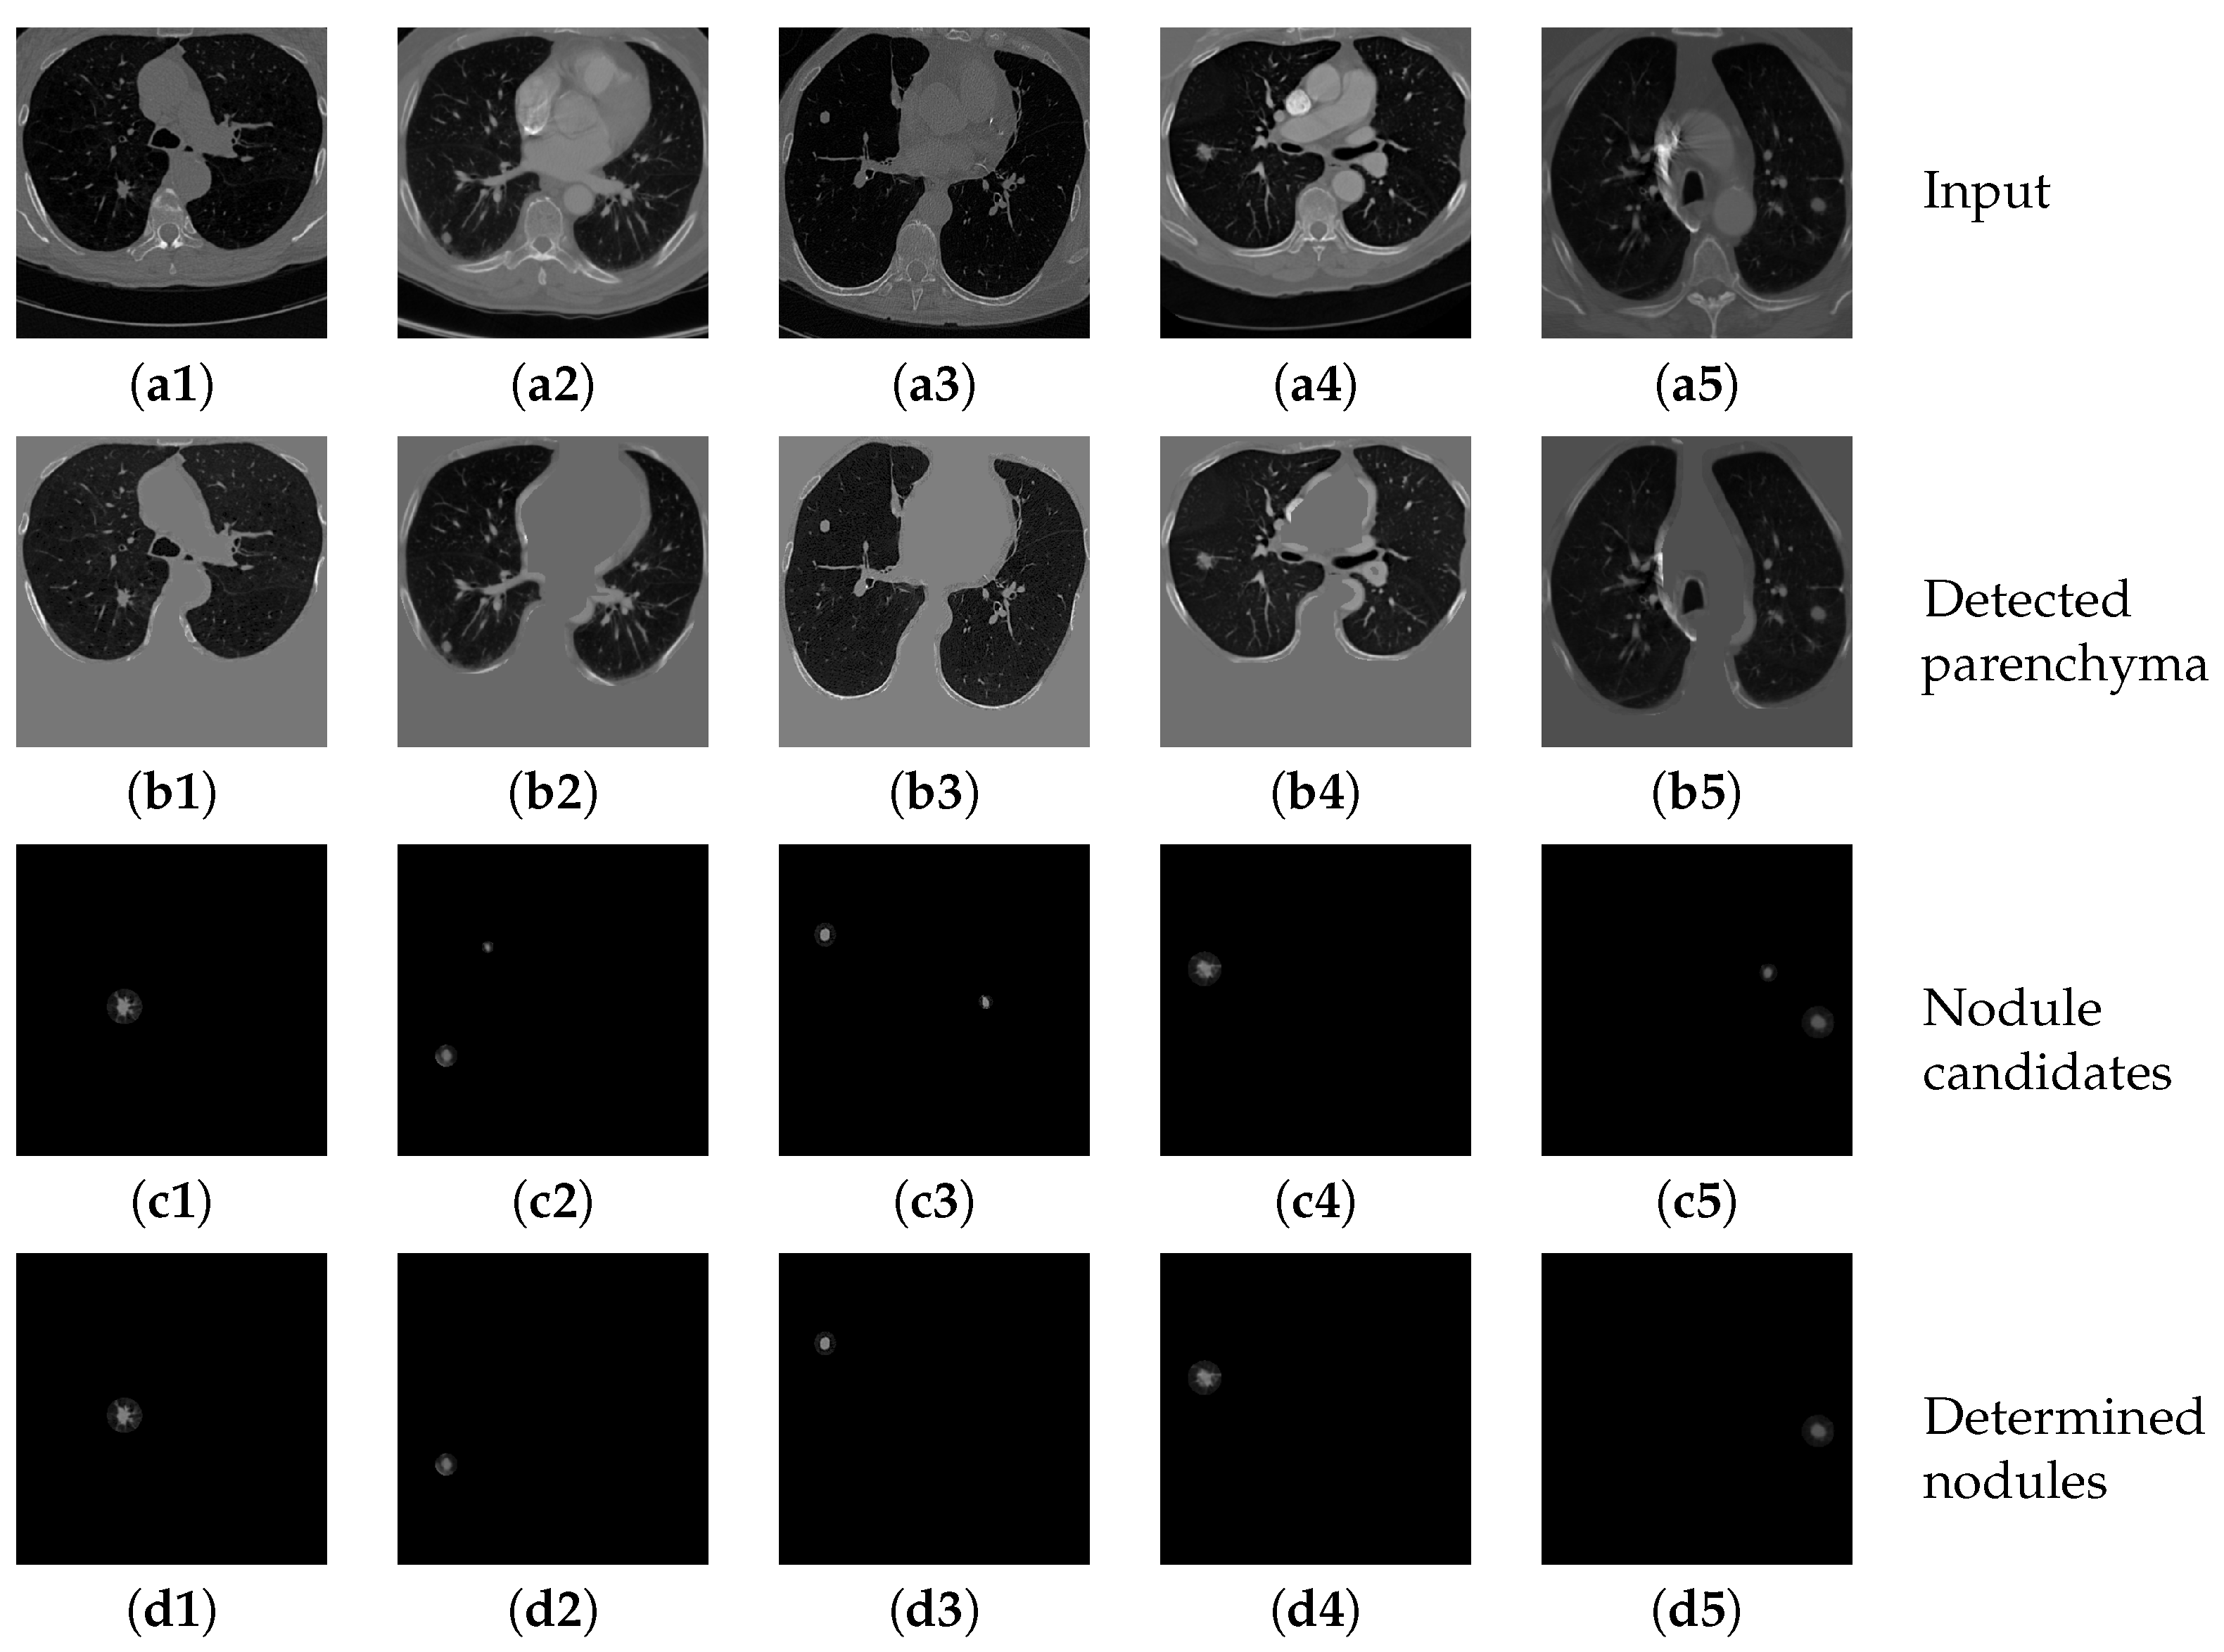
Figure 14.
The results of detecting parenchyma regions, nodule candidates and determining nodules by the proposed cascaded network on five different chest CT images.
Figure 14.
The results of detecting parenchyma regions, nodule candidates and determining nodules by the proposed cascaded network on five different chest CT images.
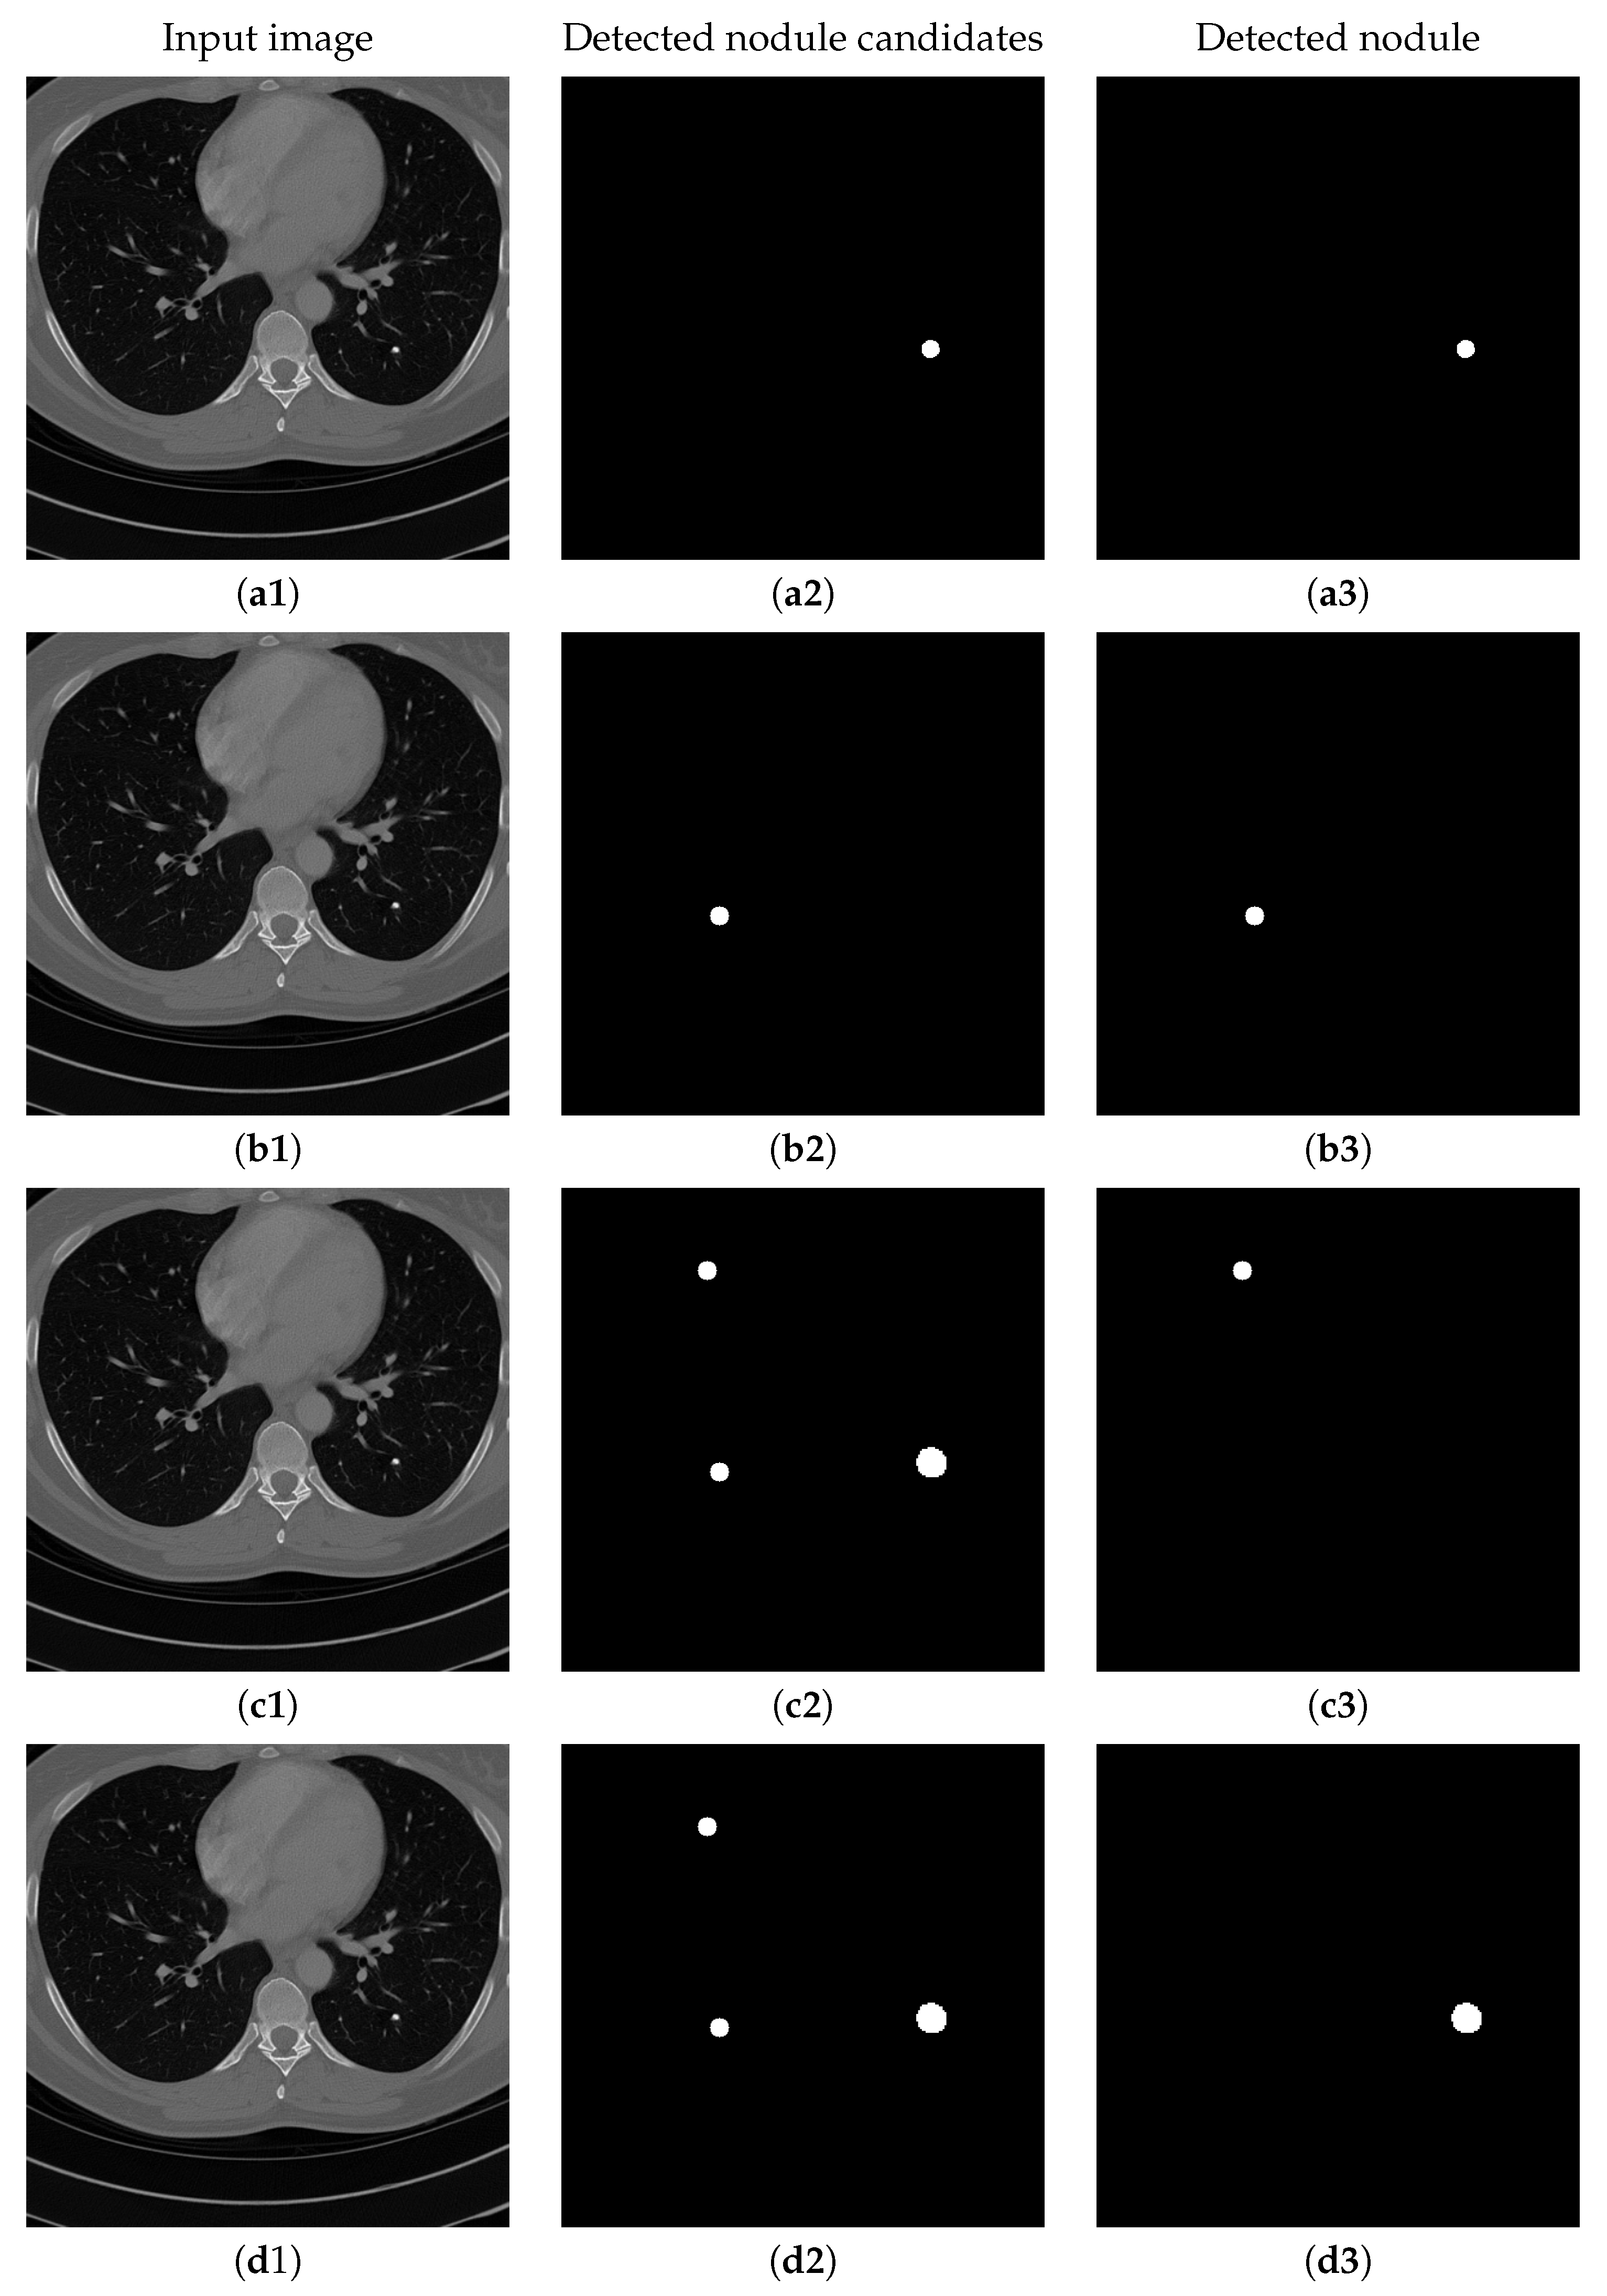
Figure 15.
The results of detecting pulmonary nodule through the proposed network with different loss strategies. Columns from left to right are: input images, detected nodule candidates, detected nodules. Rows from top to bottom are: ground truth detection results, nodule candidates and nodule detection by the proposed network with MSE loss, MSE-perceptual loss and the MSE-perceptual-dice loss.
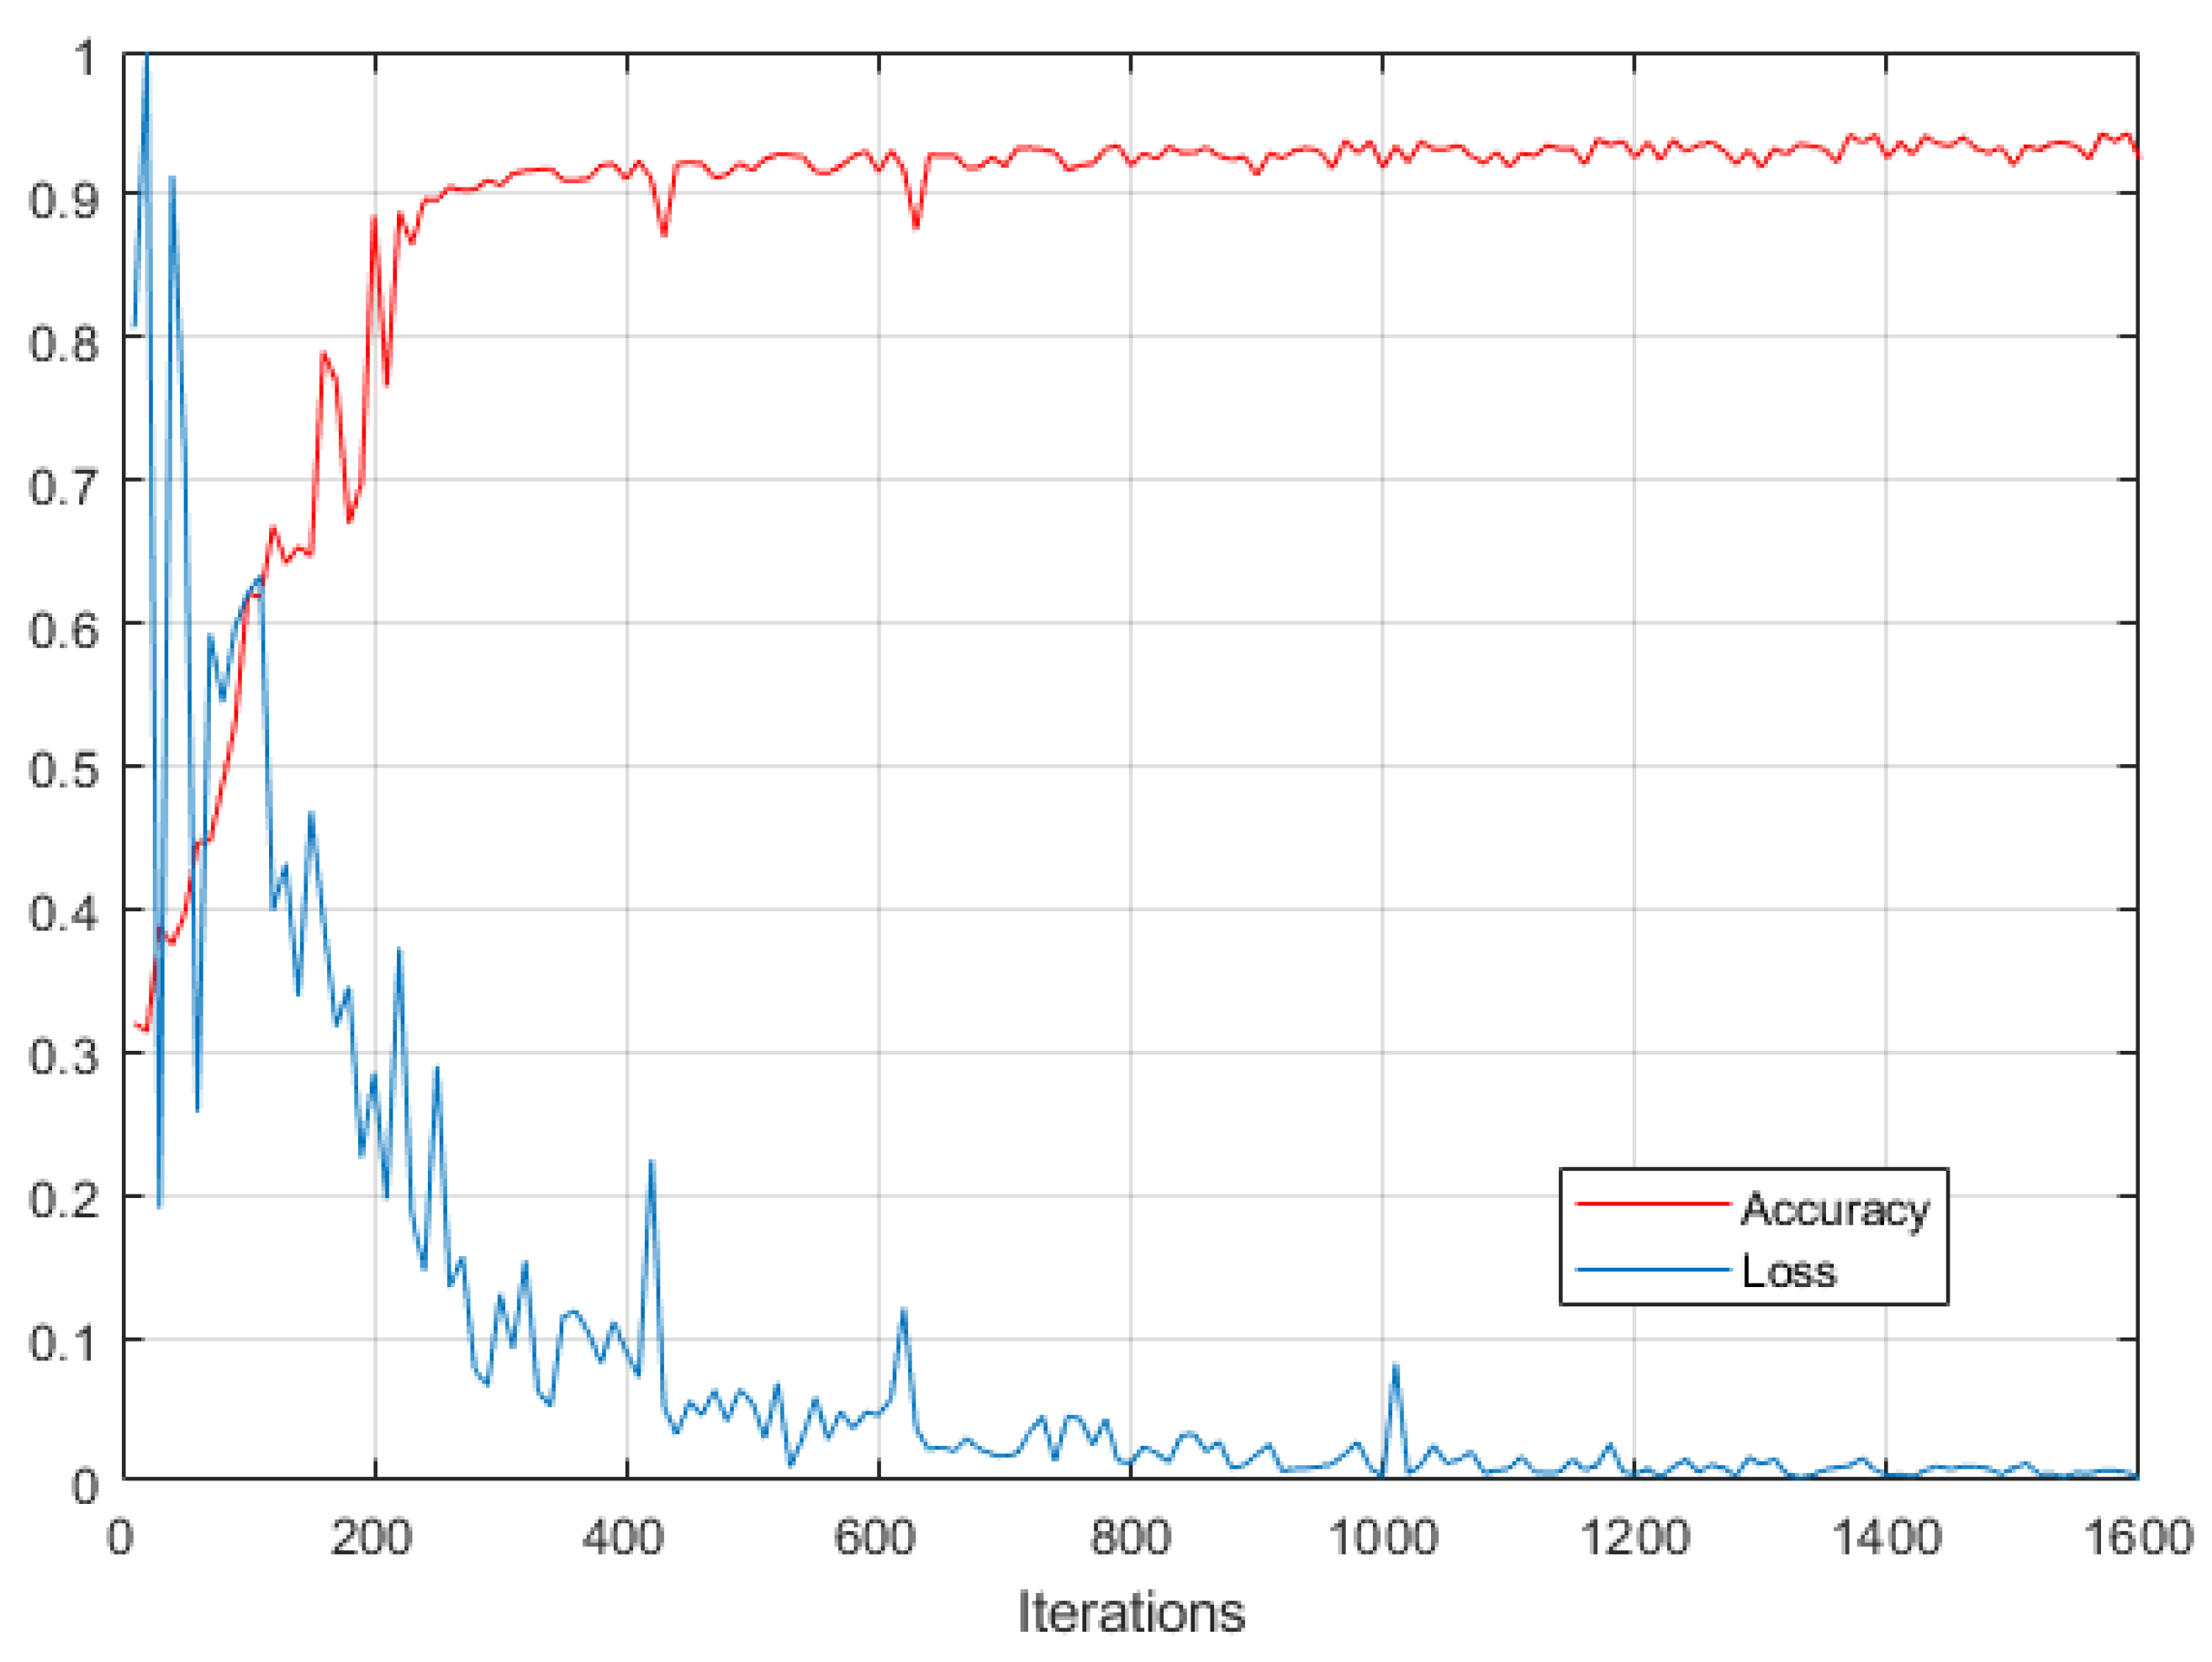
Figure 16.
Nodule detection accuracy and loss over the training process of the proposed networks.
Figure 16.
Nodule detection accuracy and loss over the training process of the proposed networks.
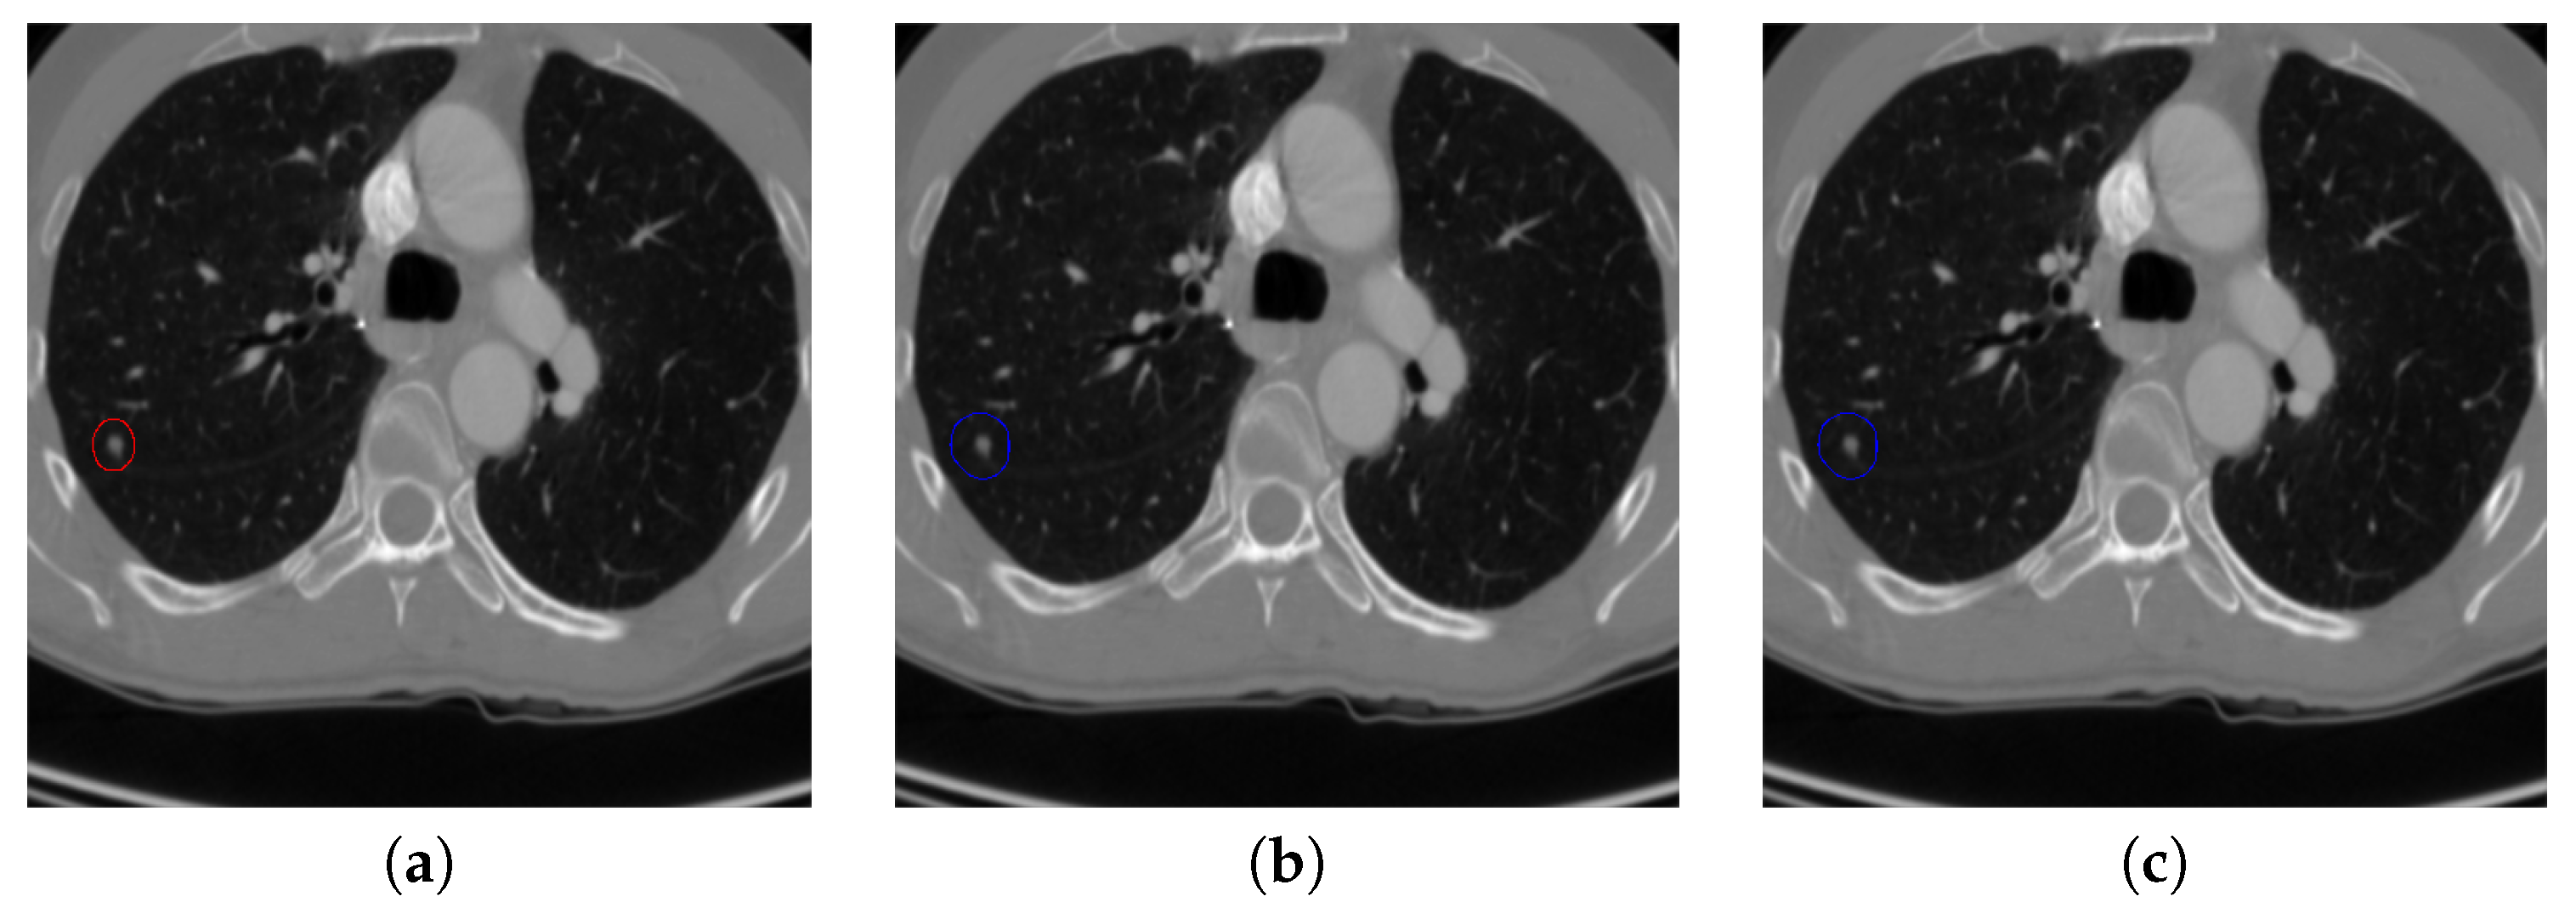
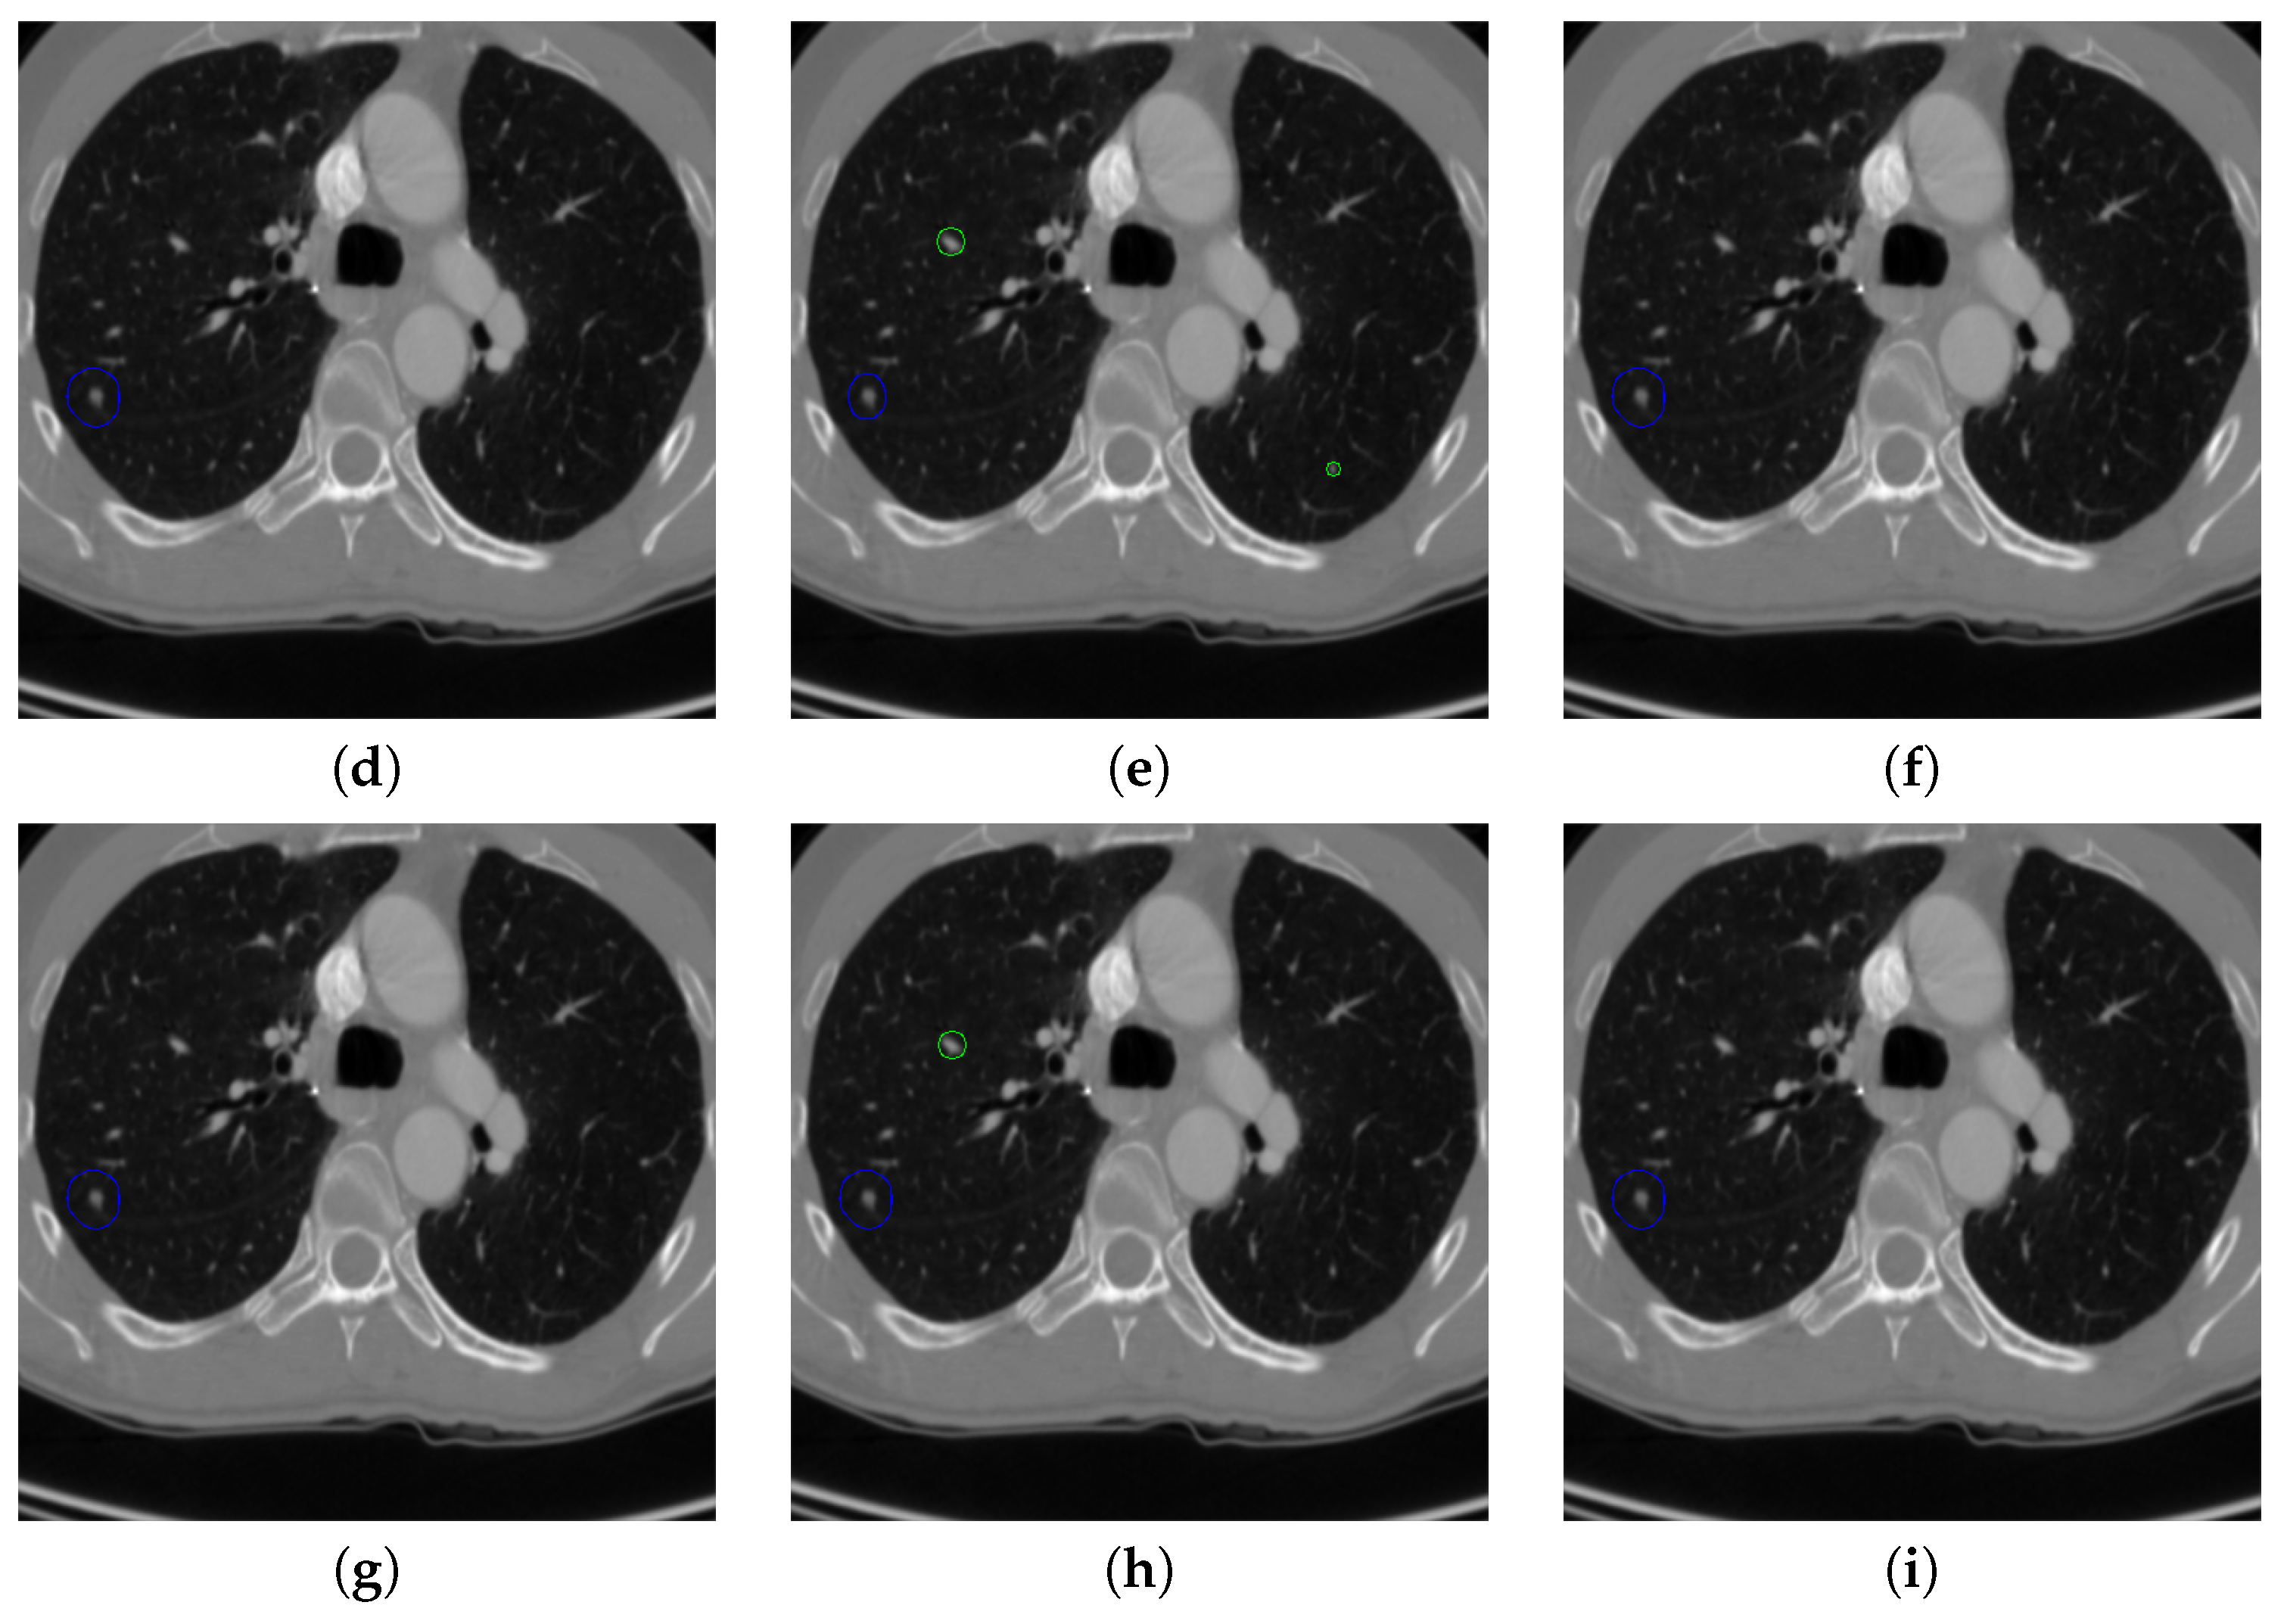
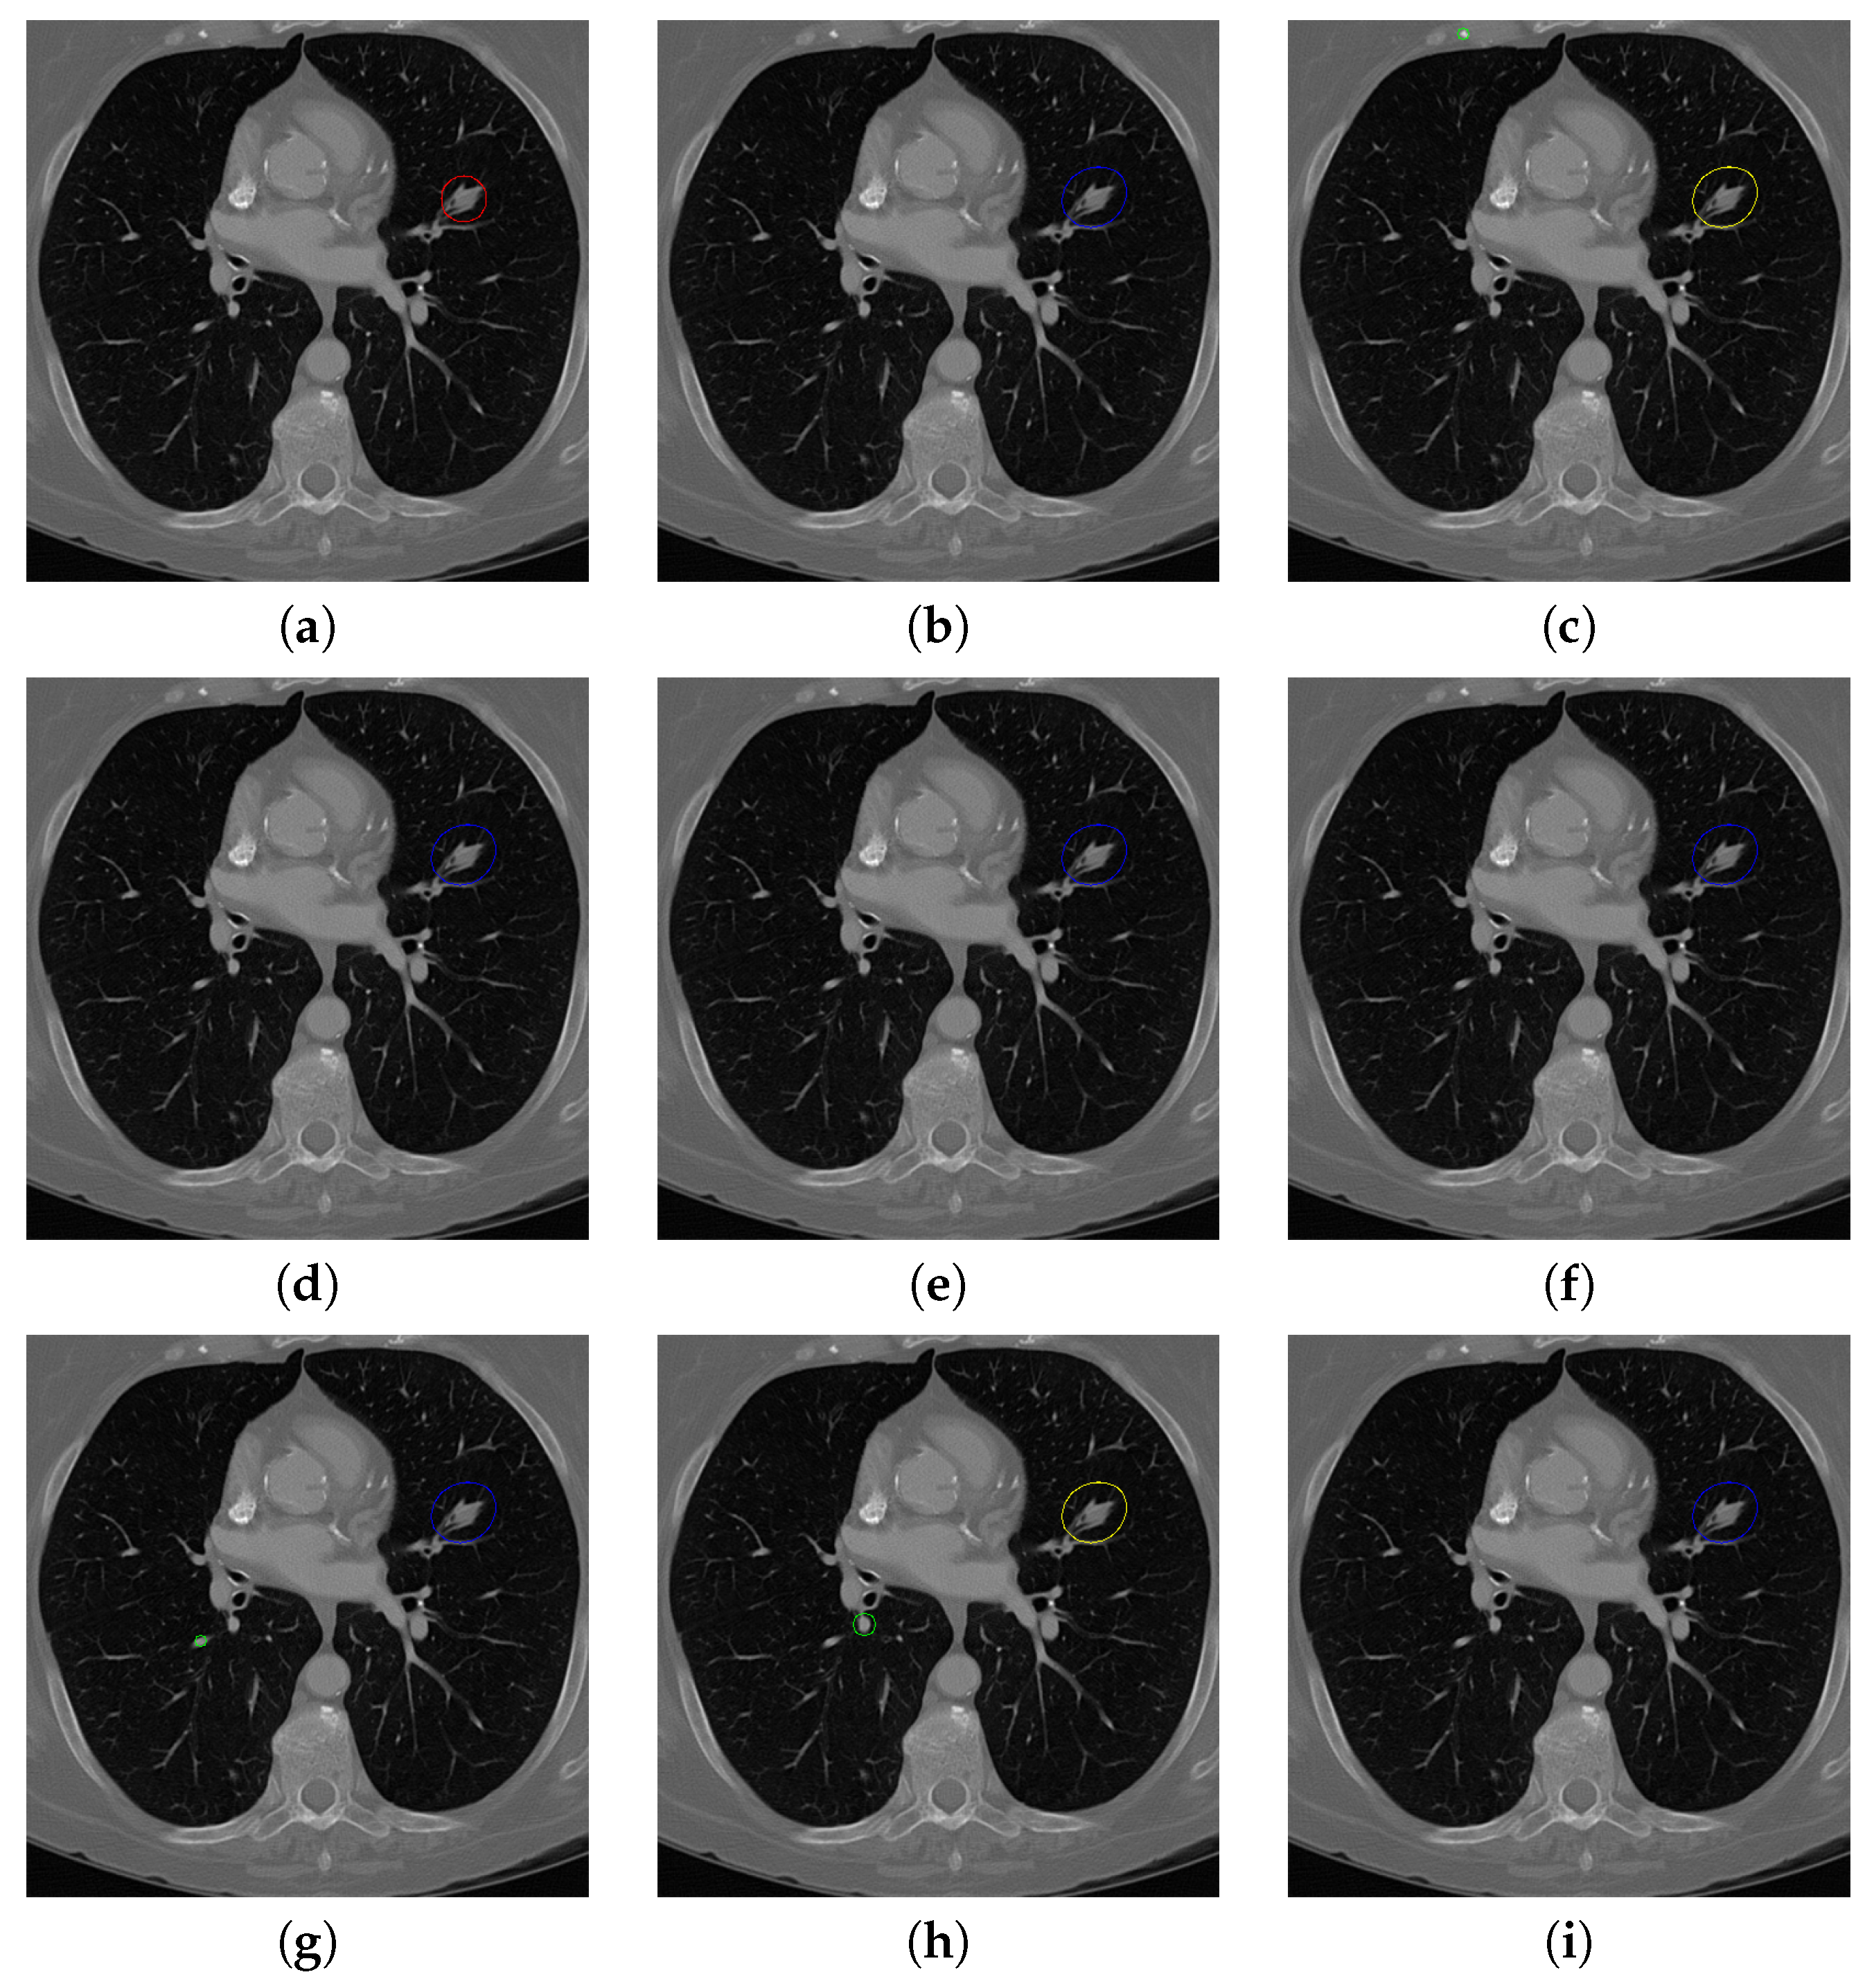
Figure 17.
The result of detecting pulmonary nodules by different methods on one example image in LUNA16 dataset. Red circle represents the ground truth region of nodules, blue circles represent the correct estimation of pulmonary nodules, green circles represent the over-detected nodules, while yellow circles denote the nodules being omitted. (a–i) are: ground truth nodule in the given chest CT image, nodule detected by 3D-FCN, MR-CNN, 3D-UNET, PRN-HSN, DCNN, CLAHE-SVM, MASK-RCNN and our proposed method.
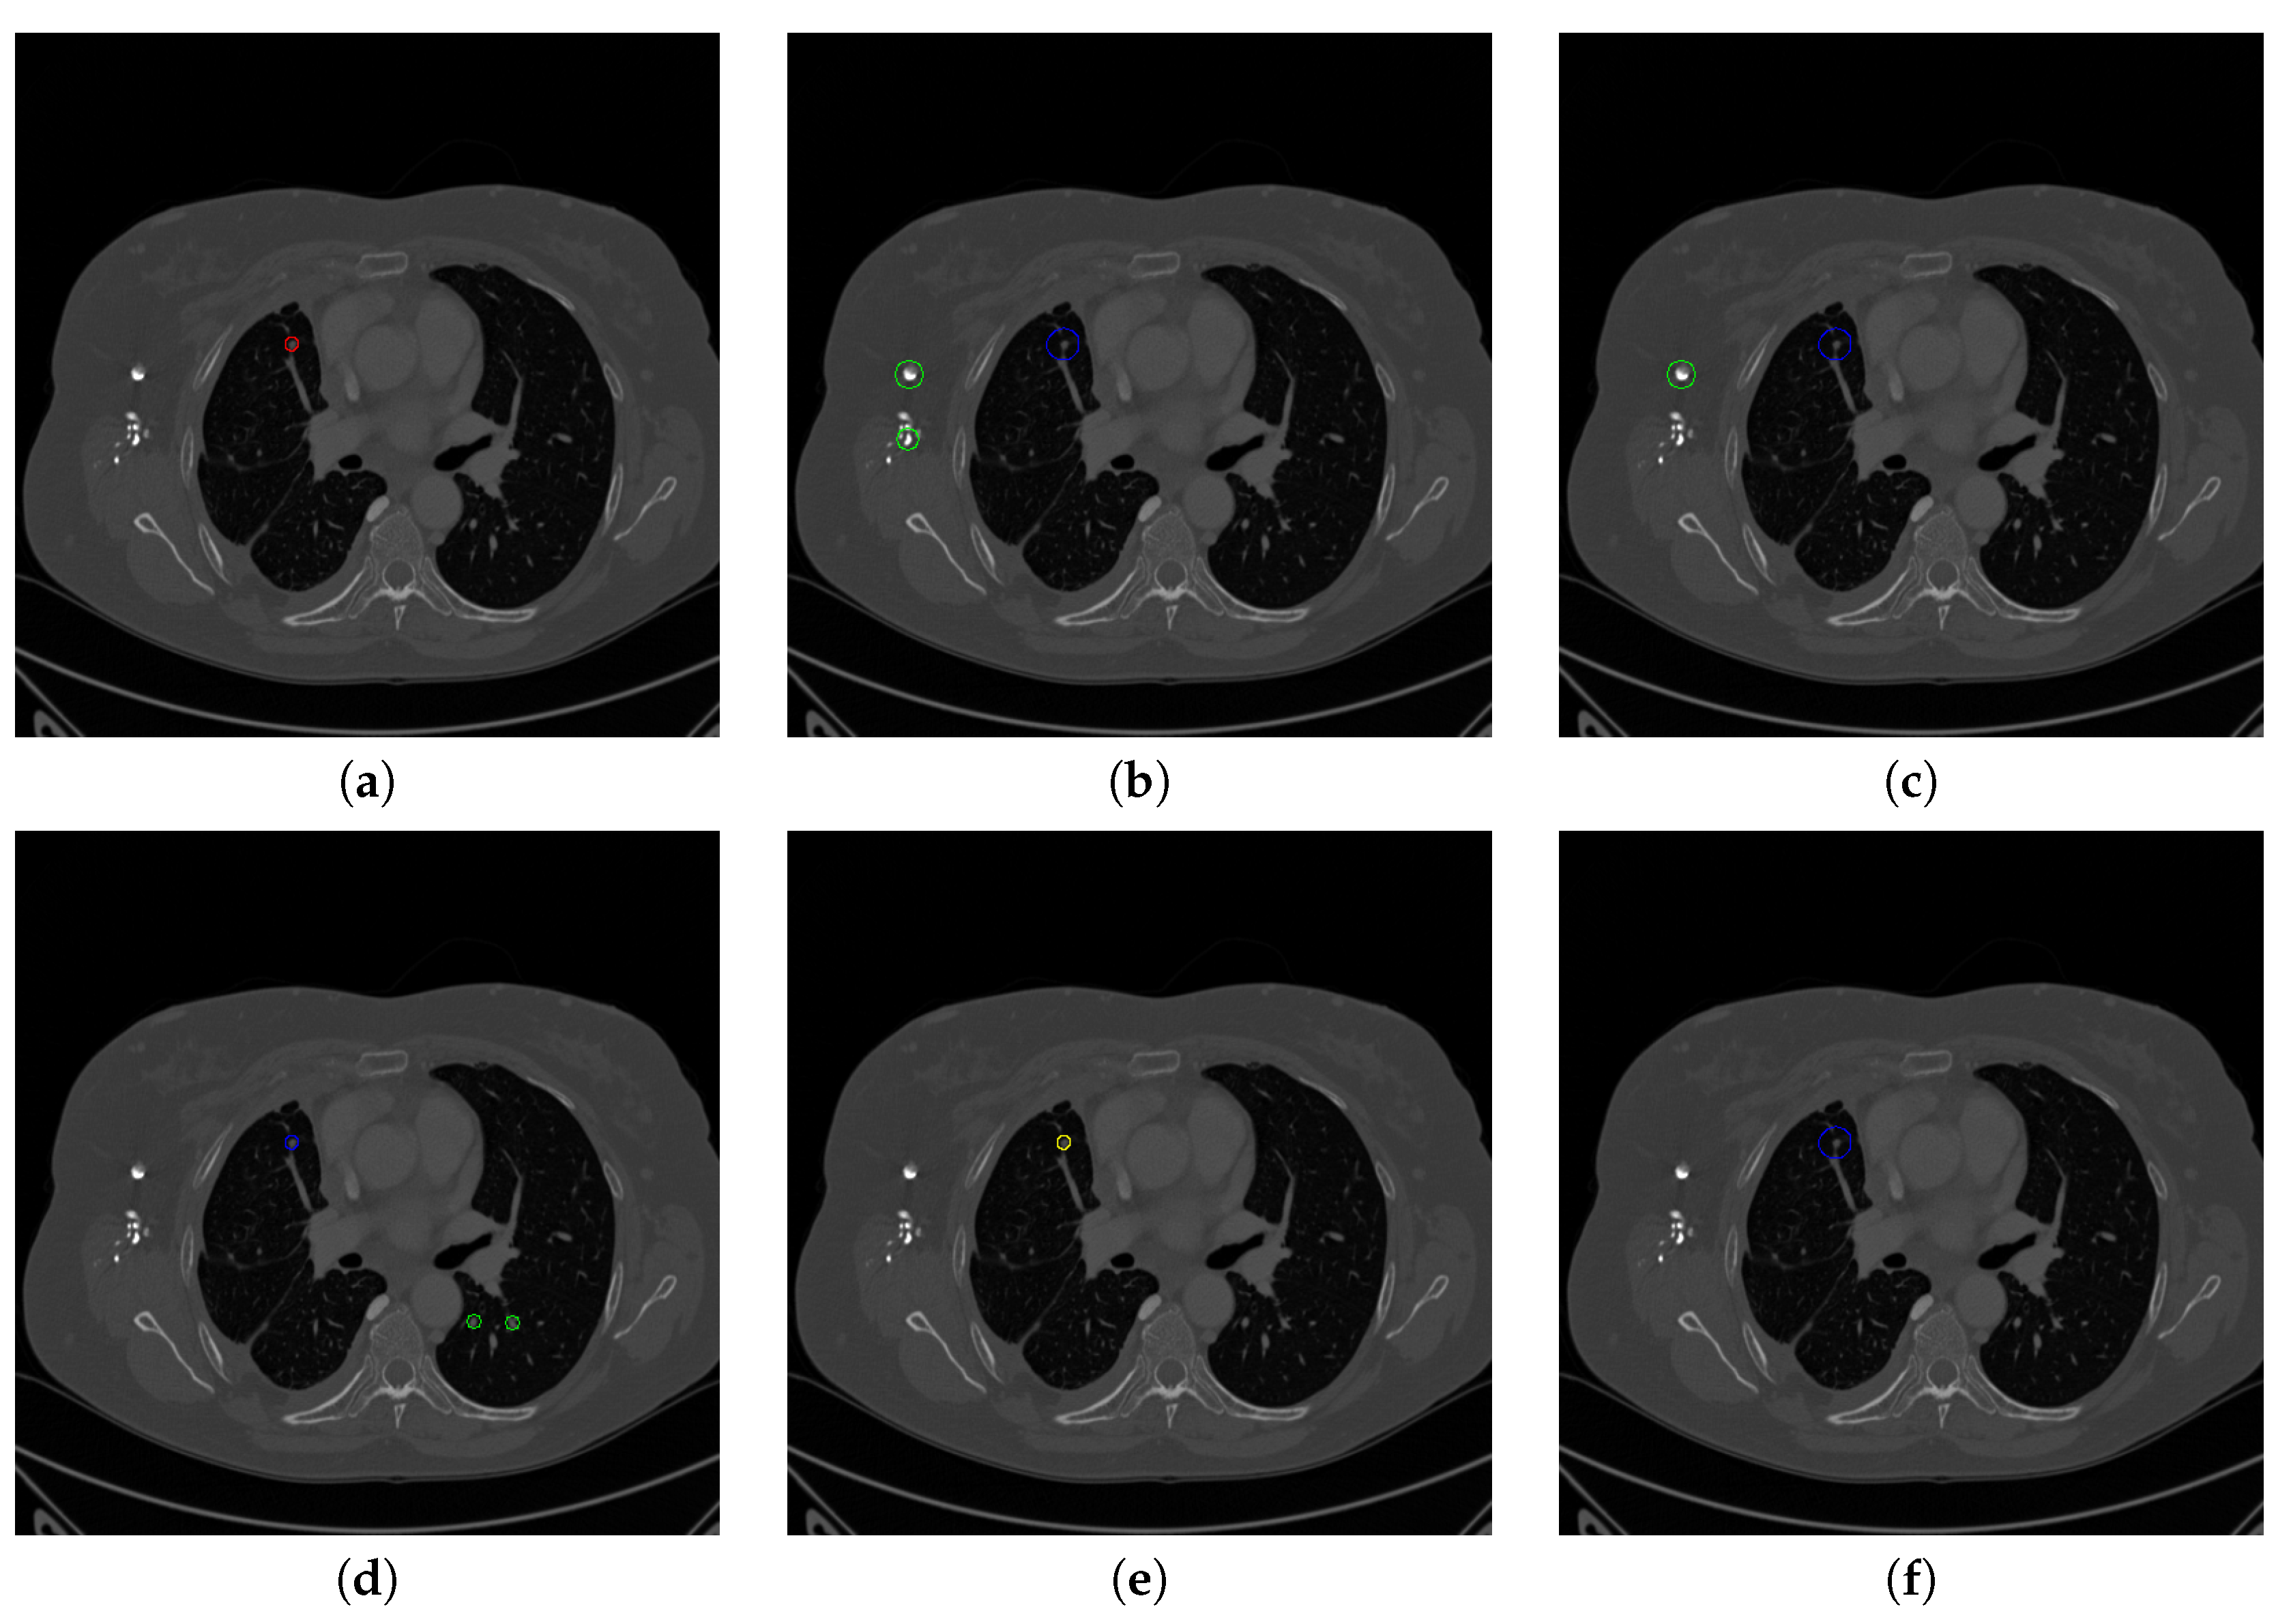
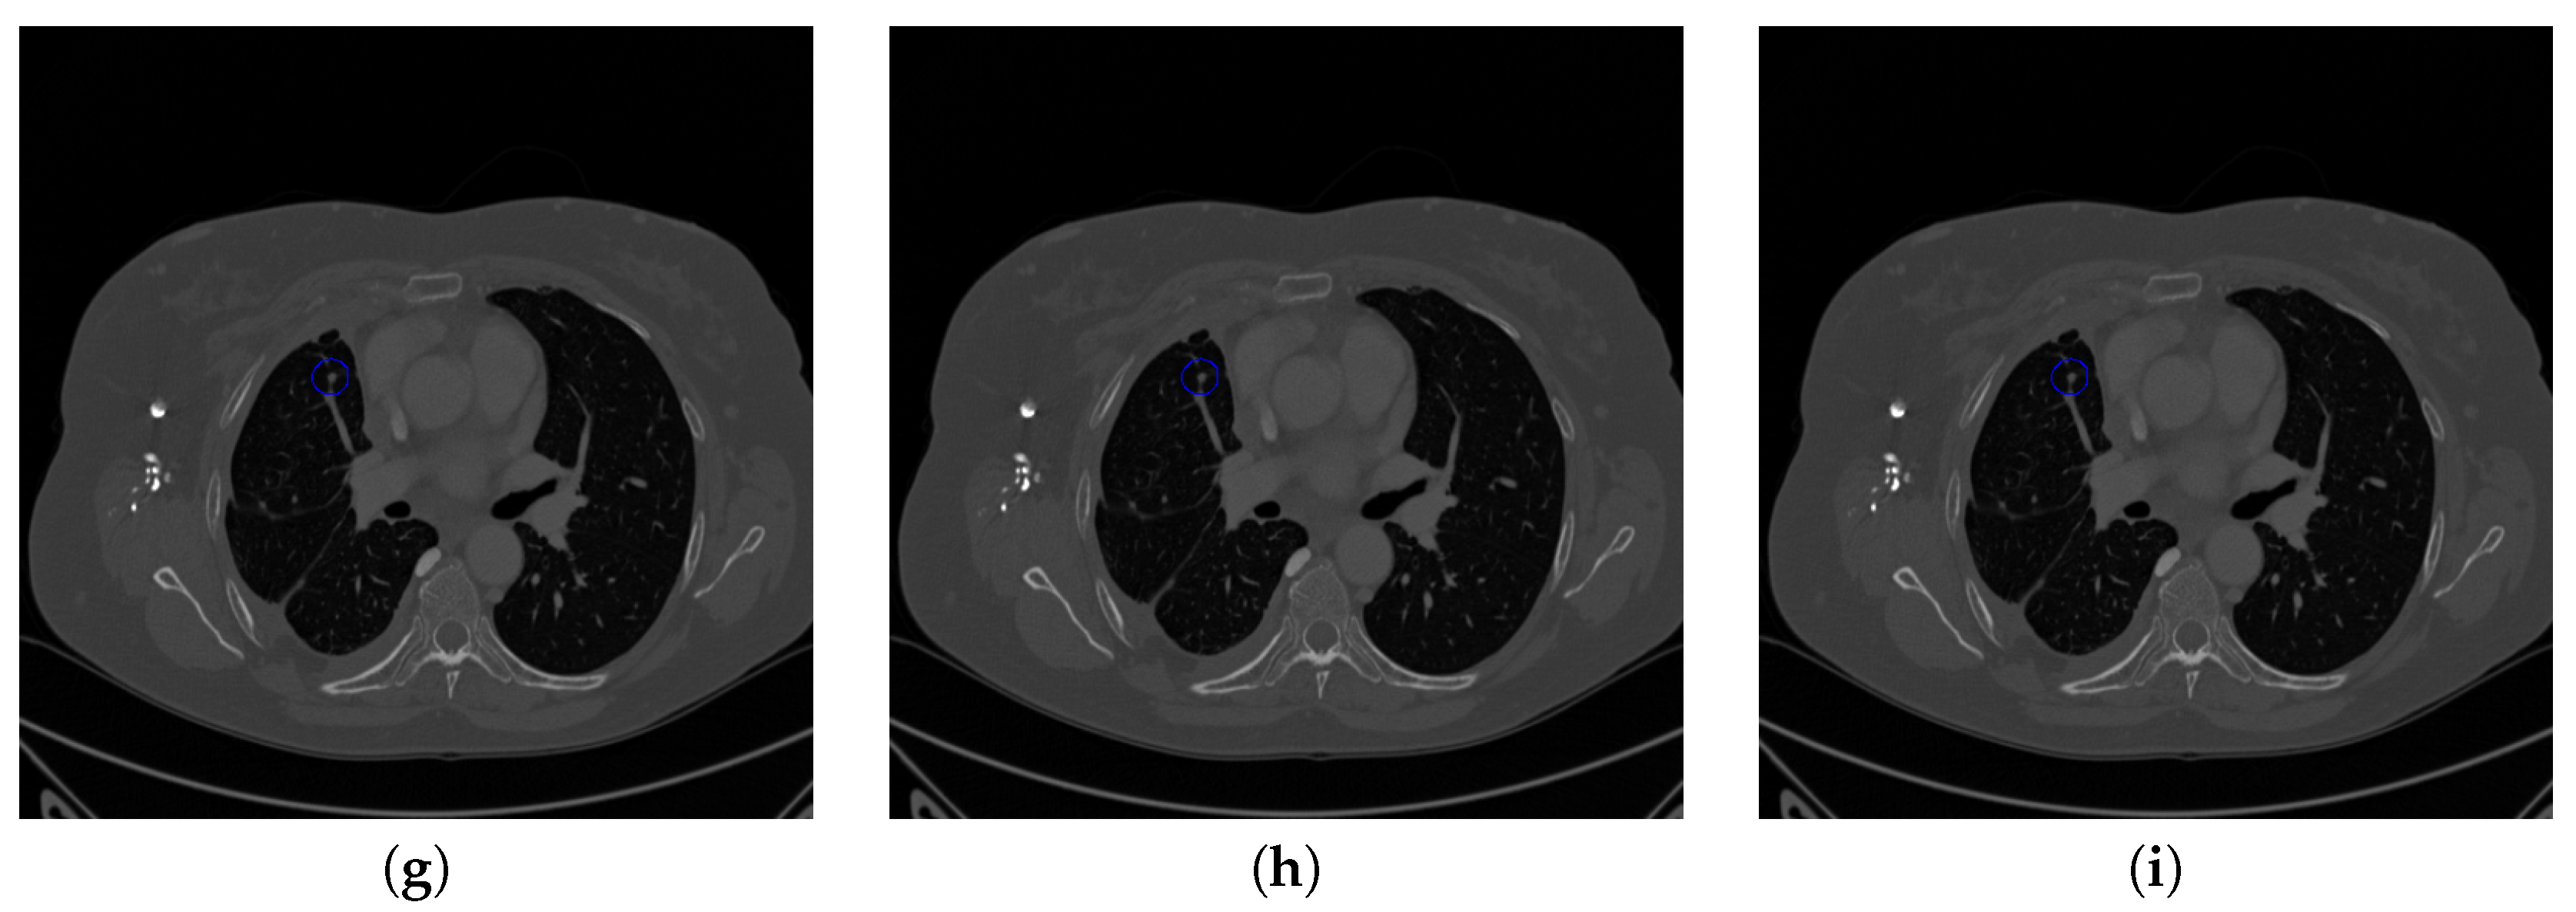
Figure 18.
The result of detecting pulmonary nodules by different methods on another example image in LUNA16 dataset. Red circle represents the ground truth region of nodules, blue circles represent the correct estimation of pulmonary nodules, green circles represent the over-detected nodules, while yellow circles denote the nodules being omitted. (a–i) are: ground truth nodule in the given chest CT image, nodule detected by 3D-FCN, MR-CNN, 3D-UNET, PRN-HSN, DCNN, CLAHE-SVM, MASK-RCNN and our proposed method.
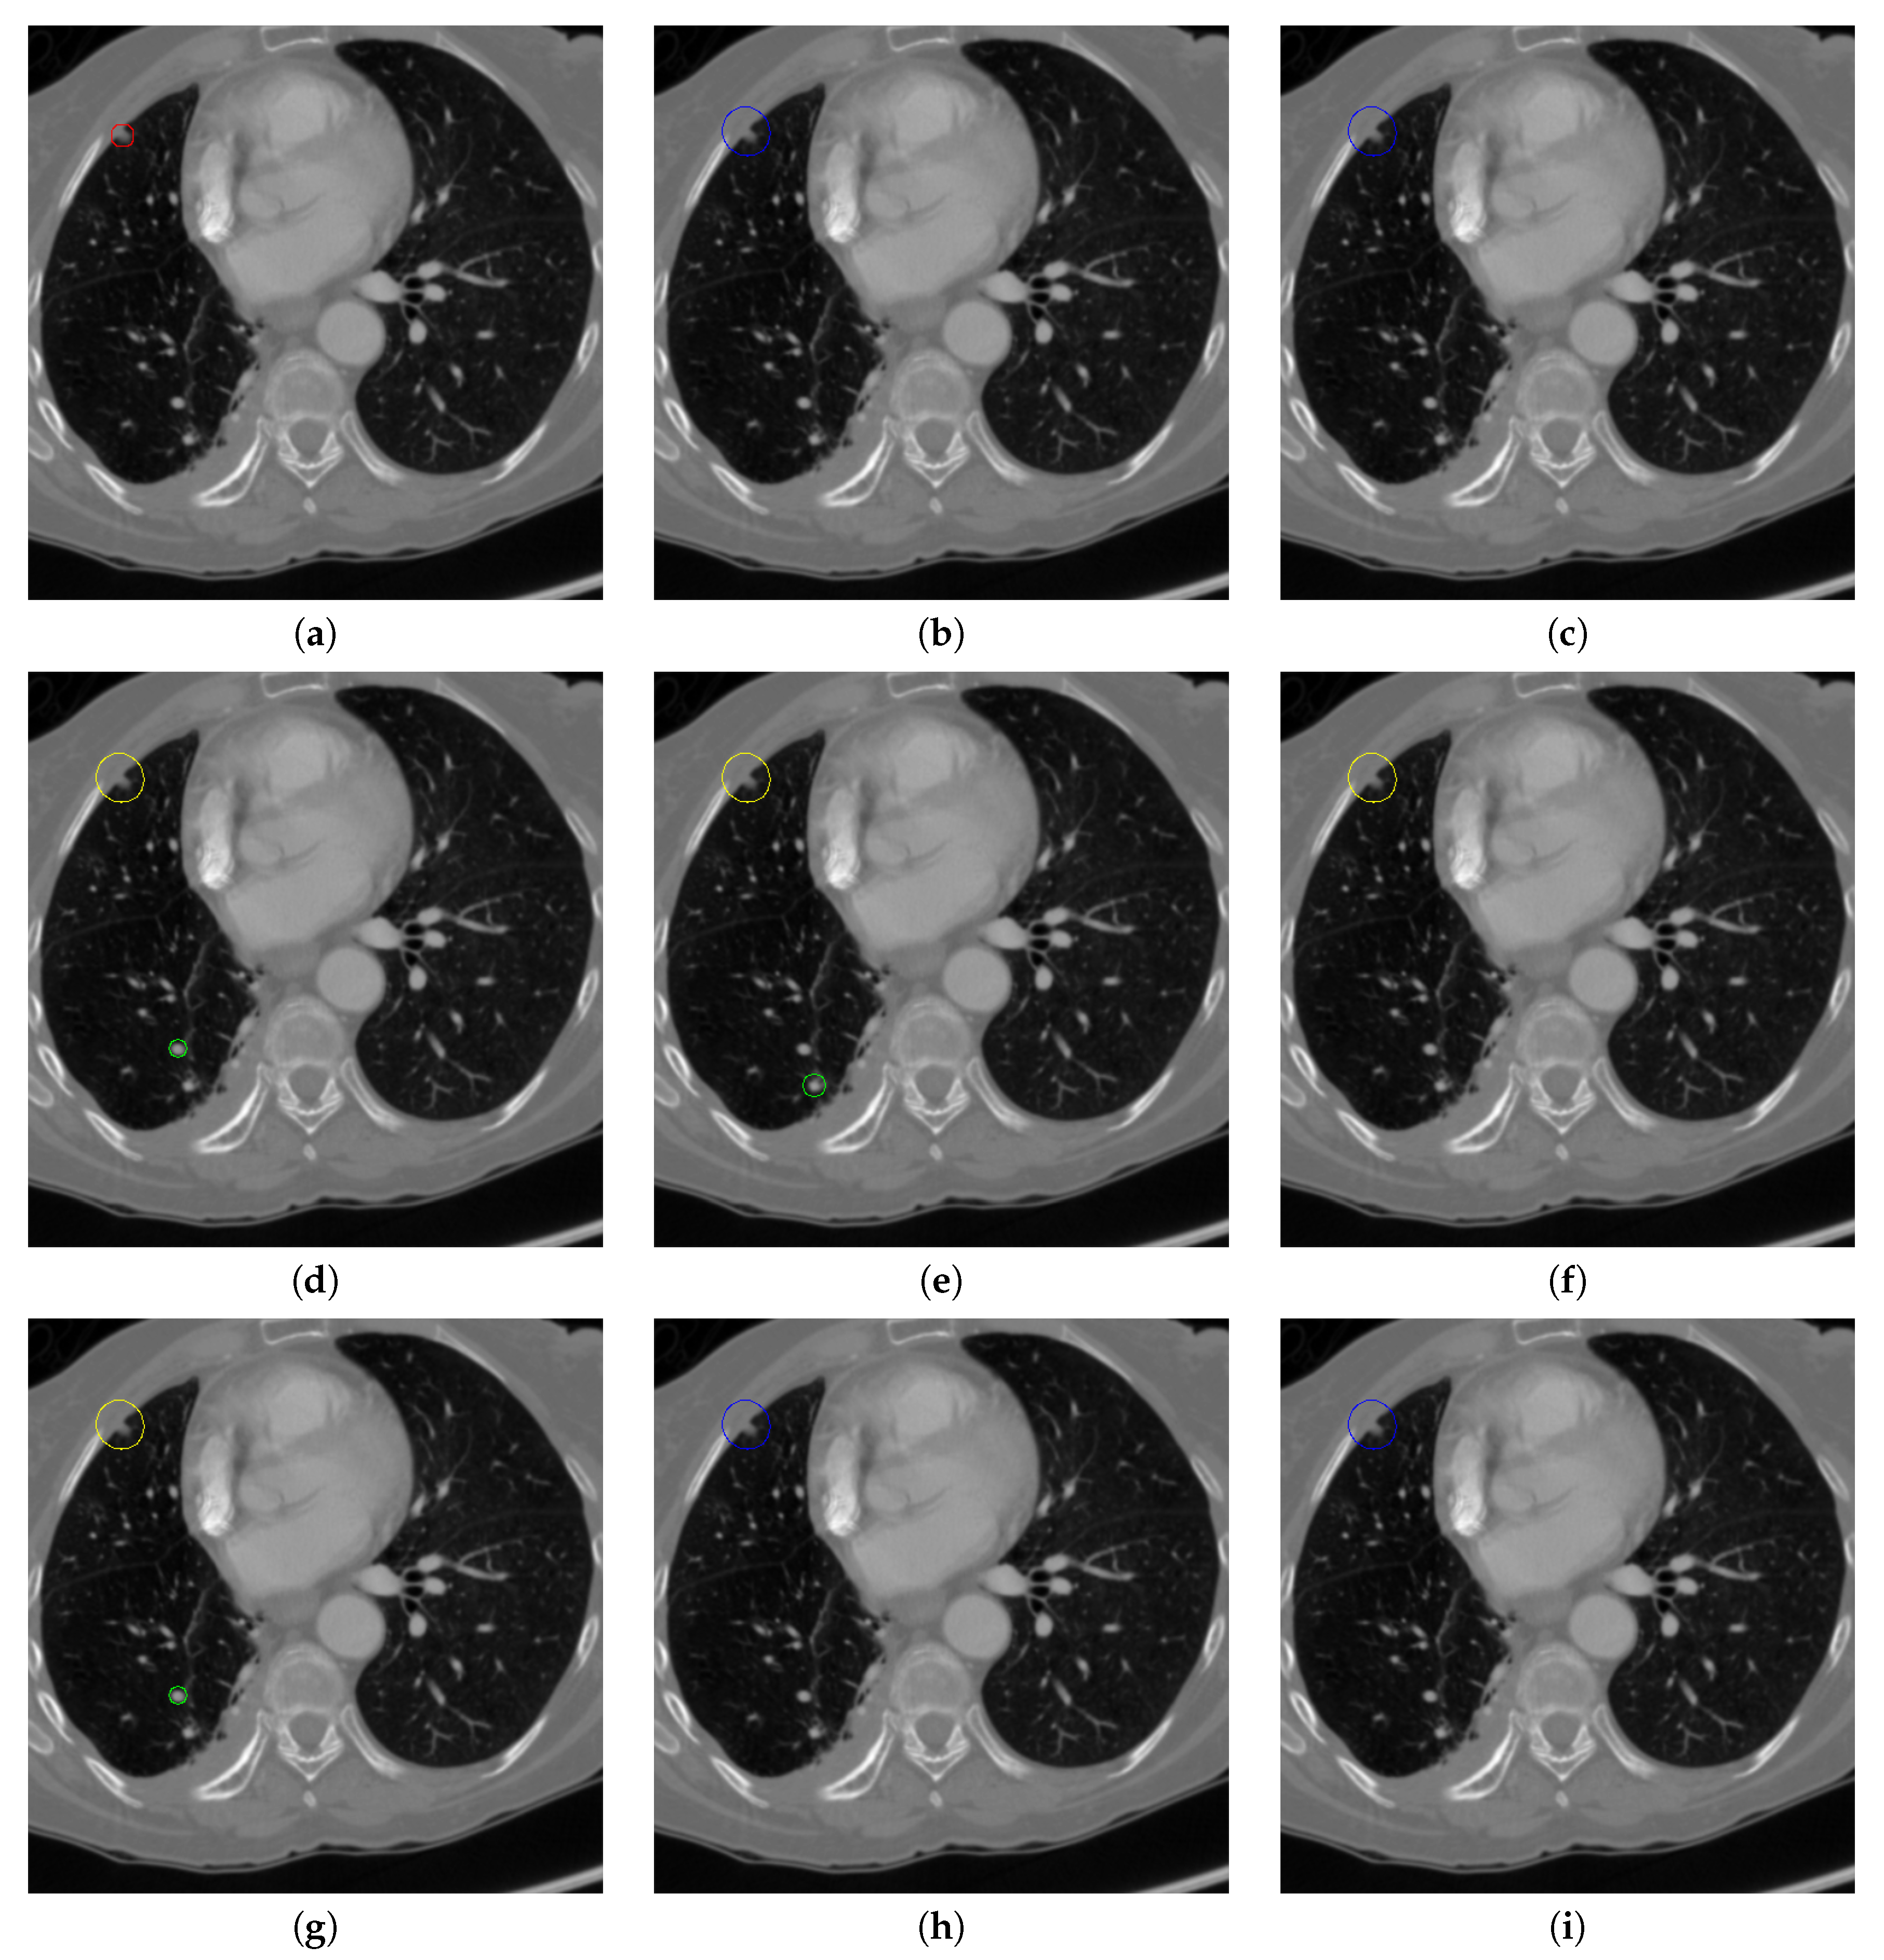
Figure 19.
The result of detecting pulmonary nodules by different methods on one example image in TianChi dataset. Red circle represents the ground truth region of nodules, blue circles represent the correct estimation of pulmonary nodules, green circles represent the over-detected nodules, while yellow circles denote the nodules being omitted. (a–i) are: ground truth nodule in the given chest CT image, nodule detected by 3D-FCN, MR-CNN, 3D-UNET, PRN-HSN, DCNN, CLAHE-SVM, MASK-RCNN and our proposed method.
Figure 20.
The result of detecting pulmonary nodules by different methods on another example image in TianChi dataset. Red circle represents the ground truth region of nodules, blue circles represent the correct estimation of pulmonary nodules, green circles represent the over-detected nodules, while yellow circles denote the nodules being omitted. (a–i) are: ground truth nodule in the given chest CT image, nodule detected by 3D-FCN, MR-CNN, 3D-UNET, PRN-HSN, DCNN, CLAHE-SVM, MASK-RCNN and our proposed method.
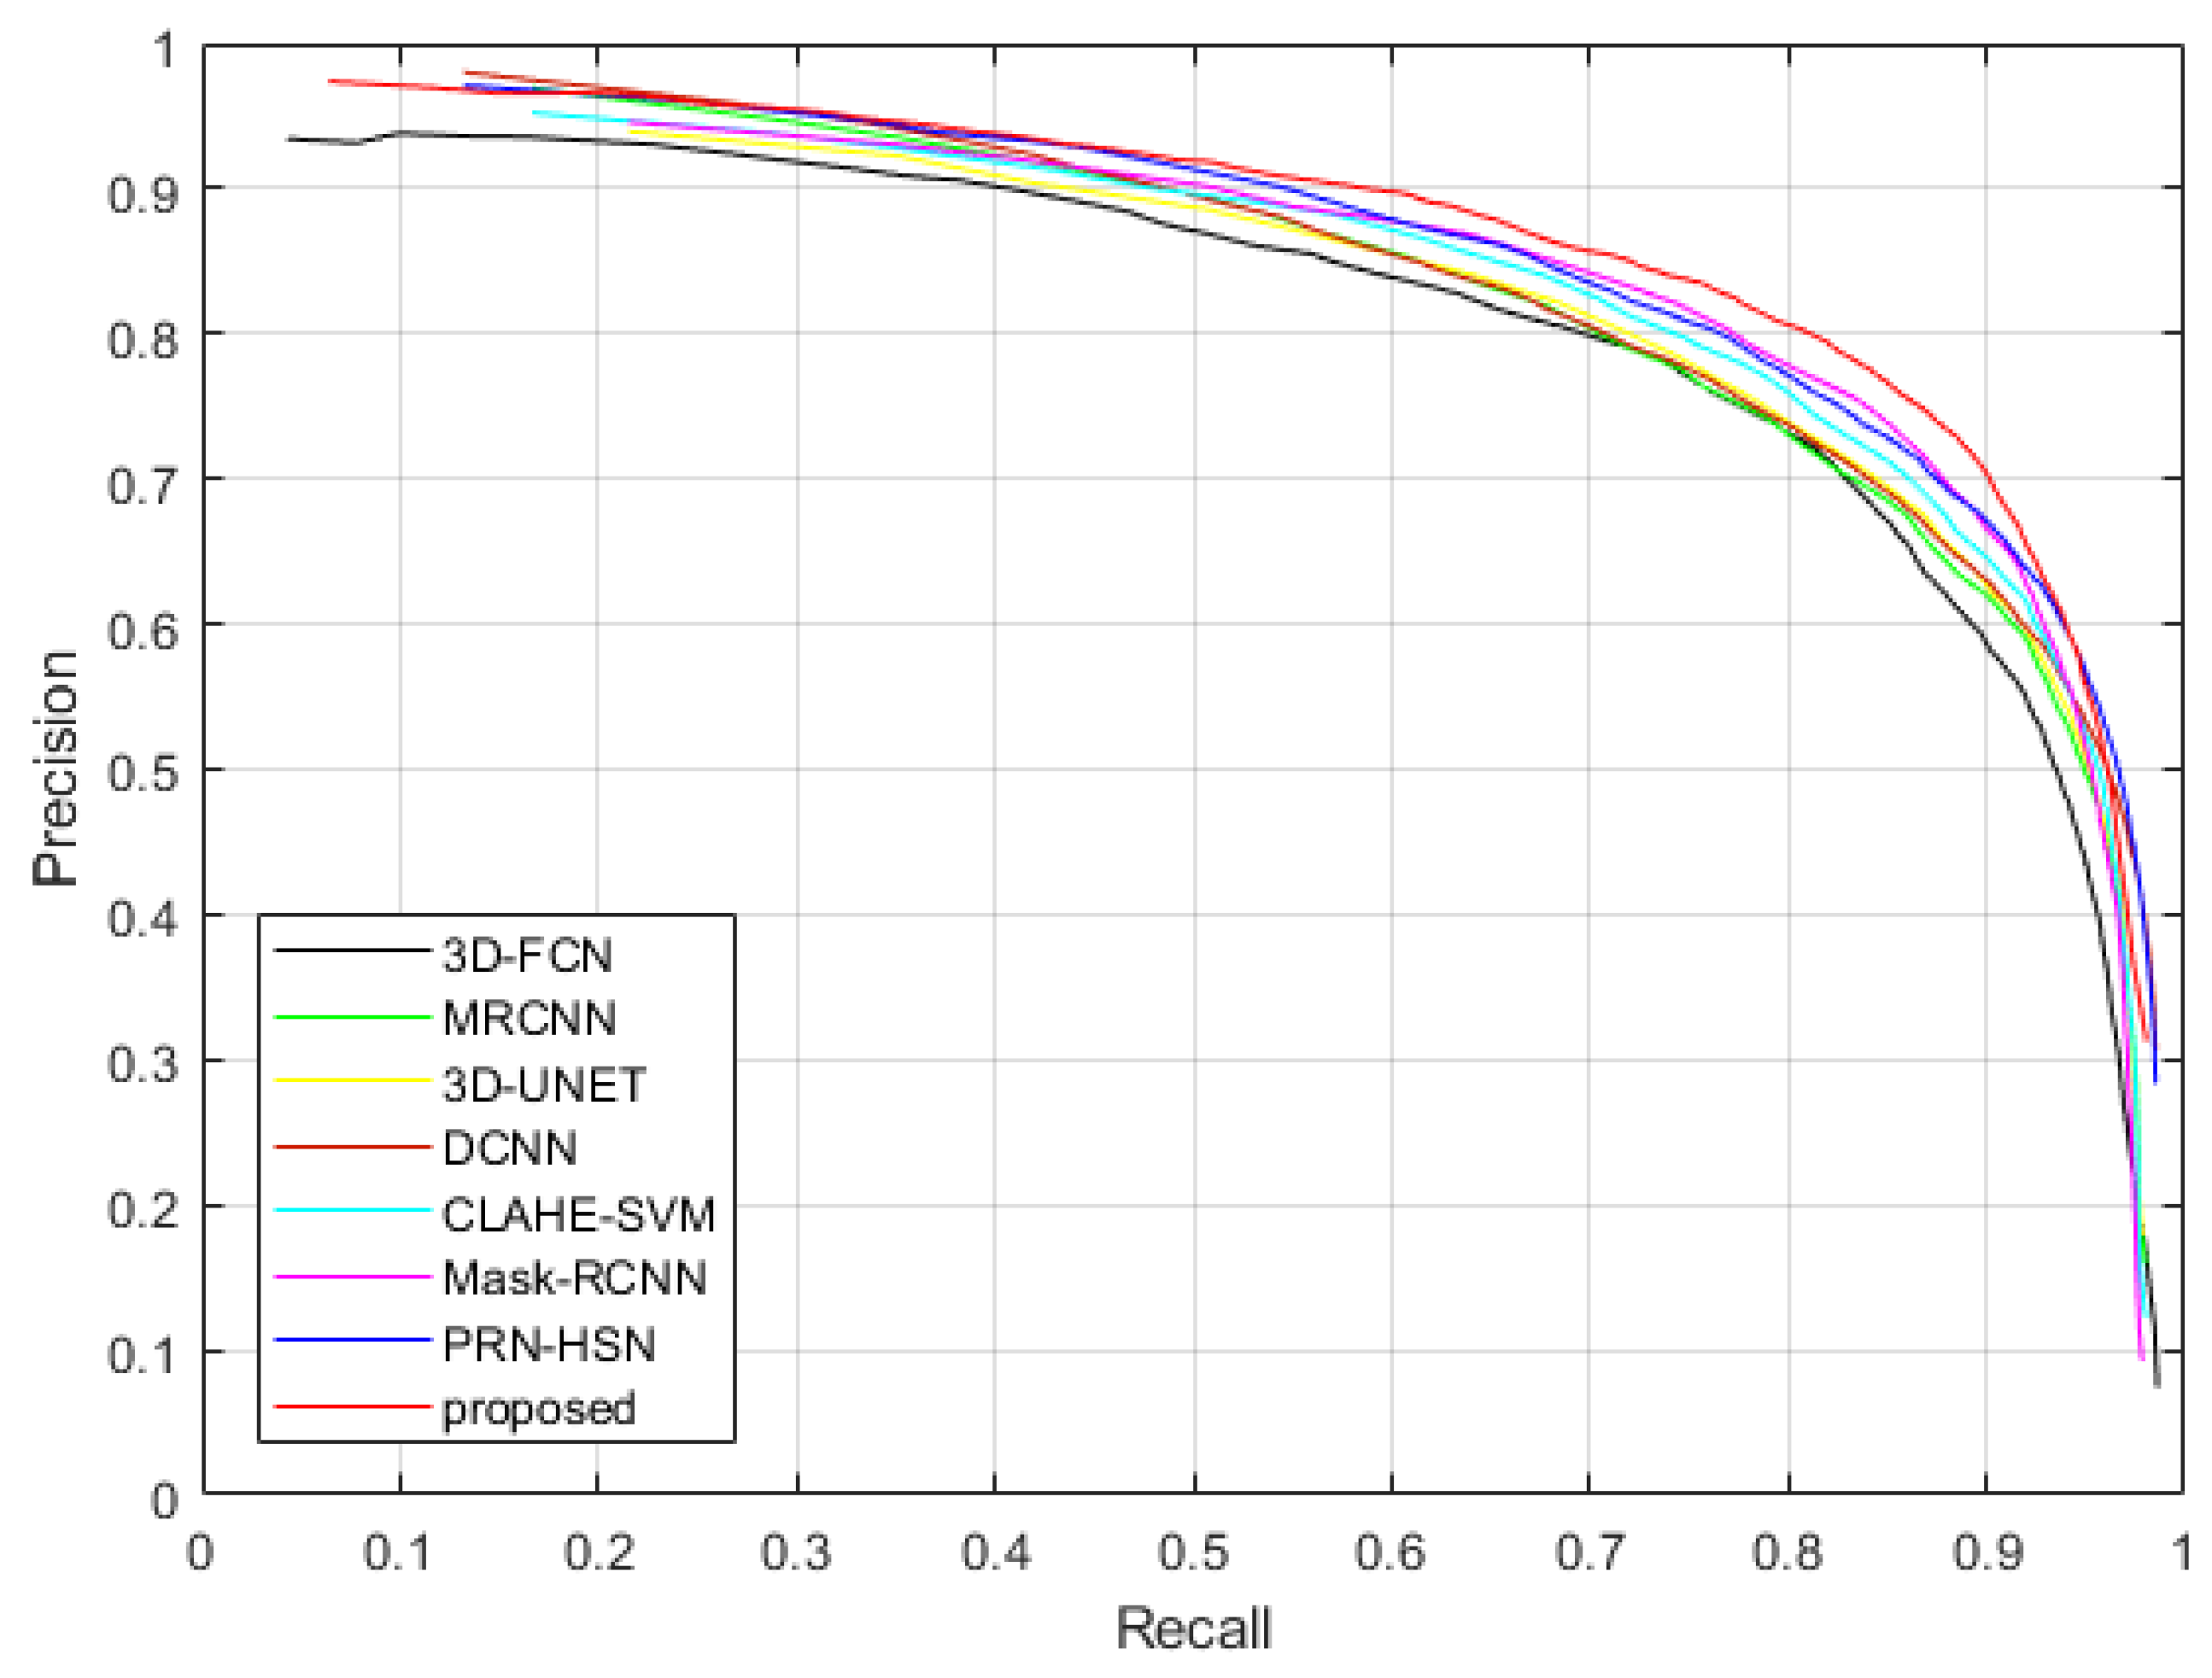
Figure 21.
The Precision-Recall curves of applying different methods to detect nodules in the testing dataset of LUNA16 dataset.
Figure 21.
The Precision-Recall curves of applying different methods to detect nodules in the testing dataset of LUNA16 dataset.
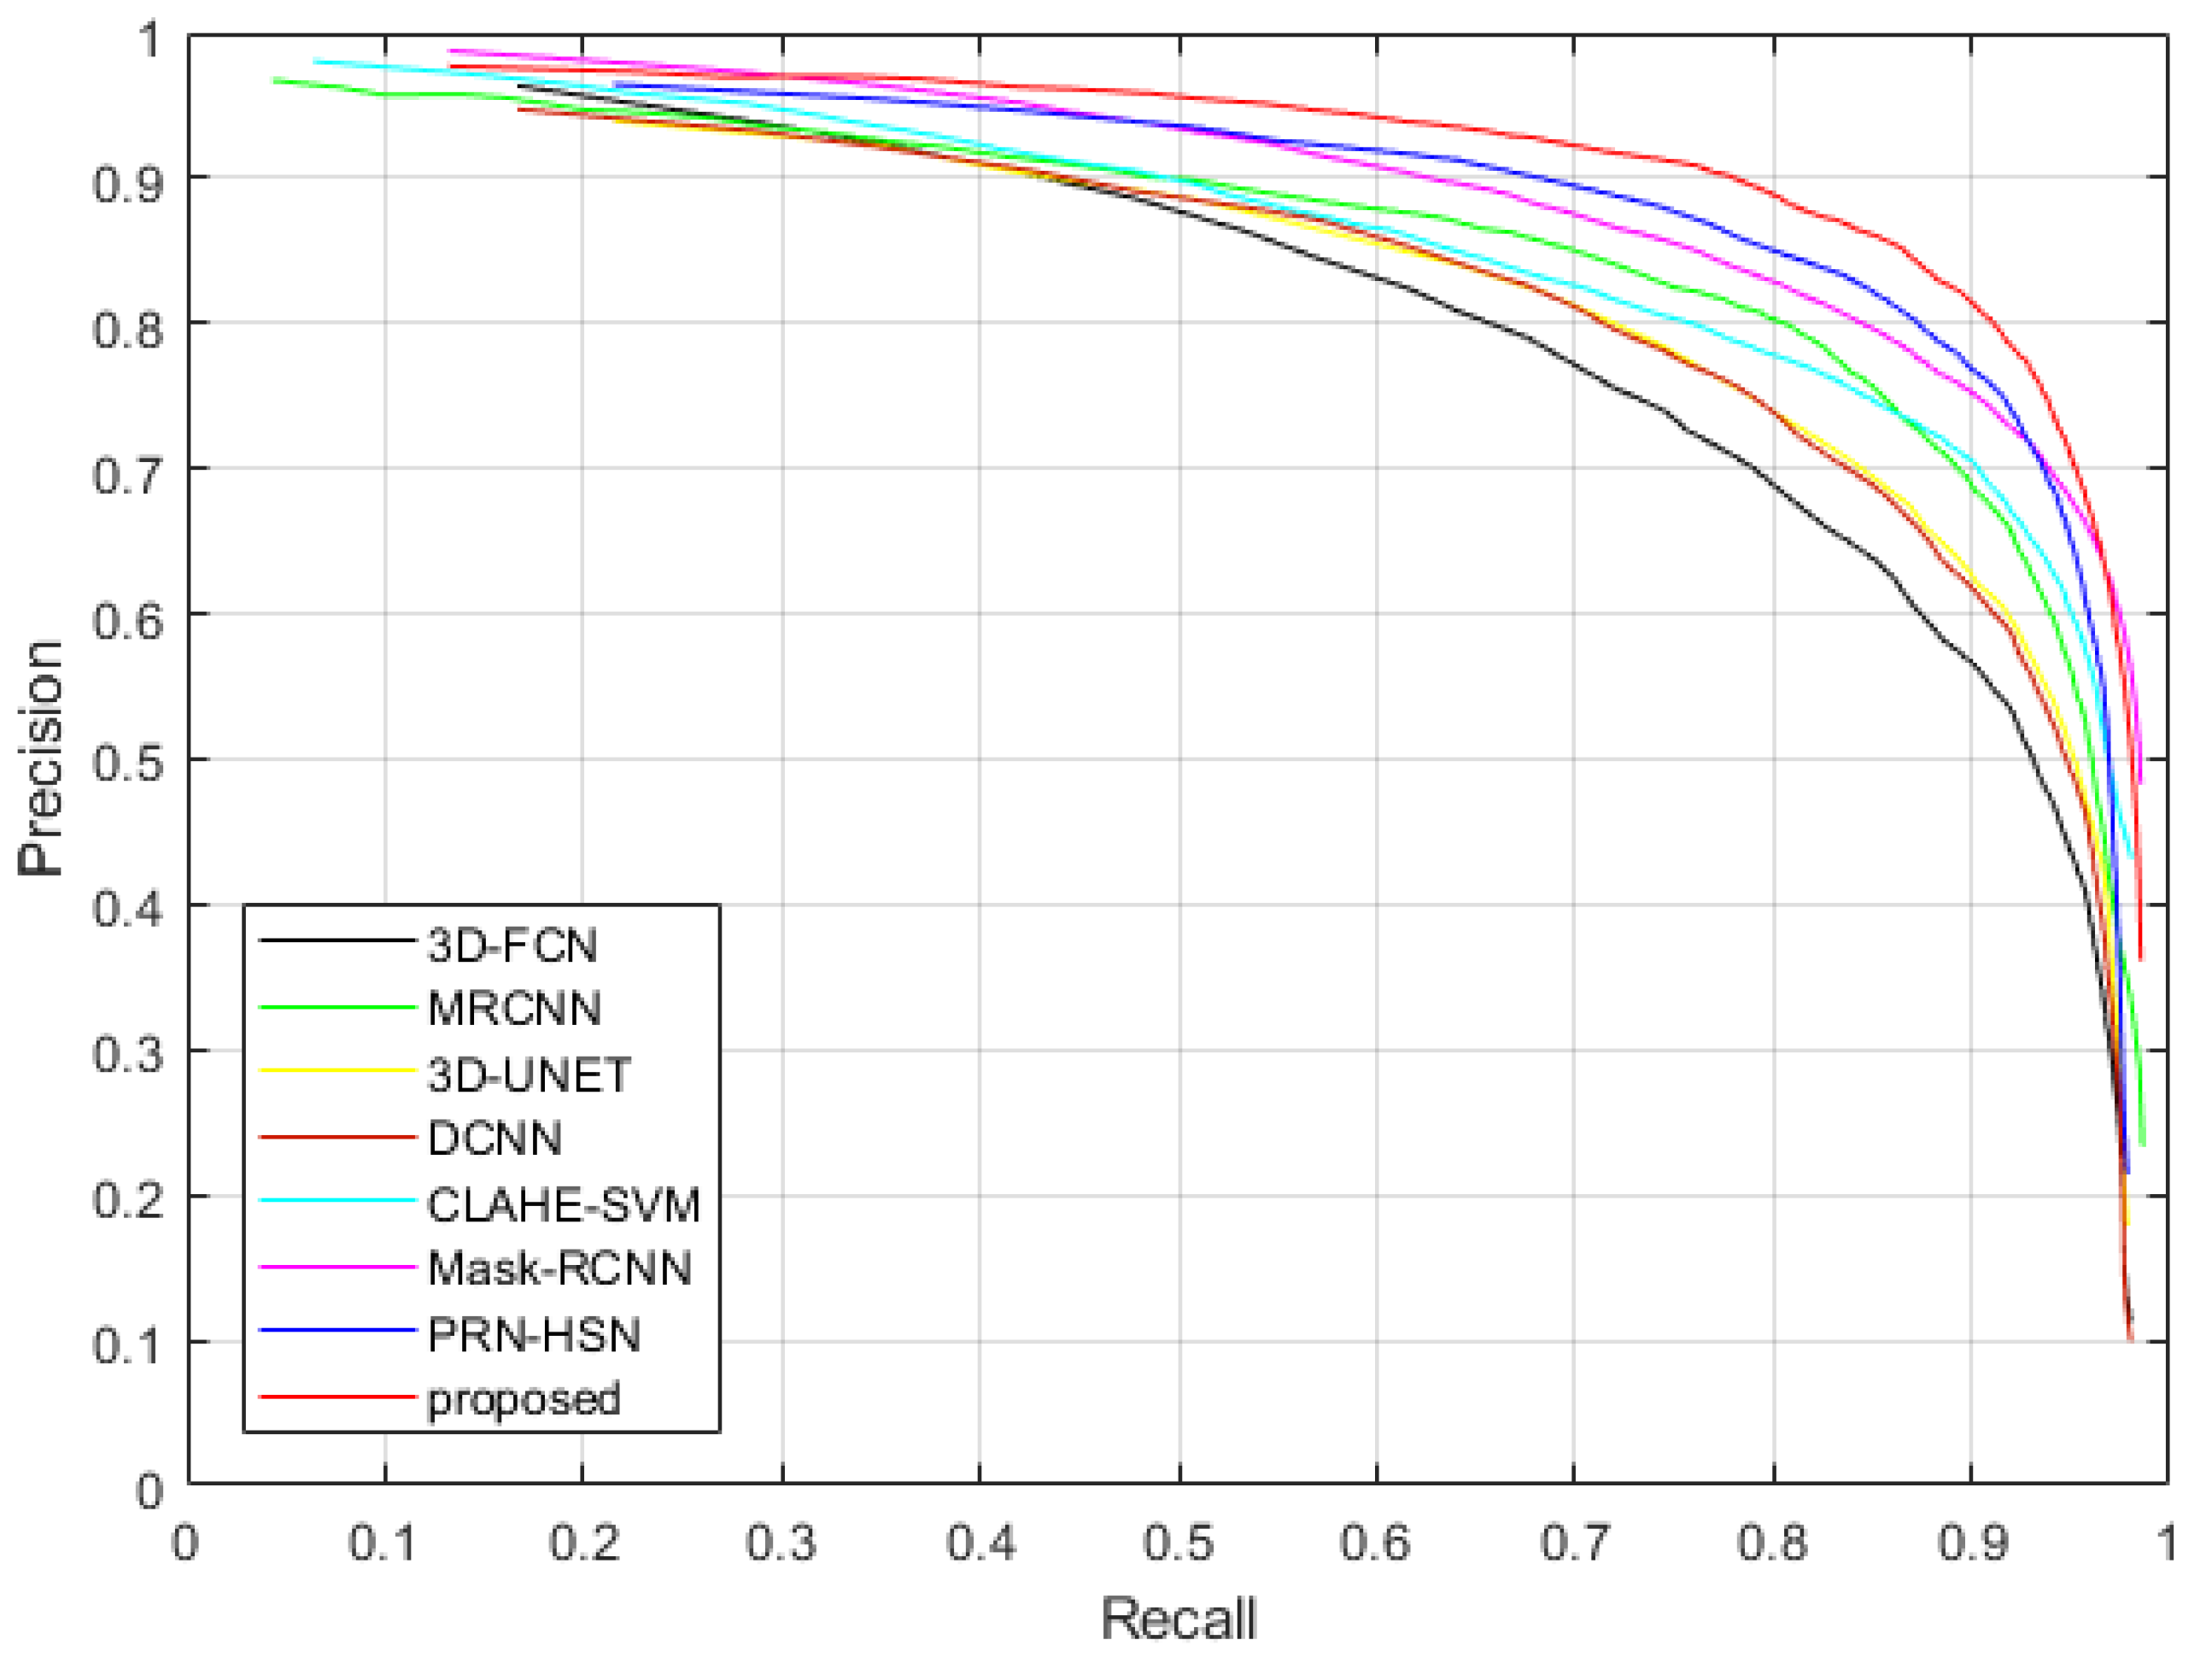
Figure 22.
The Precision-Recall curves of applying different methods to detect nodules in the testing dataset of TianChi dataset.
Figure 22.
The Precision-Recall curves of applying different methods to detect nodules in the testing dataset of TianChi dataset.
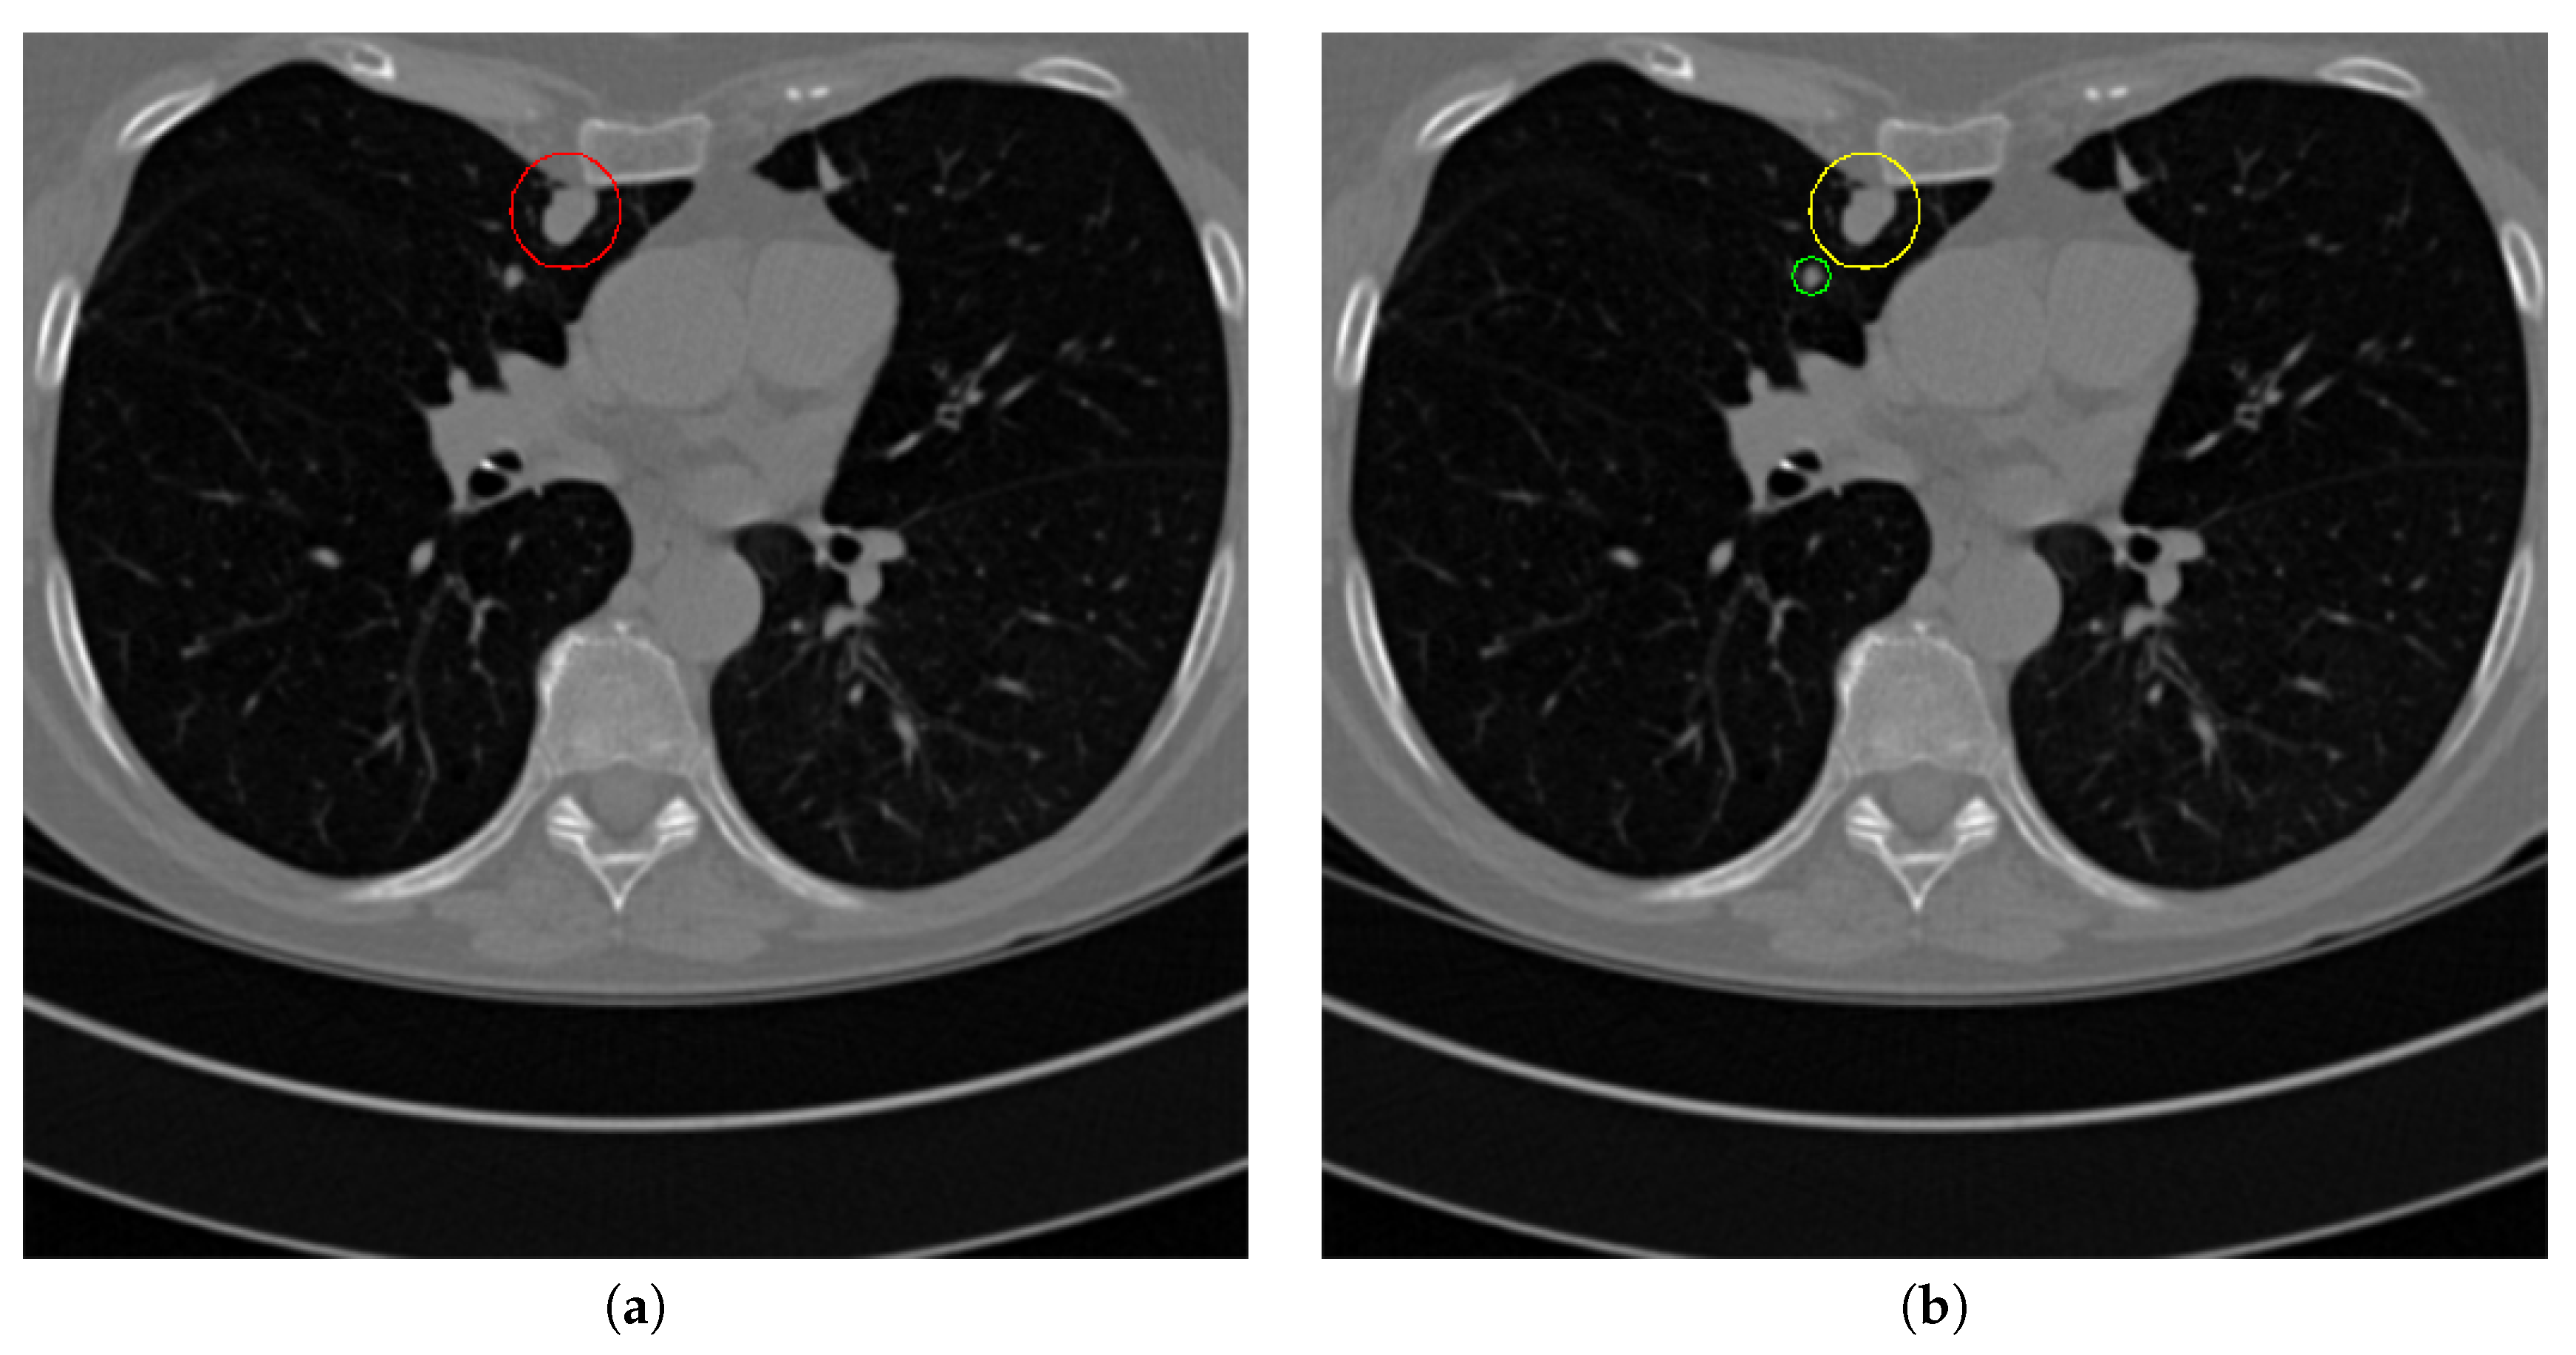
Figure 23.
Failure detection case. (a) is the ground truth nodule detection result, (b) is the nodule detection by the proposed method. Red circle represents the ground truth region of nodule, green circle represents the over-detected nodule, while yellow circle denotes the nodule being omitted.
Figure 23.
Failure detection case. (a) is the ground truth nodule detection result, (b) is the nodule detection by the proposed method. Red circle represents the ground truth region of nodule, green circle represents the over-detected nodule, while yellow circle denotes the nodule being omitted.
Table 1.
Advantages and disadvantages of the comparison methods.
Table 1.
Advantages and disadvantages of the comparison methods.
| Methods | Advantages | Disadvantages |
|---|
| 3D-FCN | Simple implementation | Incorrect determination of non-nodule tissue outside lung as nodule |
| MRCNN | Simple implementation, multi-resolution model is good for small-size nodule detection | Incorrect determination of non-nodule tissue outside lung as nodule |
| 3D-UNET | Lung parenchyma regions are first detected, lower over-estimation rate | Near-edge regions are easily lost, confusion of small tissues as nodules |
| PRN-HSN | Lung parenchyma regions are first detected, lower over-estimation rate | Near-edge regions are easily lost, small-size nodule within weakened, low-resolution region cannot be recognized |
| DCNN | Simple implementation | Small-size nodules on the edges of parenchyma region are easily omitted |
| CLAHE-SVM | Nodules within low-contrast regions can be detected with the contrast-enhancement pre-processing | Small-size tissues are easily over-estimated as nodules |
| Mask-RCNN | Small-size nodules can be detected accurately, nodule detection and segmentation are achieved simultaneously | Heavy computational cost, unstable performance on nodule detection |
| proposed | Pulmonary nodules can be detected accurately with low over-estimation of non-nodule tissues | Nodules within low-contrast, vague regions cannot be detected |
Table 2.
Some key parameters in the lung parenchyma region segmentation sub-network
Table 2.
Some key parameters in the lung parenchyma region segmentation sub-network
| Modules | Parameters |
|---|
| U-Net | Conv1 | , |
| Conv2 | , |
| Conv3 | , |
| Deconv1 | , |
| Deconv2 | , |
| Deconv3 | , |
| Deconv4 | , |
| Inception | Conv1 | , |
| Conv2 | , |
| Conv3 | , |
| Conv4 | , |
| Conv5 | , |
| Conv6 | , |
| Conv7 | , |
| Conv8 | , |
| Conv8 | , |
| Conv8 | , |
Table 3.
Some key parameters in the nodule candidate detection sub-network (m represents the channels of the former layer)
Table 3.
Some key parameters in the nodule candidate detection sub-network (m represents the channels of the former layer)
| Modules | Parameters |
|---|
| U-Net | Conv1 | , |
| Conv2 | , |
| Conv3 | , |
| Conv4 | , |
| Deconv1 | , |
| Deconv2 | , |
| Deconv3 | , |
| Deconv4 | , |
| Inception | Conv1 | , |
| Conv2 | , |
| Conv3 | , |
| Conv4 | , |
| Conv5 | , |
| Dilated convolution | Di-conv1 | , , |
Table 4.
Some key parameters in the nodule determination sub-network (m and c represent the channels of the corresponding former layers)
Table 4.
Some key parameters in the nodule determination sub-network (m and c represent the channels of the corresponding former layers)
| Modules | Parameters |
|---|
| Multi-resolution convolution | Conv1 | , |
| Conv2 | , |
| Conv3 | , |
| Deconv1 | , |
| Deconv2 | , |
| Deconv3 | , |
| Multi-scale pooling | Conv1 | , |
| Conv2 | , |
| Conv3 | , |
| Conv4 | , |
| Conv5 | , |
| Conv6 | , |
| Conv7 | , |
| Conv8 | , |
Table 5.
Quantitative results of detecting parenchyma regions from input chest CT images by the proposed network.
Table 5.
Quantitative results of detecting parenchyma regions from input chest CT images by the proposed network.
| Method | Precision | Sensitivity | Specificity | Dice |
|---|
| Inception-dense U-Net sub-network | 0.8792 | 0.8878 | 0.9590 | 0.8636 |
Table 6.
Quantitative results of detecting nodule candidates from input chest CT images by the proposed network.
Table 6.
Quantitative results of detecting nodule candidates from input chest CT images by the proposed network.
| Method | Sensitivity | Specificity |
|---|
| Dilated-convolution U-Net sub-network | 0.9692 | 0.9078 |
Table 7.
Quantitative results associated with different combinations of losses of the proposed network for detecting nodules from the image
Table 7.
Quantitative results associated with different combinations of losses of the proposed network for detecting nodules from the image
| Methods | Accuracy | Sensitivity | Specificity |
|---|
| MSE | 0.9182 | 0.8502 | 0.9315 |
| MSE-perceptual | 0.9237 | 0.8748 | 0.9327 |
| MSE-perceptual-dice | 0.9390 | 0.8988 | 0.9476 |
Table 8.
Results of detecting pulmonary nodules and running time of using dense block in different sub-networks.
Table 8.
Results of detecting pulmonary nodules and running time of using dense block in different sub-networks.
| Methods | Accuracy | Sensitivity | Specificity | Running Time (s) |
|---|
| Dense block in parenchyma segmentation sub-network | 0.9390 | 0.8988 | 0.9476 | 1.3411 |
| Dense block in parenchyma segmentation and nodule candidate detection sub-networks | 0.9392 | 0.8990 | 0.9480 | 3.2354 |
| Dense block in parenchyma segmentation and nodule determination sub-networks | 0.9395 | 0.8985 | 0.9486 | 3.1563 |
| Dense block in all three sub-networks | 0.9396 | 0.8992 | 0.9485 | 8.1823 |
Table 9.
Quantitative results associated with different nodule detection methods on LUNA16 dataset.
Table 9.
Quantitative results associated with different nodule detection methods on LUNA16 dataset.
| Methods | Accuracy | Sensitivity | Specificity | AUC |
|---|
| 3D-FCN | 0.8975 | 0.8261 | 0.9295 | 0.9027 |
| MRCNN | 0.9162 | 0.8487 | 0.9371 | 0.9173 |
| 3D-UNET | 0.9176 | 0.8516 | 0.9394 | 0.9259 |
| PRN-HSN | 0.9286 | 0.8782 | 0.9430 | 0.9371 |
| DCNN | 0.9170 | 0.8496 | 0.9388 | 0.9195 |
| CLAHE-SVM | 0.9251 | 0.8672 | 0.9415 | 0.9328 |
| Mask-RCNN | 0.9291 | 0.8806 | 0.9447 | 0.9396 |
| proposed | 0.9390 | 0.8988 | 0.9476 | 0.9615 |
Table 10.
Quantitative results associated with different nodule detection methods on TianChi dataset.
Table 10.
Quantitative results associated with different nodule detection methods on TianChi dataset.
| Methods | Accuracy | Sensitivity | Specificity | AUC |
|---|
| 3D-FCN | 0.9087 | 0.8358 | 0.9387 | 0.9136 |
| MRCNN | 0.9259 | 0.8568 | 0.9468 | 0.9261 |
| 3D-UNET | 0.9297 | 0.8607 | 0.9498 | 0.9339 |
| PRN-HSN | 0.9356 | 0.8853 | 0.9547 | 0.9462 |
| DCNN | 0.9288 | 0.8598 | 0.9485 | 0.9287 |
| CLAHE-SVM | 0.9353 | 0.8781 | 0.9542 | 0.9407 |
| Mask-RCNN | 0.9389 | 0.8913 | 0.9596 | 0.9579 |
| proposed | 0.9475 | 0.9036 | 0.9655 | 0.9722 |
Table 11.
The running time of applying different methods in detecting nodules.
Table 11.
The running time of applying different methods in detecting nodules.
| Methods | 3D-FCN | MRCNN | 3D-UNET | PRN-HSN | DCNN | CLAHE-SVM | Mask-RCNN | proposed |
| Time(s) | 1.9134 | 1.0975 | 1.6324 | 1.1270 | 1.0753 | 1.0572 | 1.5985 | 1.3411 |


