Article

Solar Blue Light Radiation Enhancement during Mid to Low Solar Elevation Periods under Cloud Affected Skies

1
Faculty of Health, Engineering and Sciences, University of Southern Queensland, Toowoomba 4350, Australia
2
Centre for Applied Climate Sciences, University of Southern Queensland, Toowoomba 4350, Australia
*
Author to whom correspondence should be addressed.
Sensors 2020, 20(15), 4105; https://doi.org/10.3390/s20154105
Submission received: 18 June 2020 / Revised: 13 July 2020 / Accepted: 22 July 2020 / Published: 23 July 2020
(This article belongs to the Special Issue Solar Irradiance Sensors)

Abstract

:
Solar blue-violet wavelengths (380−455 nm) are at the high energy end of the visible spectrum; referred to as “high energy visible” (HEV). Both chronic and acute exposure to these wavelengths has been often highlighted as a cause for concern with respect to ocular health. The sun is the source of HEV which reaches the Earth’s surface either directly or after scattering by the atmosphere and clouds. This research has investigated the effect of clouds on HEV for low solar elevation (solar zenith angles between 60° and 80°), simulating time periods when the opportunity for ocular exposure in global populations with office jobs is high during the early morning and late afternoon. The enhancement of “bluing” of the sky due to the influence of clouds was found to increase significantly with the amount of cloud. A method is presented for calculating HEV irradiance at sub-tropical latitudes from the more commonly measured global solar radiation (300–3000 nm) for all cases when clouds do and do not obscure the sun. The method; when applied to global solar radiation data correlates well with measured HEV within the solar zenith angle range 60° and 80° (R2 = 0.82; mean bias error (MBE) = −1.62%, mean absolute bias error (MABE) = 10.3% and root mean square error (RMSE) = 14.6%). The technique can be used to develop repeatable HEV hazard evaluations for human ocular health applications

1. Introduction

The blue region (380−500 nm) of the visible waveband possesses the highest energy within the scotopic limits of human vision. The shorter blue-violet wavelengths within this range (380−455 nm) are sometimes referred to as high energy visible (HEV) radiation [1,2]. At the terrestrial surface, the action spectrum for blue light hazard peaks at approximately 440 nm [3,4] and is associated with what is frequently referred as the “blue light hazard”. In contrast to blue-violet wavelengths that have higher energy, the green-yellow wavelengths associated with photopic vision have lower energy as the photopic action spectrum peaks at about 555 nm. These wavelengths are beneficial to the regulation of human circadian rhythms and colour perception [2]. Recently, the International Commission of Illumination [5] issued a position statement to mitigate confusion and misuse of the term “blue light hazard”, stating that the term is only to be used in circumstances where actual retinal photochemical injury occurs. As this research does not measure retinal injury, the term “HEV” will be used throughout.
HEV transmits through the cornea and crystalline lens to the retina [1,2,3,6,7,8,9]. Intense or long duration of exposure to strong HEV sources is hazardous and could lead to photochemical damage of the retina. This damage is referred to as “photoretinitis” [4,7,10,11,12,13], also known as “photoretinopathy” [3,11] or photomaculopathy [5,14,15]. Prolonged exposure to HEV has the potential to contribute to the development of age related macular degeneration (AMD) [1,2,4,8,12,15], although this link has not been confirmed and is thus not universally agreed upon [5,8].
Children, the elderly and those with aphakic or pseudoaphakic eyes (those missing the crystalline ocular lens) are considered much more at risk of retinal harm [3,5,7,9,15,16,17]. There is evidence that vulnerability to overexposure to HEV may vary depending on individual dietary deficiencies [8]. Geographical altitude may also affect HEV exposure. Aviators are often subjected to enhanced exposures while at cruising altitudes [18,19]. However, there remains no conclusive evidence of any adverse permanent health effects of the exposure to blue light when it does not exceed exposure limits [5], which is stated by the International Commission on Non-Ionizing Radiation Protection (ICNIRP) as being 100 Wm−2sr−1 for long time viewing (greater than 10,000 s or approximately 2.8 hr) [3,17].
Many commonly used modern day devices, such as smartphones, tablets, laptops, LED lighting and vehicle headlamps have been identified as sources of HEV. These sources are often associated with the ‘blue light hazard’ following prolonged exposure [9,20]. Depending on the exposure period, the ocular dose due to exposure from artificial sources is often less than exposure due to natural sources, including blue sky light [2,3,5,17].
The blue appearance of the sky has long been explained by Rayleigh Scattering that correlates the intensity of scattered light (due to particles of size much smaller than the incident wavelength) with the inverse of the fourth power of the incident wavelength [21,22,23,24]. As the solar zenith angle (SZA) increases, the proportion of blue light (HEV) in the direct beam decreases relative to green and red, resulting in the predominantly reddish sunsets and sunrises [21,22]. The HEV irradiance available at the earth’s surface is affected by high and low altitude atmospheric factors, such as aerosol and particulate concentration and cloud amount and types [11,13,21,22,23,24]. The often visually bright “whiteness” observed in many atmospheric phenomena, such as clouds and fog, is due to relatively larger particles, such as water droplets, that enhance scattering across all solar wavelengths, described by Mie Scattering theory as being the result of a stronger forward scattering of incident radiation [21,22,23,25], thus increasing the amount of diffuse HEV.
Ocular exposure to HEV from direct observation of the sun of even less than a second can cause considerable harm [9,11,26]. However, this is not normal, and certainly is not a sensible behaviour. The human response is often to “squint”, shield the eyes or turn away [14]. By comparison, blue sky can be observed for extended timeframes, as cumulative HEV exposure is well below exposure limits [7,9,17]. There are several atmospheric constituents that absorb, scatter and attenuate visible wavebands, including nitrogen dioxide [27], and aerosols such as soot (“black carbon”) and desert dust [28,29,30,31,32]. The scattering ability of aerosols generally increases as wavelength decreases in the visible wavebands, enhancing the natural diffuse shortwave radiation [32].
Cloud variability and high SZA (above 70°) has been observed to cause an increase in uncertainty in solar irradiance observations, which includes HEV [13,33]. Some clouds, particularly thin clouds, can appear very bright when they are close to the vicinity of the sun [34,35,36], resulting in the forward scattering of sunlight through the optically thin clouds [34]. Similar visible solar radiation enhancements have been attributed to the reflection from the edges of sharply defined thicker, opaque clouds [18,34,35,37]. Short durations of increased solar irradiance are often observed when broken clouds intermittently pass by the sun. These durations can last from a few seconds to several minutes [34,36,37]. The intermittent increases in brightness can result in temporary visual disabilities and irritation [3].
The effects of cloud cover are typically measured for wavelengths shorter than the HEV in the ultraviolet radiation (UV) waveband. Cloud enhancement above cloud-free levels or attenuations in UV irradiance has previously been reported [38,39,40,41,42,43,44]. Cloud enhancement and attenuation of solar radiation, expressed with respect to a cloud-free sky, are often quantified by applying a cloud modification factor (CMF) [39,40,41,42,43,44,45,46].
The cloud-free reference irradiance is often modelled for the specific aerosol conditions expected at the date and time of observation [47]. The CMF is often less than one but can be greater than one if the irradiance at the time is enhanced due to the presence of clouds [48]. Solar ultraviolet radiation CMF is largely calculated by empirical determination using parameterisation, particularly using a least squares fit [49,50].
Cloud observations and CMF statistical evaluations have been performed in research to determine the relationships between CMF and the ultraviolet index [45], eye damage [50] and vitamin D effective UV irradiances [51]. No previous research has considered the influence of cloud on the HEV and this research extends CMF empirical determination into the HEV to derive a methodology for evaluating the HEV irradiances to a horizontal plane at sub-tropical latitudes under cloudy conditions at high SZA from 60° to 80°. The HEV irradiances measured during these periods are representative of adventitious ocular exposures that may be received when populations are in transit to and from work or school. They represent exposures received outside peak midday periods in tropical locations but are also representative of solar elevations experienced globally on a daily basis with most latitude ranges. For a working population, these exposures are typical of the ocular exposures an individual may receive over a lifetime through repeated travelling to and from work. The approach to be employed to evaluate the HEV irradiance to a horizontal plane under cloudy conditions is to develop a model with the CMF ratios of the global irradiance (300−3000 nm) and the HEV irradiance, taken as the effective irradiance weighted to the American Conference of Governmental Industrial Hygienists (ACGIH) spectral weighting function [11].

2. Materials and Methods

2.1. Instrumentation

All measurements and observations were made using an irradiance data acquisition system installed on a building roof at the University of Southern Queensland campus in Toowoomba, Queensland, Australia (27.56 °S, 151.95 °E, elevation 693 m). Toowoomba is an inland regional city at a sub-tropical Southern Hemisphere location with a population of the order of 169,000. The site is at an elevation of 693 m above sea level and has low atmospheric pollution levels. The data acquisition system consists of a Blue Light Safety Sensor (model PMA1121, Solar Light Co. PA. USA), Global Irradiance Sensor (model CMP3 Kipp and Zonen Pyranometer, Campbell Scientific Australia Pty Ltd., Garbutt, Australia) and Data Logger (model CR1000, Campbell Scientific Australia Pty Ltd., Garbutt, Australia). The instruments use the calibration provided by the manufacturer upon purchase. The blue light sensor measures the effective irradiance weighted by the American Conference of Governmental Industrial Hygienists (ACGIH) spectral weighting function for blue light hazard [52], while the CMP3 pyranometer measures the absolute global solar irradiance in the wavelength range 300 to 3000 nm. The two sensors are located side by side on a roof of a building at the University. The output signals of both sensors are logged at a scan rate of 50 Hz by the CR1000 data logger that is integrated with the sensors. Data were collected from October 2015 to May 2019.
The concurrent fractional cloud cover at the measurement site is quantified by a Total Sky Imager (TSI) (model TSI440, Yankee Environmental Systems, USA) installed in proximity to the PMA1121 Blue light safety sensor and CMP3 pyranometer. The TSI is programmed to provide the fraction of cloud cover by taking pictures of the sky and clouds reflected from a hemispherical dome and information on whether the solar disc is obscured by cloud [53]. Those images are sent to a workstation computer and processed to produce raw colour images that are analysed for fractional cloud cover. Pre and post processed images are stored as JPEG and PNG files, respectively, along with text files containing the extracted data.
The fractional cloud data with a value between 0 and 1 as it is provided by the TSI440 were also converted to okta classification according to the World Meteorological Organisation (WMO) standards [54] for consistency with the global standard. The cloud amounts in okta were employed to aggregate the data to allow consideration of the cloud amount on the influence on the HEV irradiance. The fractional cloud data which has the higher resolutions with decimal values between 0 and 1 were used in the development of the model between the global irradiance and the HEV irradiance. The details of the groupings based on the WMO cloud fraction classifications are shown in Table 1; it should be noted that each okta does not necessarily represent an eighth of the sky covered by clouds.

2.2. Data Analysis

The SZA range (60° to 80°) coincided with local times of before 9:00 a.m. and after 3:00 p.m. HEV data, global irradiance data and corresponding TSI440 image data were collected at five-minute intervals associated with the SZA interval. HEV data were recorded as a single text file. A script was developed to collect and collate the global irradiance and the HEV irradiance with the time stamped cloud fraction and sun visibility data from the TSI440 data files [55]. The method used to evaluate the HEV irradiance extends a model developed for the UV waveband to use a comparison between the global and HEV CMF ratios [41,42,46,49,50,51,56].

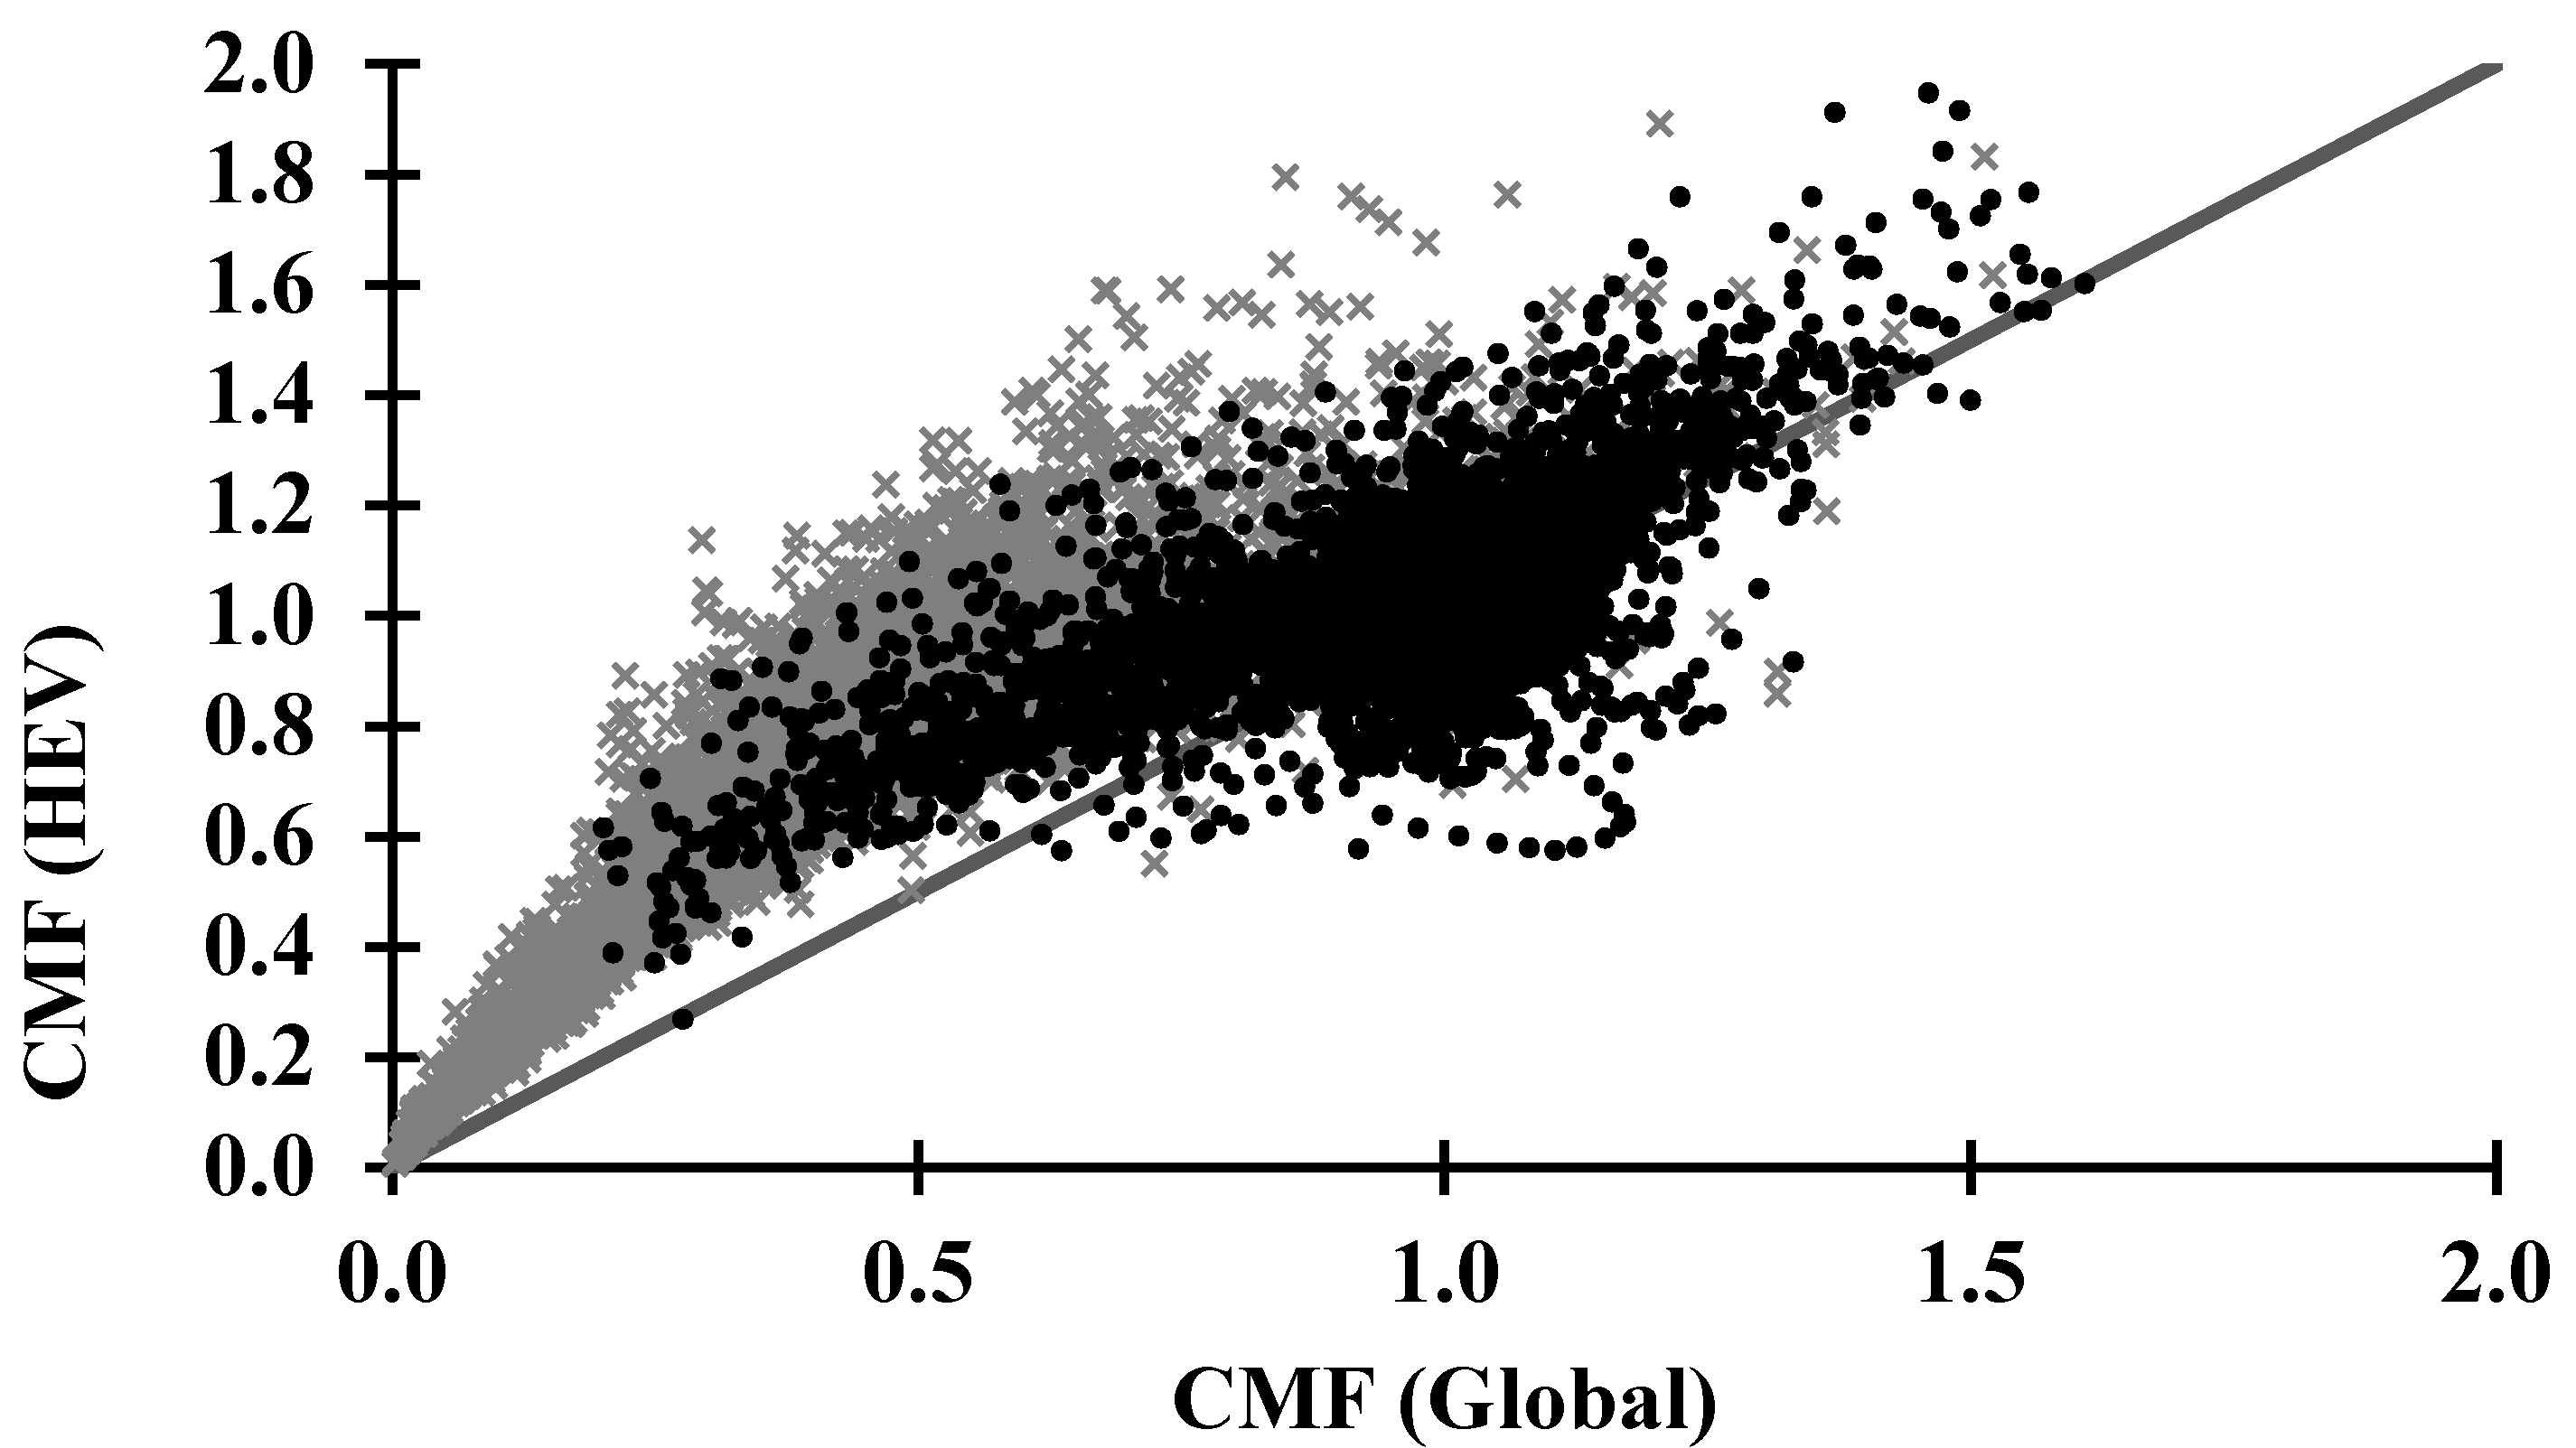
2.3. CMF Calculations
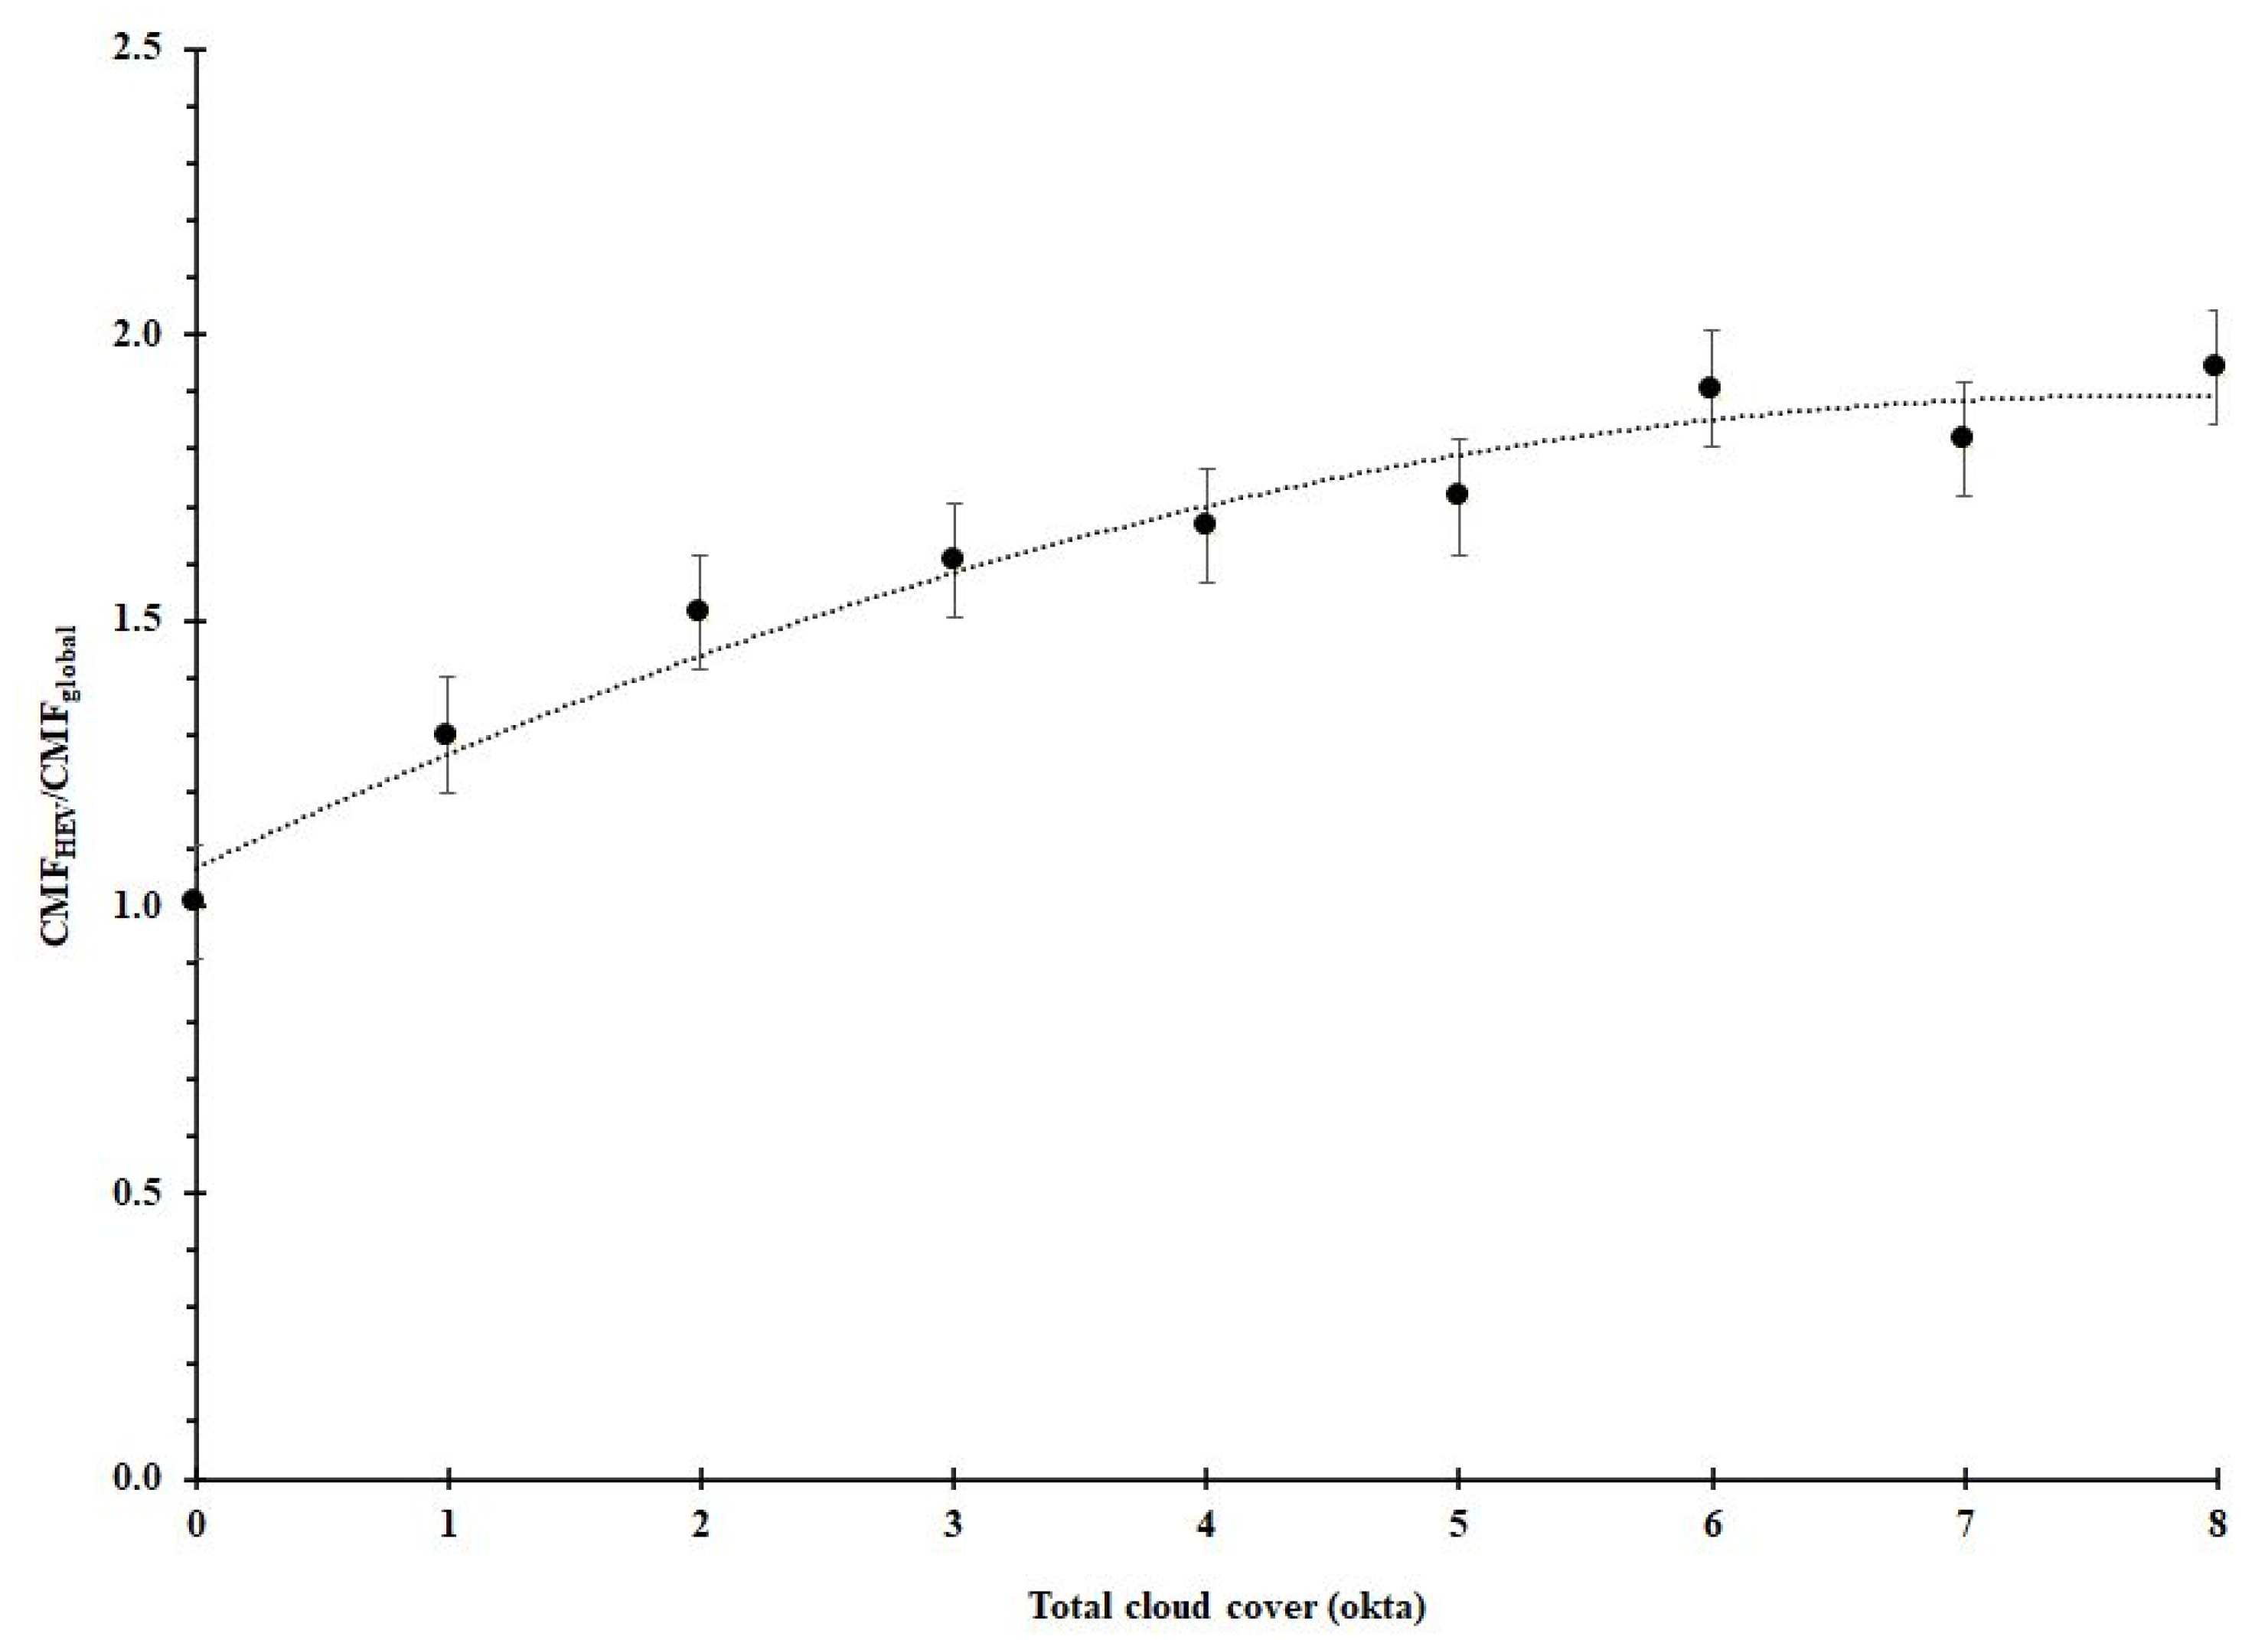
Data from the PMA1121 and CMP3 recorded from October 2015 to the end of June 2018 were used to develop a model for HEV irradiance. Data from the start of July 2018 to mid-May 2019 were used for validation. Adapted from prior research for UV radiation, the HEV irradiances (EHEV) were determined using a cloud modification factor (CMFHEV) as in Equation (1) [39],
E H E V = C M F H E V × E H E V S k y
where E H E V S k y is the HEV irradiance for cloud-free skies. There are two main methods that have been used in previous solar UV research to determine cloud effects and cloud-free conditions—the first is the calculation of a clearness index, based on a comparison with extra-terrestrial irradiance at the target wavelengths [41,46,55]; the second bases cloud-free sky determination on TSI cloud fraction data [42,45,50,51]. Given the availability of corresponding TSI cloud fraction data, E H E V S k y data were determined when the cloud fraction was less than 0.02 or approximately 0 okta [51].
A function for E H E V S k y was developed using a power law model used for solar irradiance compared with the cosine of the respective SZA [49,57], and represented by converting the SZA to an effective air mass (m) in Equation (2) [58]:
m = 1 cos ( S Z A ) + 0.50572 ( 96.07995 S Z A ) 1.6364
For the SZA range of 60° to 80°, the second term in the denominator of Equation (2) is smaller than 0.006. Equation (2) was, therefore, approximated in this research by:
m = sec ( S Z A )
Thus, the power law relationship for the cloud-free sky HEV may be expressed according to Equation (4) [51].
E H E V S k y = a m b
where a and b are curve fitting parameters. In previous research in the UV waveband [50,51], b is typically a negative value. The shape of the derived relationship is shown in Figure 1. This shape is generally the same as that observed in previous research [41,46,51,56], demonstrating a sharp increase in the derived clear sky irradiance as air mass decreases towards zenith, particularly for air masses less than 2 (SZA < 60°). Comparatively, a much more subtle increase is apparent in the air masses observed in this research (as indicated by the solid line in Figure 1).
In previous research observing UV CMF, two curve fitting methods were employed to develop models based on an exponential [41] and a power law [46] relationship between UV and Global CMF (CMFG). These methods have been modified for modelling HEV CMF (CMFHEV) in Equations (5) and (6).
C M F H E V = α ( 1 e β ( C M F G ) )
C M F H E V = γ ( C M F G ) δ
where α, β, γ and δ are curve fitting parameters.
The cloud modification function for global broadband solar radiation (CMFG) was determined as a ratio between the measured global solar irradiance in all cloud conditions (G) and that in a cloud-free sky (GSky) [41,50,51], taken as a cloud fraction of less than 0.02 [51], in Equation (7).
C M F G = G G S k y
The cloud-free global irradiance (GSky) was parametised by Long and Ackerman [57] and Pfister et al. [49] and adapted in Equation (8):
G S k y = c [ cos ( S Z A ) ] d
where c and d are curve fitting parameters. The data for equations 4 and 8 for the cloud-free sky cases were analysed to determine the constants a, b, c and d.

3. Results

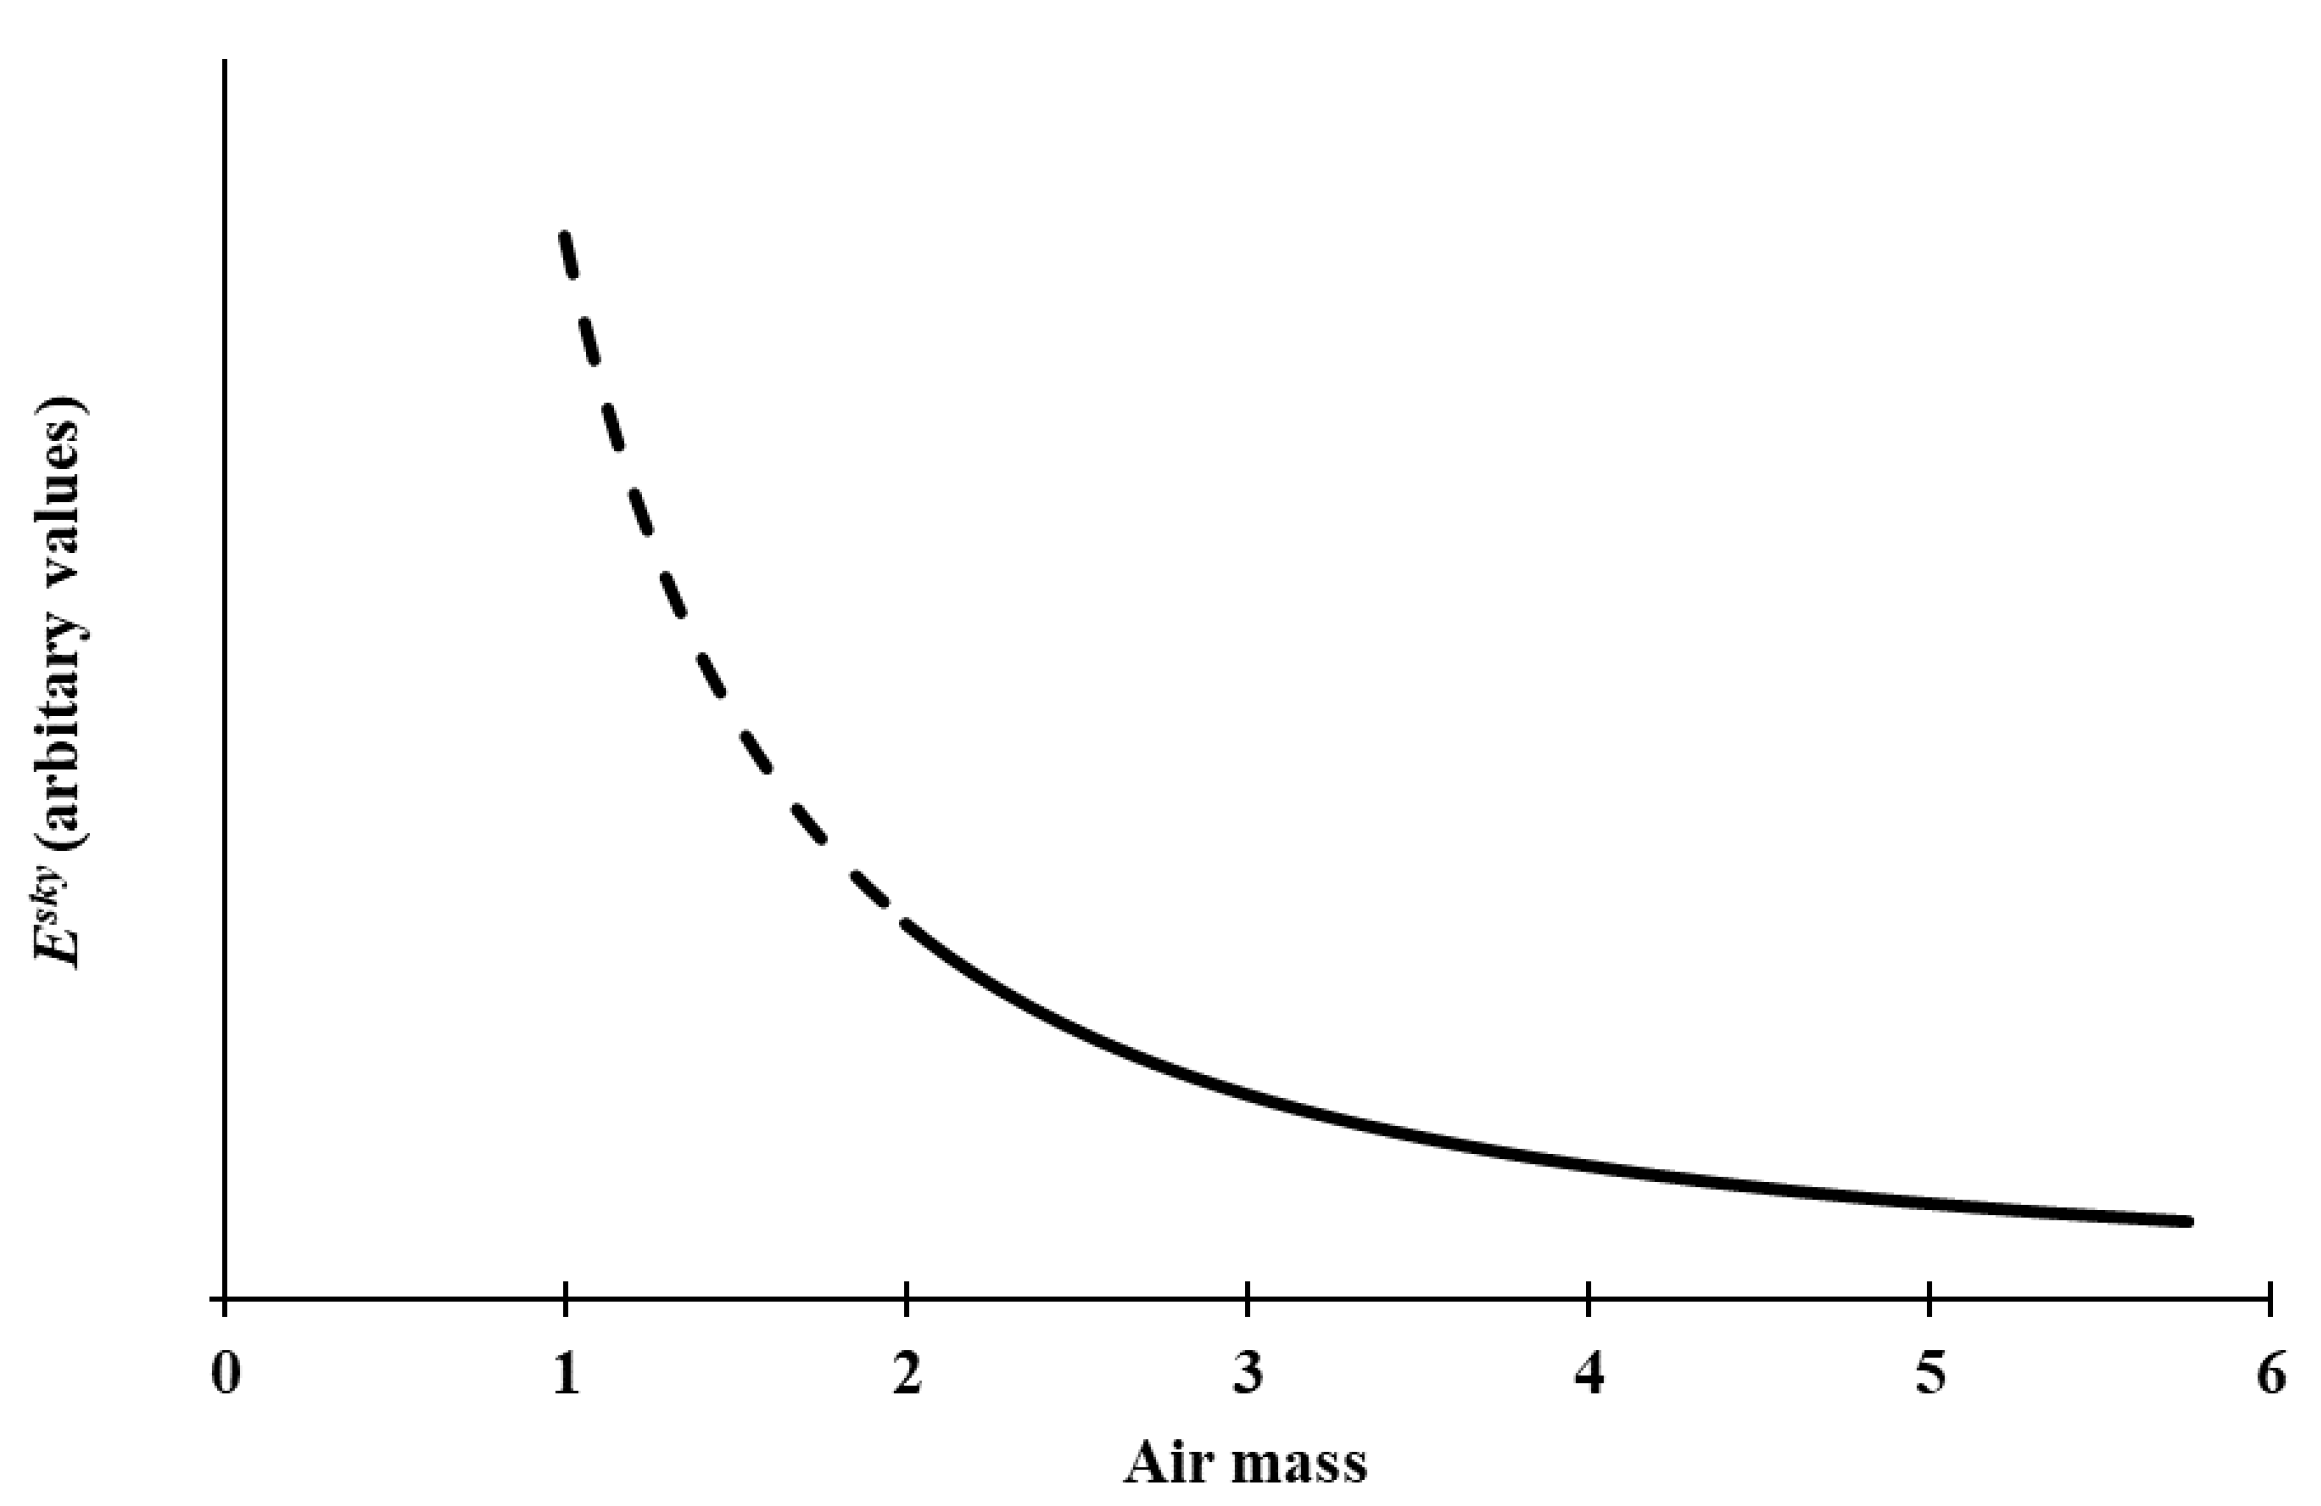
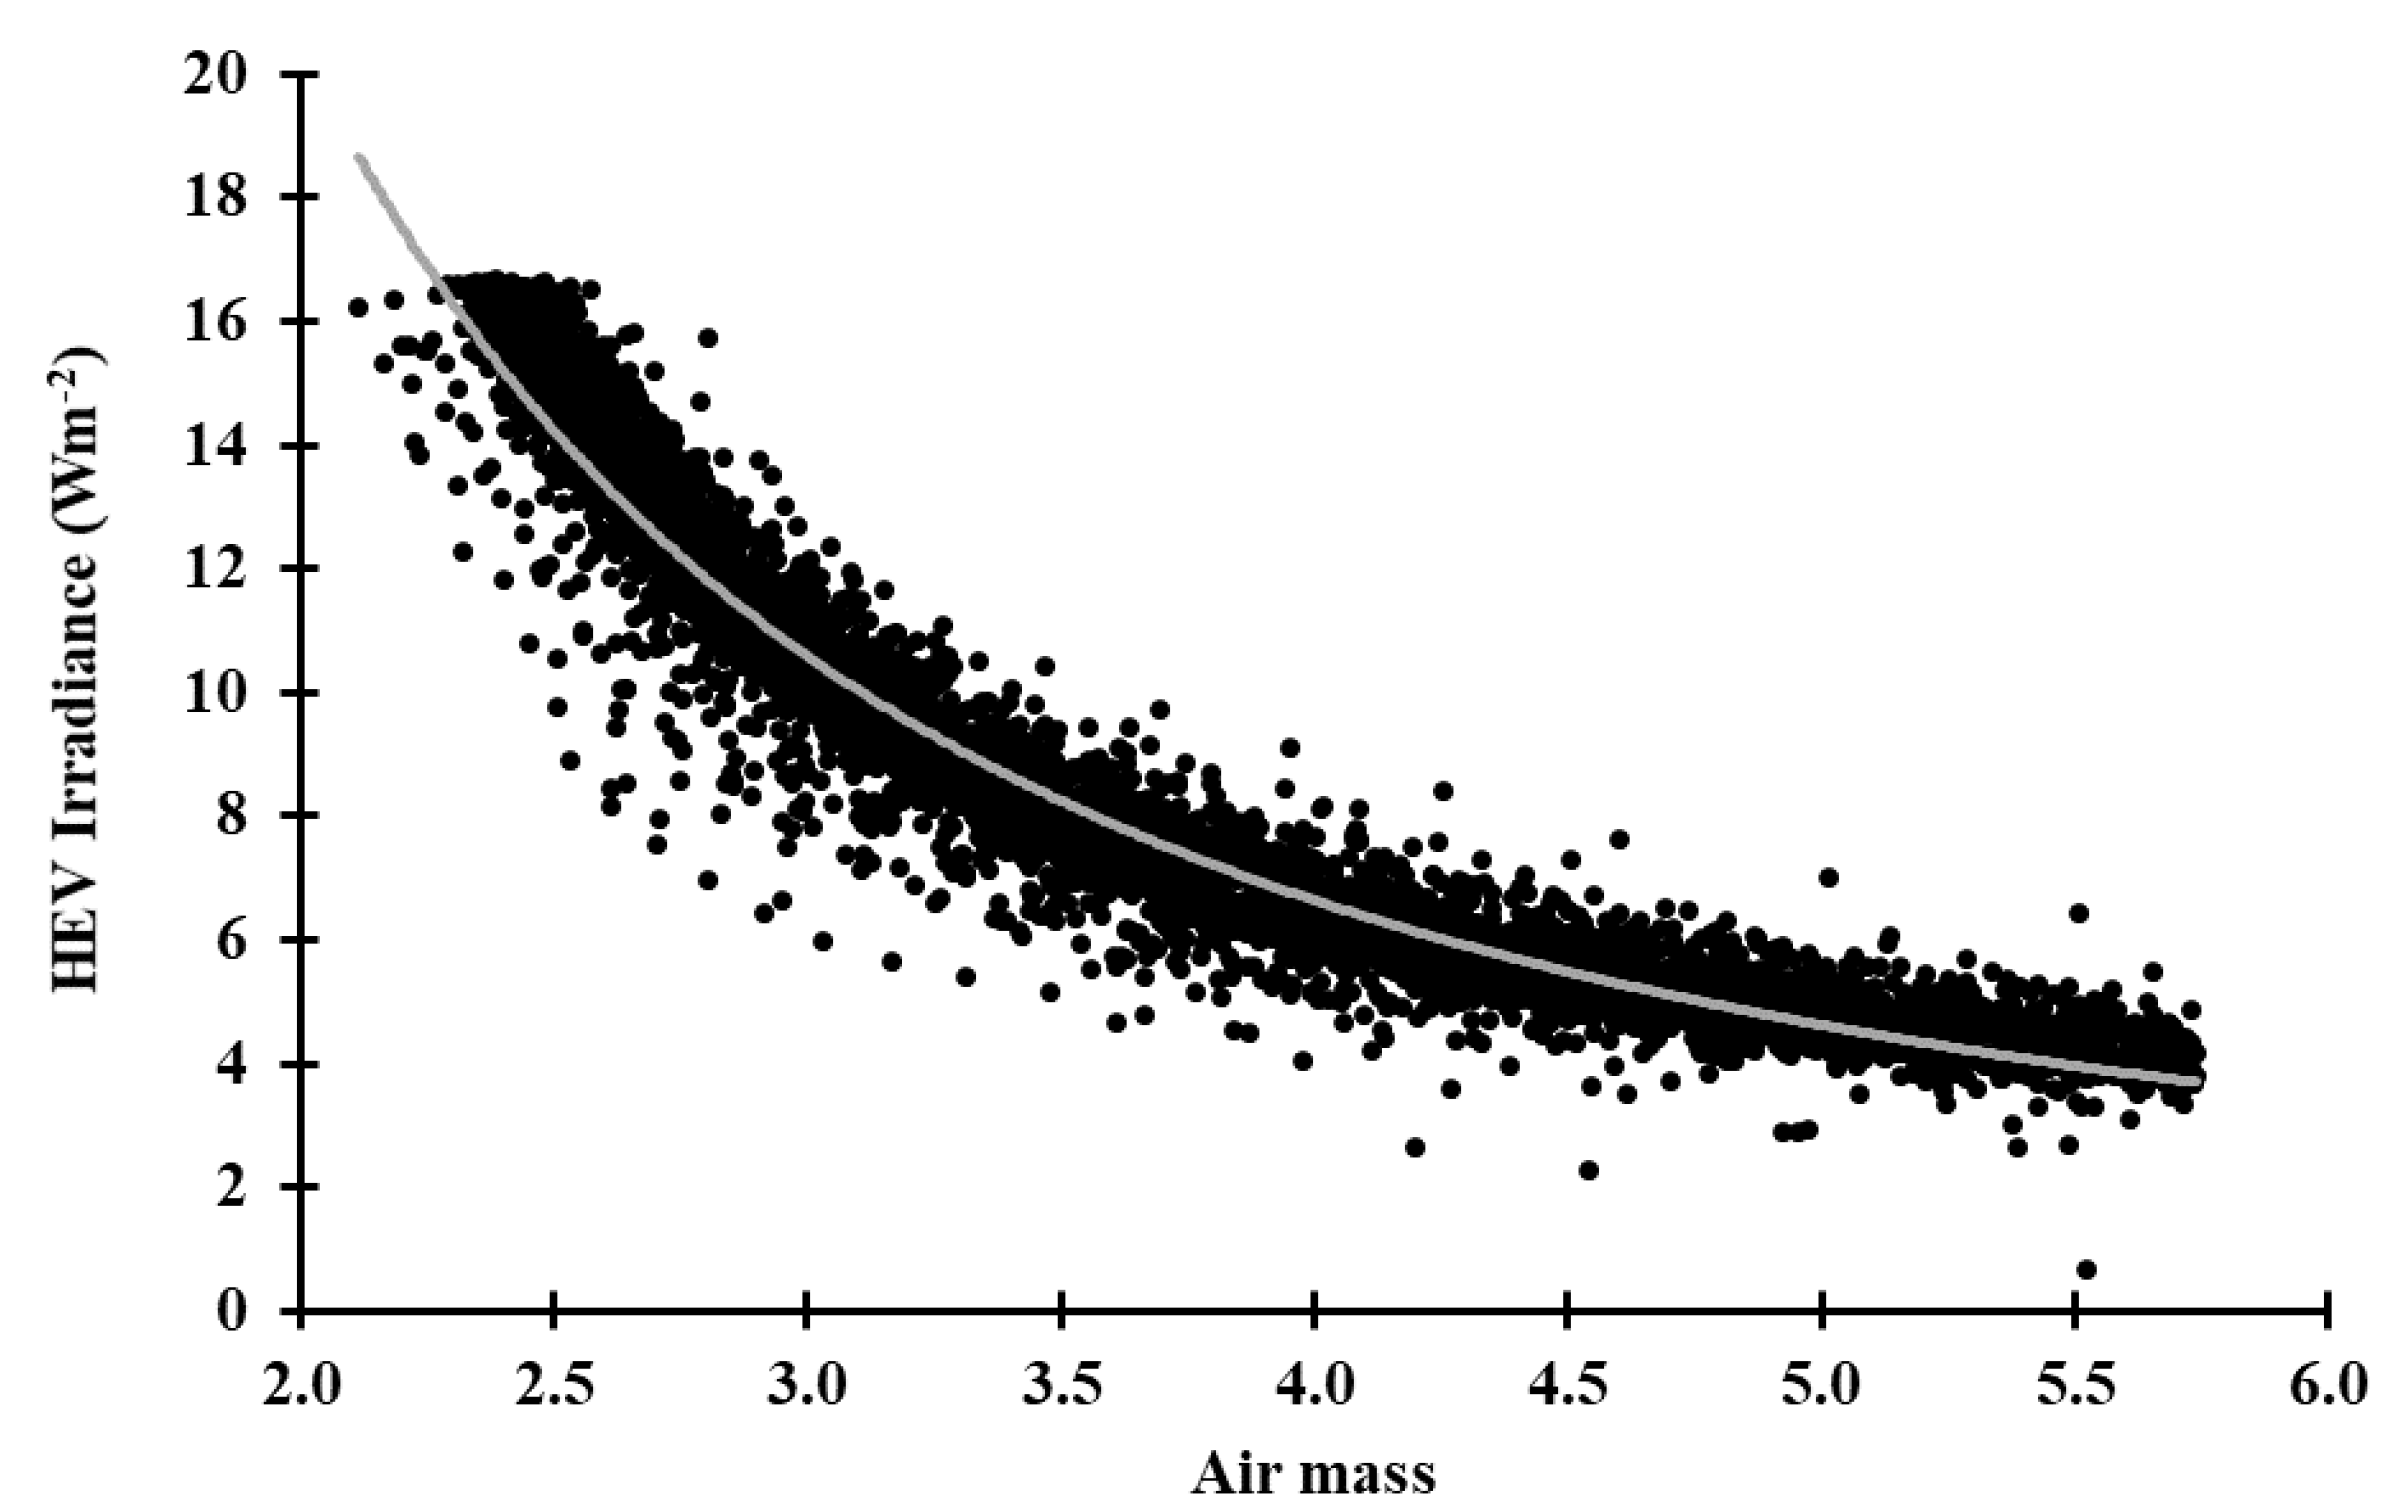
3.1. Cloud-Free Irradiance

Figure 2 presents the HEV cloud-free sky irradiance ( E H E V S k y ) plotted versus air mass in the range 2.0 to 5.8. The cloud-free cases (n = 5975) were taken for the times when the cloud fraction was less than 0.02.
The HEV cloud-free sky irradiance model (Equation (9)) provides a very strong fit to the data (R2 = 0.94) (Figure 2), consistent with the expected shape in Figure 1 and congruent with previous work modelling cloud-free solar irradiance data [51].
E H E V S k y = 62.70 m 1.62
The global irradiance cloud-free sky model fitted to the corresponding cloud-free global irradiance is represented in Equation (10), with an R2 = 0.85.
G S k y = 260.18 m 1.34

3.2. Modelling HEV Data
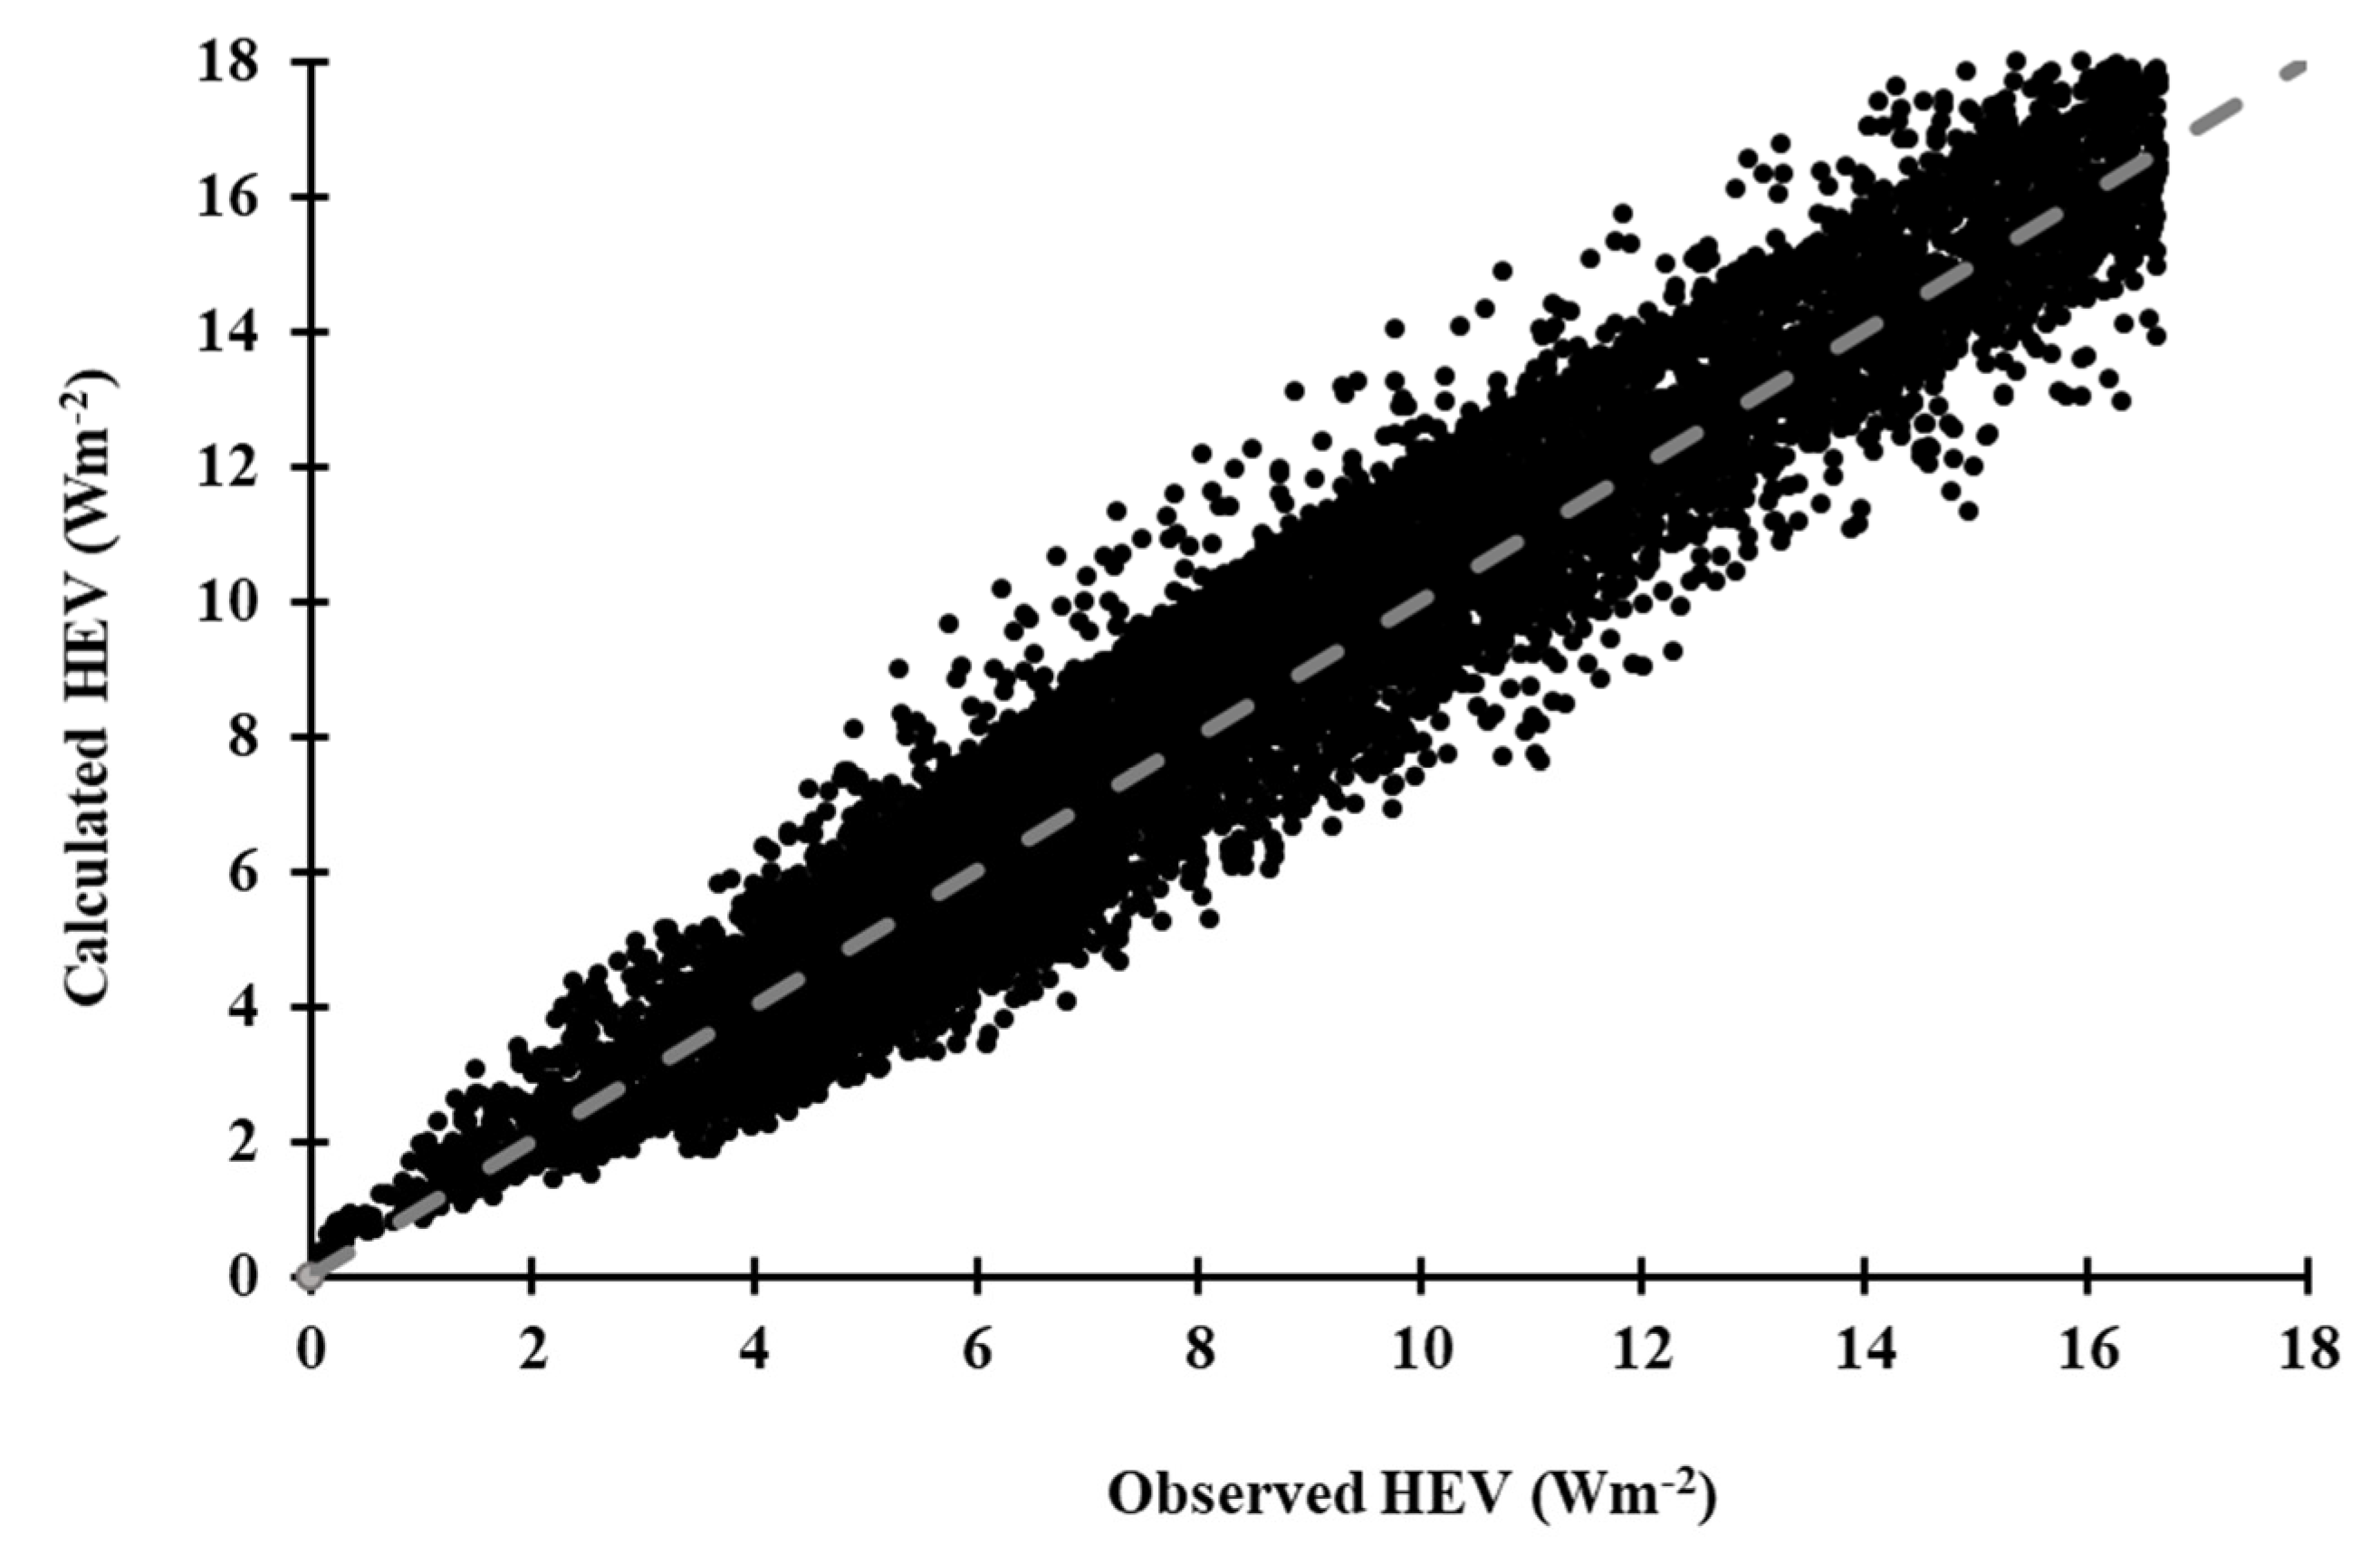
A comparison between the CMF for HEV and for global irradiance under all conditions for data collected from October 2015 to June 2018 is presented in Figure 3. The data have been separated according to solar disc visibility [42].
Figure 3 shows the same pattern of the daily, seasonal and local variances associated with local cloud cover conditions—observed by previous research [41,42,46,51] for UV irradiance. The relationship exhibited in Figure 3 provides important information related to solar disc visibility. Two regions are apparent in Figure 3. The first area is an irregular accumulation of data centred at approximately CMF = 1 for both global and HEV irradiance observations corresponding to when the sun was visible in the sky, suggesting that the CMF is dominated by the direct solar radiation. However, for the second group of data when the solar disc is obscured, the clouds have a larger relative influence on the HEV radiation compared to the global radiation.
The CMFHEV data are considerably greater than the CMFG observations. Further evidence of the increased scattering of HEV due to clouds is presented in consecutive (one-minute interval) TSI images where the sun progresses from being obscured to visible in Figure 4. The black band in the images represents the band on the hemispheric dome of the TSI440 that is designed to ensure that the image of the sun is blocked and not imaged by the camera. This band is on the hemispheric dome which does a full rotation once every 24 h. The thin black band is the shadow of the metal arm that holds the camera over the hemispheric dome. In the images, the visually cloud-free part of the sky in the vicinity of the sun in the sun-obscured and sun-visible images (Figure 4) demonstrate significant brightening predominantly in the blue channel for both the sun-visible and the sun-obscured cases, demonstrating an enhancement of the shorter wavelength diffuse Rayleigh Scattering. Neighbouring clouds are considerably brighter in the blue channel compared to the green and red.
A comparison between the CMF ratio ( C M F H E V C M F G ) with measured cloud fraction, measured in oktas (Table 1), is presented in Figure 5. Each data point is the average of the data for the cloud fraction range for the relevant okta and the error bars represent one standard error of the data. Generally, it is very clear that in the presence of any amount of cloud, C M F H E V is consistently greater than C M F G indicating greater HEV irradiance enhancement due to the influence of cloud relative to the global irradiance.
The exponent model developed in the literature for UV irradiance (Equation (5)) was adapted to predict the HEV CMF ratios with respect to global conditions (Equation (11)). There exists a strong relationship, with R2 = 0.79.
C M F H E V = 1.13 ( 1 e 2.62 ( C M F G ) )
The power law model adapted from Equation (6) demonstrates a stronger relationship between HEV and global CMF ratios (Equation (12)) with R2 = 0.86. Incidentally, the power law model developed compares with that determined for UV observations [46,56].
C M F H E V = 1.09 ( C M F G ) 0.60
Consequently, the power model was used for additional analysis; the HEV irradiance can, therefore, be calculated from global irradiance for all conditions (G) and optical air mass (m) between approximately 2.0 to 5.8 in a combined HEV irradiance model (Equations (13)–(15)) using the general HEV irradiance model (Equation (1)). Substituting the derived models for HEV CMF (CMFHEV—Equation (12)) and HEV cloud-free irradiance ( E H E V S k y —Equation (9)) yields an intermediary expression for deriving the HEV irradiance using global CMF (CMFG) and air mass (m):
E H E V = 1.09 ( C M F G ) 0.60 × 62.70 m 1.62
The model developed in this research through substitution for CMFG using Equations (3), (7), (10) gives:
C M F G = G 260.18 m 1.34
Allowing simplification to the model:
E H E V = 2.43 G 0.60 m 0.82

3.3. Validation

HEV irradiance and the associated CMFHEV ratios from July 2018 to May 2019 were used to validate the modelled HEV irradiances in Equation (15) (Figure 6). The dashed line is the one to one line to enable the comparison between the modelled HEV irradiance and the measured HEV irradiance.
The calculated HEV irradiances are in very good agreement with the observed values (Figure 6) with an R2 = 0.82, mean bias error (MBE) of −1.62%, mean absolute bias error (MABE) of 10.3% and a root mean square error (RMSE) of 14.6%. This validation was found to be reasonably comparable in these statistical measures with previous equivalent models [46,56] for equating UV irradiance in all conditions, indicating a very high degree of robustness with the model, allowing its use for predicting HEV irradiance. A comparison between the statistical evaluations of the HEV and equivalent similar models [46,56] is presented in Table 2. Although the HEV is a different waveband to the UV, it is provided here as an indication of the expected MBE, MABE and RMSE with the approach employed in this research.

4. Discussion

The cloud-free HEV irradiances in Figure 2 have a small amount of scatter about the fitted curve. This is due to minor atmospheric variations, such as possibly thin high-level clouds that are not always detected by the TSI440 sky camera. There can also be variations in atmospheric aerosols that influence the HEV irradiance. Nevertheless, the fitted power law model with an R2 = 0.94 provides the basis for the calculation of clear sky irradiance as a function of the air mass.
The CMF for HEV and for global irradiances in Figure 3 show that when the solar disc is obscured, the CMFHEV observations are considerably greater than CMFG observations. Most of the data were above the one to one line, indicating enhancement of the HEV relative to the global irradiance. This is likely due to significant effects of reflection and the increased scattering of HEV due to clouds, particularly if the clouds are thin or the sun is near the edge of clouds.
Figure 5 shows that for the data sets at each okta there is a variation in the ratio of ( C M F H E V C M F G ). A sensitivity analysis found that using the cloud fraction at each 5- or 10-min interval served as a strong indicator of the average cloud cover during the 5 min interval, especially when the fraction was categorised according to the WMO cloud cover classifications. The variation in the CMF ratio for each okta that is represented by the error bars is due to the variations in cloud properties such as cloud thickness, cloud height, cloud proximity to the sun, cloud orientation with respect to the sun and whether or not the solar disc is obscured. However, there is a definite upward trend in the ratio of the averages at each okta. This is essentially cloud enhancement of the HEV irradiance that increases with increasing cloud fraction. The only time when the CMF ratio is at unity ( C M F H E V C M F G 1 ) is in completely cloud-free skies (0 okta). Even for cloud levels as low as one okta, the C M F H E V C M F G average is higher than 1.2. This increases to approximately 1.94 for 8 okta of clouds.
The cloud enhancement in the HEV waveband, as shown by the average of the ratio of the cloud modification factor of the HEV waveband to the global radiation waveband for 8 okta of clouds of 1.94 is significantly higher than the cloud enhancement in the UV waveband that has been previously found with an enhancement above that of clear sky irradiances ranging up to a factor of 1.28 [53]. This results in any part of the population that are sensitive to HEV irradiance experiencing a potentially larger effect due to the HEV waveband on cloudy days.
The validation of the model developed in this research for low solar elevation angles (solar zenith angles between 60° and 80°) during the early morning and late afternoon when a significant part of the population are going to work or taking children to school shows that the MBE values were very similar to those developed for the UV waveband. The HEV irradiance model was within the range of errors determined by Villán et al. [46] for the UV waveband. The elevated MABE and RMSE for the HEV model compared to previous research can be accounted for by the differences in methodology. Most notably the cloud data used in this research was obtained from a TSI. The model developed is relevant for sub-tropical latitudes and will need further investigation at other latitudes where there may be different cloud types and the SZA will be different for when the population are going to work or taking children to school. Additionally, the influence of cloud proportion with respect to the position of the sun can also be investigated in future research.

5. Conclusions

A model was developed and validated for the evaluation of the solar HEV to a horizontal plane at a sub-tropical latitude for SZA between 60° and 80° for all cloud conditions. The method which incorporated both the effect of clouds on global solar radiation and the air mass was developed using approximately 26 months of 5-min interval data at high SZA. The validity of the model was tested using a new data set of approximately 11 months, providing an R2 = 0.82, a mean bias error (MBE) of −1.62%, mean absolute bias error (MABE) of 10.3%, and a root mean square error (RMSE) of 14.6%.
Clouds were found to form a significant influence on the HEV with a greater influence of clouds on the blue light compared to their influence on global radiation, increasing significantly when there were increased amounts of clouds and also when the solar disc was obscured by clouds. In some climates, especially in tropical climates, there is more cloud cover than in temperate zones increasing the likelihood that cloud enhanced glare would be experienced. Therefore, based on our preliminary findings the use of HEV blocking glasses is likely to remain recommended for ocular health and comfort.
The method developed in this research provides a means for calculating HEV to a horizontal plane utilising data obtained from the global solar radiation and the air mass. Although, this is not direct exposure to the eyes as the eyes are predominantly oriented below the horizontal plane, the HEV received on a horizontal plane is a logical first step in determining HEV exposures to the eyes. Data on the global solar radiation are typically collected at more sites than the HEV, with very few sites collecting data on the HEV; thus, this research presents a model that calculates the HEV from global radiation data at sites where HEV data are not recorded. Any available global radiation data can, therefore, be used to reconstruct the HEV to within a reasonable level of certainty, enabling continued research on the effects of HEV on human health.

Author Contributions

Conceptualization, D.P.I. and A.V.P.; methodology, A.V.P., D.P.I., N.J.D. and A.A; software, D.P.I., N.J.D. and A.A.; validation, D.P.I. and A.V.P.; formal analysis, D.P.I.; investigation, D.P.I. and A.V.P.; resources, A.V.P.; data curation, A.V.P.; writing—original draft preparation, D.P.I.; writing—review and editing, D.P.I., A.V.P., N.J.D. and A.A.; visualization, D.P.I.; supervision, D.P.I. and A.V.P.; project administration, A.V.P. All authors have read and agreed to the published version of the manuscript.

Funding

This research received no external funding.

Conflicts of Interest

The authors declare no conflict of interest.

References

  1. Melton, R. Ultraviolet and blue light. Rev. Optom. 2014, 151, S1. [Google Scholar]
  2. Pardhan, S.; Sapkota, R.J. Eye Complications of Exposure to Ultraviolet and Blue-Violet Light. 2016. Available online: https://www.pointsdevue.com/article/eye-complications-exposure-ultraviolet-and-blue-violet-light (accessed on 22 May 2020).
  3. International Commission on Non-Ionizing Radiation Protection (ICNIRP). Guidelines on incoherent visible and infrared radiation. Health Phys. 2013, 105, 74–96. [Google Scholar]
  4. Chen, D.C.; Huang, K.L.; Lee, S.L.; Wang, J.T. Blue light blocking lenses measuring device. Procedia Eng. 2016, 140, 17–29. [Google Scholar] [CrossRef] [Green Version]
  5. International Commission of Illumination (CIE). CIE Position Statement on the Blue Light Hazard. 2019. Available online: http://cie.co.at/publications/position-statement-blue-light-hazard-april-23-2019 (accessed on 22 May 2020).
  6. Kitchell, E. The effects of blue light on ocular health. J. Vis. Impair. Blind. 2000, 94, 399–403. [Google Scholar] [CrossRef] [Green Version]
  7. Sliney, D.H. Photoprotection of the eye—UV radiation and sunglasses. J. Photochem. Photobiol. B Biol. 2001, 64, 166–175. [Google Scholar] [CrossRef]
  8. Fletcher, A.E.; Bentham, G.C.; Agnew, M.; Young, I.S.; Augood, C.; Chakravarthy, U.; de Jong, P.T.V.M.; Rahu, M.; Seland, J.; Soubrane, G.; et al. Sunlight exposure, antioxidants, and age-related macular degeneration. Arch. Ophthalmol. 2008, 126, 1396–1403. [Google Scholar] [CrossRef] [PubMed] [Green Version]
  9. Bullough, J.D.; Bierman, A.; Rea, M.S. Evaluating the blue-light hazard from solid state lighting. Int. J. Occup. Saf. Ergon. 2019, 25, 311–320. [Google Scholar] [CrossRef]
  10. Pautler, E.L.; Morita, M.; Beezley, D. Hemoprotein(s) mediate blue light damage in the retinal pigment epithelium. Photochem. Photobiol. 1990, 51, 599–605. [Google Scholar] [CrossRef]
  11. Okuno, T. Hazards of Solar Blue Light. Available online: https://www.pointsdevue.com/article/hazards-solar-blue-light (accessed on 22 May 2020).
  12. Turnbull, D.J.; Parisi, A.V. Potential dosemeter for quantifying biologically effective blue light exposures. Rad. Prot. Dos. 2012, 149, 245–250. [Google Scholar] [CrossRef]
  13. Zuber, R.; Ribnitzky, M.; Tobar, M.; Lange, K.; Kutscher, D.; Schrempf, M.; Niedzwiedz, A.; Seckmeyer, G. Global spectral irradiance array spectroradiometer validation according to WMO. Meas. Sci. Technol. 2018, 29, 105801. [Google Scholar] [CrossRef] [Green Version]
  14. Sliney, D.H. Exposure geometry and spectral environment determine photobiological effects on the human eye. Photochem. Photobiol. 2005, 81, 483–489. [Google Scholar] [CrossRef] [PubMed]
  15. Algvere, P.V.; Marshall, J.; Seregard, S. Age-related maculopathy and the impact of blue light hazard. Acta Ophthamol. Scand. 2006, 84, 4–15. [Google Scholar] [CrossRef] [PubMed]
  16. Wu, J.; Sregard, S.; Algvere, P.V. Photochemical damage of the retina. Surv. Ophthal. 2006, 51, 461–481. [Google Scholar] [CrossRef] [PubMed]
  17. O’Hagan, J.B.; Khazova, M.; Price, L.L.A. Low-energy light bulbs, computers, tablets, and the blue light hazard. Eye 2016, 30, 230–233. [Google Scholar] [CrossRef] [PubMed] [Green Version]
  18. Chorley, A.C.; Evans, B.J.W.; Benwell, M.J. Civilian pilot exposure to ultraviolet and blue light, and pilot use of sunglasses. Aviat. Space Environ. Med. 2011, 82, 895–900. [Google Scholar] [CrossRef] [PubMed]
  19. Chorley, A.C.; Higlett, M.; Baczynska, K.; Hunter, R.; Khazova, M. Measurements of pilots’ occupational solar UV exposure. Photochem. Photobiol. 2014, 90, 935–940. [Google Scholar] [CrossRef]
  20. Legierski, M.; Michaek, P. Assessment of photobiological safety of passing beam and driving beam headlamps with different light sources. IOP Conf. Ser. Mater. Sci. Eng. 2018, 421, 032016. [Google Scholar] [CrossRef]
  21. Dye, D.G. Spectral composition and quanta-to-energy ratio of diffuse photosynthetically active radiation under diverse cloud conditions. J. Geophys. Res. Atmos. 2004, 109. [Google Scholar] [CrossRef]
  22. Wallace, J.M.; Hobbs, P.V. Atmospheric Science: An Introductory Survey, 2nd ed.; Elsevier Academic Press: Amsterdam, Netherlands, 2006. [Google Scholar]
  23. Juzeniene, A.; Brekke, P.; Dahlback, A.; Andersson-Engels, S.; Reichrath, J.; Moan, K.; Holick, M.P.; Grant, W.B.; Moan, J. Solar radiation and human health. Rep. Prog. Phys. 2011, 74, 066701. [Google Scholar] [CrossRef] [Green Version]
  24. Iishi, T.; Otani, K.; Takashima, T.; Xue, Y. Solar spectral influence on the performance of photovoltaic (PV) modules under fine weather and cloudy weather conditions. Prog. Photovolt.: Res. Appl. 2013, 21, 481–489. [Google Scholar] [CrossRef]
  25. Pierce, R.M.; Ramaprasad, J.; Eisenberg, E.C. Optical attenuation of fog and clouds. Proc. SPIE Opt. Wirel. Commun. IV 2001, 4350, 58–71. [Google Scholar]
  26. Hietanen, M. Ocular exposure to solar ultraviolet and visible radiation at high latitudes. Scand. J. Work Environ. Health 1991, 17, 398–403. [Google Scholar] [CrossRef] [PubMed]
  27. Bortoli, D.; Silva, A.M.; Costa, M.J.; Domingues, A.F.; Giovanelli, G. Measurements of stratospheric ozone and nitrogen dioxide at Evora, Portugal. Int. J. Remote Sens. 2009, 30, 4209–4266. [Google Scholar] [CrossRef]
  28. Horvath, H. Atmospheric light absorption—A review. Atmos. Environ. Part A Gen. Top. 1993, 27, 293–317. [Google Scholar] [CrossRef]
  29. Kokhanovsky, A.A. Aerosol Optics: Light Absorption and Scattering by Particles in the Atmosphere; Praxis Publishing: Chichester, UK, 2008. [Google Scholar]
  30. Igoe, D.P. Analysing Urban Aerosols using a Digital Camera. MSc Thesis, University of Southern Queensland, Toowoomba, Australia, 2014. [Google Scholar]
  31. Diémoz, H.; Eleftheraton, K.; Kazadzis, S.; Amiridis, V.; Zerefos, C.S. Retrieved of aerosol optical depth in the visible range with a Brewer spectrophotometer in Athens. Atmos. Meas. Tech. 2016, 9, 1871–1888. [Google Scholar] [CrossRef] [Green Version]
  32. Gao, Y.; Sun, Q.; Xu, J.; Wang, T. Analysis of optical properties of different types of aerosols. In Proceedings of the International Symposium on Optoelectronic Technology and Application, Beijing, China, 12 December 2018. [Google Scholar]
  33. Sun, D.; El-Basyouny, K.; Kwon, T.J. Sun glare: Network characterisation and safety effects. Transp. Res. Rec. J. Transp. Res. Board 2018, 2672, 79–92. [Google Scholar] [CrossRef]
  34. Yordanov, G.H.; Saetre, T.O.; Midtgård, O.M. Extreme overirradiance events in Norway: 1.6 suns measured close to 60°N. Sol. Energy 2015, 115, 68–73. [Google Scholar] [CrossRef]
  35. Chase, O.A.; Teles, M.B.; de Jesus dos Santos Rodrigues, M.; De Almeida, J.F.S.; Macêdo, W.N.; Da Costa Junior, C.T. A low cost stand-alone sensory platform for monitoring extreme solar overirradiance events. Sensors 2018, 18, 2685. [Google Scholar] [CrossRef] [Green Version]
  36. do Nascimento, L.R.; de Souza Viana, T.; Camos, R.A.; Rüther, R. Extreme dollar overirradiance events: Occurrence and impacts on utility-scale photovoltaic power plants in Brazil. Sol. Energy 2019, 186, 370–381. [Google Scholar] [CrossRef]
  37. Zehner, M.; Hartmann, M.; Weizenbeck, J.; Gratzl, T.; Weigl, T.; Mayer, B.; Wirth, G.; Krawczynski, M.; Betts, T.; Gottschalg, R.; et al. Systematic analysis of meteorological irradiation effects. In Proceedings of the 25th Photovoltaic Solar Energy Conference, Valencia, Spain, 6–10 September 2010. [Google Scholar]
  38. Bodecker, G.E.; McKenzie, R.L. An algorithm for inferring surface UV irradiance including cloud effects. J. Appl. Climatol. 1996, 35, 1860–1877. [Google Scholar] [CrossRef] [Green Version]
  39. Foyo-Moreno, I.; Alados, T.; Olmo, F.J.; Vida, J.; Alados-Arboledas, L. On the use of cloud modification factor for solar UV (290-385 nm) spectral range. Theor. Appl. Climatol. 2001, 68, 41–50. [Google Scholar] [CrossRef]
  40. Schwander, H.; Koepke, P.; Kaifel, A.; Seckmeyer, G. Modification of spectral UV irradiance by clouds. J. Geophys. Res.: Atmos. 2002, 107, AAC-7. [Google Scholar] [CrossRef] [Green Version]
  41. Foyo-Moreno, I.; Alados, T.; Olmo, F.J.; Alados-Arboledas, L. The influence of cloudiness on UV global irradiance (295–385 nm). Agric. For. Meteorol. 2003, 120, 101–111. [Google Scholar] [CrossRef]
  42. Badosa, J.; Calbó, J.; McKenzie, R.; Liley, B.; González, J.A.; Forgan, B.; Long, C.N. Two methods for retrieving UV index for all cloud conditions from sky imager products or total SW radiation measurements. Photochem. Photobiol. 2014, 90, 941–951. [Google Scholar] [CrossRef] [PubMed]
  43. Feister, U.; Cabrol, N.; Häder, D. UV irradiance enhancements by scattering of solar radiation from clouds. Atmosphere 2015, 6, 1211–1228. [Google Scholar] [CrossRef] [Green Version]
  44. Park, S.S.; Kim, M.; Lee, H.; Lee, H.; Kim, S.M.; Lee, Y.G. Estimating cloud and aerosol UV modification factors based on spectral measurement from the Brewer Spectrophotometer. Atmosphere 2017, 8, 109. [Google Scholar] [CrossRef] [Green Version]
  45. Parisi, A.V.; Sabburg, J.; Turner, J.; Dunn, P.K. Cloud observation for the statistical evaluation of the UV index at Toowoomba, Australia. Int. J. Biometeor. 2008, 52, 159–166. [Google Scholar] [CrossRef]
  46. Villán, D.M.; Castrillo, A.M.; Santos, J.B. Empirical models of UV total radiation and cloud effect study. Int. J. Climatol. 2010, 30, 1407–1415. [Google Scholar]
  47. Staiger, H.; de Outer, P.N.; Bais, A.F.; Feister, U.; Johnsen, B.; Vuilleumier, L. Hourly resolved cloud modification factors in the ultraviolet. Atmos. Chem. Phys. 2008, 8, 2493–2508. [Google Scholar] [CrossRef] [Green Version]
  48. Bais, A.F.; Lucas, R.M.; Bornman, J.F.; Williamson, C.E.; Sulzberger, B.; Austin, A.T.; Wilson, S.R.; Andrady, A.L.; Bernhard, G.; McKenzie, R.L.; et al. Environmental effects of ozone depletion, UV radiation and interaction with climate change: UNEP Environmental Effects Assessment Panel, update 2017. Photochem. Photobiol. Sci. 2018, 17, 127–179. [Google Scholar] [CrossRef]
  49. Pfister, G.; McKenzie, R.L.; Liley, J.B.; Thomas, A.; Forgan, B.W.; Long, C.N. Cloud coverage based on all-sky imaging and its impact on surface solar irradiance. J. App. Meteorol. 2003, 42, 1421–1434. [Google Scholar] [CrossRef]
  50. Parisi, A.V.; Turnbull, D.J.; Turner, J. Calculation of cloud modification factors for the horizontal plane eye damaging ultraviolet radiation. Atmos. Res. 2007, 86, 278–285. [Google Scholar] [CrossRef]
  51. Turnbull, D.J.; Parisi, A.V.; Schouten, P.W. Empirical evaluation of global vitamin D effective ultraviolet irradiance under cloudy conditions for a subtropical southern hemisphere site. Rad. Res. 2010, 173, 703–708. [Google Scholar] [CrossRef] [PubMed]
  52. Solar Light. Model PMA1121 Analog Blue Light Safety Sensor. Available online: https://solarlight.com/product/blue-light-safety-sensor-pma1121/ (accessed on 3 July 2019).
  53. Parisi, A.V.; Sabburg, J.; Kimlin, M.G. Scattered and Filtered Solar UV Measurements; Springer Science and Business Media: Dordrecht, The Netherlands, 2004. [Google Scholar]
  54. CIMO. Guide to Meteorological Instruments and Methods of Observation; WMO: Geneva, Switzerland, 2014. [Google Scholar]
  55. Igoe, D.P.; Parisi, A.V.; Downs, N.J. Cloud segmentation property extraction from total sky image repositories using Python. Inst. Sci. Tech. 2019, 47, 522–534. [Google Scholar] [CrossRef]
  56. Wang, L.; Gong, W.; Li, J.; Ma, Y.; Hu, B. Empirical studies of cloud effects on ultraviolet radiation in Central China. Int. J. Climatol. 2014, 34, 2218–2228. [Google Scholar] [CrossRef]
  57. Long, C.N.; Ackerman, T.P. Identification of clear skies from broadband pyranometer measurements and calculation of downwelling shortwave cloud effects. J. Geophys. Res. 2000, 105, 15609–15626. [Google Scholar] [CrossRef]
  58. Kasten, F.; Young, A.T. Revised optical air mass tables and approximation formula. Appl. Opt. 1989, 28, 4735–4738. [Google Scholar] [CrossRef] [PubMed]
Figure 1. Generalised effect of the air mass on the derived clear sky irradiance (Esky). The solid line represents the expected values for the air mass in this research.
Sensors 20 04105 g001
Figure 2. High energy visible (HEV) cloud-free sky irradiance modelled with respect to optical air mass (n = 5975). The grey line represents the fitted power law model.
Sensors 20 04105 g002
Figure 3. Comparison of the cloud modification factor (CMF) for HEV and for global irradiances in all conditions. Black dots represent data collected when the solar disc was visible (n = 8384) and grey crosses where it was obscured (n = 5780). The black line represents a 1 to 1 relationship between HEV and global CMF ratios.
Sensors 20 04105 g003
Figure 4. Example of consecutive (one-minute interval) high solar zenith angle (SZA) (62°) total sky imager (TSI) images. The blue sky is brighter in the blue channel for both the sun-obscured and the sun-visible cases due to the higher relative proportion of Rayleigh scattering at the shorter wavelengths.
Sensors 20 04105 g004
Figure 5. Comparison between the ratio of HEV CMF and global CMF with cloud fraction measured in okta for all data (n = 23,500).
Sensors 20 04105 g005
Figure 6. Comparison between observed and calculated HEV irradiance between July 2018 to May 2019 (n = 9336). The dashed line represents a one to one fit with the data.
Sensors 20 04105 g006
Table 1. Cloud fraction classification to okta used in this research to correspond with the World Meteorological Organisation classifications.
OktaWMO Cloud FractionThis Research Cloud Fraction
00<0.02
1Up to 1/10, but not 00.02 to < 0.15
22/10–3/100.15 to < 0.35
34/100.35 to < 0.45
45/100.45 to < 0.55
56/100.55 to < 0.65
67/10–8/100.65 to < 0.85
7Greater than 9/10 but not 10/100.85 to 0.98
810/10>0.98
Table 2. Statistical evaluation comparison of the HEV irradiance (HEV) model with research in the UV waveband.
HEV Irradiance ModelUV Model 1
Villán et al. [46]
UV Model 2
Wang et al. [56]
MBE−1.62%−2.71% to 1.86%−0.91% to 1.52%
MABE10.3%6.77% to 7.82%8.76% to 9.18%
RMSE14.6%9.83% to 10.46%11.13% to 12.32%

