Wi-SL: Contactless Fine-Grained Gesture Recognition Uses Channel State Information

Abstract
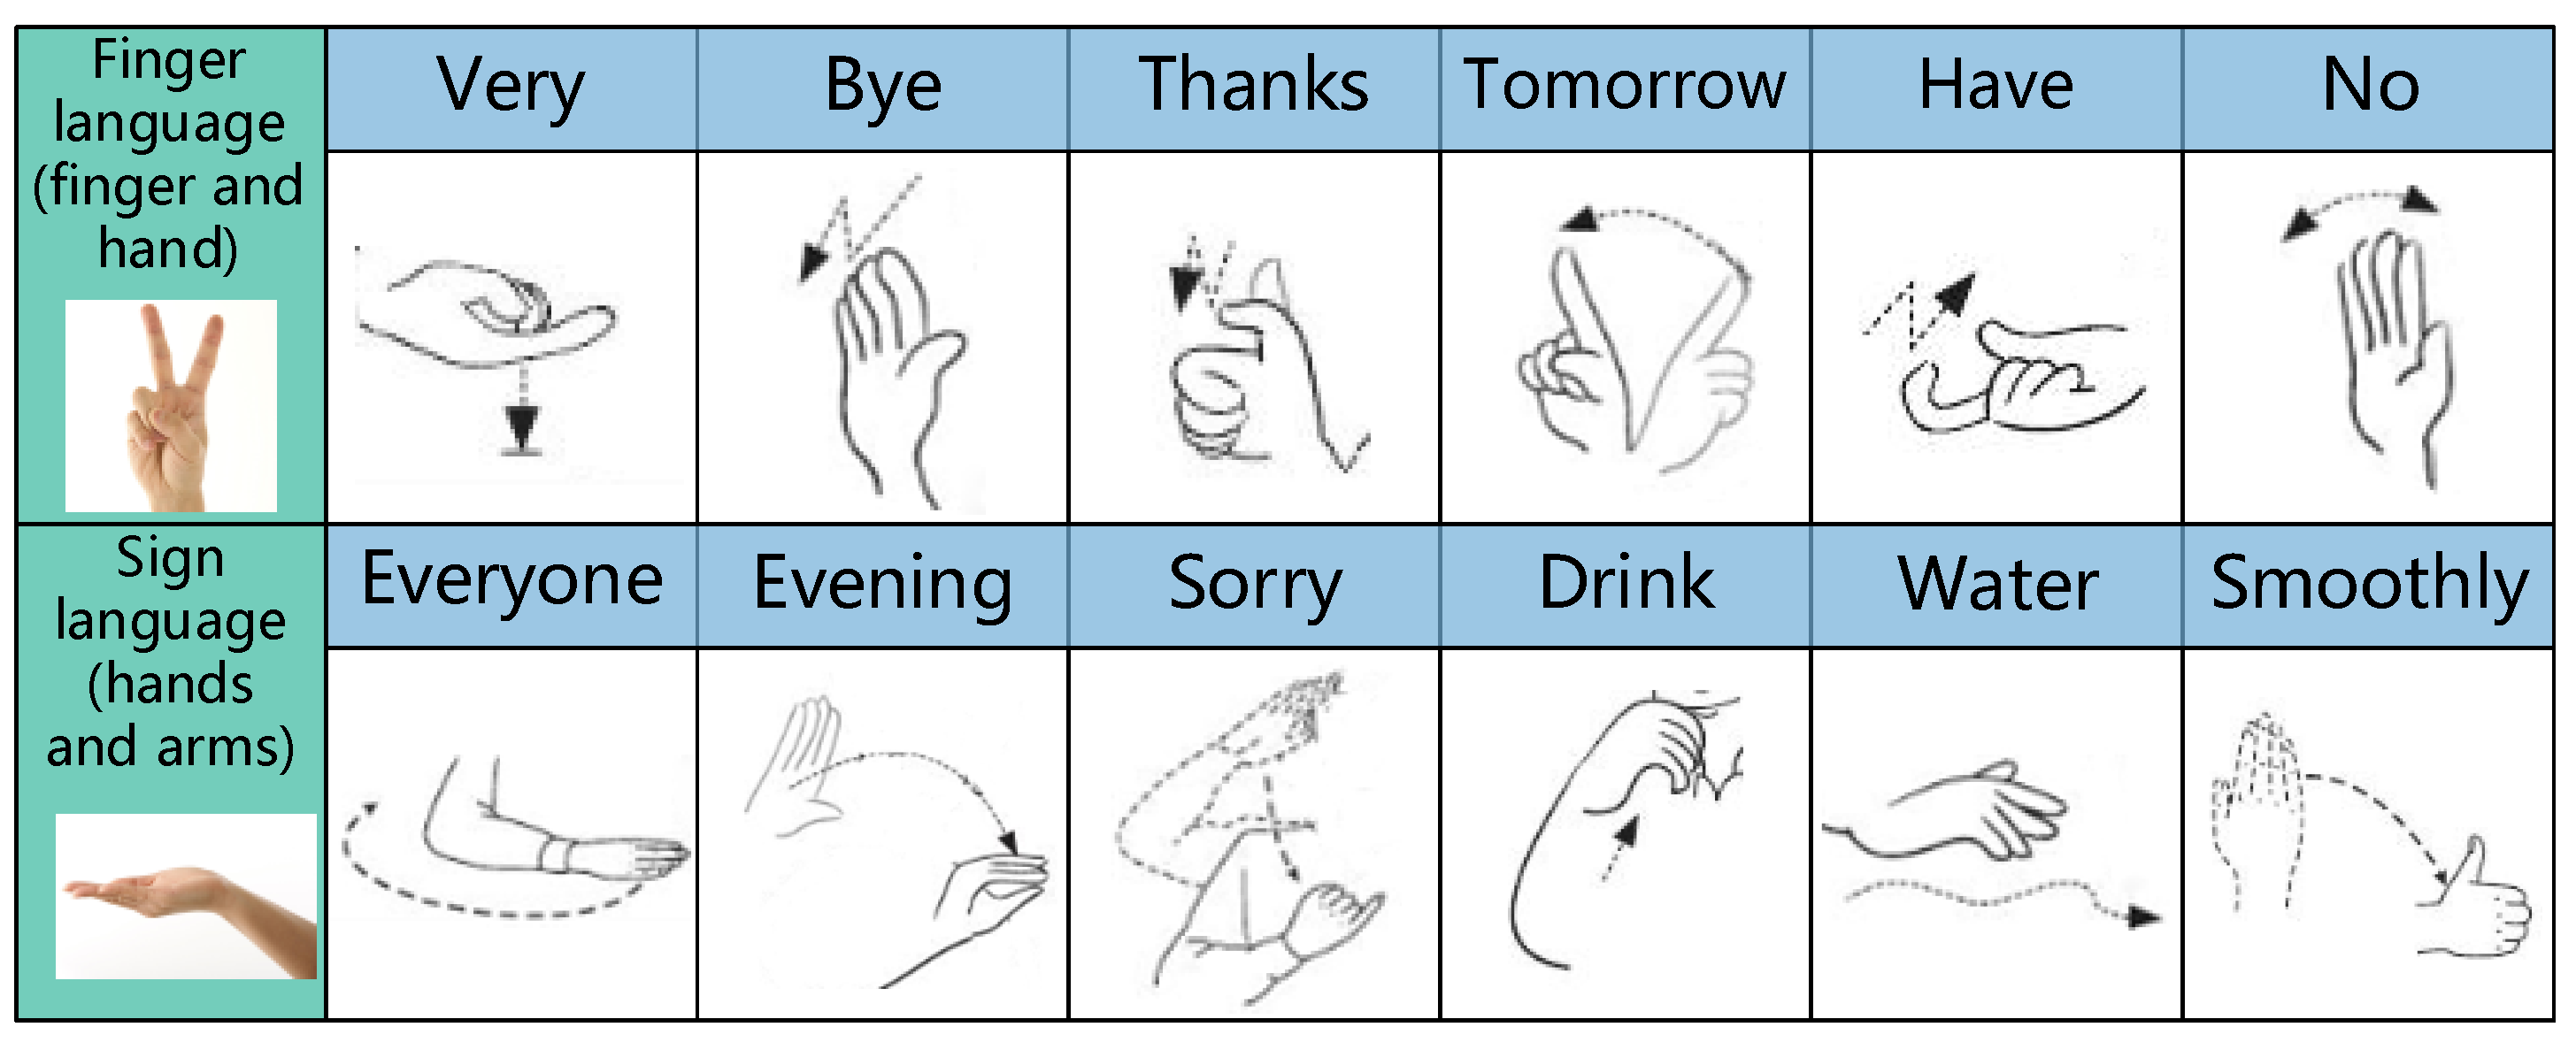
1. Introduction
- We propose a CSI-based device recognition method for sign language actions, Wi-SL. Under the wireless signal of 5.7 GHz frequency band, the amplitude and phase difference characteristics of the sub-carrier level are correlated with sign language actions to realize intelligent, high-precision, contactless sign language action recognition.
- We construct an efficient denoising method in the Wi-SL system and use a Butterworth low-pass filter combined with a wavelet function to effectively filter multipath components and environmental interference to ensure the accuracy of sign language recognition. In addition, we have designed a reasonable optimal carrier selection strategy that effectively reduces system computational overhead.
- In the data classification and fingerprint matching stage of the Wi-SL system, an efficient KSB classification model is designed. KSB uses K-means to complete the sign language action data clustering and uses the integrated learning Bagging algorithm combined with the majority voting strategy to complete the selection of the optimal SVM classifier to achieve the efficient classification of sign language action feature data.
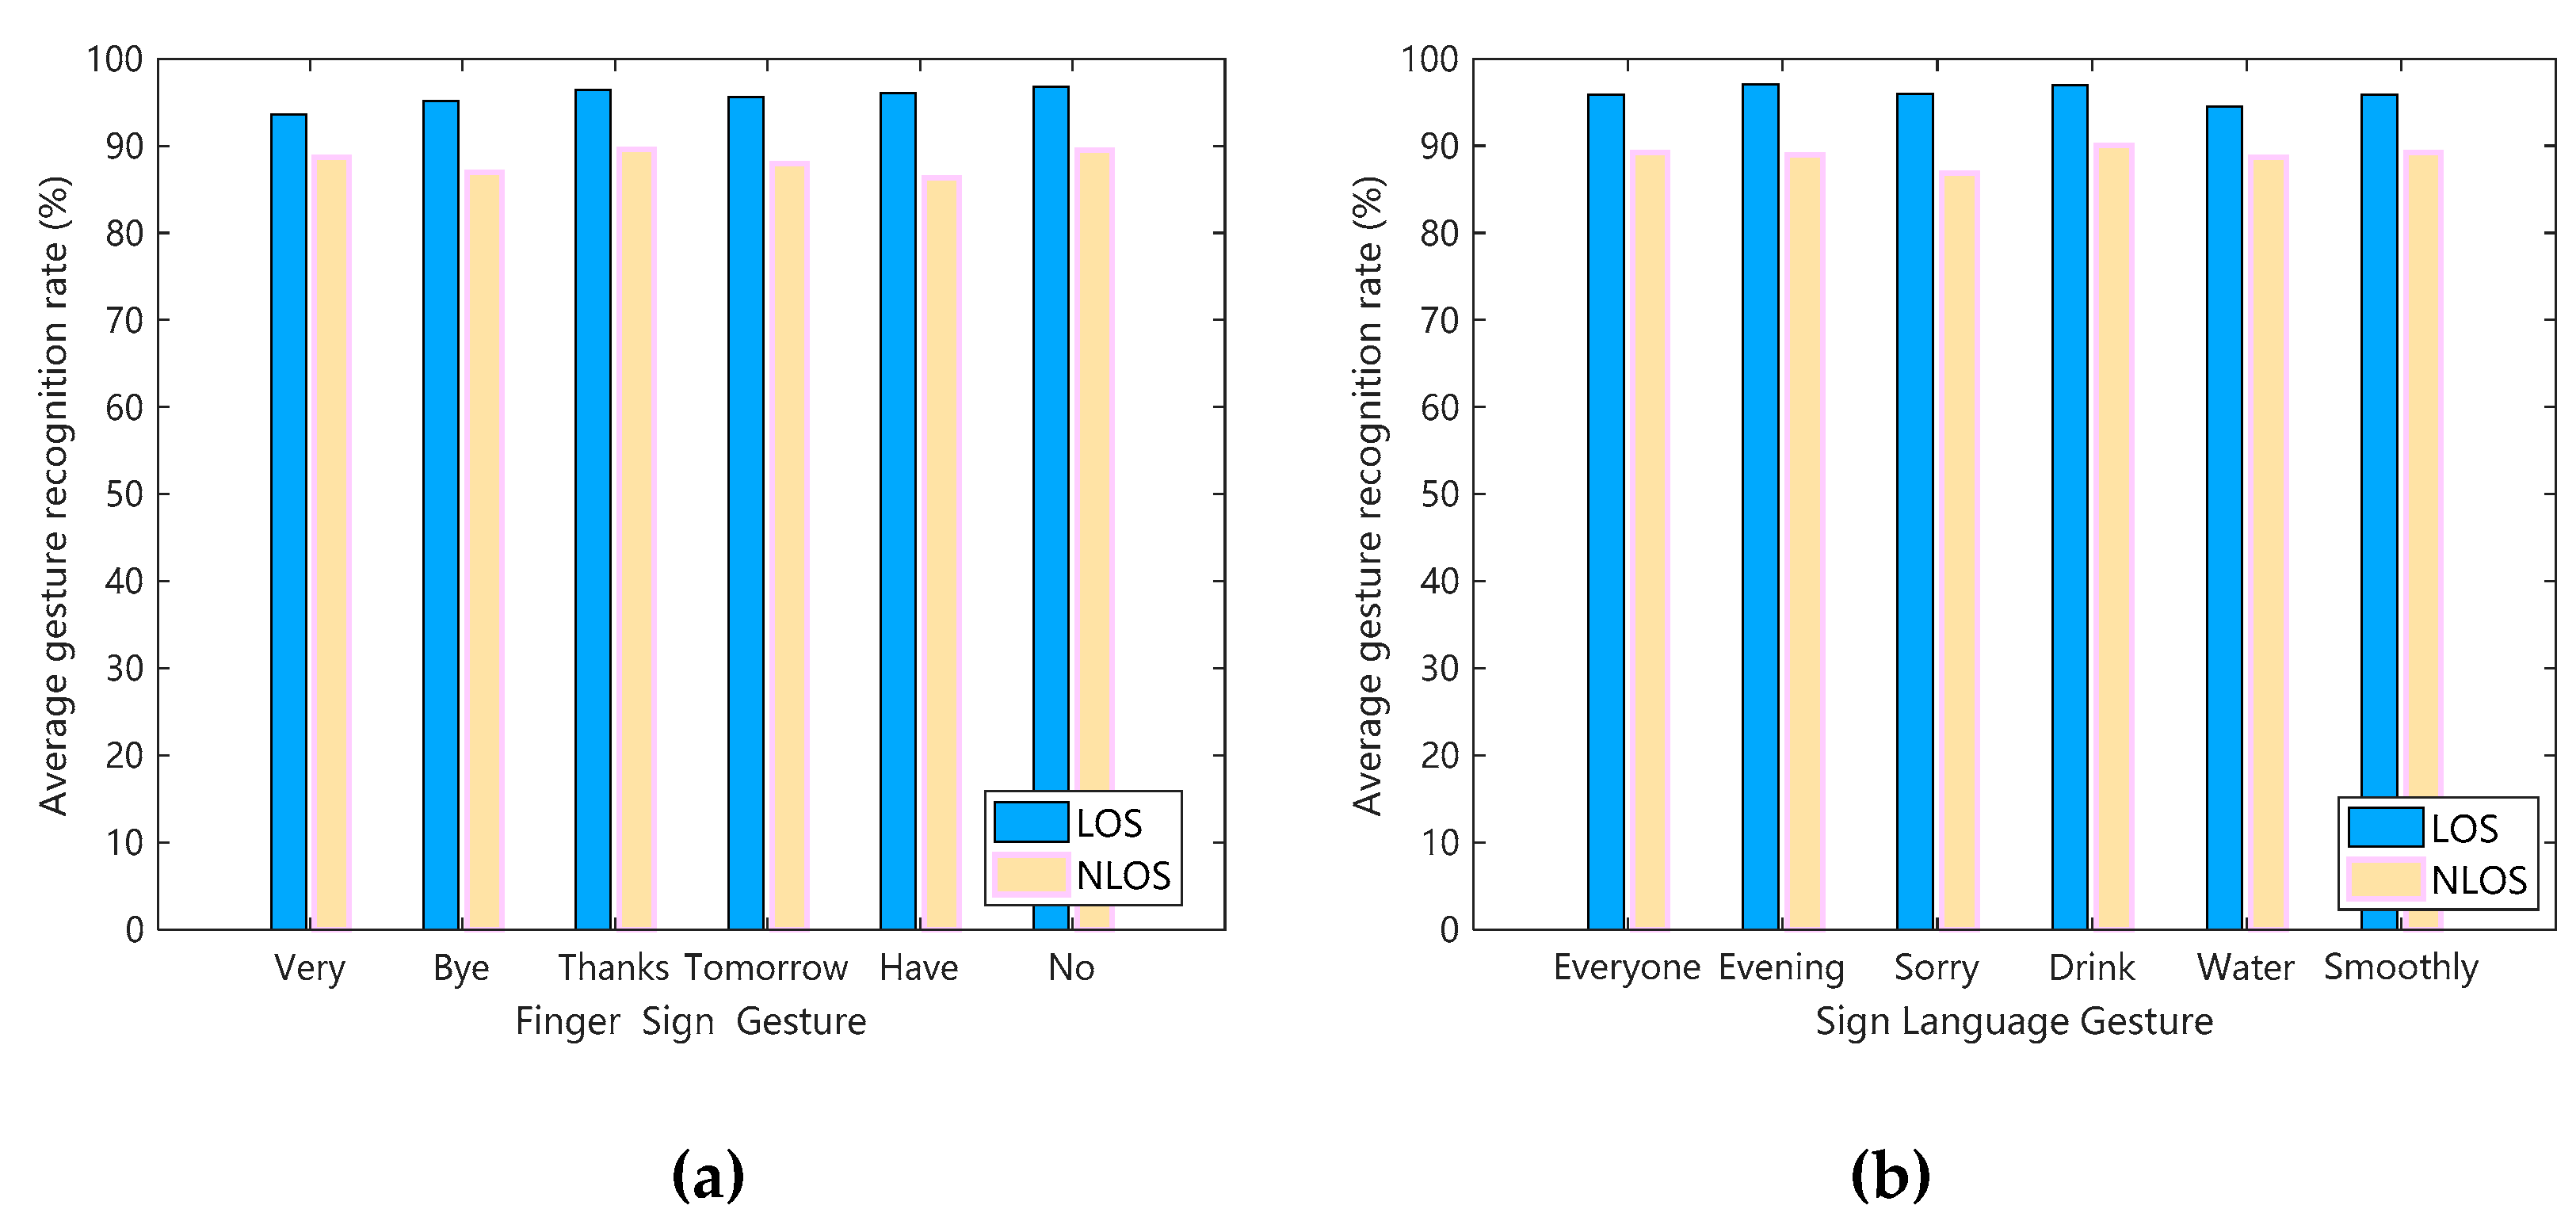
- In three scenarios, the corresponding multipath effect is from strong to weak (laboratory, corridor, hall) to test the performance of Wi-SL. The experimental results show that the system is highly robust, with an average recognition rate of 95.8% in Line-Of-Sight (LOS) and 89.3% in Non-Line-Of-Sight (NLOS).
2. Preliminary
2.1. Channel State Information
2.2. Human Gesture Recognition Based on WiFi Signal
2.3. Channel Feature Selection and Gesture Recognition
3. Wi-SL System Design
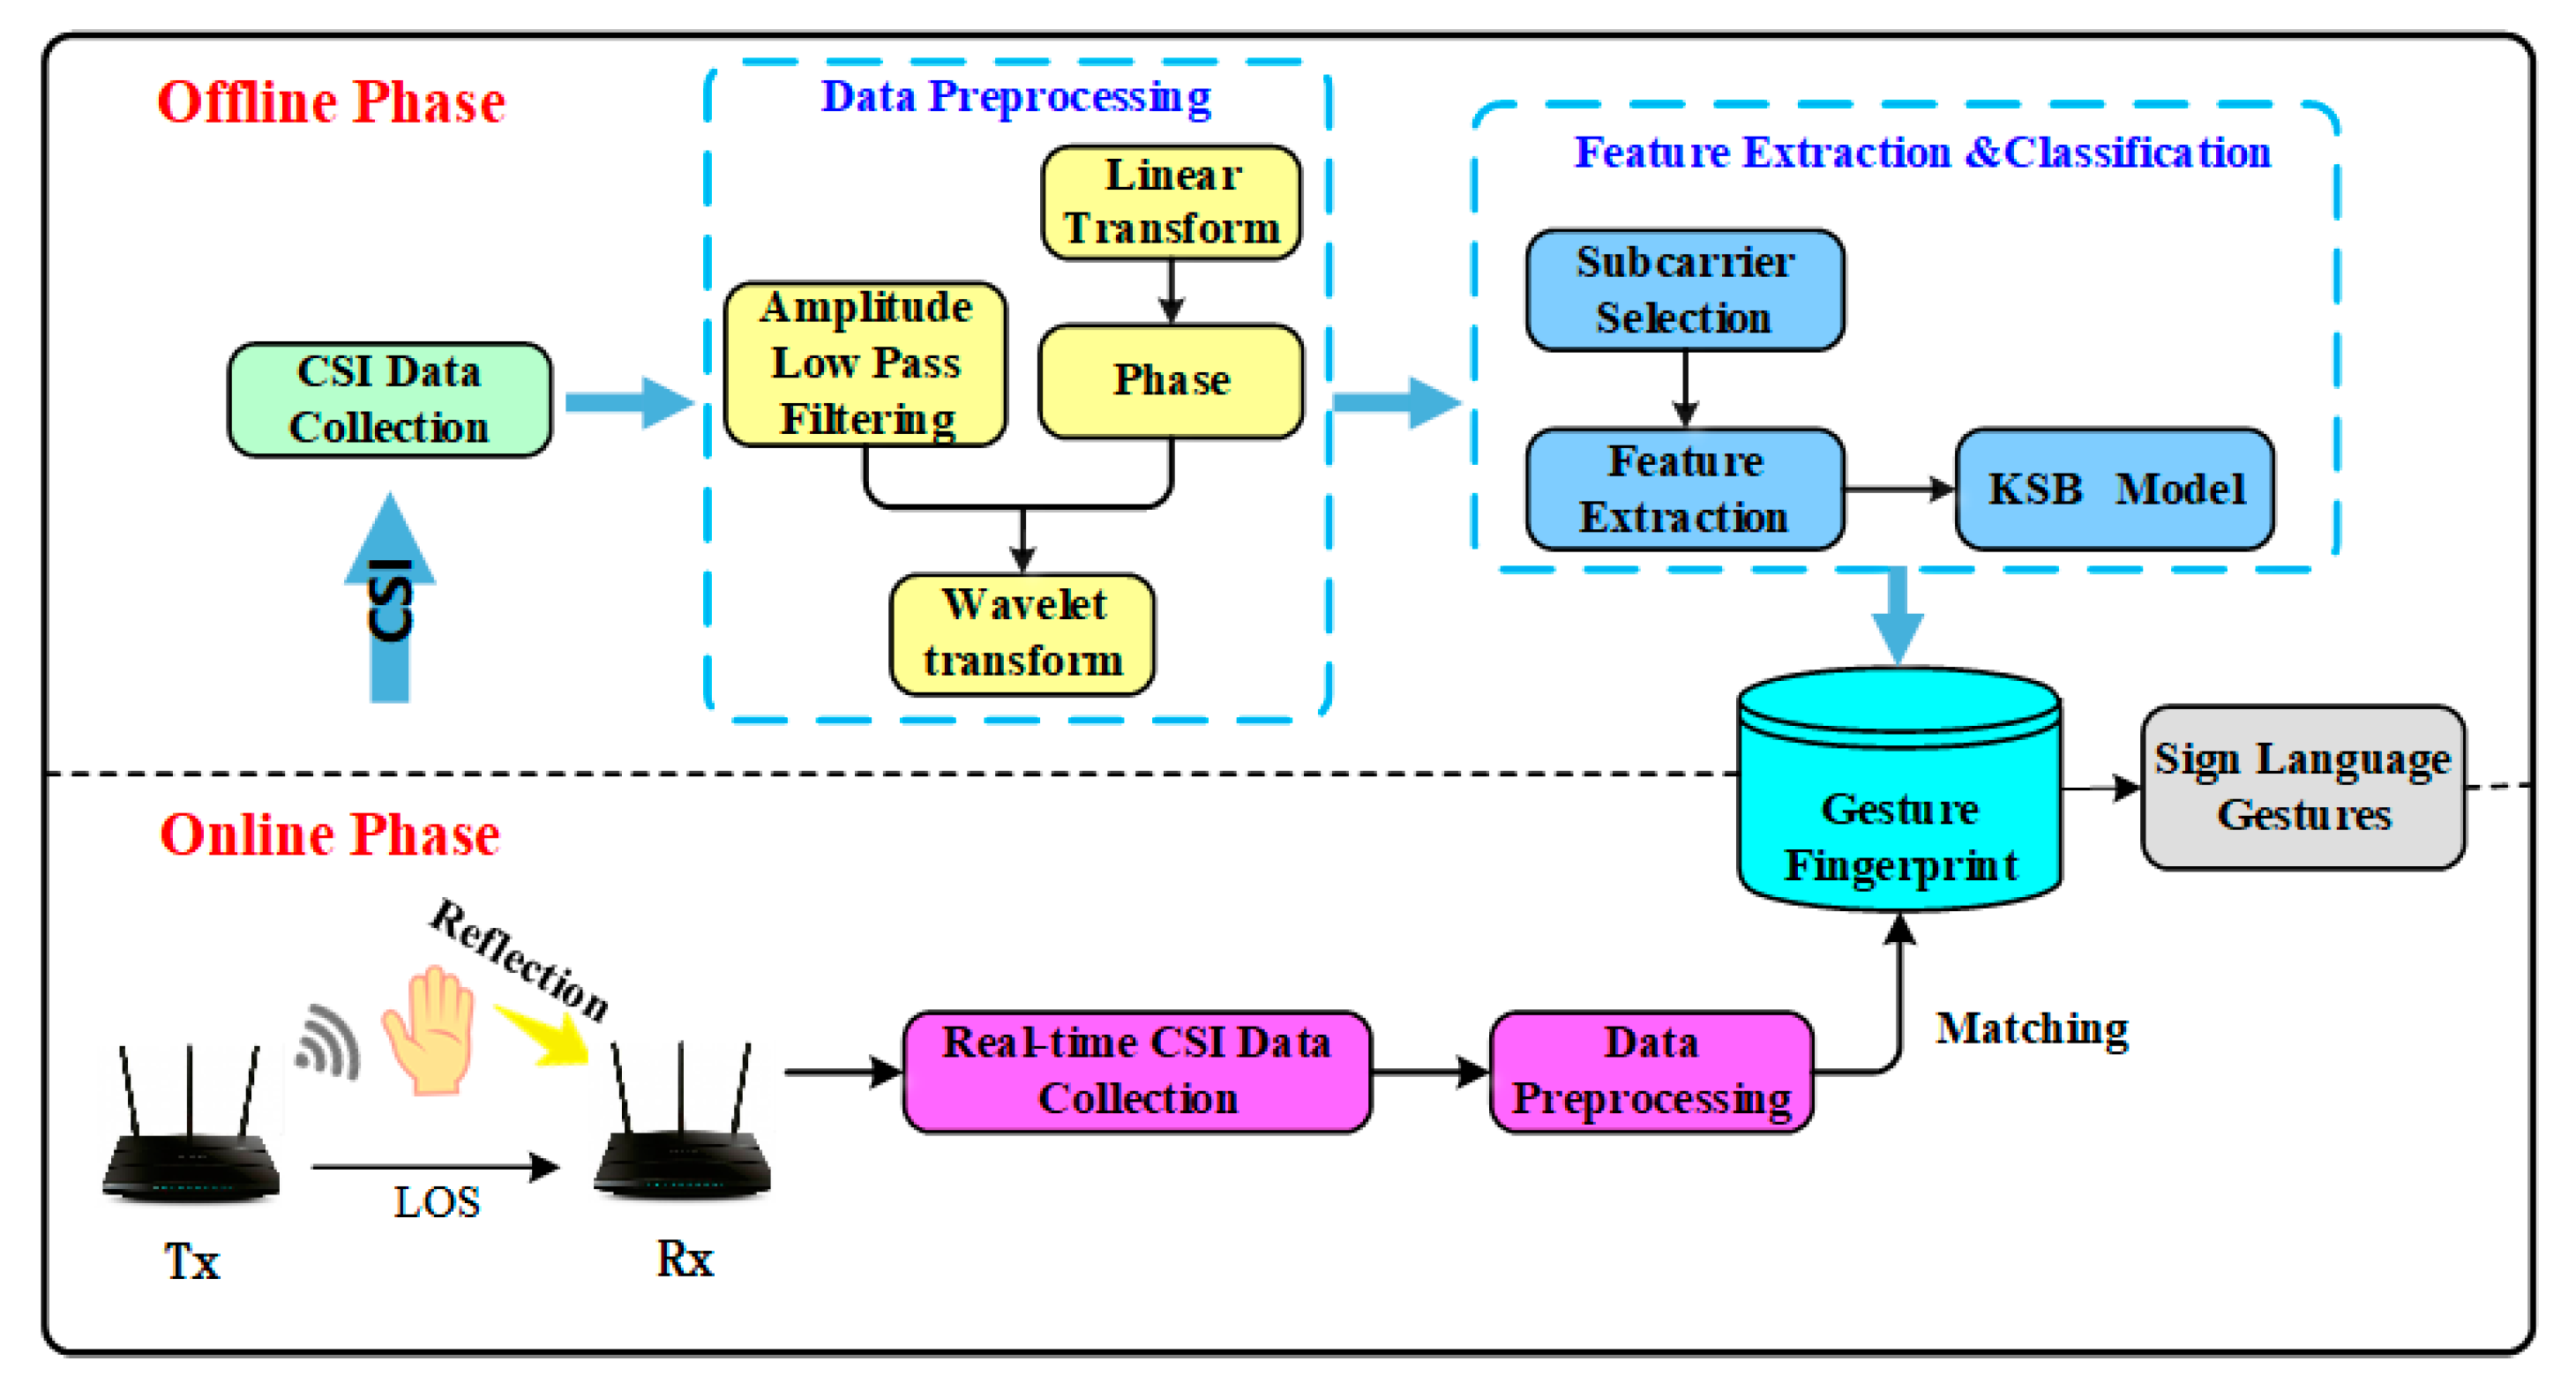
3.1. System Flow
3.2. Data Preprocessing
3.2.1. Amplitude De-Noising
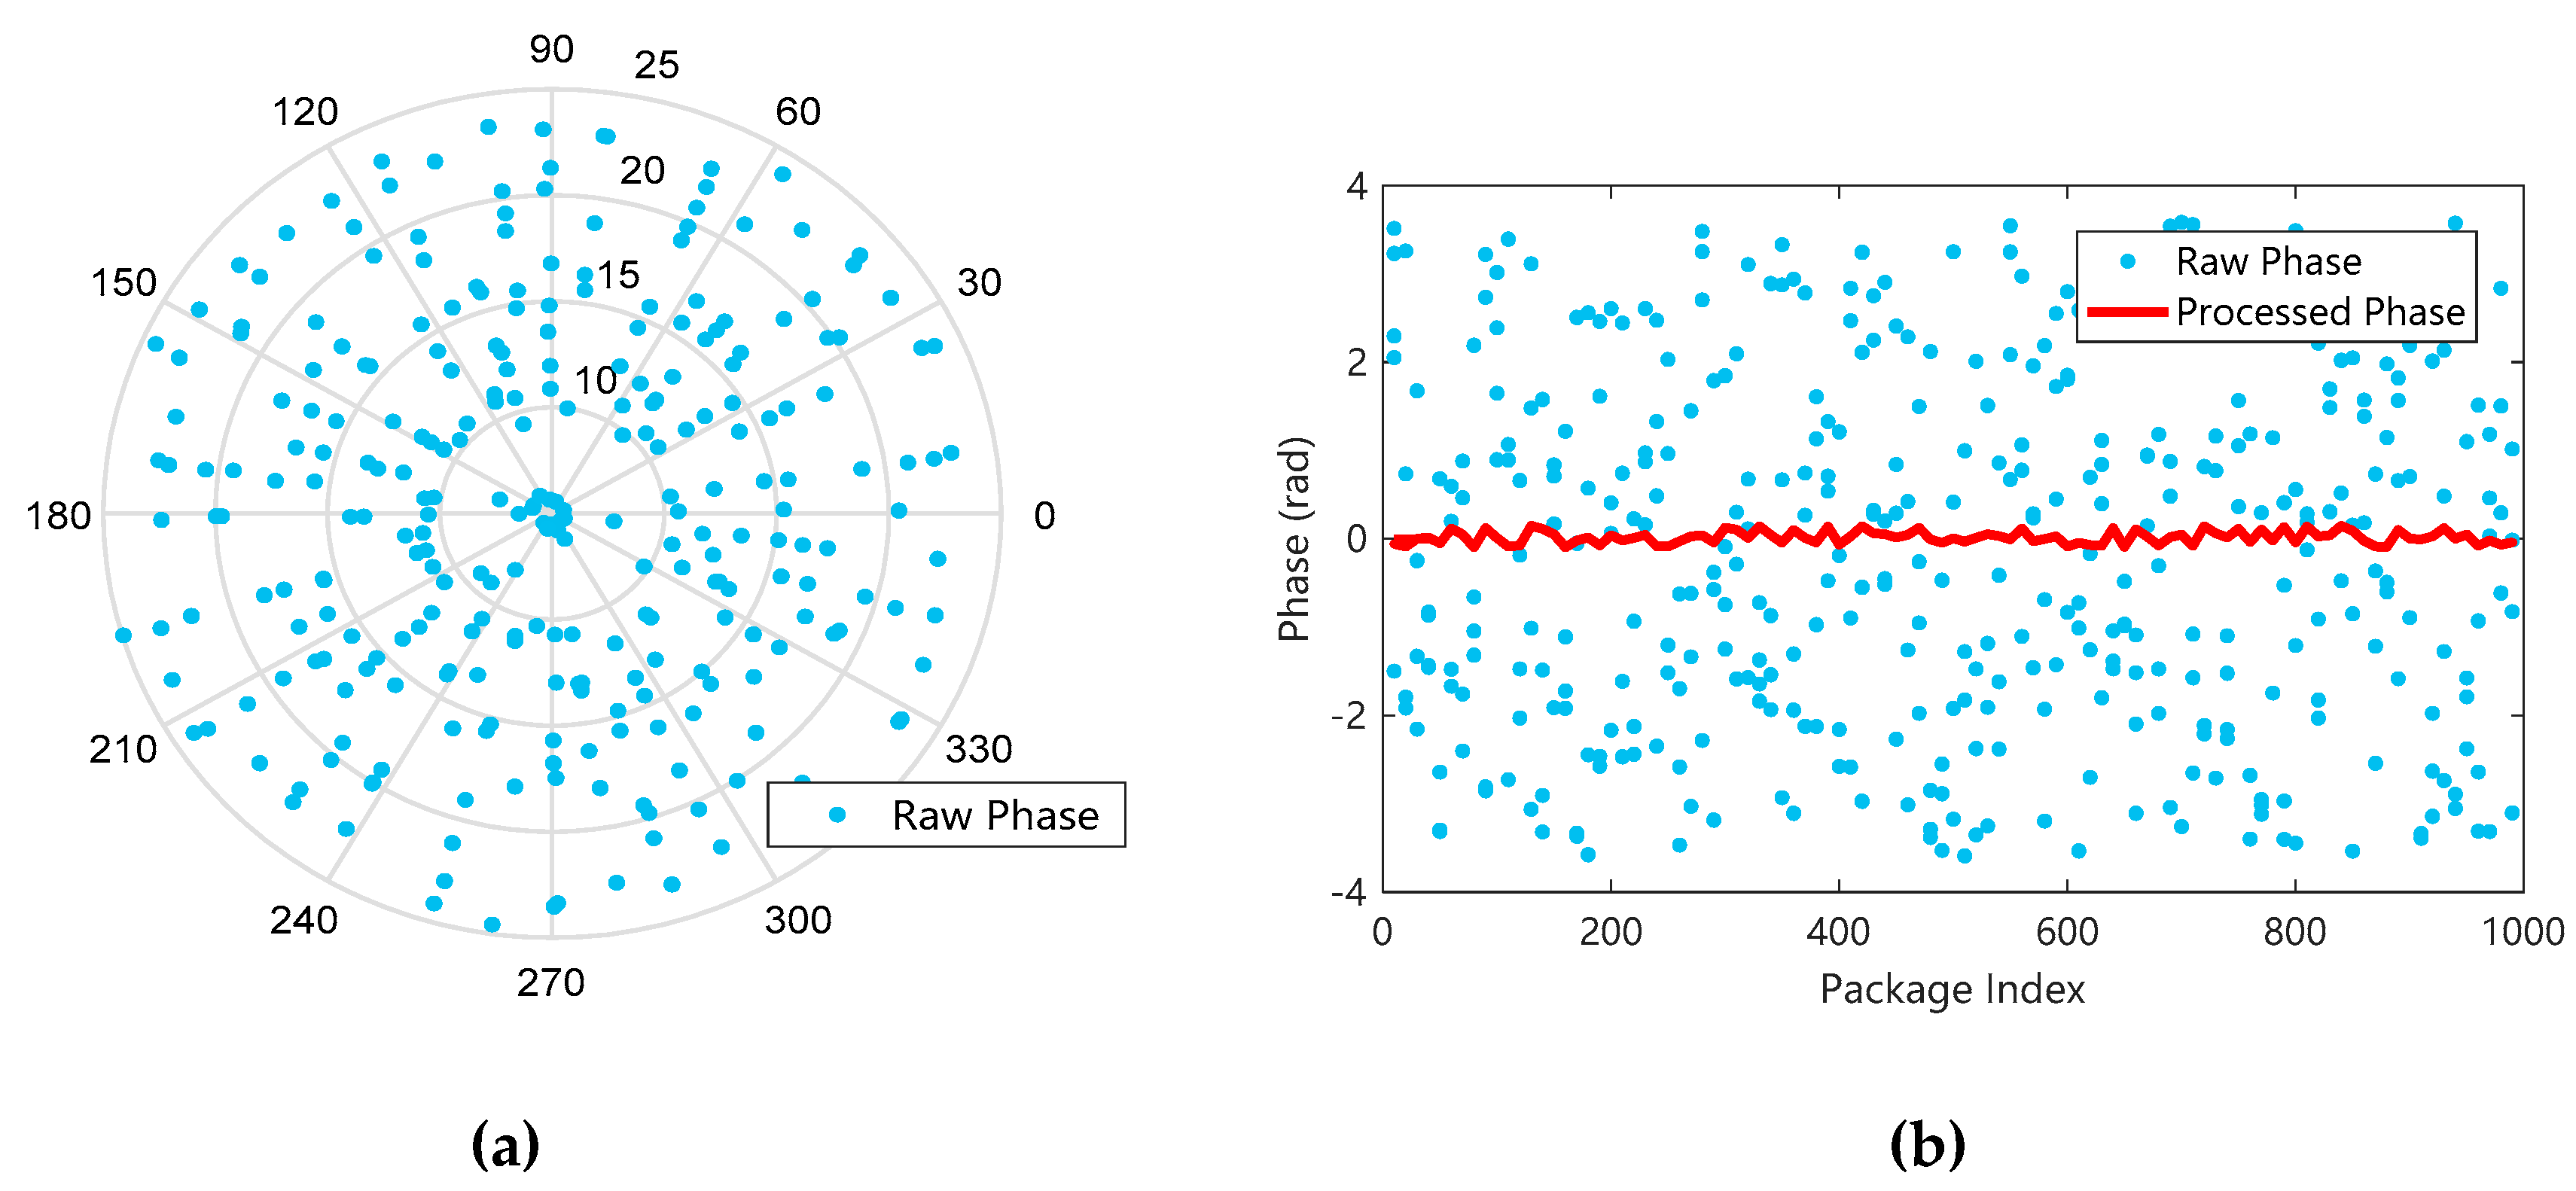
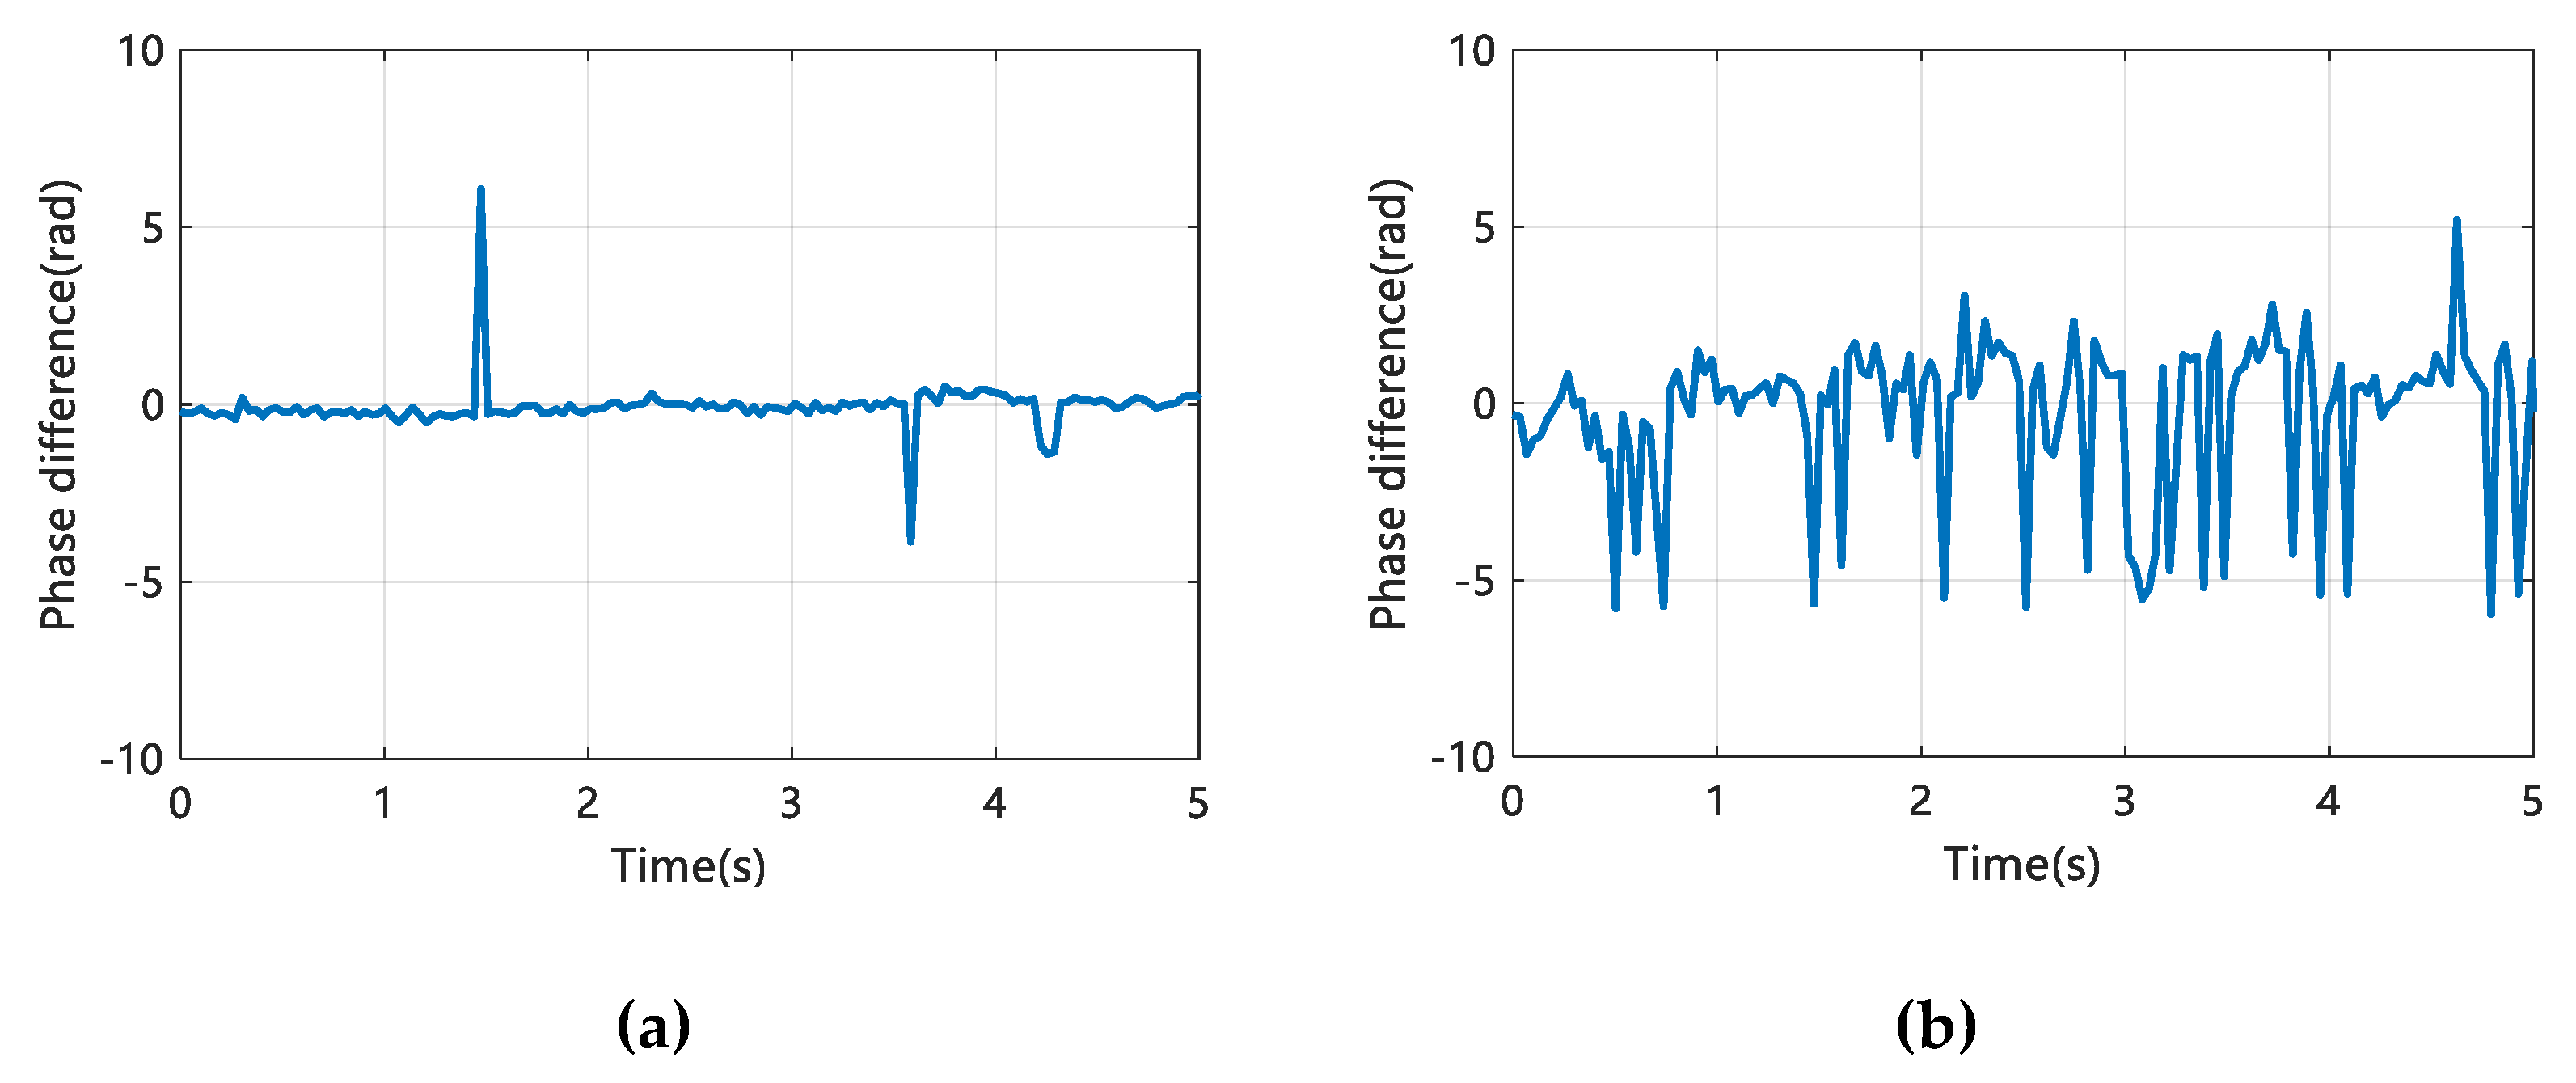
3.2.2. Obtain A Stable Phase Difference
3.3. The optimal Subcarrier Selection
3.4. Feature Extraction
3.5. KSB Classification Model
3.5.1. K-Means Clustering
3.5.2. SVM Classification
3.5.3. Bagging Algorithm Optimizes SVM Classifier
| Pseudo-code 1: Bagging optimizes SVM classifier |
| Input: Gesture feature training set |
| Set Base learner , Base learning algorithm SVC (Support Vector Machine Classifier); Set Training rounds . |
| Process: |
| 1: for do |
| 2: ( represents the sample distribution generated by self-service sampling) |
| 3: end for |
| 4: //The result of sample classification of basic learner (); |
| 5: // the predictive classification result of the base learner on the sample feature ; |
| 6: if then |
| 7: Return; |
| 8: otherwise, Return reject; |
| Output: (Strong classifier with result of sample classification) |
4. Wi-SL System Design
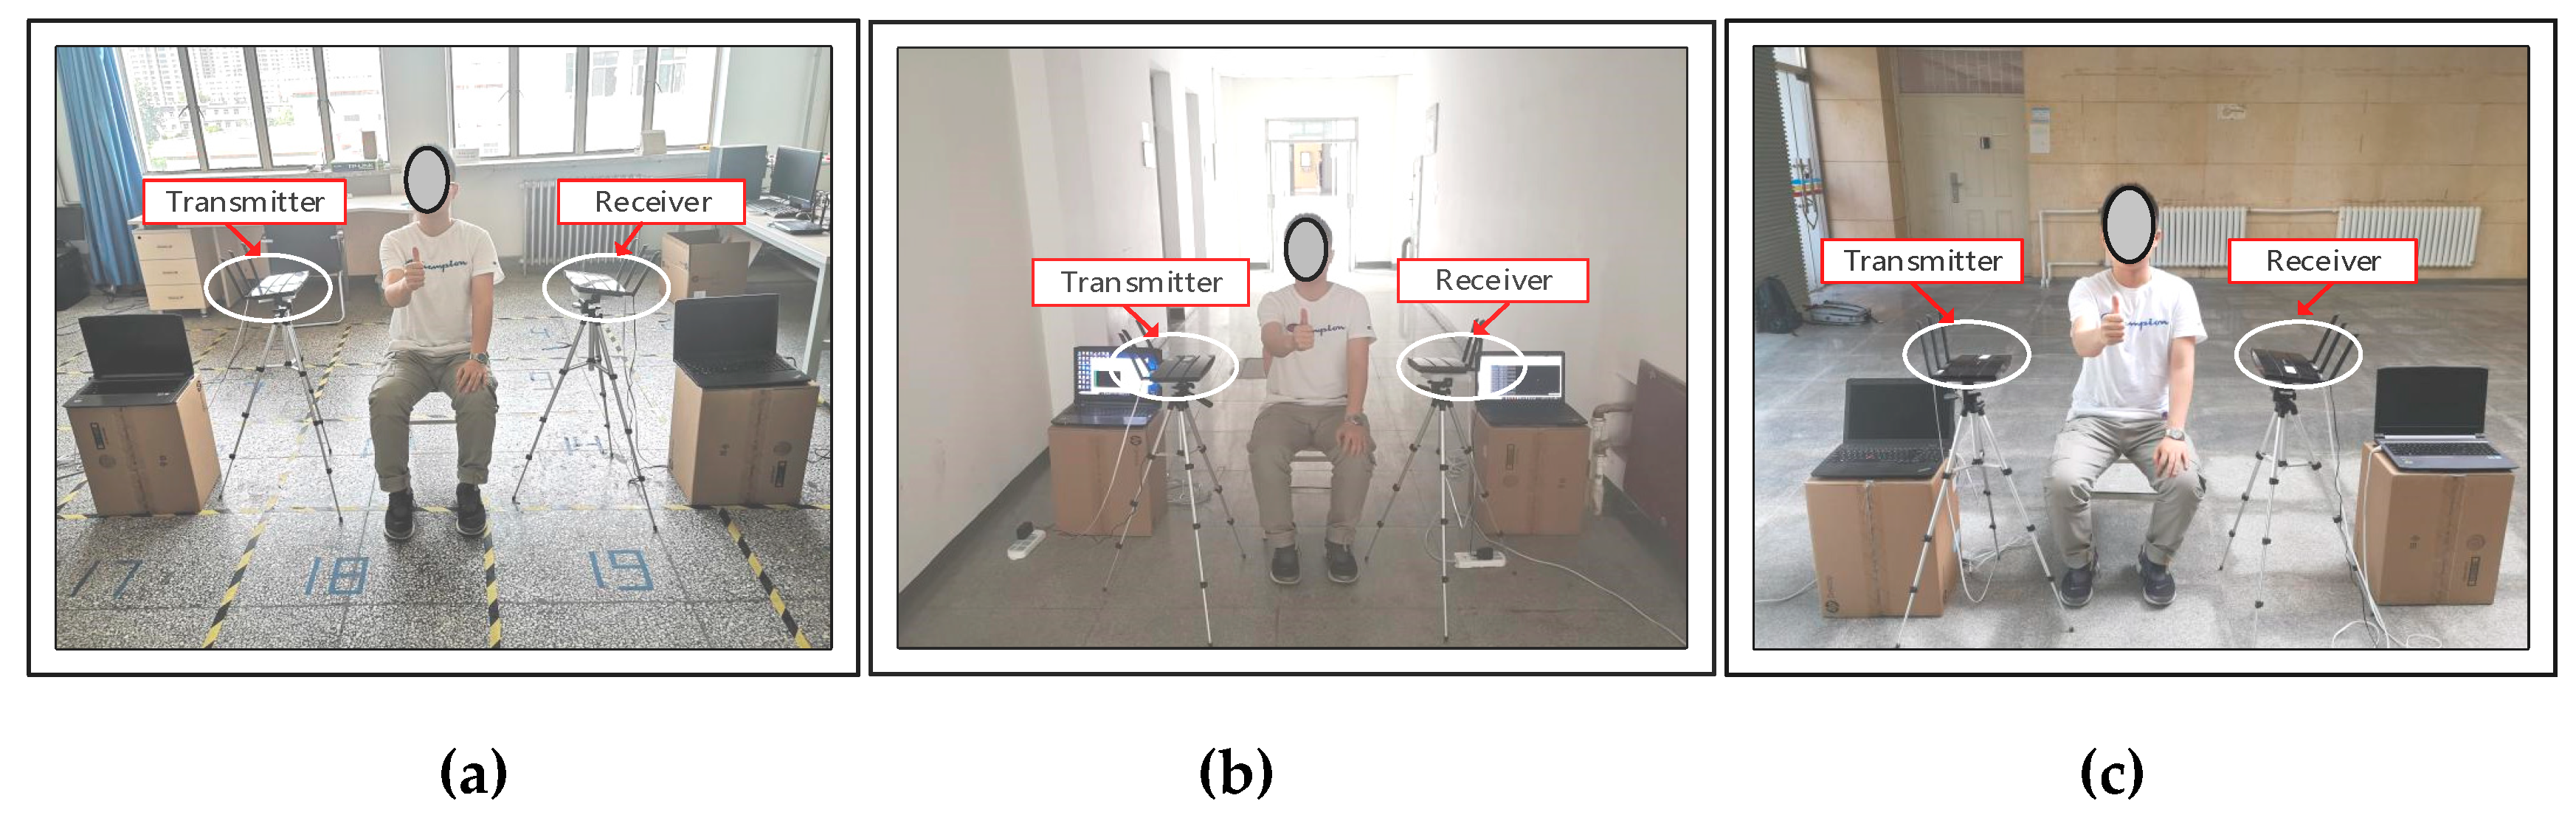
4.1. Experimental Configuration
4.2. Experimental Analysis
4.2.1. Impact of LOS/NLOS Scenarios
4.2.2. The Impact of User Diversity and Sign Language Range
4.2.3. The Impact of Channel Frequency and Bandwidth
4.2.4. The Influence of Distance and Personnel Interference in NLOS Scenario
4.3. Overall Performance Evaluation
4.3.1. Robustness Analysis
4.3.2. Classification Effect Evaluation
4.3.3. Comparison with Existing Technologies
5. Conclusions
Author Contributions
Funding
Acknowledgments
Conflicts of Interest
Abbreviations
| CSI | Channel State Information |
| SVM | Support Vector Machine |
| RSS | Received Signal Strength |
| KNN | k-Nearest Neighbor |
| MIMO | Multiple-Input Multiple-Output |
| OFDM | Orthogonal Frequency Division Multiplexing |
| KSB | K-means clustering, Support Vector Machine Classification and Bagging optimized |
| USRP | Universal Software Radio Peripheral |
| FMCW | Frequency Modulated Continuous Wave |
| MAC | Media Access Control |
| CFR | Channel Frequency Response |
| CIR | Channel Impulse Response |
| FFT | Fast Fourier Transform |
| DTW | Dynamic Time Warping |
| LOS | Line-Of-Sight |
| NLOS | Non-Line-Of-Sight |
| Tx | transmitter |
| Rx | receiver |
| SFO | sampling frequency offset |
| CFO | carrier frequency offset |
| PCA | Principal Components Analysis |
| SVC | Support Vector Machine Classifier |
| WLAN | Wireless Local Area Networks |
| LOF | Local Outlier Factor |
References
- Ma, Y.; Zhou, G.; Wang, S. WiFi Sensing with Channel State Information. ACM Comput. Surv. 2019, 52, 1–36. [Google Scholar] [CrossRef]
- Ahmed, H.F.T.; Ahmad, H.; Aravind, C.V.A. Device free human gesture recognition using Wi-Fi CSI: A survey. Eng. Appl. Artif. Intell. 2020, 87, 103281. [Google Scholar] [CrossRef]
- Jin, H.; Chen, Q.; Chen, Z.; Hu, I.; Zhang, J. Multi-LeapMotion sensor-based demonstration for robotic refine tabletop object manipulation task. Caai Trans. Intell. Technol. 2016, 1, 104–113. [Google Scholar] [CrossRef]
- Zhang, Z. Microsoft kinect sensor and its effect. IEEE Multimed. 2012, 19, 4–10. [Google Scholar] [CrossRef]
- Xu, Z.; Chen, X.; Li, Y.; Lantz, V.; Wang, K.; Yang, J. A framework for hand gesture recognition based on accelerometer and emg sensors. systems, man and cybernetics, Part A systems and humans. IEEE Trans. 2011, 41, 1064–1076. [Google Scholar]
- Gupta, H.P.; Chudgar, H.S.; Mukherjee, S.; Dutta, T.; Sharma, K. A continuous hand gestures recognition technique for human-machine interaction using accelerometer and gyroscope sensors. IEEE Sens. J. 2016, 16, 6425–6432. [Google Scholar] [CrossRef]
- Jung, P.G.; Lim, G.; Kim, S.; Kong, K.A. Wearable gesture recognition device for detecting muscular activities based on air-pressure sensors. Ind. Inform. IEEE Trans. 2015, 11, 485–494. [Google Scholar] [CrossRef]
- Balouchestani, M.; Krishnan, S. Effective low-power wearable wireless surface EMG sensor design based on analog-compressed sensing. Sensors 2014, 14, 24305–24328. [Google Scholar] [CrossRef]
- Zhou, J.; Malric, F.; Shirmohammadi, S. A new hand-measurement method to simplify calibration in cyberglove-based virtual rehabilitation. IEEE Trans. Instrum. Meas. 2010, 59, 2496–2504. [Google Scholar] [CrossRef]
- Choi, J.; Chun, S.A.; Cho, J.-W. Smart SecureGov: Mobile government security framework. In Proceedings of the 15th Annual International Conference on Digital Government Research (ACM), New York, NY, USA, 15–19 June 2014; pp. 91–99. [Google Scholar]
- Pu, Q.; Gupta, S.; Gollakota, S.; Patel, S. Whole-home gesture recognition using wireless signals. In Proceedings of the 19th Annual International Conference on Mobile Computing and Networking, Miami, FL, USA, 30 September–4 October 2013; pp. 27–38. [Google Scholar]
- Adib, F.; Kabelac, Z.; Katabi, D. Multi-person motion tracking via RF body reflections. In Proceedings of Usenix NSDI. 2015. Available online: http://hdl.handle.net/1721.1/86299 (accessed on 15 May 2020).
- Ma, Y.F.; Liu, S.; Chai, J.P. Research on 3D positioning indoor simulation based on RSSI. Appl. Mech. Mater. 2015, 696, 247–252. [Google Scholar] [CrossRef]
- Bollinger, P. Redpin–adaptive, zero-configuration indoor localization through user collaboration. In Proceedings of the First ACM International Workshop on Mobile Entity Localization and Tracking in GPS-Less Environments, San Francisco, CA, USA, 14–19 September 2008; pp. 55–60. [Google Scholar]
- Abdelnasser, H.; Youssef, M.; Harras, K.A.; Heba, A. WiGest: A ubiquitous WiFi-based gesture recognition system. In Proceedings of the 2015 IEEE Conference on Computer Communications (INFOCOM); Institute of Electrical and Electronics Engineers (IEEE), Hong Kong, China, 26 April–1 May 2015; pp. 1472–1480. [Google Scholar]
- Dang, X.; Tang, X.; Hao, Z.; Liu, Y. A device-free indoor localization method using CSI with Wi-Fi signals. Sensors 2019, 19, 3233. [Google Scholar] [CrossRef] [PubMed]
- Hao, Z.; Yan, Y.; Dang, X.; Shao, C. Endpoints-clipping CSI amplitude for SVM-based indoor localization. Sensors 2019, 19, 3689. [Google Scholar] [CrossRef] [PubMed]
- Wu, X.; Chu, Z.; Yang, P.; Xiang, C.; Zheng, X.; Huang, W. TW-See: Human activity recognition through the wall with commodity Wi-Fi devices. IEEE Trans. Veh. Technol. 2019, 68, 306–319. [Google Scholar] [CrossRef]
- Xiao, N.; Yang, P.; Yan, Y.; Zhou, H.; Li, X.; Du, H. Motion-Fi+: Recognizing and counting repetitive motions with wireless backscattering. IEEE Trans. Mob. Comput. 2020. [Google Scholar] [CrossRef]
- Wang, Y.; Wu, K.; Ni, L.M. WiFall: Device-free fall detection by wireless networks. IEEE Trans. Mob. Comput. 2017, 16, 581–594. [Google Scholar] [CrossRef]
- Damodaran, N.; Haruni, E.; Kokhkharova, M.; Schäfer, J. Device free human activity and fall recognition using WiFi channel state information (CSI). CCF Trans. Pervasive Comput. Interact. 2020, 2, 1–17. [Google Scholar] [CrossRef]
- He, W.; Wu, K.; Zou, Y.; Ming, Z. WiG: WiFi-Based Gesture Recognition System. In Proceedings of the 2015 24th International Conference on Computer Communication and Networks (ICCCN), Las Vegas, NV, USA, 3–6 August 2015; pp. 1–7. [Google Scholar]
- Li, H.; Yang, W.; Wang, J.; Xu, Y.; Huang, L. WiFinger: Talk to your smart devices with finger-grained gesture. In Proceedings of the UbiComp 2016 ACM International Joint Conference on Pervasive and Ubiquitous Computing, Heidelberg, Germany, 12–16 September 2016; pp. 250–261. [Google Scholar]
- Virmani, A.; Shahzad, M. Position and orientation agnostic gesture recognition using wifi. In Proceedings of the 15th Annual International Conference on Mobile Systems, Niagara Falls, NY, USA, 19–23 June 2017; pp. 252–264. [Google Scholar]
- Al-Qaness, M.A.A.; Li, F. WiGeR: WiFi-Based Gesture Recognition System. ISPRS Int. J. Geo-Information 2016, 5, 92. [Google Scholar] [CrossRef]
- Shang, J.; Wu, J. A Robust Sign Language Recognition System with Multiple Wi-Fi Devices. In Proceedings of the Workshop on Mobility in the Evolving Internet Architecture; MobiArch ’17, Los Angeles, CA, USA, 21–25 August 2017; pp. 19–24. [Google Scholar]
- Niu, K.; Zhang, F.; Jiang, Y.; Xiong, J.; Lv, Q.; Zeng, Y.; Zhang, D. WiMorse: A contactless morse code text input system using ambient WiFi signals. IEEE Internet Things J. 2019, 6, 9993–10008. [Google Scholar] [CrossRef]
- Wang, Z.; Guo, B.; Yu, Z.; Zhou, X. Wi-Fi CSI based behavior recognition: From signals, actions to activities. IEEE Commun. Mag. 2017, 56, 109–115. [Google Scholar] [CrossRef]
- Wang, W.; Liu, A.X.; Shahzad, M.; Ling, K.; Lu, S. Understanding and modeling of WiFi signal based human activity recognition. In Proceedings of the 21st Annual International Conference on Mobile Computing and Networking, New York, NY, USA, 7–11 September 2015; pp. 65–76. [Google Scholar]
- Xin, T.; Guo, B.; Wang, Z. Freesense: A robust approach for indoor human detection using wi-fi signals. Proc. ACM Interact. Mob. Wearable Ubiquitous Technol. 2018, 2, 1–23. [Google Scholar] [CrossRef]
- Liu, W.; Wang, S.; Wang, L. From Lens to Prism: Device-free modeling and recognition of multi-part activities. IEEE Access 2018, 6, 36271–36282. [Google Scholar]
- Xin, T.; Guo, B.; Wang, Z. FreeSense: Human-behavior understanding using Wi-Fi signals. J. Ambient Intell. Humaniz. Comput. 2018, 9, 1–12. [Google Scholar] [CrossRef]
- Gjengset, J.; Xiong, J.; McPhillips, G.; Jamieson, K. Phaser: Enabling phased array signal processing on commodity WiFi access points. In Proceedings of the 20th Annual International Conference on Mobile Computing and Networking, Maui, HI, USA, 7–11 September 2014; pp. 153–164. [Google Scholar]
- Dang, X.; Si, X.; Hao, Z.; Huang, Y. A novel passive indoor localization method by fusion CSI amplitude and phase information. Sensors 2019, 19, 875. [Google Scholar] [CrossRef] [PubMed]
- Sen, S.; Radunovic, B.; Choudhury, R.R.; Minka, T. You are facing the Mona Lisa: Spot localization using PHY layer information. In Proceedings of the 10th International Conference on Mobile Systems, Applications, and Services, Low Wood Bay, Lake District, UK, 25–29 June 2012. [Google Scholar]
- Enjie, D.; Xiansheng, L.; Tong, Z. A robust passive intrusion detection system with commodity WiFi devices. J. Sens. 2018, 2018, 1–12. [Google Scholar]
- Bishop, C.M. Pattern Recognition and Machine Learning (Information Science and Statistics); Springer: New York, NY, USA, 2006. [Google Scholar]
- Chang, C.C.; Lin, C.J. LIBSVM: A library for support vector machines. ACM Trans. Intelligent Syst. Technol. 2011, 2, 27:1–27:27. [Google Scholar] [CrossRef]
- Gabryel, M.; Rutkowski, L. Evolutionary Methods for Designing Neuro-fuzzy Modular Systems Combined by Bagging Algorithm. In Proceedings of the 9th international conference on Artificial Intelligence and Soft Computing (ICAISC ’08), Zakopane, Poland, 22–26 June 2008; pp. 398–404. [Google Scholar]
- Amiri, S.; Rosen, D.V. On the efficiency of bootstrap method into the analysis contingency table. Comput. Methods Programs Biomed. 2011, 104, 182–187. [Google Scholar] [CrossRef]
- Xie, Y.; Li, Z.; Li, M. Precise Power Delay Profiling with Commodity WiFi. In Proceedings of the 21st ACM Annual International Conference on Mobile Computing and Networking (MobiCom ’15), Paris, France, 7–11 September 2015; pp. 53–64. [Google Scholar]
- Tian, Z.; Wang, J.; Yang, X. WiCatch: A Wi-Fi based hand gesture recognition system. IEEE Access 2018, 6, 16911–16923. [Google Scholar] [CrossRef]


| Data Collection | |||||
|---|---|---|---|---|---|
| User Age/Sex | Ht/Wt | Gestures Collected | Collection Times | Duration | |
| User1 | 26/Male | 75 kg/176 cm | G1–G12 | 5 | 1.67 h |
| User2 | 25/Male | 80 kg/180 cm | G1–G6 | 3 | 0.50 h |
| User3 | 23/Male | 95 kg/187 cm | G1–G12 | 8 | 2.67 h |
| User4 | 23/Female | 48 kg/162 cm | G1–G12 | 4 | 1.33 h |
| User5 | 24/Female | 55 kg/170 cm | G7–G12 | 2 | 0.33 h |
| Data Collection | Offline Phase | Online Recognition | |
|---|---|---|---|
| Hardware type | TP-Link router | Lenovo laptop | TP-Link router + Lenovo laptop |
| Processing time | 102.52 s | 12.01 s | 1.21 s |
| Bandwidth | Channel Frequency Segment | Number of Sub-Carriers | Index of Sub-Carriers |
|---|---|---|---|
| 20 MHz | 2.412~2.472 GHz | 56 | (−28, −27,...,−2,−1,1,2,...,27,28) |
| 40 MHz | 5.725~5.825 GHz | 114 | (−58, −57, −56,...,−3,−2,2,3,...,56,57,58) |
| Definition of Metrics | Also Defined | The Role of Metric |
|---|---|---|
| The probability of accurate detection of gesture detection. | ||
| Correctly identify the probability of detecting gestures in the scenario. | ||
| Correctly identify the probability of undetected gestures in the scenario. | ||
| A comprehensive index that can effectively evaluate the stability of the method. |
| Parameters | Mtheods | |||
|---|---|---|---|---|
| Wi-SL | Computer Vision | Wearable Sensors | Radio Equipment | |
| Intrusive or privacy | No | Yes | Yes | No |
| Deployment costs | Low | Medium | High | High |
| Device-free | Yes | No | No | No |
| System complexity | Low | High | High | Medium |
| Detection accuracy | High | High | High | High |
© 2020 by the authors. Licensee MDPI, Basel, Switzerland. This article is an open access article distributed under the terms and conditions of the Creative Commons Attribution (CC BY) license (http://creativecommons.org/licenses/by/4.0/).
Share and Cite
Hao, Z.; Duan, Y.; Dang, X.; Liu, Y.; Zhang, D. Wi-SL: Contactless Fine-Grained Gesture Recognition Uses Channel State Information. Sensors 2020, 20, 4025. https://doi.org/10.3390/s20144025
Hao Z, Duan Y, Dang X, Liu Y, Zhang D. Wi-SL: Contactless Fine-Grained Gesture Recognition Uses Channel State Information. Sensors. 2020; 20(14):4025. https://doi.org/10.3390/s20144025
Chicago/Turabian StyleHao, Zhanjun, Yu Duan, Xiaochao Dang, Yang Liu, and Daiyang Zhang. 2020. "Wi-SL: Contactless Fine-Grained Gesture Recognition Uses Channel State Information" Sensors 20, no. 14: 4025. https://doi.org/10.3390/s20144025
APA StyleHao, Z., Duan, Y., Dang, X., Liu, Y., & Zhang, D. (2020). Wi-SL: Contactless Fine-Grained Gesture Recognition Uses Channel State Information. Sensors, 20(14), 4025. https://doi.org/10.3390/s20144025