Electrochemical Nanobiosensors for Detection of Breast Cancer Biomarkers


Abstract
1. Introduction
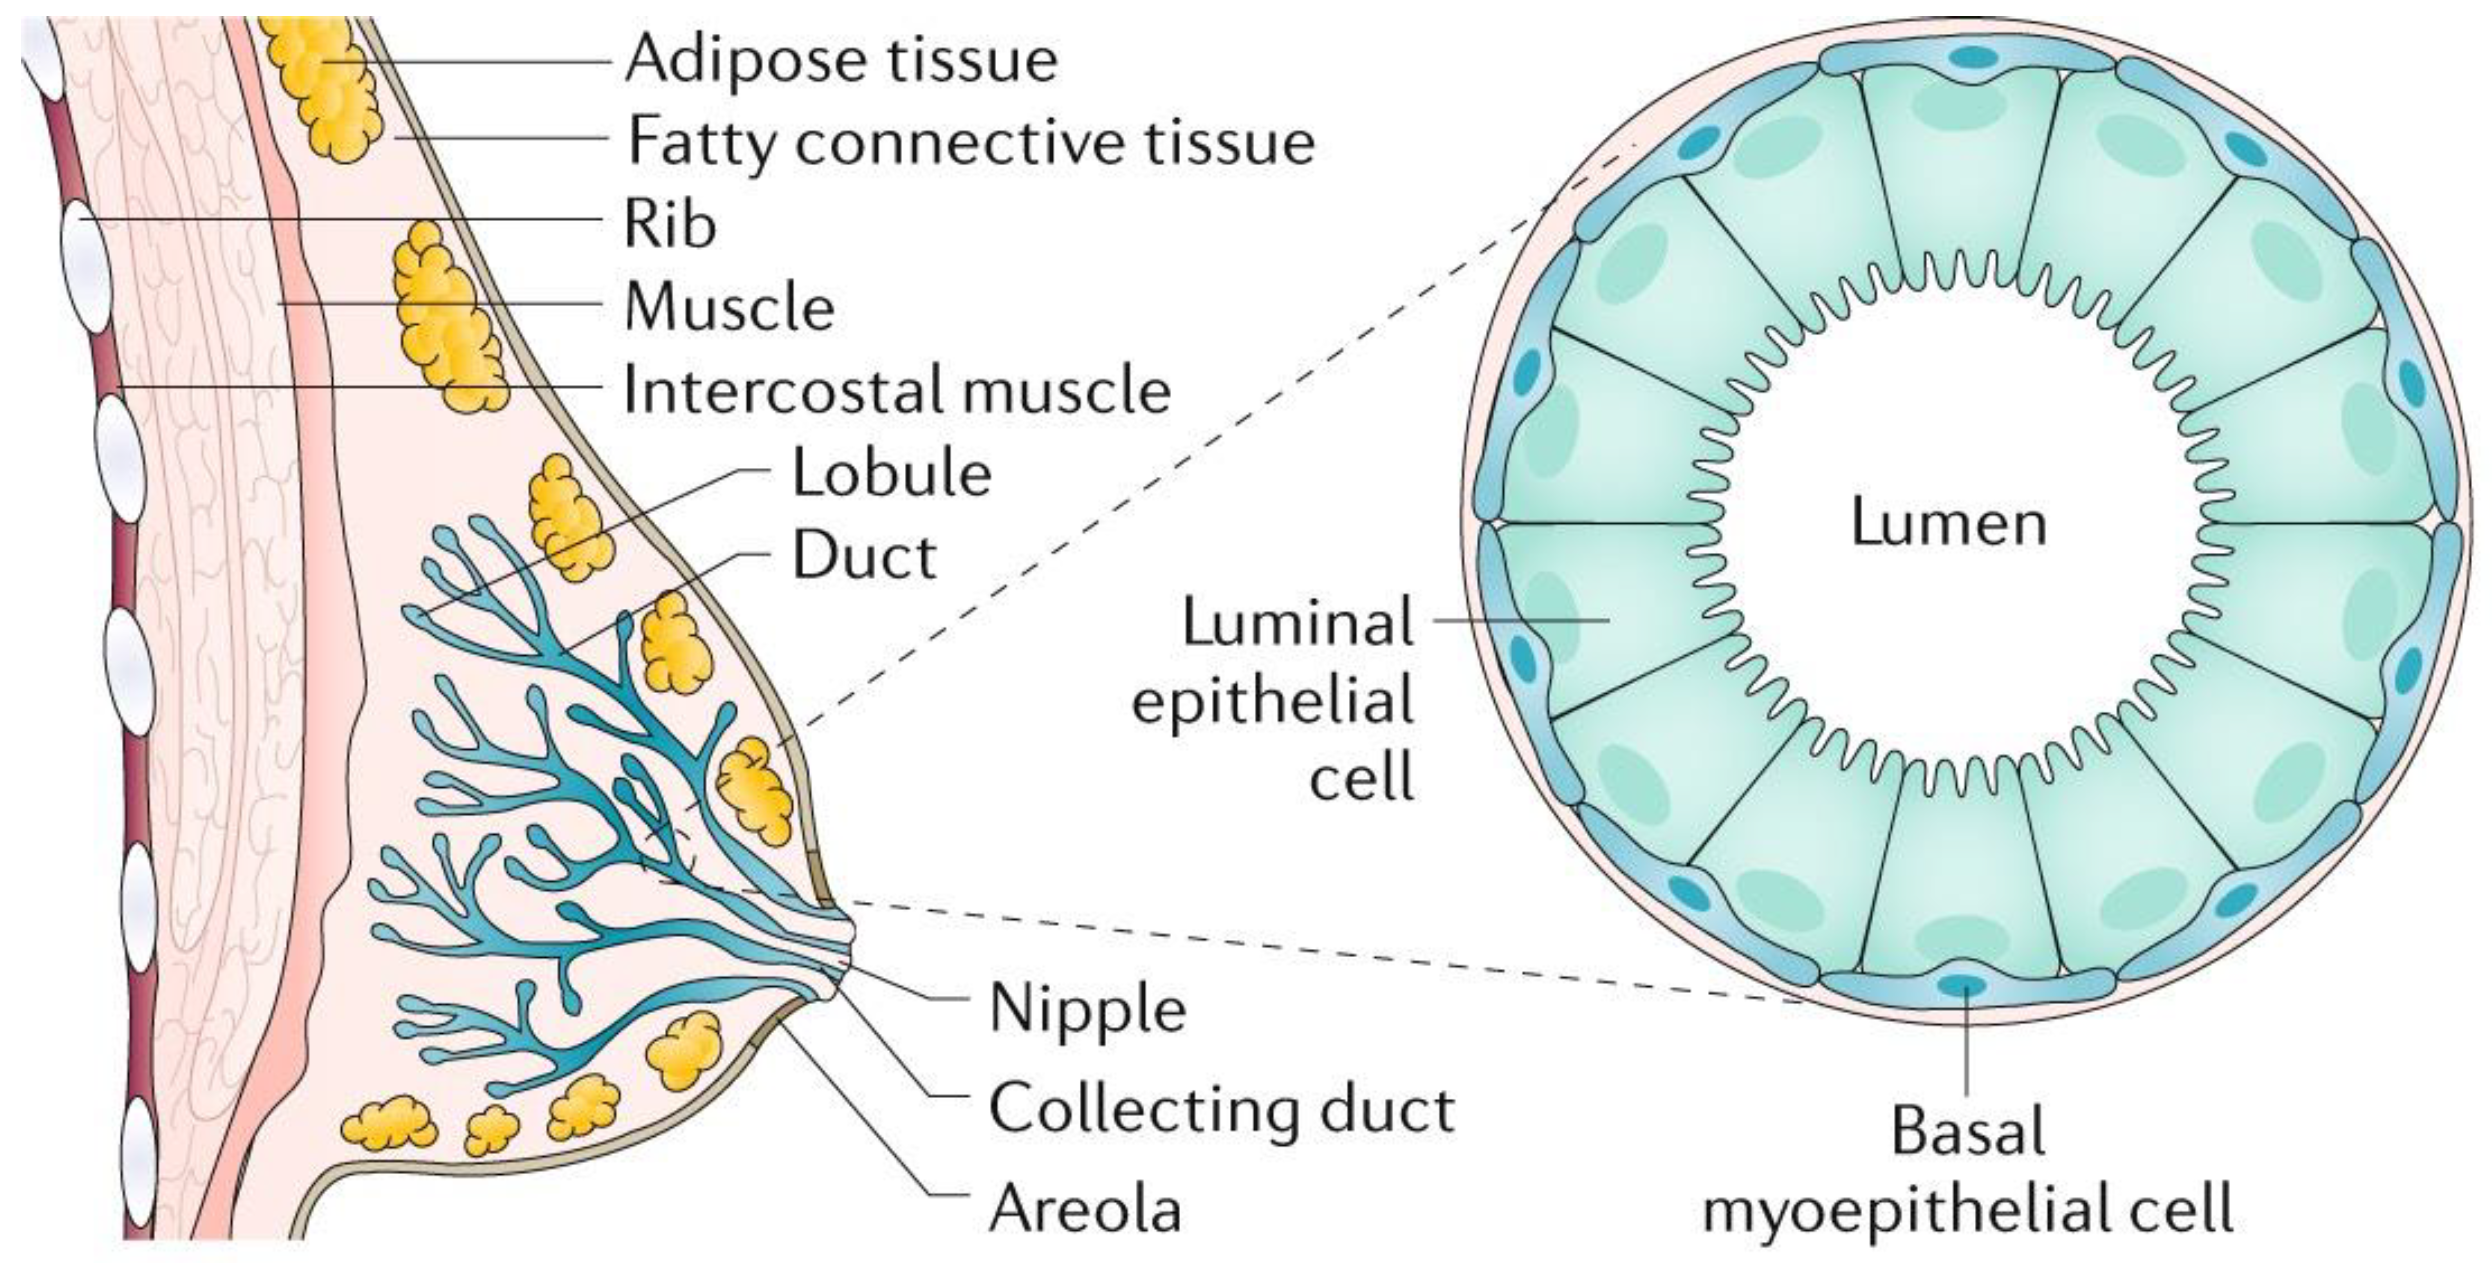
2. Breast Pathology
3. BC Biomarkers
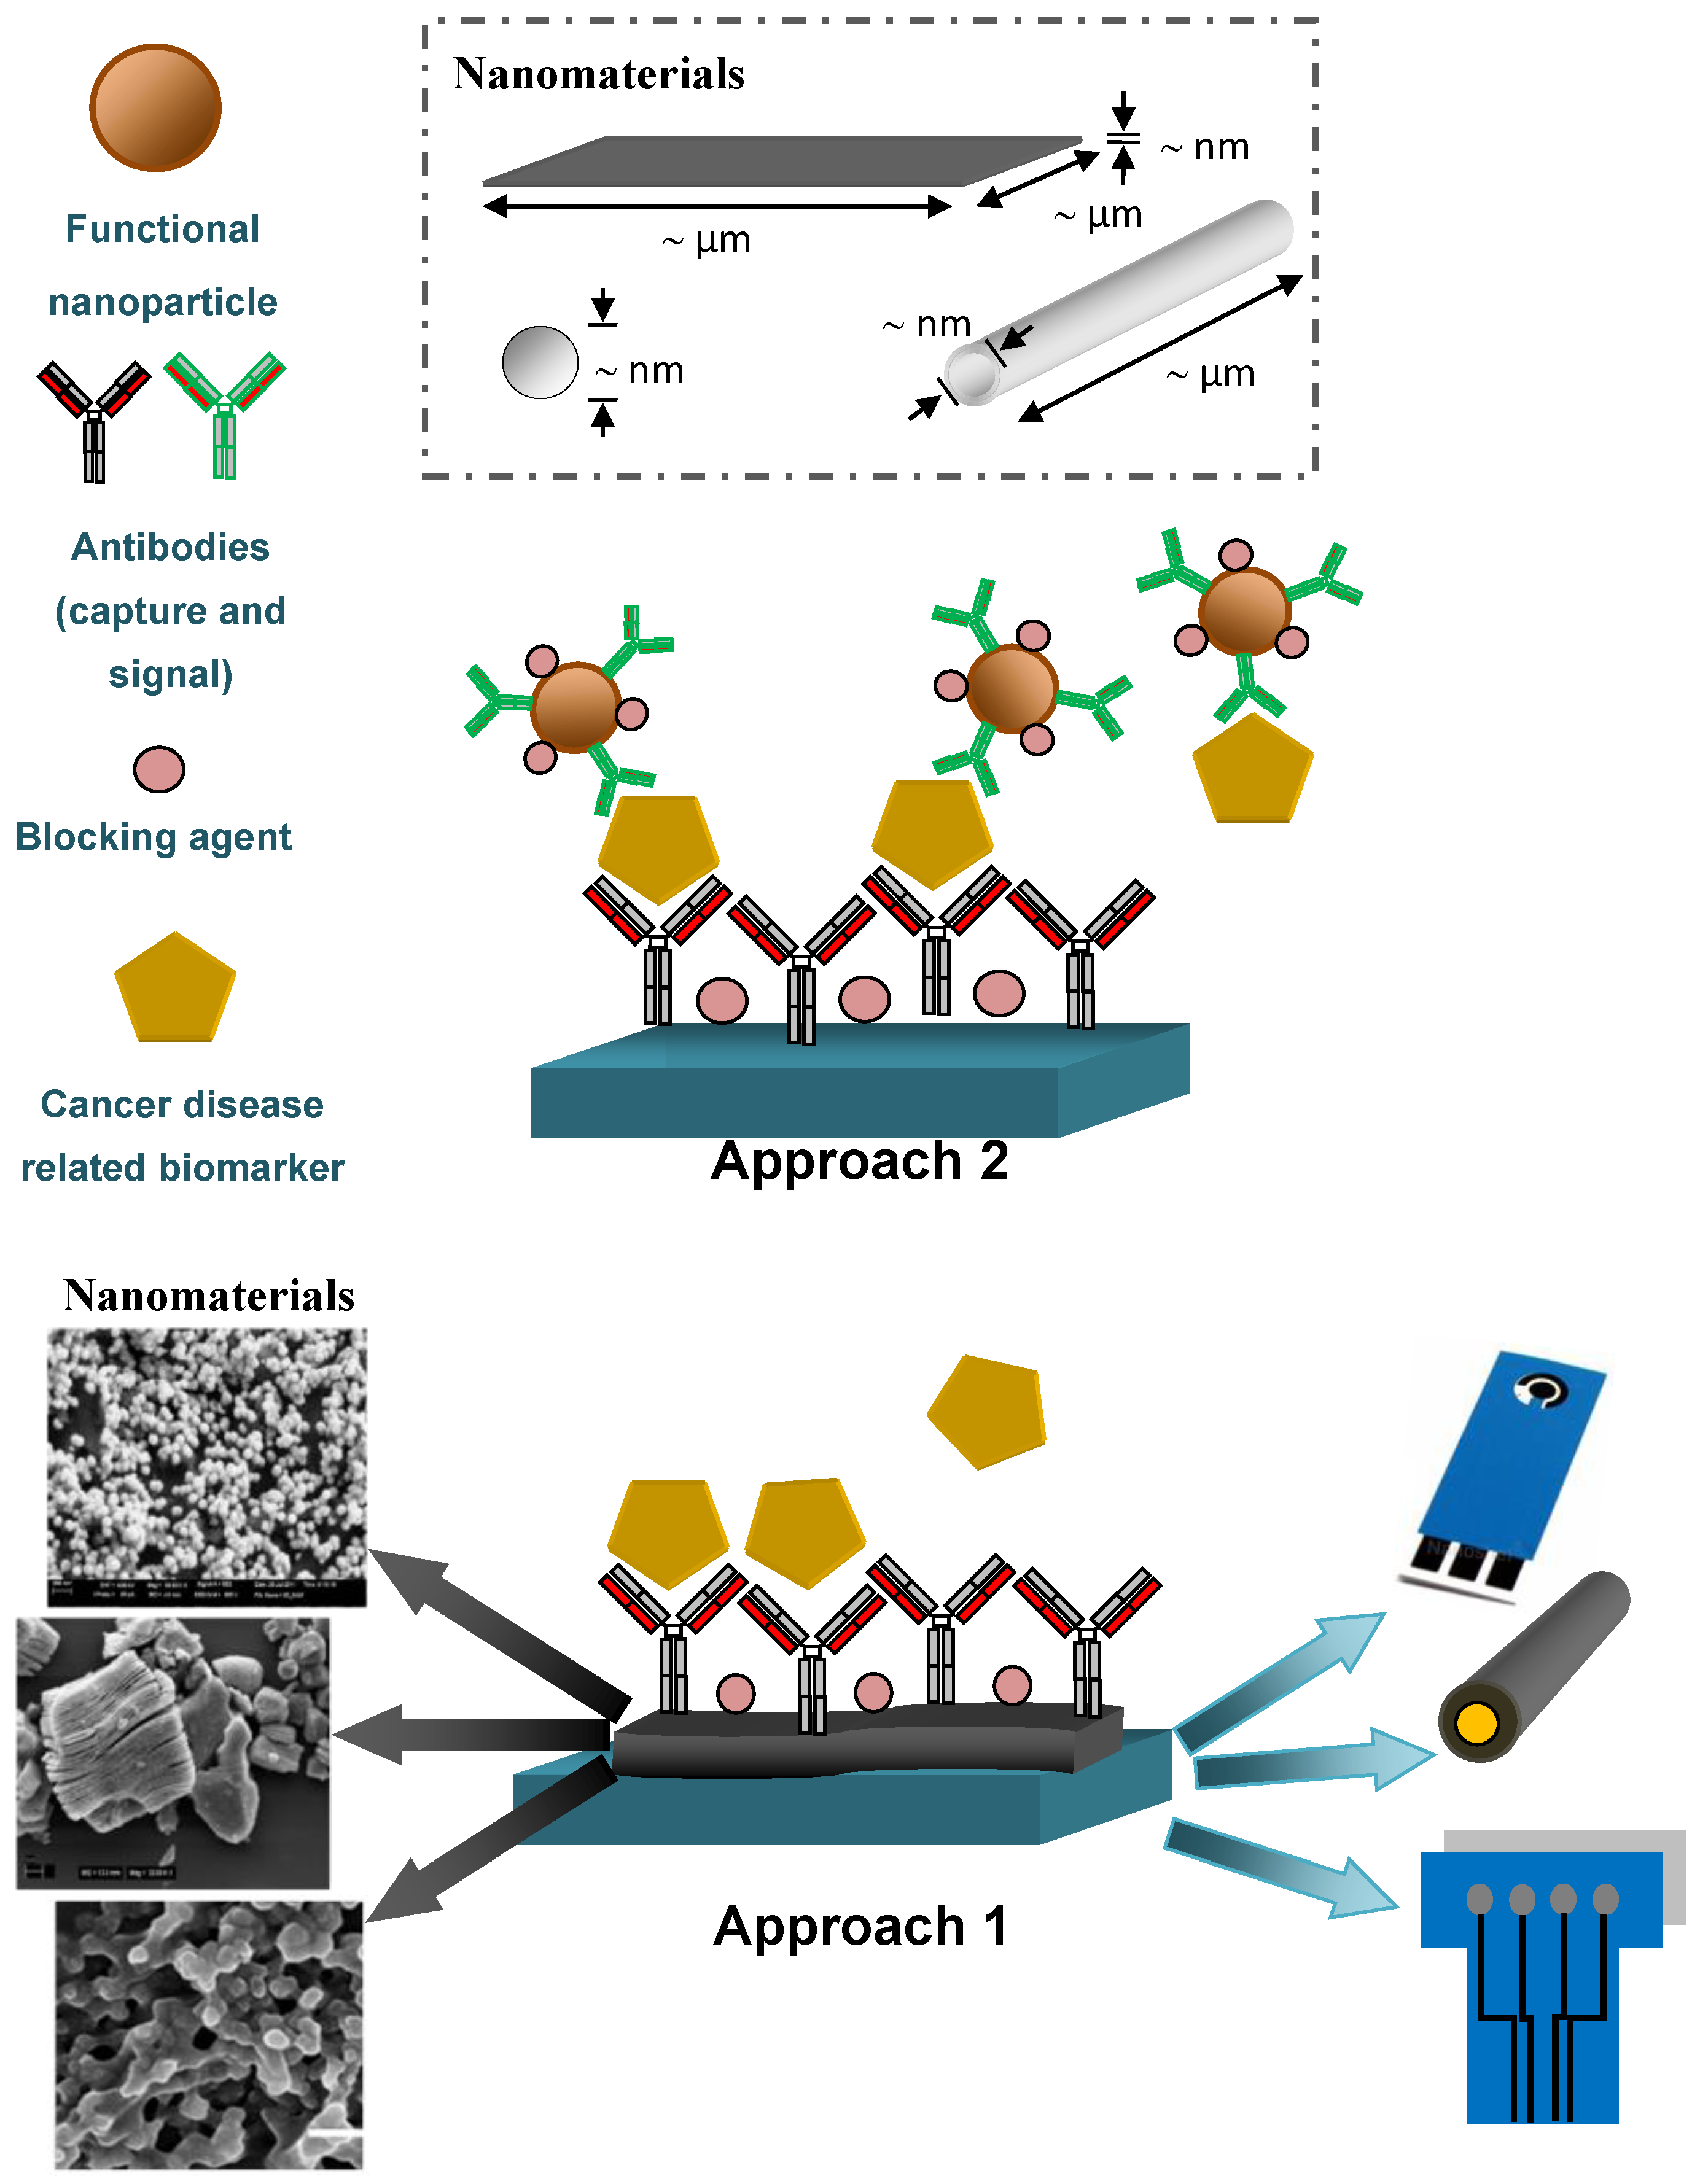
4. Nanomaterials/Nanoparticles-Based Electrochemical Biosensors as Ultrasensitive Tools in Detection of BC Biomarkers
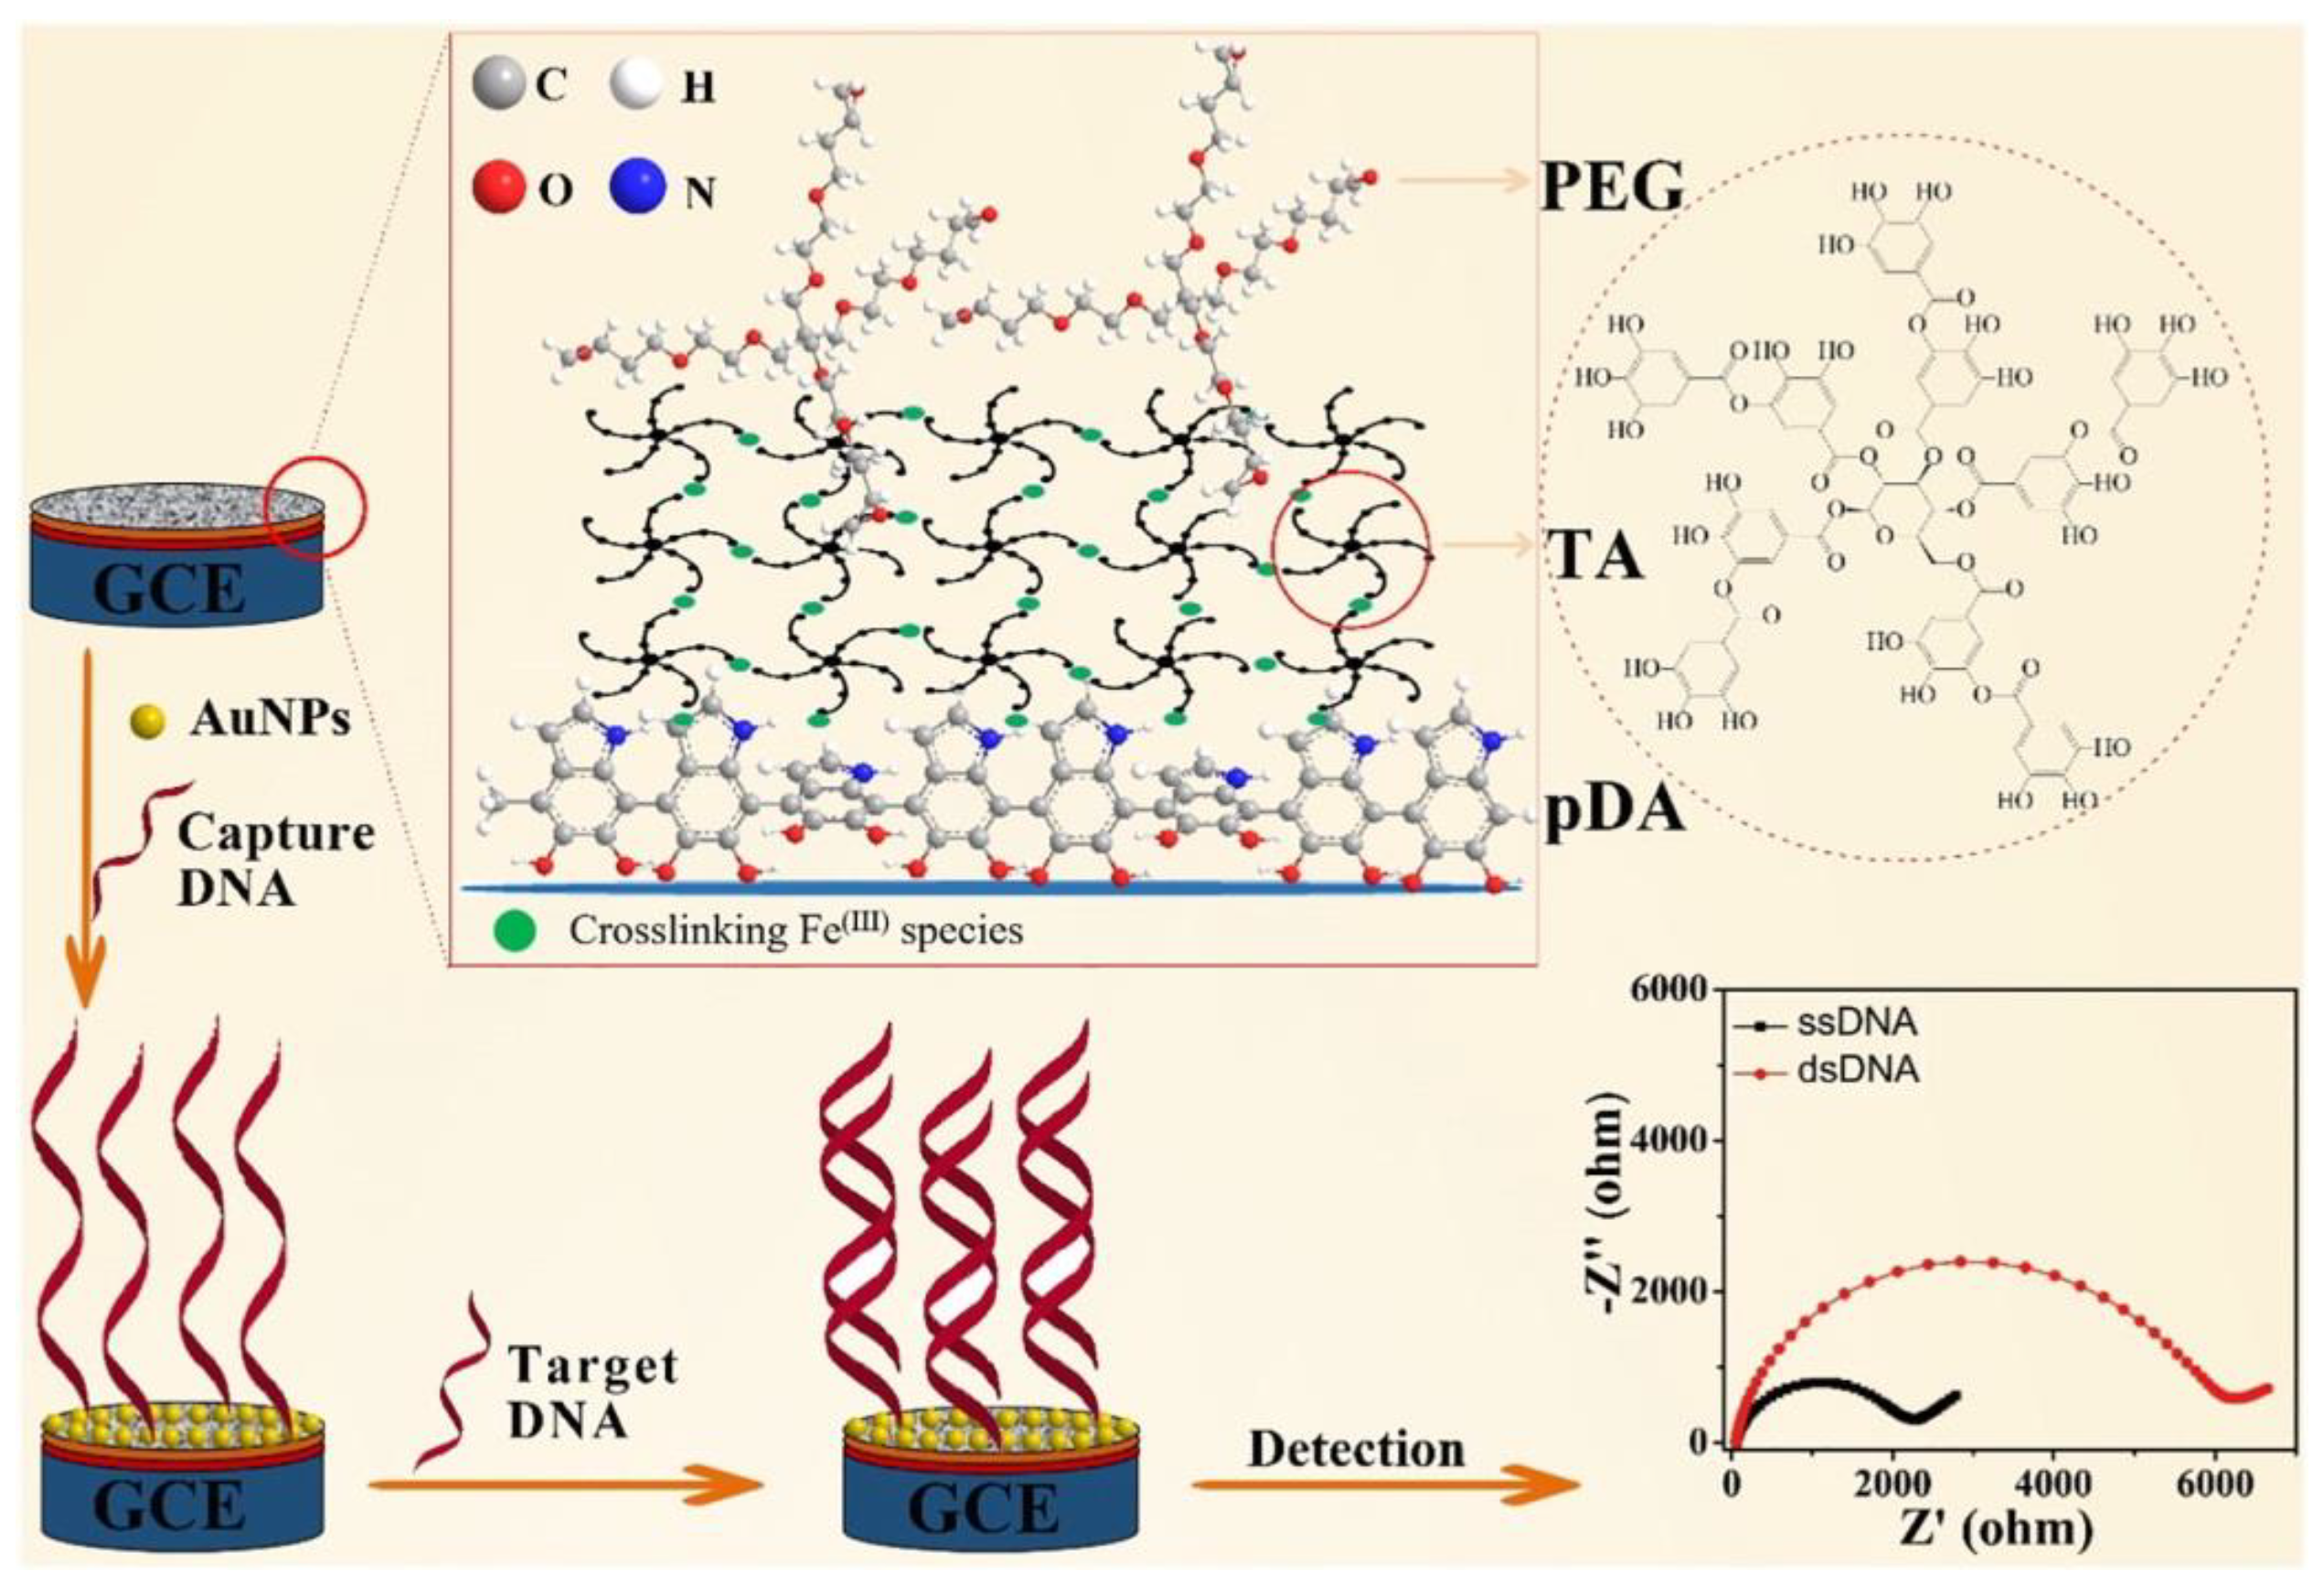
4.1. Detection of DNAs
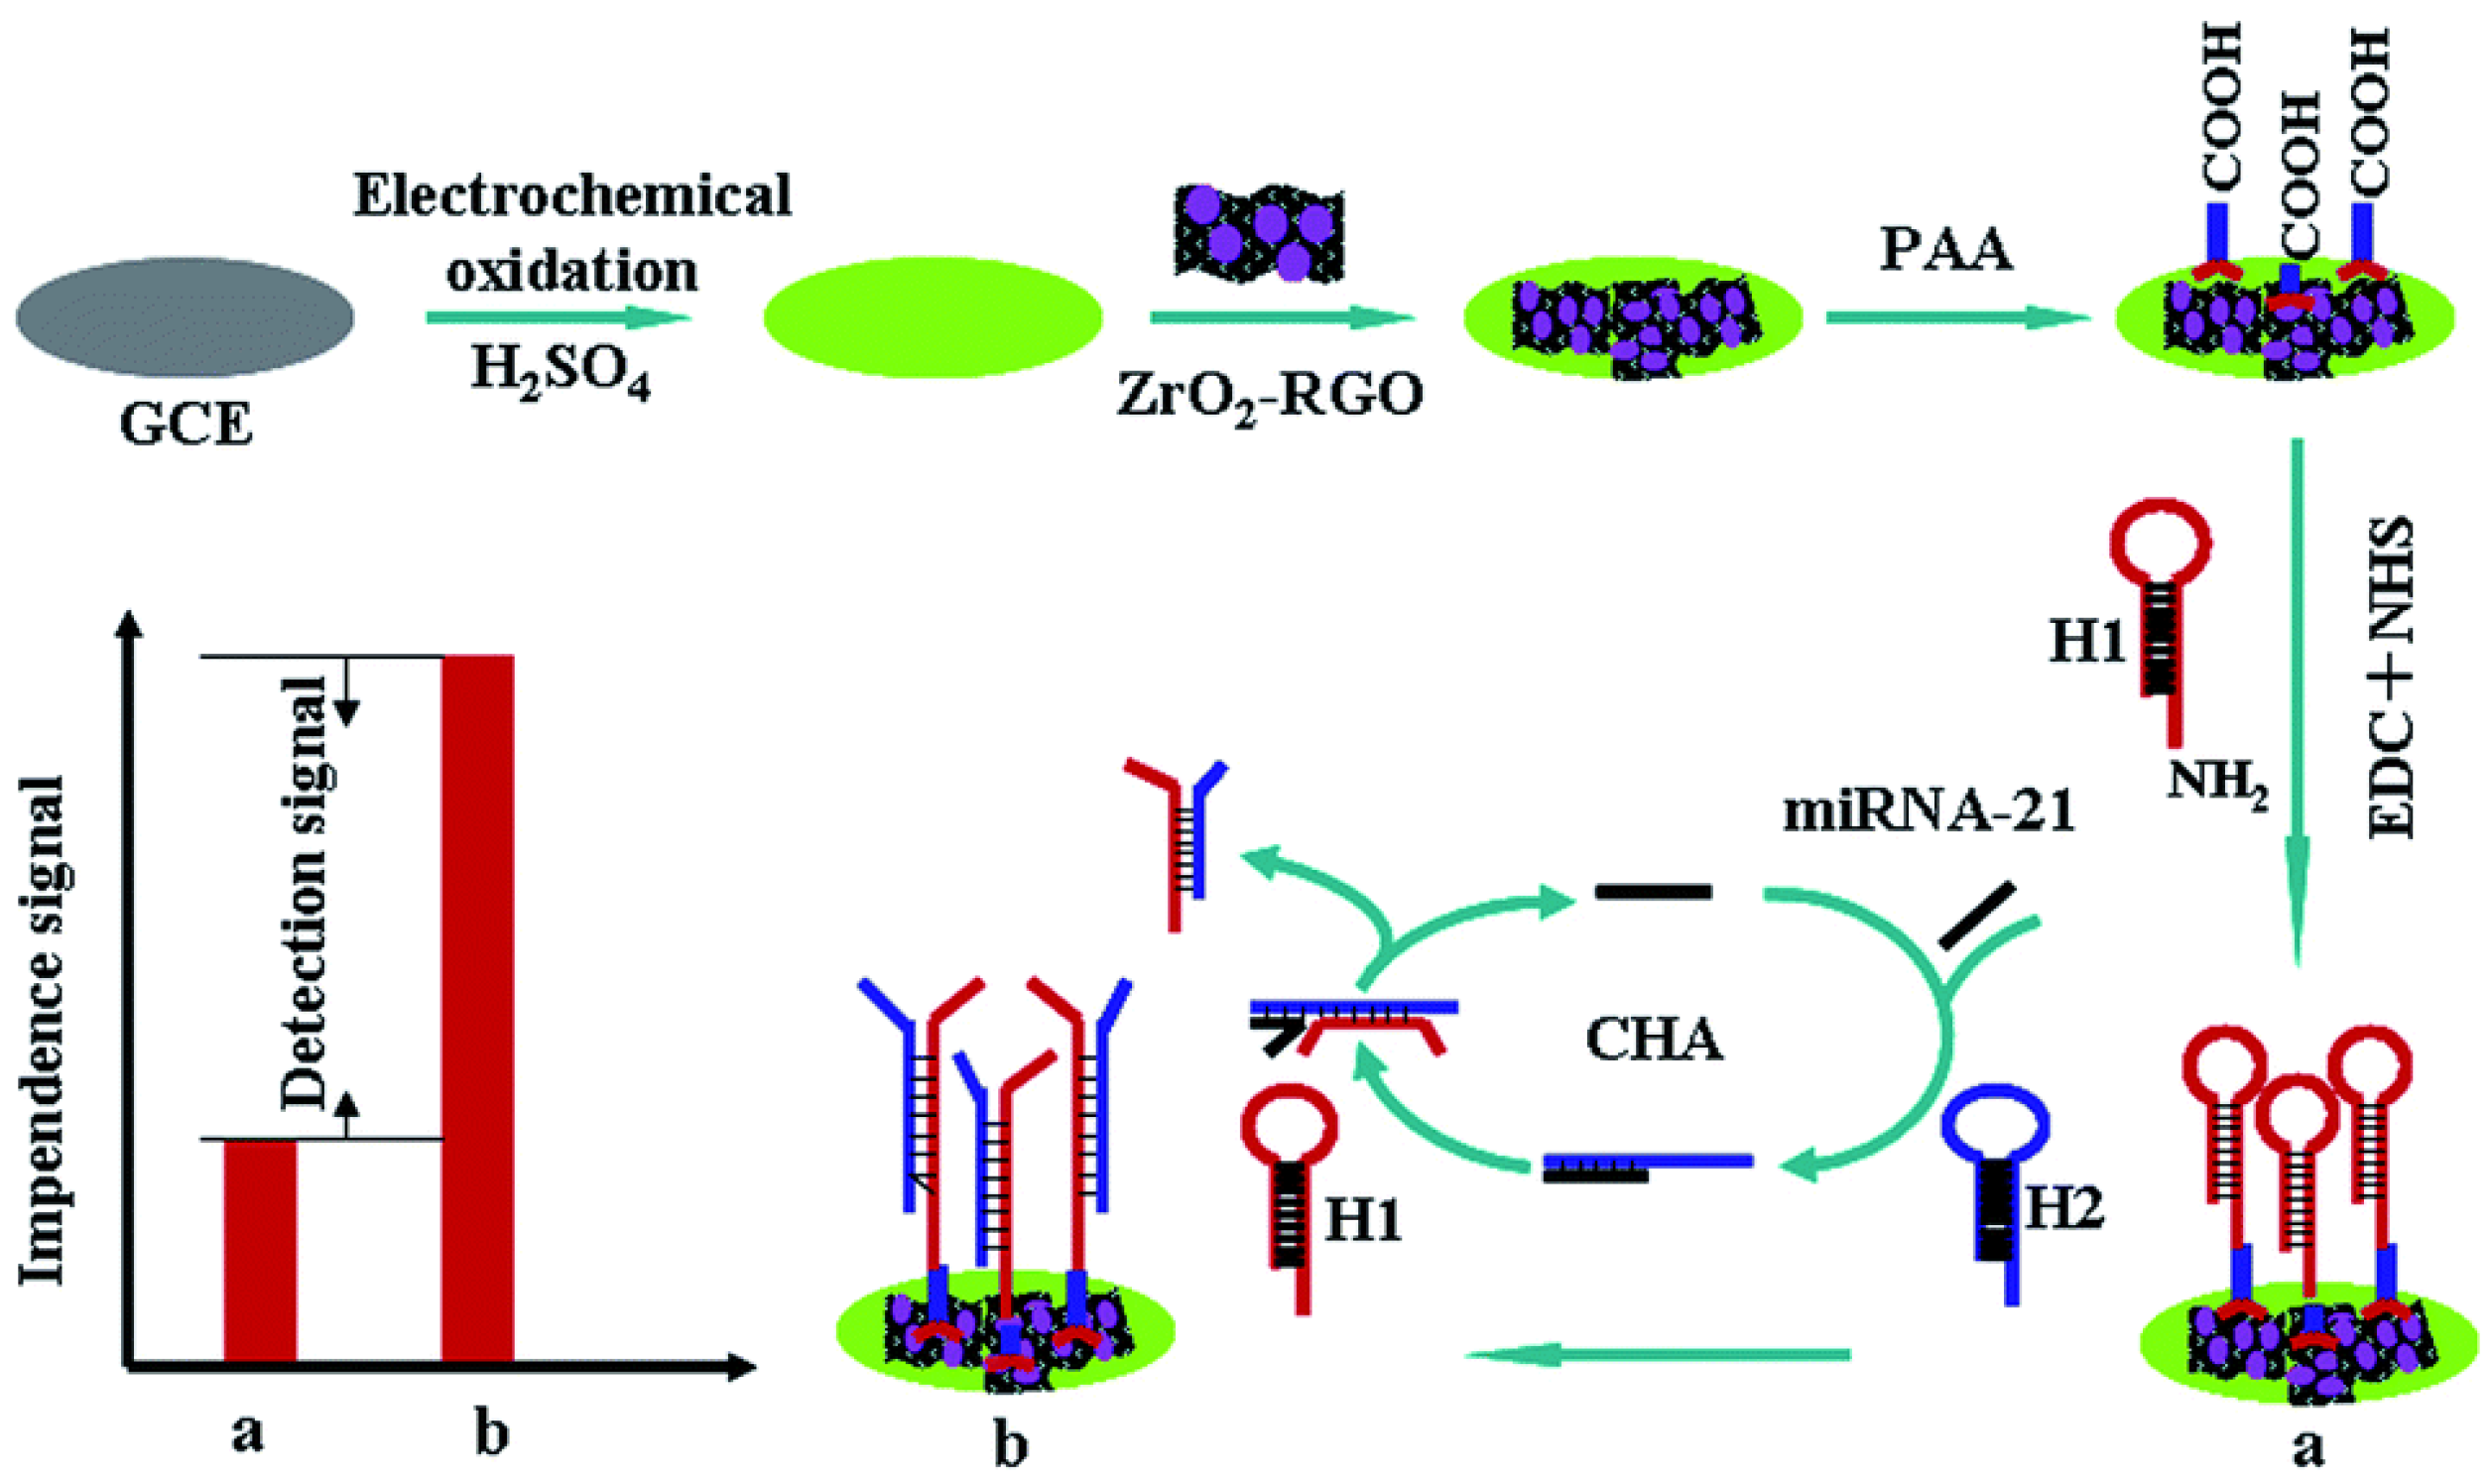
4.2. Detection of MicroRNAs (MiRNAs)
4.3. Detection of Mucins
4.4. Detection of Human Epidermal Growth Factor Receptor-2 (HER2)
4.5. Detection of Carcinoembryonic Antigen (CEA)
4.6. Dual-Target Analysis
4.7. Detection of Other Potential BC Biomarkers
4.8. Detection of BC Cells
4.9. Detection of Exosomes and Exosomal Content
5. Conclusions and Perspectives
Funding
Conflicts of Interest
Abbreviations
| Apt | aptamer |
| APTES | 3-aminopropyltriethoxysilane |
| Ar-CH2-COOH | p-aminophenylacetic acid |
| AuNCs | gold nanocages |
| AuNPs | gold nanoparticles |
| Au-SPE | gold screen-printed electrode |
| BRCA1 | BReast CAncer Type 1 gene |
| CA15-3 | cancer antigen 15-3 |
| CA 27-29 | cancer antigen 27-29 |
| CA | chronoamperometry |
| CEA | carcinoembryonic antigen |
| CdSe@ZnS QDs | core/shell quantum dots |
| CNTs | carbon nanotubes |
| CPE | carbon paste electrode |
| CV | cyclic voltammetry |
| CysA | cysteamine |
| CTES | carboxyethylsilanetriol |
| DPV | differential pulse voltammetry |
| DPASV | differential pulse anodic stripping voltammetry |
| EIS | electrochemical impedance spectroscopy |
| ERGO | electrochemically reduced graphene oxide |
| Fc | ferrocene |
| FTO | fluorine doped tin oxide |
| GE | gold electrode |
| GCE | glassy carbon electrode |
| GLD | glutaraldehyde |
| GNR | gold nanorods |
| GNS | graphene nanosheets |
| GO | graphene oxide |
| 3-GOPE | 3-glycidoxypropyl triethoxysilane |
| GSPE | Graphite-based screen-printed electrode |
| GQDs | graphene quantum dots |
| HER2 | human epidermal growth factor receptor 2 |
| HRP | horseradish peroxidase |
| ITO | indium tin oxide |
| mDNA | mediated double-stranded DNA |
| m-GEC | magnetic electrode—magneto-actuated graphite epoxy composite |
| MBs | magnetic beads |
| MAM | mammaglobin |
| MBCPE | magnetic bar carbon paste electrode |
| MPs | magnetic particles |
| 11-MUA | 11-mercaptoundenoic acid |
| MIP | molecularly imprinted polymer |
| Mt-HSA NCs | clay–protein based composite nanoparticles |
| MWCNTs | multi-walled carbon nanotubes |
| OM | one order of magnitude |
| OPN | osteopontin |
| PANHS | 1-pyrenebutyric acid-N-hydroxysuccinimide ester |
| Pd SSs | Pd superstructures |
| PEG | polyethylene glycol |
| PGE | pencil graphite electrode |
| PIK3CA gene | phosphatidylinositol-4,5-bisphosphate 3-kinase catalytic subunit alpha gene |
| Ppy | polypyrrole polymer |
| Py-COOH | 1-pyrenecarboxylic acid |
| RGO | reduced graphene oxide |
| SAM | self-assembled monolayer |
| SPCE | screen-printed carbon electrode |
| SPGE | screen-printed gold electrode |
| ssDNA | single-stranded deoxyribonucleic acid |
| SOX2 | sex-determining region Y-box 2 |
| SWCNTs | single-walled carbon nanotubes |
| SWV | square wave voltammetry |
| tPA | tissue plasminogen activator |
| uPA | urokinase plasminogen activator |
References
- Siegel, R.L.; Miller, K.D.; Jemal, A. Cancer statistics, 2019. CA Cancer J. Clin. 2019, 69, 7–34. [Google Scholar] [CrossRef] [PubMed]
- Rahman, S.A.; Al-Marzouki, A.; Otim, M.; Khalil Khayat, N.E.H.; Yousuf, R.; Rahman, P. Awareness about Breast Cancer and Breast Self-Examination among Female Students at the University of Sharjah: A Cross-Sectional Study. Asian Pac. J. Cancer Prev. 2019, 20, 1901–1908. [Google Scholar] [CrossRef] [PubMed]
- Dos Anjos Pultz, B.; da Luz, F.A.; de Faria, P.R.; Oliveira, A.P.; de Araujo, R.A.; Silva, M.J. Far beyond the usual biomarkers in breast cancer: A review. J. Cancer 2014, 5, 559–571. [Google Scholar] [CrossRef] [PubMed]
- Khorrami, S.; Tavakoli, M.; Safari, E. Clinical Value of Serum S100A8/A9 and CA15-3 in the Diagnosis of Breast Cancer. Iran. J. Pathol. 2019, 14, 104–112. [Google Scholar] [CrossRef]
- Begum, M.; Karim, S.; Malik, A.; Khurshid, R.; Asif, M.; Salim, A.; Nagra, S.A.; Zaheer, A.; Iqbal, Z.; Abuzenadah, A.M.; et al. CA 15–3 (Mucin-1) and physiological characteristics of breast cancer from Lahore, Pakistan. Asian Pac. J. Cancer Prev. 2012, 13, 5257–5261. [Google Scholar] [CrossRef]
- Scott, D.A.; Drake, R.R. Glycosylation and its implications in breast cancer. Expert Rev. Proteom. 2019, 16, 665–680. [Google Scholar] [CrossRef]
- Núñez, C. Blood-based protein biomarkers in breast cancer. Clin. Chim. Acta 2019, 490, 113–127. [Google Scholar] [CrossRef]
- Torre, L.A.; Trabert, B.; DeSantis, C.E.; Miller, K.D.; Samimi, G.; Runowicz, C.D.; Gaudet, M.M.; Jemal, A.; Siegel, R.L. Ovarian Cancer statistics, 2018. CA Cancer J. Clin. 2018, 68, 284–296. [Google Scholar] [CrossRef]
- Becker, S. A historic and scientific review of breast cancer: The next global healthcare challenge. Int. J. Gynaecol. Obstet. 2015, 131 (Suppl. 1), S36–S39. [Google Scholar] [CrossRef]
- Schopper, D.; de Wolf, C. How effective are breast cancer screening programmes by mammography? Review of the current evidence. Eur. J. Cancer 2009, 45, 1916–1923. [Google Scholar] [CrossRef]
- Gebrehiwot, A.G.; Melka, D.S.; Kassaye, Y.M.; Gemechu, T.; Lako, W.; Hinou, H.; Nishimura, S.-I. Exploring serum and immunoglobulin G N-glycome as diagnostic biomarkers for early detection of breast cancer in Ethiopian women. BMC Cancer 2019, 19, 588. [Google Scholar] [CrossRef] [PubMed]
- Sadighbayan, D.; Sadighbayan, K.; Khosroushahi, A.Y.; Hasanzadeh, M. Recent advances on the DNA-based electrochemical biosensing of cancer biomarkers: Analytical approach. Trends Anal. Chem. 2019, 119, 115609. [Google Scholar] [CrossRef]
- Sadighbayan, D.; Sadighbayan, K.; Tohid-kia, M.R.; Khosroushahi, A.Y.; Hasanzadeh, M. Development of electrochemical biosensors for tumor marker determination towards cancer diagnosis: Recent progress. Trends Anal. Chem. 2019, 118, 73–88. [Google Scholar] [CrossRef]
- Sharifi, M.; Avadi, M.R.; Attar, F.; Dashtestani, F.; Ghorchian, H.; Rezayat, S.M.; Saboury, A.A.; Falahati, M. Cancer diagnosis using nanomaterials based electrochemical nanobiosensors. Biosens. Bioelectron. 2019, 126, 773–784. [Google Scholar] [CrossRef] [PubMed]
- Freitas, M.; Nouws, H.P.A.; Delerue-Matos, C. Electrochemical Biosensing in Cancer Diagnostics and Follow-up. Electroanalysis 2018, 30, 1584–1603. [Google Scholar] [CrossRef]
- Sharifi, M.; Hasan, A.; Attar, F.; Taghizadeh, A.; Falahati, M. Development of point-of-care nanobiosensors for breast cancers diagnosis. Talanta 2020, 217, 121091. [Google Scholar] [CrossRef]
- Campuzano, S.; Pedrero, M.; Pingarron, J.M. Non-invasive breast cancer diagnosis through electrochemical biosensing at different molecular levels. Sensors 2017, 17, 1993. [Google Scholar] [CrossRef]
- Hasanzadeh, M.; Shadjou, N.; de la Guardia, M. Early stage screening of breast cancer using electrochemical biomarker detection. Trends Anal. Chem. 2017, 91, 67–76. [Google Scholar] [CrossRef]
- Barber, M.D.; Thomas, J.S.J.; Dixon, J.M. Breast Cancer: An Atlas of Investigation and Management; Clinical Pub.: Oxford, UK, 2008; pp. 1–5. [Google Scholar]
- Mills, D.; Gomberawalla, A.; Gordon, E.J.; Tondre, J.; Nejad, M.; Nguyen, T.; Pogoda, J.M.; Rao, J.; Chatterton, R.; Henning, S.; et al. Examination of Duct Physiology in the Human Mammary Gland. PLoS ONE 2016, 11, e0150653. [Google Scholar] [CrossRef][Green Version]
- Love, S.; Barsky, S. Anatomy of the nipple and breast ducts revisited. Cancer 2004, 101, 1947–1957. [Google Scholar] [CrossRef]
- Bombonati, A.; Sgroi, D.C. The molecular pathology of breast cancer progression. J. Pathol. 2011, 223, 307–317. [Google Scholar] [CrossRef] [PubMed]
- Rakha, E.A.; Putti, T.C.; Abd El-Rehim, D.M.; Paish, C.; Green, A.R.; Powe, D.G.; Lee, A.H.; Robertson, J.F.; Ellis, I.O. Morphological and immunophenotypic analysis of breast carcinomas with basal and myoepithelial differentiation. J. Pathol. 2006, 208, 495–506. [Google Scholar] [CrossRef] [PubMed]
- Barroso-Sousa, R.; Metzger-Filho, O. Differences between invasive lobular and invasive ductal carcinoma of the breast: Results and therapeutic implications. Ther. Adv. Med. Oncol. 2016, 8, 261–266. [Google Scholar] [CrossRef] [PubMed]
- Li, Q.; Li, G.; Zhou, Y.; Zhang, X.; Sun, M.; Jiang, H.; Yu, G. Comprehensive N-Glycome Profiling of Cells and Tissues for Breast Cancer Diagnosis. J. Proteome Res. 2019, 18, 2559–2570. [Google Scholar] [CrossRef]
- Harbeck, N.; Penault-Llorca, F.; Cortes, J.; Gnant, M.; Houssami, N.; Poortmans, P.; Ruddy, K.; Tsang, J.; Cardoso, F. Breast cancer. Nat. Rev. Dis. Primers 2019, 5, 66. [Google Scholar] [CrossRef]
- Ludwig, J.A.; Weinstein, J.N. Biomarkers in cancer staging, prognosis and treatment selection. Nat. Rev. Cancer 2005, 5, 845–856. [Google Scholar] [CrossRef]
- Tzitzikos, G.; Saridi, M.; Filippopoulou, T.; Makri, A.; Goulioti, A.; Stavropoulos, T.; Stamatiou, K. Measurement of tumor markers in chronic hemodialysis patients. Saudi J. Kidney Dis. Transplant. 2010, 21, 50–53. [Google Scholar]
- Estakhri, R.; Ghahramanzade, A.; Vahedi, A.; Nourazarian, A. Serum levels of CA15-3, AFP, CA19-9 and CEA tumor markers in cancer care and treatment of patients with impaired renal function on hemodialysis. Asian Pac. J. Cancer Prev. 2013, 14, 1597–1599. [Google Scholar] [CrossRef][Green Version]
- Mittal, S.; Kaur, H.; Gautam, N.; Mantha, A.K. Biosensors for breast cancer diagnosis: A review of bioreceptors, biotransducers and signal amplification strategies. Biosens. Bioelectron. 2017, 88, 217–231. [Google Scholar] [CrossRef]
- Tkac, J.; Gajdosova, V.; Hroncekova, S.; Bertok, T.; Hires, M.; Jane, E.; Lorencova, L.; Kasak, P. Prostate-specific antigen glycoprofiling as diagnostic and prognostic biomarker of prostate cancer. Interface Focus 2019, 9, 20180077. [Google Scholar] [CrossRef]
- Au, G.H.; Mejias, L.; Swami, V.K.; Brooks, A.D.; Shih, W.Y.; Shih, W.H. Quantitative assessment of Tn antigen in breast tissue micro-arrays using CdSe aqueous quantum dots. Biomaterials 2014, 35, 2971–2980. [Google Scholar] [CrossRef] [PubMed]
- Christiansen, M.N.; Chik, J.; Lee, L.; Anugraham, M.; Abrahams, J.L.; Packer, N.H. Cell surface protein glycosylation in cancer. Proteomics 2014, 14, 525–546. [Google Scholar] [CrossRef] [PubMed]
- Tousi, F.; Bones, J.; Hancock, W.S.; Hincapie, M. Differential Chemical Derivatization Integrated with Chromatographic Separation for Analysis of Isomeric Sialylated N-Glycans: A Nano-Hydrophilic Interaction Liquid Chromatography-MS Platform. Anal. Chem. 2013, 85, 8421–8428. [Google Scholar] [CrossRef] [PubMed]
- Ju, L.L.; Wang, Y.P.; Xie, Q.; Xu, X.K.; Li, Y.; Chen, Z.J.; Li, Y.S. Elevated level of serum glycoprotein bifucosylation and prognostic value in Chinese breast cancer. Glycobiology 2016, 26, 460–471. [Google Scholar] [CrossRef] [PubMed]
- Ideo, H.; Hinoda, Y.; Sakai, K.; Hoshi, I.; Yamamoto, S.; Oka, M.; Maeda, K.; Maeda, N.; Hazama, S.; Amano, J. Expression of mucin 1 possessing a 3′-sulfated core1 in recurrent and metastatic breast cancer. Int. J. Cancer 2015, 137, 1652–1660. [Google Scholar] [CrossRef] [PubMed]
- Imamura, M.; Morimoto, T.; Nomura, T.; Michishita, S.; Nishimukai, A.; Higuchi, T.; Fujimoto, Y.; Miyagawa, Y.; Kira, A.; Murase, K.; et al. Independent prognostic impact of preoperative serum carcinoembryonic antigen and cancer antigen 15–3 levels for early breast cancer subtypes. World J. Oncol. 2018, 16, 26. [Google Scholar] [CrossRef]
- Park, B.-J.; Cha, M.-K.; Kim, I.-H. Thioredoxin 1 as a serum marker for breast cancer and its use in combination with CEA or CA15-3 for improving the sensitivity of breast cancer diagnoses. BMC Res. Notes 2014, 7. [Google Scholar] [CrossRef]
- Bernstein, J.L.; Godbold, J.H.; Raptis, G.; Watson, M.A.; Levinson, B.; Aaronson, S.A.; Fleming, T.P. Identification of mammaglobin as a novel serum marker for breast cancer. Clin. Cancer Res. 2005, 11, 6528–6535. [Google Scholar] [CrossRef]
- Yan, X.; Lin, Y.; Liu, S.; Aziz, F.; Yan, Q. Fucosyltransferase IV (FUT4) as an effective biomarker for the diagnosis of breast cancer. Biomed. Pharmacother. 2015, 70, 299–304. [Google Scholar] [CrossRef]
- Koo, J.H. (Ed.) An Overview of Nanomaterials. In Fundamentals, Properties, and Applications of Polymer Nanocomposites; Cambridge University Press: Cambridge, UK, 2016; pp. 22–108. [Google Scholar]
- Pacheco-Torgal, F.; Jalali, S. Nanotechnology: Advantages and drawbacks in the field of construction and building materials. Constr. Build. Mater. 2011, 25, 582–590. [Google Scholar] [CrossRef]
- Gajdosova, V.; Lorencova, L.; Prochazka, M.; Omastova, M.; Micusik, M.; Prochazkova, S.; Kveton, F.; Jerigova, M.; Velic, D.; Kasak, P.; et al. Remarkable differences in the voltammetric response towards hydrogen peroxide, oxygen and Ru(NH(3))(6)(3+) of electrode interfaces modified with HF or LiF-HCl etched Ti(3)C(2)T(x) MXene. Mikrochim. Acta 2019, 187, 52. [Google Scholar] [CrossRef] [PubMed]
- Hughes, G.; Westmacott, K.; Honeychurch, K.C.; Crew, A.; Pemberton, R.M.; Hart, J.P. Recent Advances in the Fabrication and Application of Screen-Printed Electrochemical (Bio)Sensors Based on Carbon Materials for Biomedical, Agri-Food and Environmental Analyses. Biosensors 2016, 6, 50. [Google Scholar] [CrossRef]
- Taleat, Z.; Khoshroo, A. Screen-printed electrodes for biosensing: A review (2008–2013). Microchim. Acta 2014, 181, 865–891. [Google Scholar] [CrossRef]
- Arduini, F.; Micheli, L.; Moscone, D.; Palleschi, G.; Piermarini, S.; Ricci, F.; Volpe, G. Electrochemical biosensors based on nanomodified screen-printed electrodes: Recent applications in clinical analysis. TrAC Trends Anal. Chem. 2016, 79, 114–126. [Google Scholar] [CrossRef]
- Renedo, O.D.; Alonso-Lomillo, M.A.; Martínez, M.J.A. Recent developments in the field of screen-printed electrodes and their related applications. Talanta 2007, 73, 202–219. [Google Scholar] [CrossRef] [PubMed]
- Grieshaber, D.; MacKenzie, R.; Vörös, J.; Reimhult, E. Electrochemical Biosensors-Sensor Principles and Architectures. Sensors 2008, 8, 1400–1458. [Google Scholar] [CrossRef]
- Tang, Y.; Ouyang, M. Tailoring properties and functionalities of metal nanoparticles through crystallinity engineering. Nat. Mater. 2007, 6, 754–759. [Google Scholar] [CrossRef]
- Bertok, T.; Lorencova, L.; Chocholova, E.; Jane, E.; Vikartovska, A.; Kasak, P.; Tkac, J. Electrochemical Impedance Spectroscopy Based Biosensors: Mechanistic Principles, Analytical Examples and Challenges towards Commercialization for Assays of Protein Cancer Biomarkers. ChemElectroChem 2019, 6, 989–1003. [Google Scholar] [CrossRef]
- Lorencova, L.; Bertok, T.; Bertokova, A.; Gajdosova, V.; Hroncekova, S.; Vikartovska, A.; Kasak, P.; Tkac, J. Exosomes as a Source of Cancer Biomarkers: Advances in Electrochemical Biosensing of Exosomes. ChemElectroChem 2020, 7, 1956–1973. [Google Scholar] [CrossRef]
- Reddy, K.K.; Bandal, H.; Satyanarayana, M.; Goud, K.Y.; Gobi, K.V.; Jayaramudu, T.; Amalraj, J.; Kim, H. Recent Trends in Electrochemical Sensors for Vital Biomedical Markers Using Hybrid Nanostructured Materials. Adv. Sci. 2020. [Google Scholar] [CrossRef]
- Lorencova, L.; Gajdosova, V.; Hroncekova, S.; Bertok, T.; Blahutova, J.; Vikartovska, A.; Parrakova, L.; Gemeiner, P.; Kasak, P.; Tkac, J. 2D MXenes as Perspective Immobilization Platforms for Design of Electrochemical Nanobiosensors. Electroanalysis 2019, 31, 1833–1844. [Google Scholar] [CrossRef]
- Maia, F.R.; Reis, R.L.; Oliveira, J.M.; Maia, F.R.; Reis, R.L.; Oliveira, J.M.; Maia, F.R.; Reis, R.L.; Oliveira, J.M. Nanoparticles and Microfluidic Devices in Cancer Research. Adv. Exp. Med. Biol. 2020, 1230, 161–171. [Google Scholar] [PubMed]
- Meng, L.; Turner, A.P.F.; Mak, W.C. Soft and flexible material-based affinity sensors. Biotechnol. Adv. 2020, 39, 107398. [Google Scholar] [CrossRef]
- Siemer, S.; Wunsch, D.; Khamis, A.; Lu, Q.; Hagemann, J.; Stauber, R.H.; Gribko, A.; Scherberich, A.; Filippi, M.; Krafft, M.P.; et al. Nano Meets Micro-Translational Nanotechnology in Medicine: Nano-Based Applications for Early Tumor Detection and Therapy. Nanomaterials 2020, 10, 383. [Google Scholar] [CrossRef]
- Sierra, J.; Rodriguez-Trujillo, R.; Mir, M.; Samitier, J.; Sierra, J.; Marrugo-Ramirez, J.; Rodriguez-Trujillo, R.; Mir, M.; Samitier, J.; Mir, M.; et al. Sensor-Integrated Microfluidic Approaches for Liquid Biopsies Applications in Early Detection of Cancer. Sensors 2020, 20, 1317. [Google Scholar] [CrossRef]
- Agnolon, V.; Contato, A.; Meneghello, A.; Tagliabue, E.; Toffoli, G.; Gion, M.; Polo, F.; Fabricio, A.S.C. ELISA assay employing epitope-specific monoclonal antibodies to quantify circulating HER2 with potential application in monitoring cancer patients undergoing therapy with trastuzumab. Sci. Rep. 2020, 10, 3016. [Google Scholar] [CrossRef] [PubMed]
- Yousef, G.; Polymeris, M.-E.; Grass, L.; Soosaipillai, A.; Chan, P.-C.; Scorilas, A.; Borgoño, C.; Harbeck, N.; Schmalfeldt, B.; Dorn, J.; et al. Human Kallikrein 5 A Potential Novel Serum Biomarker for Breast and Ovarian Cancer. Cancer Res. 2003, 63, 3958–3965. [Google Scholar]
- Kumar, J.K.; Aronsson, A.C.; Pilko, G.; Zupan, M.; Kumer, K.; Fabjan, T.; Osredkar, J.; Eriksson, S. A clinical evaluation of the TK 210 ELISA in sera from breast cancer patients demonstrates high sensitivity and specificity in all stages of disease. Tumour Biol. J. Int. Soc. Oncodev. Biol. Med. 2016, 37, 11937–11945. [Google Scholar] [CrossRef]
- Li, D.; Harlan-Williams, L.M.; Kumaraswamy, E.; Jensen, R.A. BRCA1-No Matter How You Splice It. Cancer Res. 2019, 79, 2091–2098. [Google Scholar] [CrossRef]
- Benvidi, A.; Dehghani Firouzabadi, A.; Dehghan Tezerjani, M.; Moshtaghiun, S.M.; Mazloum-Ardakani, M.; Ansarin, A. A highly sensitive and selective electrochemical DNA biosensor to diagnose breast cancer. J. Electroanal. Chem. 2015, 750, 57–64. [Google Scholar] [CrossRef]
- Benvidi, A.; Jahanbani, S. Self-assembled monolayer of SH-DNA strand on a magnetic bar carbon paste electrode modified with Fe3O4@Ag nanoparticles for detection of breast cancer mutation. J. Electroanal. Chem. 2016, 768, 47–54. [Google Scholar] [CrossRef]
- Benvidi, A.; Tezerjani, M.D.; Jahanbani, S.; Mazloum Ardakani, M.; Moshtaghioun, S.M. Comparison of impedimetric detection of DNA hybridization on the various biosensors based on modified glassy carbon electrodes with PANHS and nanomaterials of RGO and MWCNTs. Talanta 2016, 147, 621–627. [Google Scholar] [CrossRef] [PubMed]
- Benvidi, A.; Abbasi, Z.; Tezerjani, M.; Banaei, M.; Zare, H.; Molahosseini, H.; Jahanbani, S. A Highly Selective DNA Sensor Based on Graphene Oxide-Silk Fibroin Composite and AuNPs as a Probe Oligonucleotide Immobilization Platform. Acta Chim. Slov. 2018, 65, 278–288. [Google Scholar] [CrossRef] [PubMed]
- Chen, L.; Liu, X.; Chen, C. Impedimetric biosensor modified with hydrophilic material of tannic acid/polyethylene glycol and dopamine-assisted deposition for detection of breast cancer-related BRCA1 gene. J. Electroanal. Chem. 2017, 791, 204–210. [Google Scholar] [CrossRef]
- Ehzari, H.; Safari, M.; Shahlaei, M. A simple and label-free genosensor for BRCA1 related sequence based on electrospinned ribbon conductive nanofibers. Microchem. J. 2018, 143, 118–126. [Google Scholar] [CrossRef]
- Kazerooni, H.; Nassernejad, B. A novel biosensor nanomaterial for the ultraselective and ultrasensitive electrochemical diagnosis of the breast cancer-related BRCA1 gene. Anal. Methods 2016, 8, 3069–3074. [Google Scholar] [CrossRef]
- Benvidi, A.; Firouzabadi, A.D.; Moshtaghiun, S.M.; Mazloum-Ardakani, M.; Tezerjani, M.D. Ultrasensitive DNA sensor based on gold nanoparticles/reduced graphene oxide/glassy carbon electrode. Anal. Biochem. 2015, 484, 24–30. [Google Scholar] [CrossRef]
- Shahrokhian, S.; Salimian, R. Ultrasensitive detection of cancer biomarkers using conducting polymer/electrochemically reduced graphene oxide-based biosensor: Application toward BRCA1 sensing. Sens. Actuators B Chem. 2018, 266, 160–169. [Google Scholar] [CrossRef]
- Saeed, A.A.; Sánchez, J.L.A.; O’Sullivan, C.K.; Abbas, M.N. DNA biosensors based on gold nanoparticles-modified graphene oxide for the detection of breast cancer biomarkers for early diagnosis. Bioelectrochemistry 2017, 118, 91–99. [Google Scholar] [CrossRef]
- Yang, J.; Yin, X.; Zhang, W. Electrochemical determination of PIK3CA gene associated with breast cancer based on molybdenum disulfide nanosheet-supported poly(indole-6-carboxylic acid). Anal. Methods 2019, 11, 157–162. [Google Scholar] [CrossRef]
- Babaei, K.; Shams, S.; Keymoradzadeh, A.; Vahidi, S.; Hamami, P.; Khaksar, R.; Norollahi, S.E.; Samadani, A.A. An insight of microRNAs performance in carcinogenesis and tumorigenesis; an overview of cancer therapy. Life Sci. 2020, 240, 117077. [Google Scholar] [CrossRef]
- Kashyap, D.; Kaur, H. Cell-free miRNAs as non-invasive biomarkers in breast cancer: Significance in early diagnosis and metastasis prediction. Life Sci. 2020, 246, 117417. [Google Scholar] [CrossRef] [PubMed]
- Valihrach, L.; Androvic, P.; Kubista, M. Circulating miRNA analysis for cancer diagnostics and therapy. Mol. Asp. Med. 2020, 72, 100825. [Google Scholar] [CrossRef] [PubMed]
- Cardoso, A.R.; Moreira, F.T.C.; Fernandes, R.; Sales, M.G.F. Novel and simple electrochemical biosensor monitoring attomolar levels of miRNA-155 in breast cancer. Biosens. Bioelectron. 2016, 80, 621–630. [Google Scholar] [CrossRef] [PubMed]
- Ebrahimi, A.; Nikokar, I.; Zokaei, M.; Bozorgzadeh, E. Design, development and evaluation of microRNA-199a-5p detecting electrochemical nanobiosensor with diagnostic application in Triple Negative Breast Cancer. Talanta 2018, 189, 592–598. [Google Scholar] [CrossRef] [PubMed]
- Zhang, K.; Zhang, N.; Zhang, L.; Wang, H.; Shi, H.; Liu, Q. Label-free impedimetric sensing platform for microRNA-21 based on ZrO 2 -reduced graphene oxide nanohybrids coupled with catalytic hairpin assembly amplification. RSC Adv. 2018, 8, 16146–16151. [Google Scholar] [CrossRef]
- Rafiee-Pour, H.A.; Behpour, M.; Keshavarz, M. A novel label-free electrochemical miRNA biosensor using methylene blue as redox indicator: Application to breast cancer biomarker miRNA-21. Biosens. Bioelectron. 2016, 77, 202–207. [Google Scholar] [CrossRef]
- Kilic, T.; Erdem, A.; Erac, Y.; Seydibeyoglu, M.O.; Okur, S.; Ozsoz, M. Electrochemical Detection of a Cancer Biomarker mir-21 in Cell Lysates Using Graphene Modified Sensors. Electroanalysis 2015, 27, 317–326. [Google Scholar] [CrossRef]
- Zouari, M.; Campuzano, S.; Pingarrón, J.M.; Raouafi, N. Femtomolar direct voltammetric determination of circulating miRNAs in sera of cancer patients using an enzymeless biosensor. Anal. Chim. Acta 2020, 1104, 188–198. [Google Scholar] [CrossRef]
- Nath, S.; Mukherjee, P. MUC1: A multifaceted oncoprotein with a key role in cancer progression. Trends Mol. Med. 2014, 20, 332–342. [Google Scholar] [CrossRef]
- Nawaz, M.A.H.; Rauf, S.; Catanante, G.; Nawaz, M.H.; Nunes, G.; Marty, J.L.; Hayat, A. One Step Assembly of Thin Films of Carbon Nanotubes on Screen Printed Interface for Electrochemical Aptasensing of Breast Cancer Biomarker. Sensors 2016, 16, 1651. [Google Scholar] [CrossRef] [PubMed]
- Paimard, G.; Shahlaei, M.; Moradipour, P.; Karamali, V.; Arkan, E. Impedimetric aptamer based determination of the tumor marker MUC1 by using electrospun core-shell nanofibers. Microchim. Acta 2019, 187. [Google Scholar] [CrossRef] [PubMed]
- Mouffouk, F.; Aouabdi, S.; Al-Hetlani, E.; Serrai, H.; Alrefae, T.; Leo Chen, L. New generation of electrochemical immunoassay based on polymeric nanoparticles for early detection of breast cancer. Int. J. Nanomed. 2017, 12, 3037–3047. [Google Scholar] [CrossRef] [PubMed]
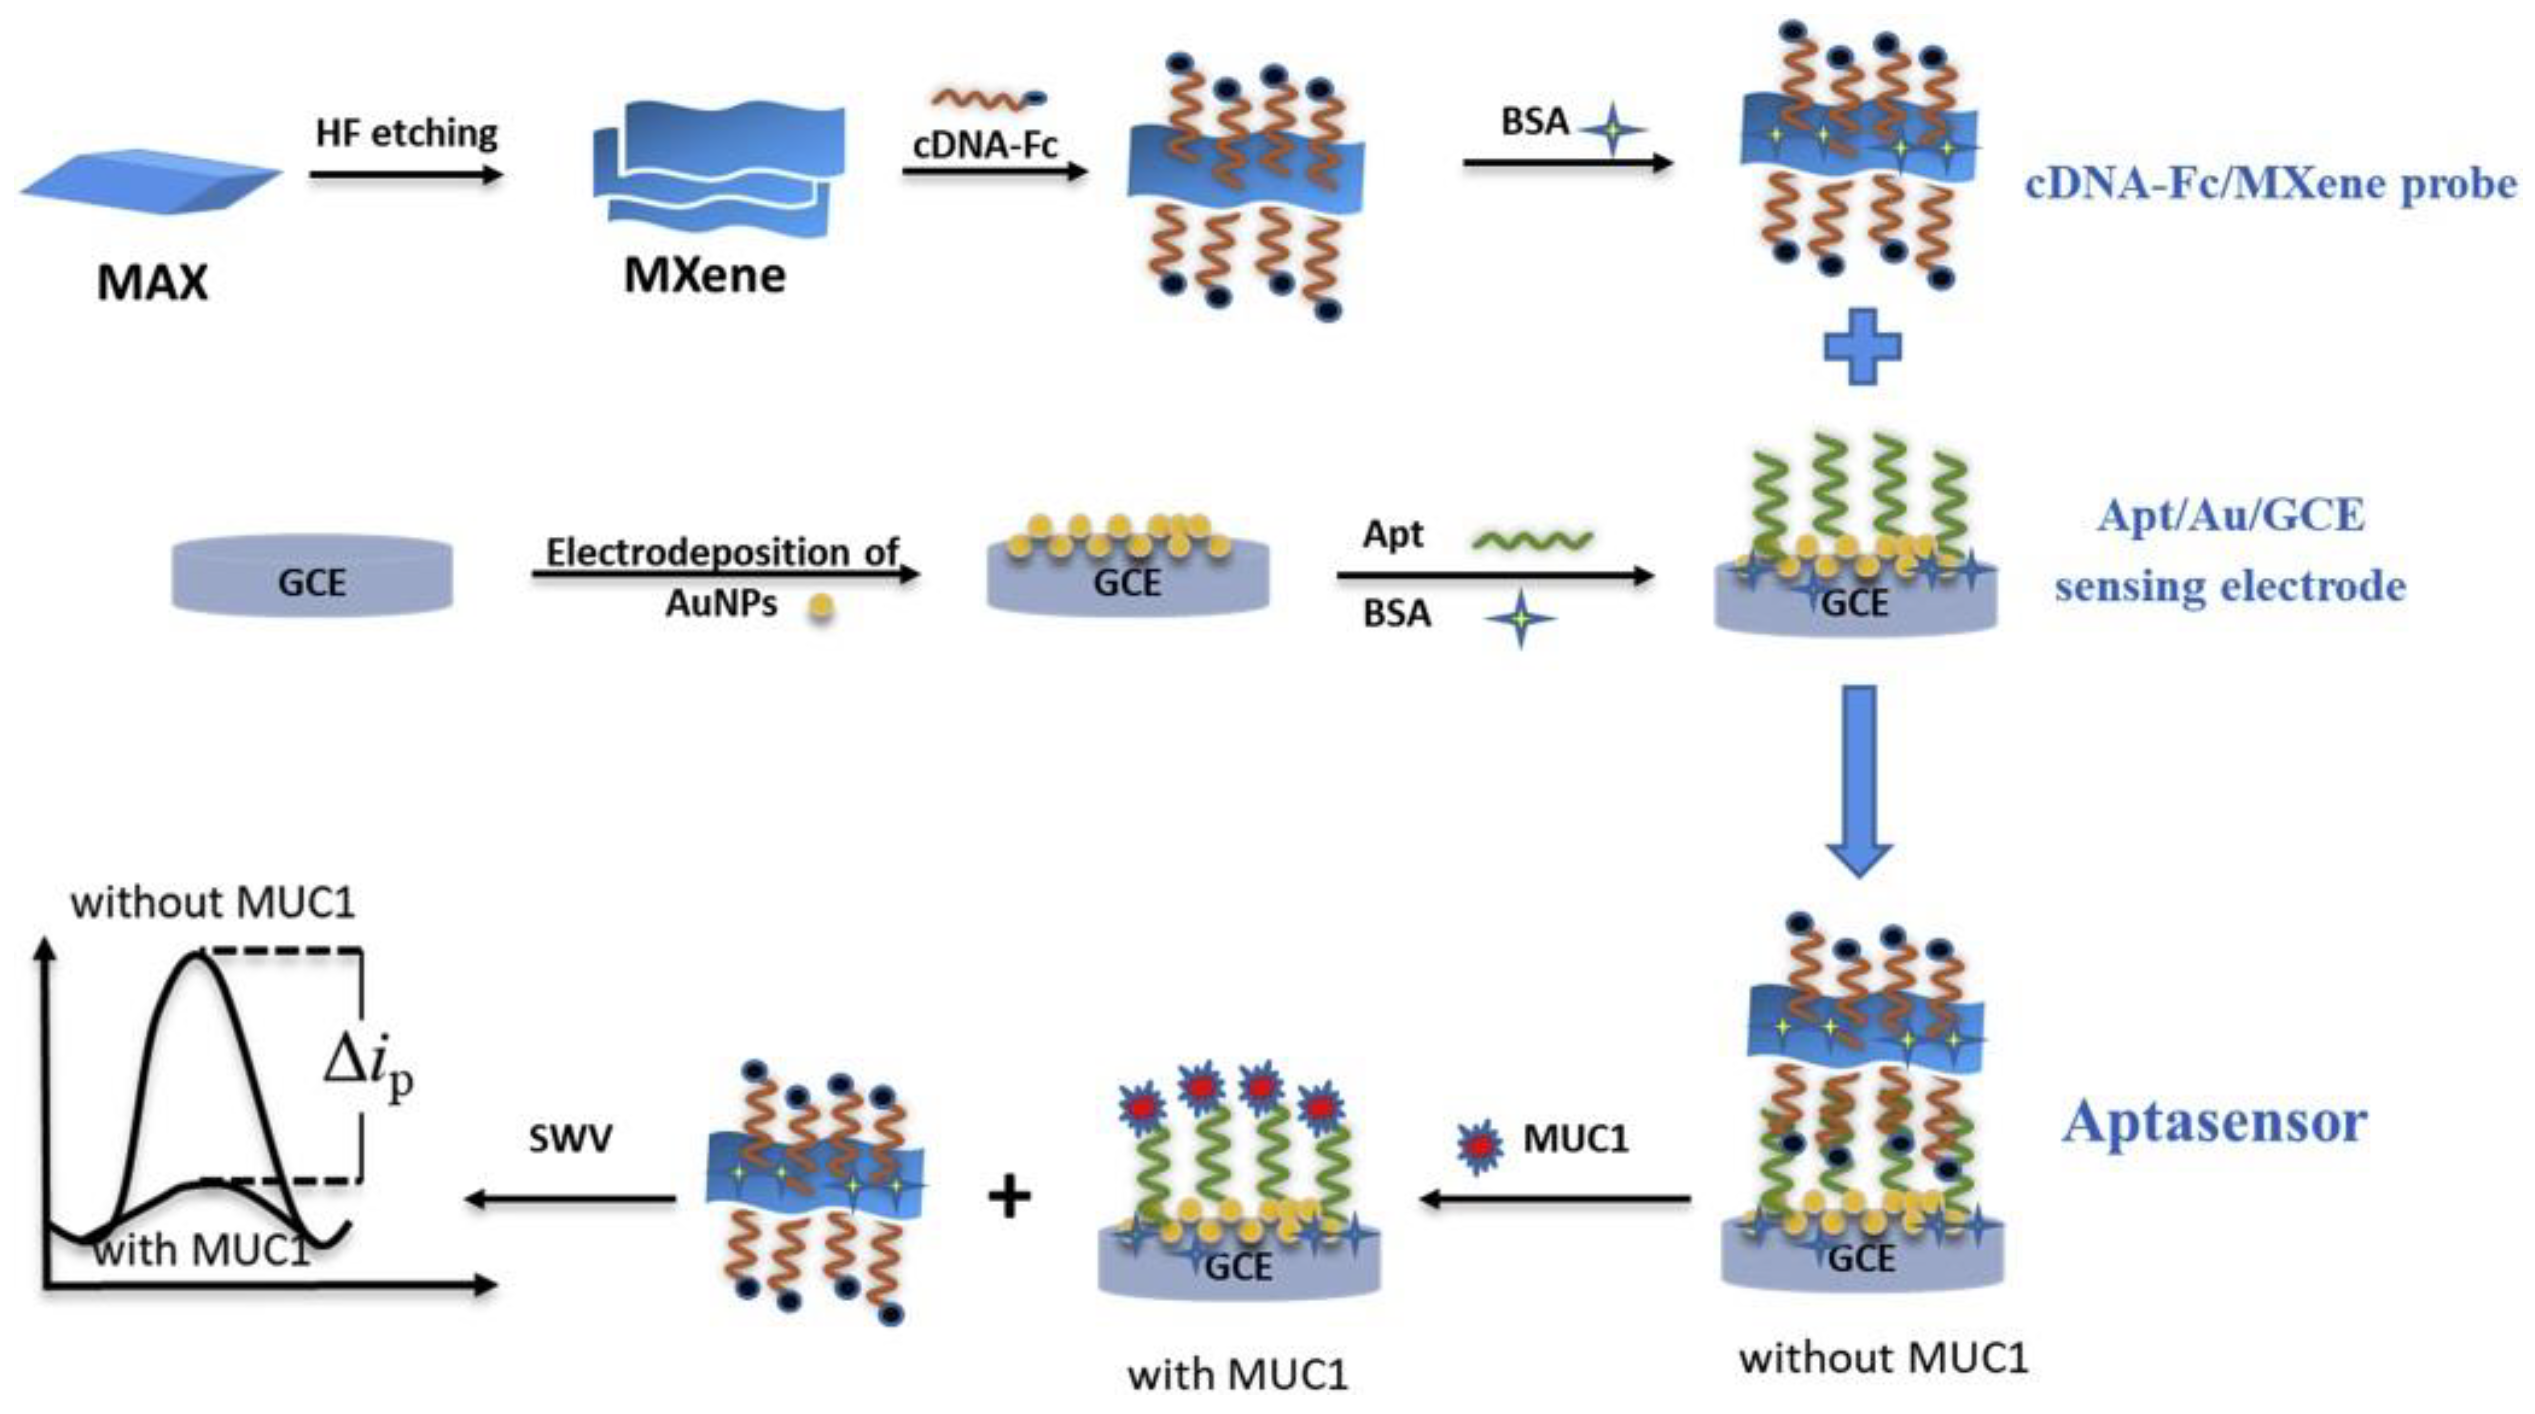
- Wang, H.; Sun, J.; Lu, L.; Yang, X.; Xia, J.; Zhang, F.; Wang, Z. Competitive electrochemical aptasensor based on a cDNA-ferrocene/MXene probe for detection of breast cancer marker Mucin1. Anal. Chim. Acta 2020, 1094, 18–25. [Google Scholar] [CrossRef]
- Akbari Nakhjavani, S.; Khalilzadeh, B.; Samadi Pakchin, P.; Saber, R.; Ghahremani, M.H.; Omidi, Y. A highly sensitive and reliable detection of CA15-3 in patient plasma with electrochemical biosensor labeled with magnetic beads. Biosens. Bioelectron. 2018, 122, 8–15. [Google Scholar] [CrossRef] [PubMed]
- Santos, A.R.T.; Moreira, F.T.C.; Helguero, L.A.; Sales, M.G.F. Antibody Biomimetic Material Made of Pyrrole for CA 15–3 and Its Application as Sensing Material in Ion-Selective Electrodes for Potentiometric Detection. Biosensors 2018, 8, 8. [Google Scholar] [CrossRef]
- Amani, J.; Khoshroo, A.; Rahimi-Nasrabadi, M. Electrochemical immunosensor for the breast cancer marker CA 15–3 based on the catalytic activity of a CuS/reduced graphene oxide nanocomposite towards the electrooxidation of catechol. Microchim. Acta 2018, 185. [Google Scholar] [CrossRef]
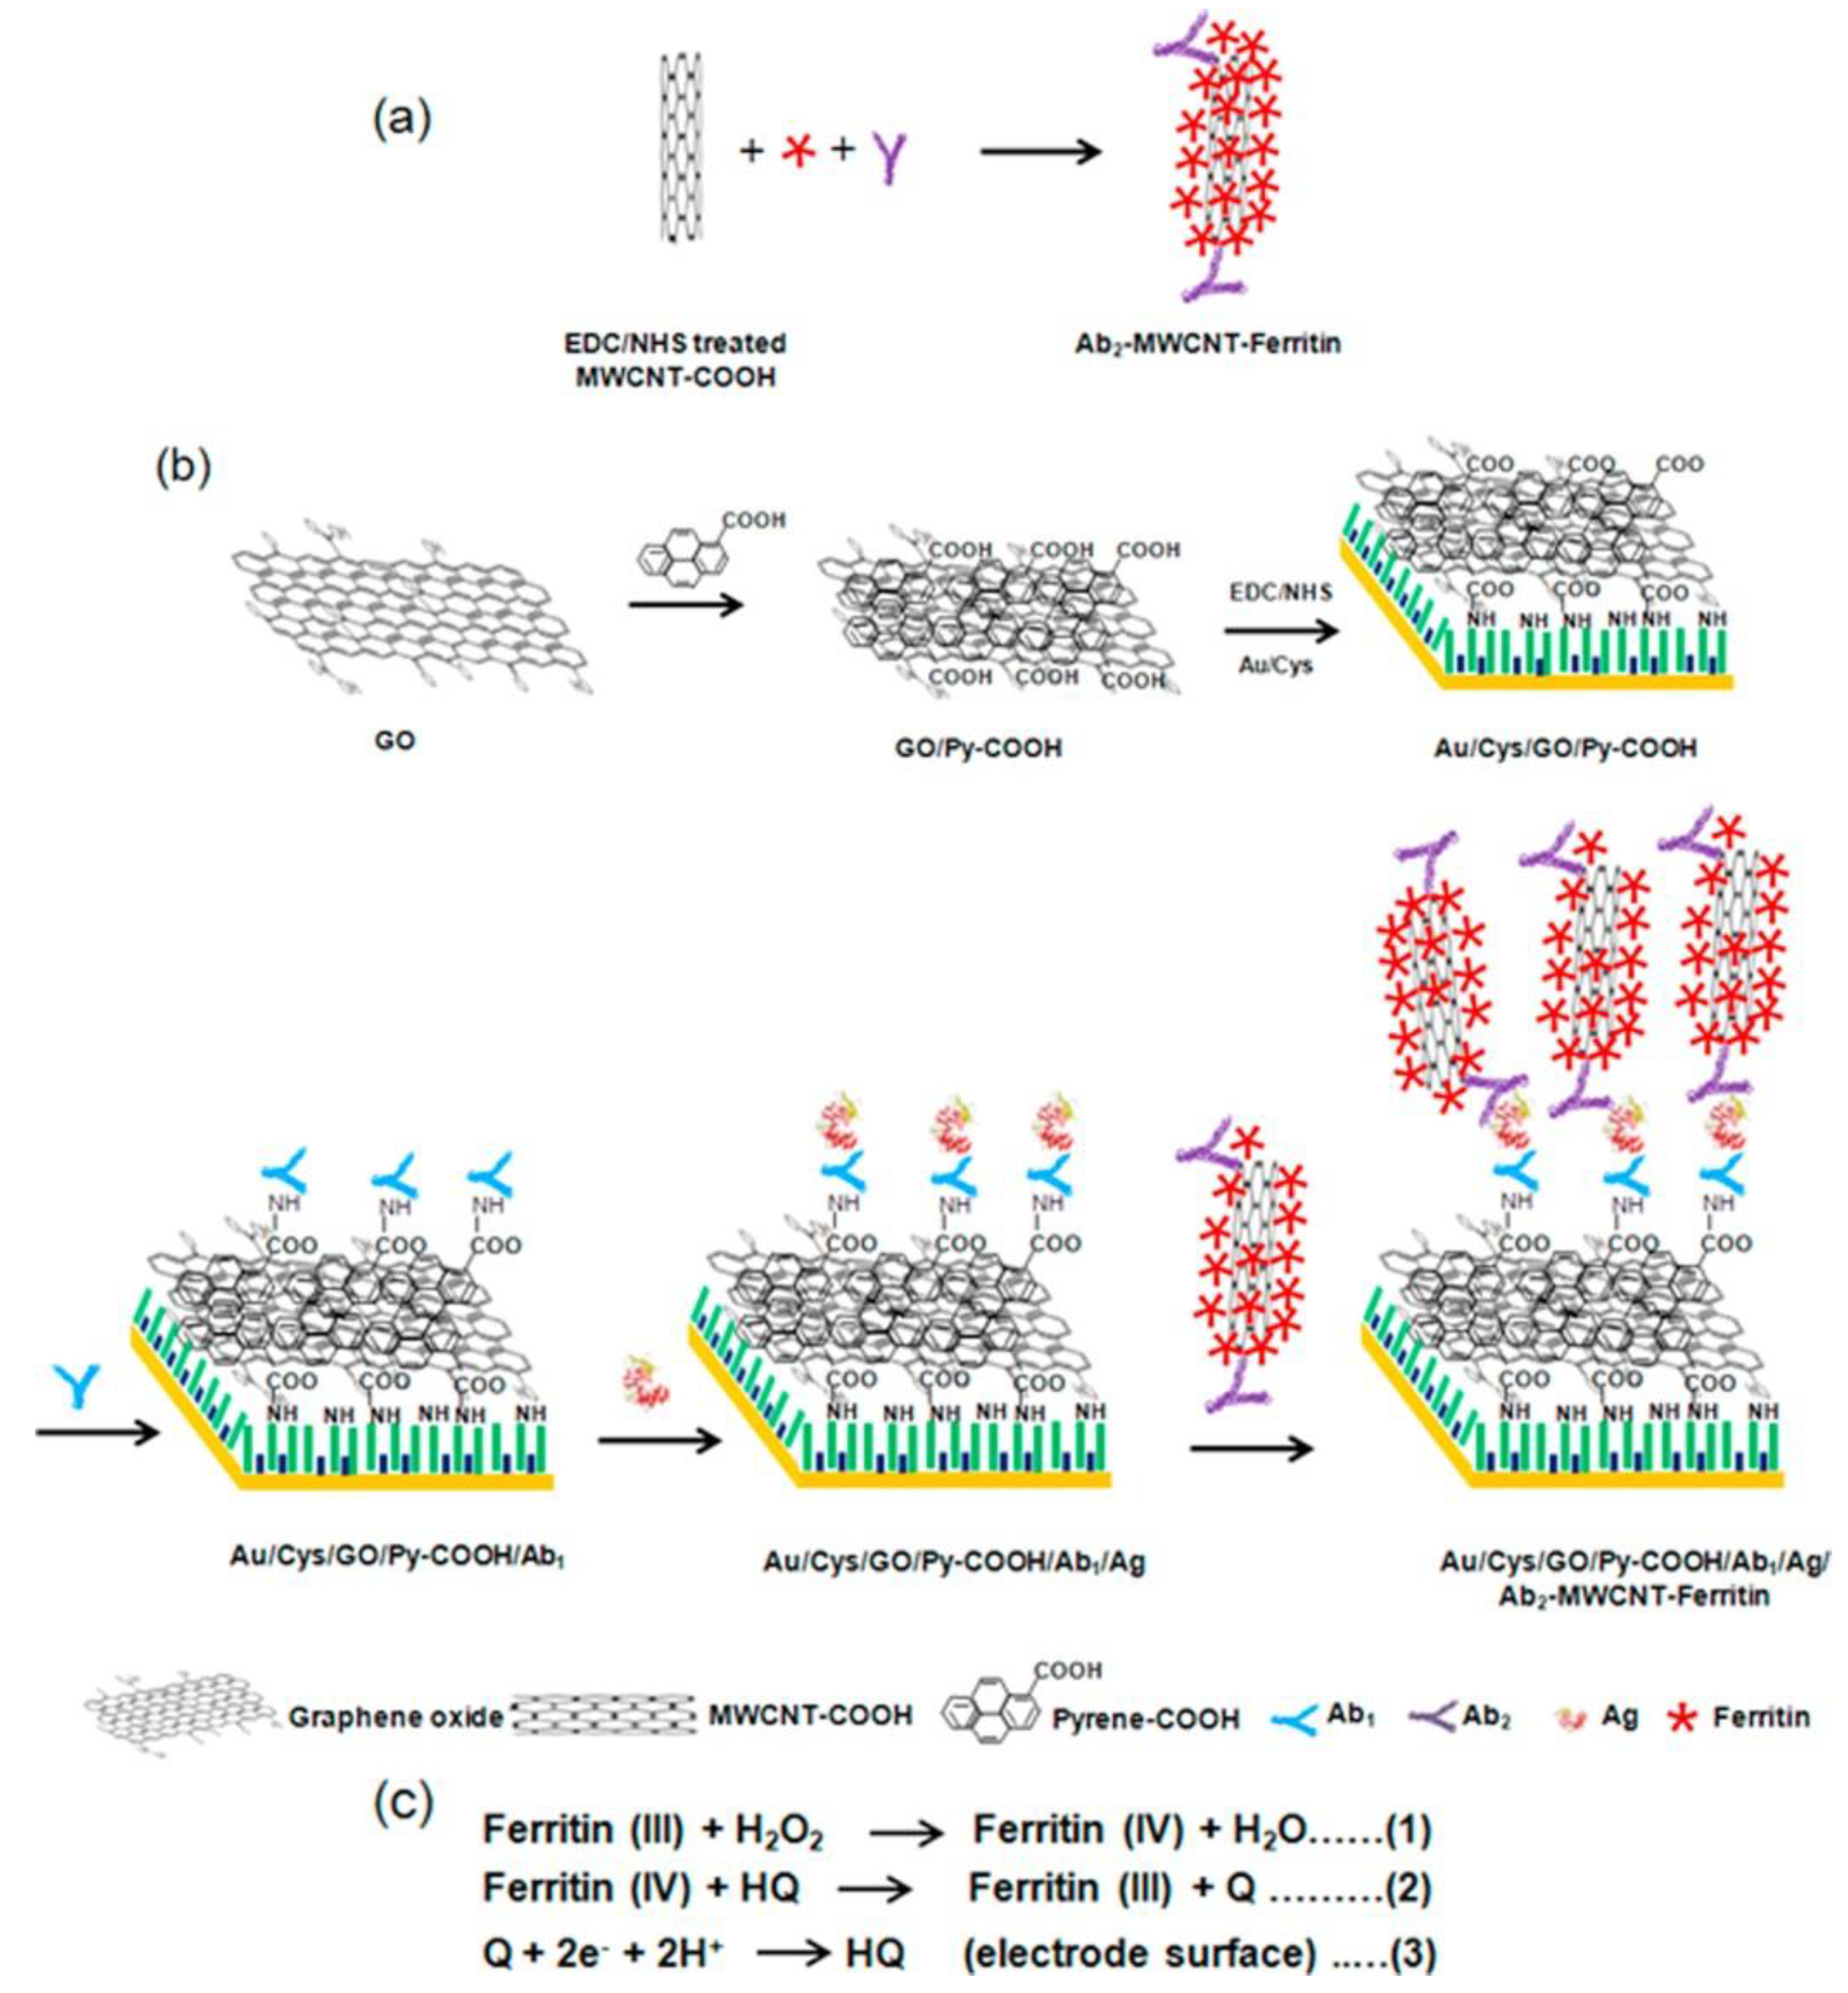
- Akter, R.; Jeong, B.; Choi, J.S.; Rahman, M.A. Ultrasensitive Nanoimmunosensor by coupling non-covalent functionalized graphene oxide platform and numerous ferritin labels on carbon nanotubes. Biosens. Bioelectron. 2016, 80, 123–130. [Google Scholar] [CrossRef]
- Goutsouliak, K.; Veeraraghavan, J.; Sethunath, V.; De Angelis, C.; Osborne, C.K.; Rimawi, M.F.; Schiff, R. Towards personalized treatment for early stage HER2-positive breast cancer. Nat. Rev. Clin. Oncol. 2020, 17, 233–250. [Google Scholar] [CrossRef]
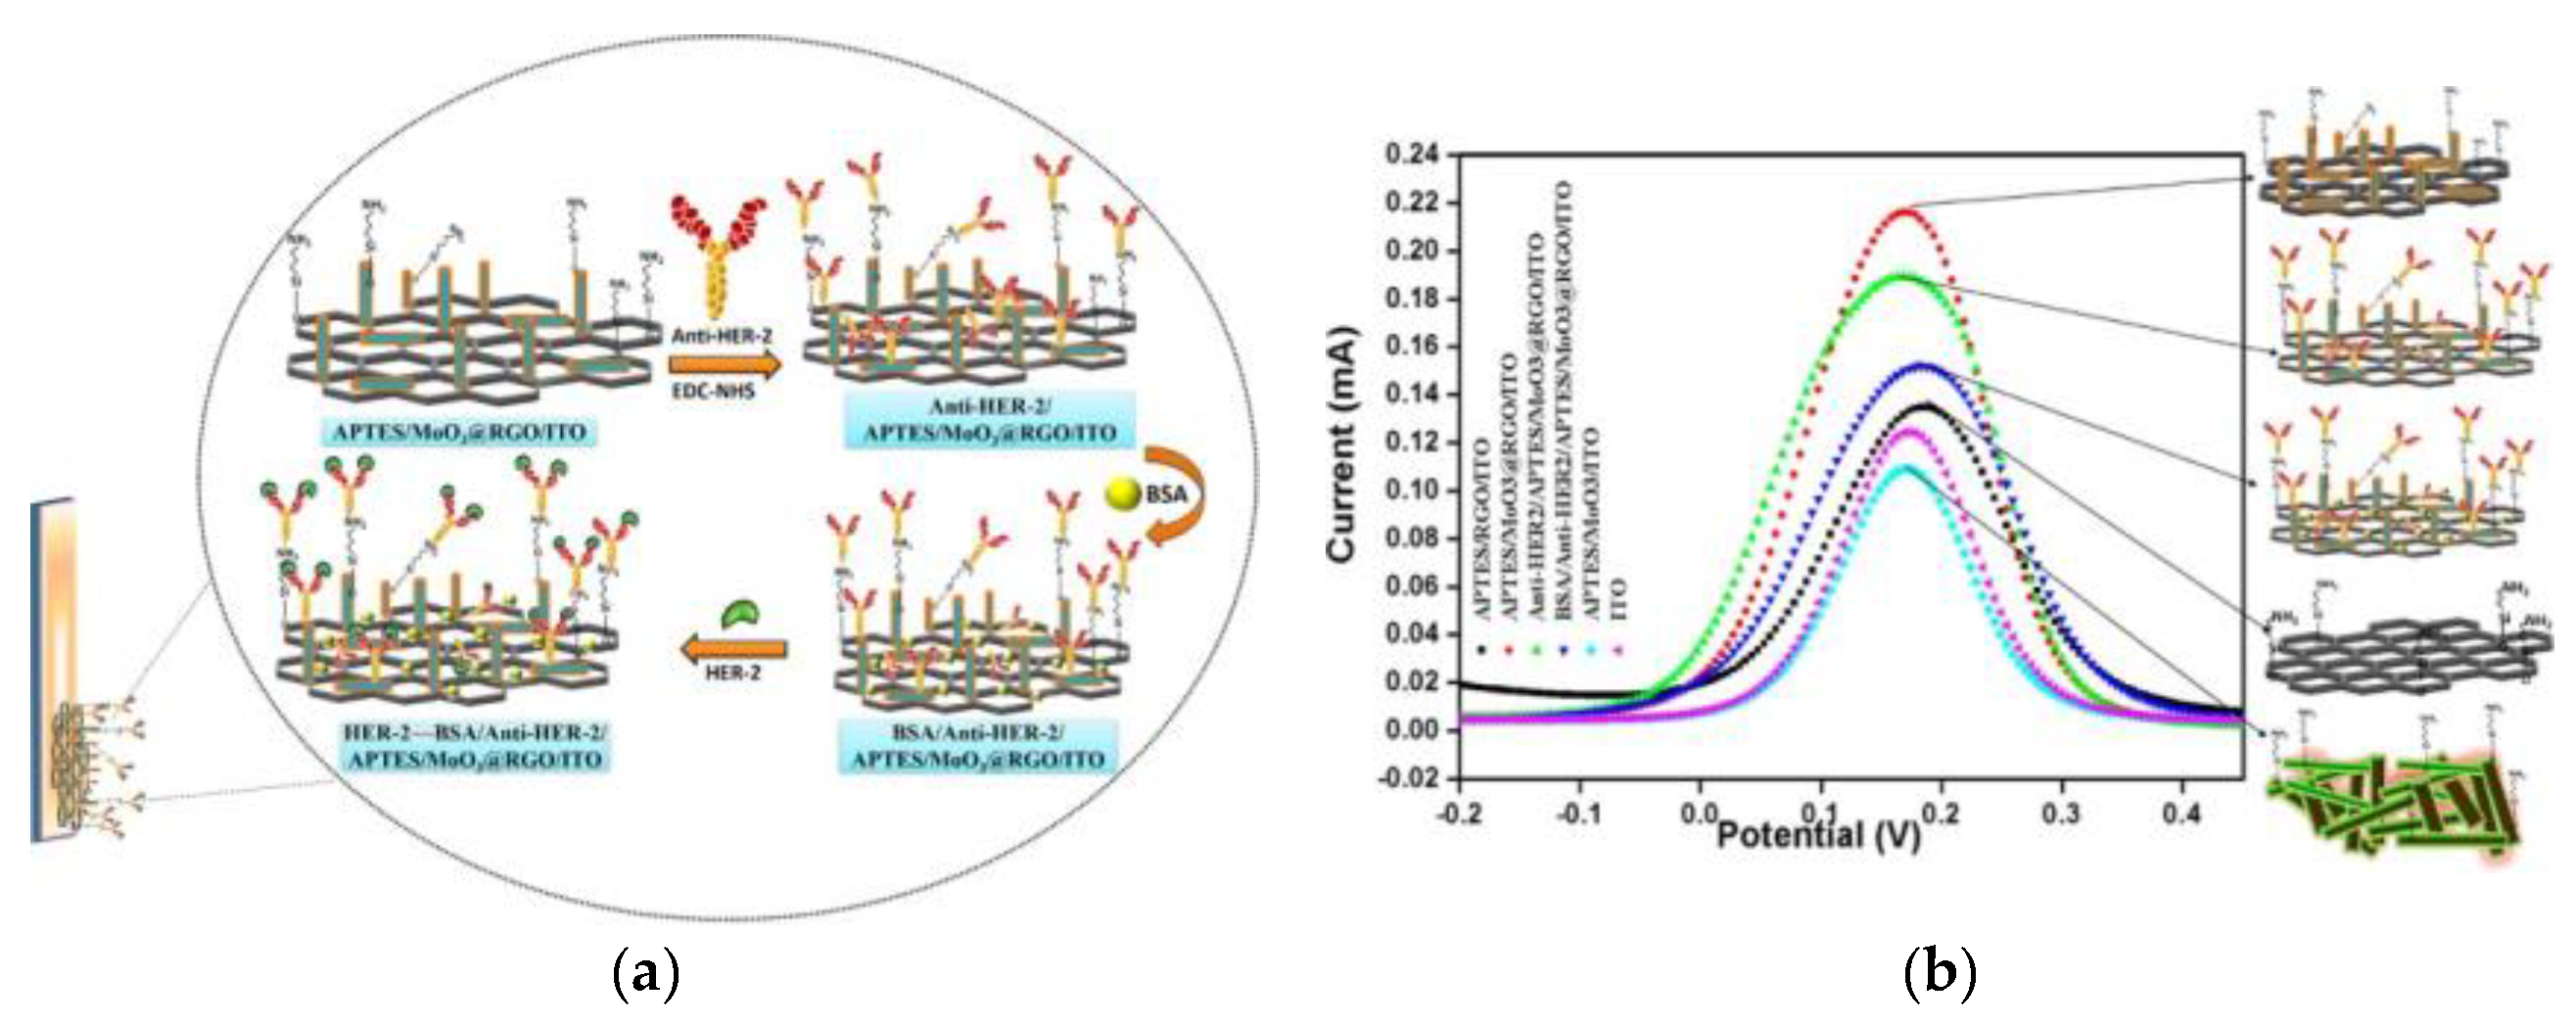
- Augustine, S.; Kumar, P.; Malhotra, B.D. Amine-Functionalized MoO3@RGO Nanohybrid-Based Biosensor for Breast Cancer Detection. ACS Appl. Bio Mater. 2019, 2, 5366–5378. [Google Scholar] [CrossRef]
- Rostamabadi, P.; Heydari-Bafrooei, E. Impedimetric aptasensing of the breast cancer biomarker HER2 using a glassy carbon electrode modified with gold nanoparticles in a composite consisting of electrochemically reduced graphene oxide and single-walled carbon nanotubes. Microchim. Acta 2019, 186. [Google Scholar] [CrossRef] [PubMed]
- Arkan, E.; Saber, R.; Karimi, Z.; Shamsipur, M. A novel antibody-antigen based impedimetric immunosensor for low level detection of HER2 in serum samples of breast cancer patients via modification of a gold nanoparticles decorated multiwall carbon nanotube-ionic liquid electrode. Anal. Chim. Acta 2015, 874, 66–74. [Google Scholar] [CrossRef] [PubMed]
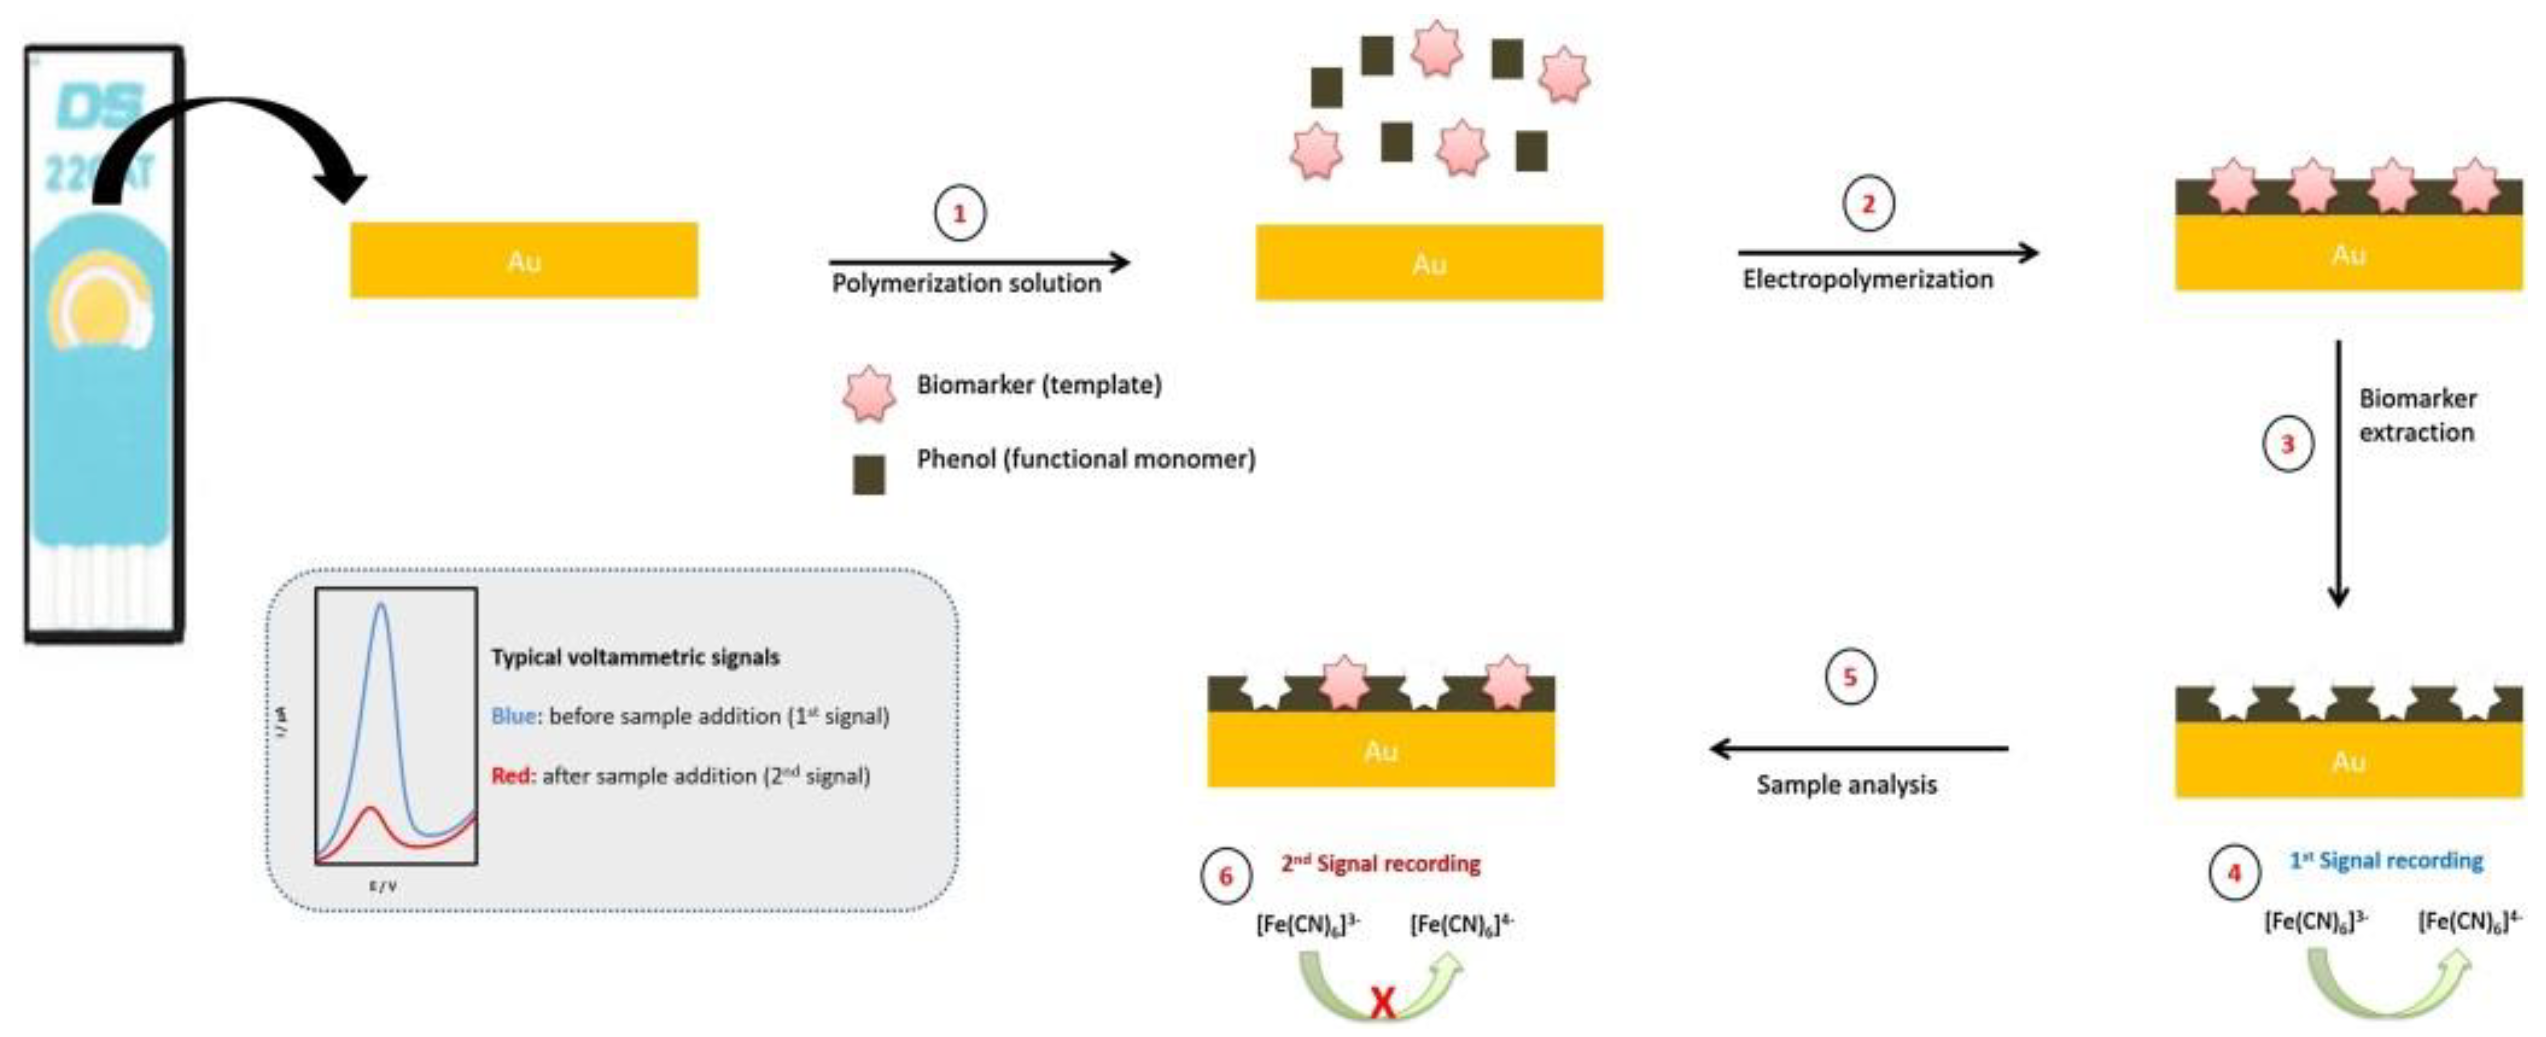
- Pacheco, J.G.; Rebelo, P.; Freitas, M.; Nouws, H.P.A.; Delerue-Matos, C. Breast cancer biomarker (HER2-ECD) detection using a molecularly imprinted electrochemical sensor. Sens. Actuators B Chem. 2018, 273, 1008–1014. [Google Scholar] [CrossRef]
- Freitas, M.; Nouws, H.P.A.; Delerue-Matos, C. Electrochemical Sensing Platforms for HER2-ECD Breast Cancer Biomarker Detection. Electroanalysis 2019, 31, 121–128. [Google Scholar] [CrossRef]
- Freitas, M.; Nouws, H.P.A.; Keating, E.; Delerue-Matos, C. High-performance electrochemical immunomagnetic assay for breast cancer analysis. Sens. Actuators B Chem. 2020, 308, 127667. [Google Scholar] [CrossRef]
- Freitas, M.; Neves, M.; Nouws, H.; Delerue-Matos, C. Quantum dots as nanolabels for breast cancer biomarker HER2-ECD analysis in human serum. Talanta 2019, 208, 120430. [Google Scholar] [CrossRef]
- Freitas, M.; Nouws, H.P.A.; Keating, E.; Fernandes, V.C.; Delerue-Matos, C. Immunomagnetic bead-based bioassay for the voltammetric analysis of the breast cancer biomarker HER2-ECD and tumour cells using quantum dots as detection labels. Microchim. Acta 2020, 187. [Google Scholar] [CrossRef]
- Malecka, K.; Pankratov, D.; Ferapontova, E.E. Femtomolar electroanalysis of a breast cancer biomarker HER-2/neu protein in human serum by the cellulase-linked sandwich assay on magnetic beads. Anal. Chim. Acta 2019, 1077, 140–149. [Google Scholar] [CrossRef]
- Chen, D.; Wang, D.; Hu, X.; Long, G.; Zhang, Y.; Zhou, L. A DNA nanostructured biosensor for electrochemical analysis of HER2 using bioconjugate of GNR@Pd SSs—Apt—HRP. Sens. Actuators B Chem. 2019, 296, 126650. [Google Scholar] [CrossRef]
- Lah, Z.M.A.N.H.; Ahmad, S.A.A.; Zaini, M.S.; Kamarudin, M.A. An Electrochemical Sandwich Immunosensor for the Detection of HER2 using Antibody-Conjugated PbS Quantum Dot as a label. J. Pharm. Biomed. Anal. 2019, 174, 608–617. [Google Scholar] [CrossRef]
- Hartati, Y.W.; Letelay, L.K.; Gaffar, S.; Wyantuti, S.; Bahti, H.H. Cerium oxide-monoclonal antibody bioconjugate for electrochemical immunosensing of HER2 as a breast cancer biomarker. Sens. BioSens. Res. 2020, 27, 100316. [Google Scholar] [CrossRef]
- Xiang, W.; Lv, Q.; Shi, H.; Xie, B.; Gao, L. Aptamer-based biosensor for detecting carcinoembryonic antigen. Talanta 2020, 214, 120716. [Google Scholar] [CrossRef] [PubMed]
- Dalila, R.N.; Arshad, M.K.M.; Gopinath, S.C.B.; Norhaimi, W.M.W.; Fathil, M.F.M. Current and future envision on developing biosensors aided by 2D molybdenum disulfide (MoS2) productions. Biosens. Bioelectron. 2019, 132, 248–264. [Google Scholar] [CrossRef] [PubMed]
- Wang, Y.-L.; Cao, J.-T.; Chen, Y.-H.; Liu, Y.-M. A label-free electrochemiluminescence aptasensor for carcinoembryonic antigen detection based on electrodeposited ZnS–CdS on MoS2 decorated electrode. Anal. Methods 2016, 8, 5242–5247. [Google Scholar] [CrossRef]
- Paimard, G.; Shahlaei, M.; Moradipour, P.; Akbari, H.; Jafari, M.; Arkan, E. An Impedimetric Immunosensor modified with electrospun core-shell nanofibers for determination of the carcinoma embryonic antigen. Sens. Actuators B Chem. 2020, 311, 127928. [Google Scholar] [CrossRef]
- Wang, Y.; Wang, Y.; Wu, D.; Ma, H.; Zhang, Y.; Fan, D.; Pang, X.; Du, B.; Wei, Q. Label-free electrochemical immunosensor based on flower-like Ag/MoS2/rGO nanocomposites for ultrasensitive detection of carcinoembryonic antigen. Sens. Actuators B Chem. 2018, 255, 125–132. [Google Scholar] [CrossRef]
- Su, S.; Han, X.; Lu, Z.; Liu, W.; Zhu, D.; Chao, J.; Fan, C.; Wang, L.; Song, S.; Weng, L.; et al. Facile Synthesis of a MoS2–Prussian Blue Nanocube Nanohybrid-Based Electrochemical Sensing Platform for Hydrogen Peroxide and Carcinoembryonic Antigen Detection. ACS Appl. Mater. Interfaces 2017, 9, 12773–12781. [Google Scholar] [CrossRef]
- Lee, S.X.; Lim, H.N.; Ibrahim, I.; Jamil, A.; Pandikumar, A.; Huang, N.M. Horseradish peroxidase-labeled silver/reduced graphene oxide thin film-modified screen-printed electrode for detection of carcinoembryonic antigen. Biosens. Bioelectron. 2017, 89, 673–680. [Google Scholar] [CrossRef]
- Rizwan, M.; Elma, S.; Lim, S.A.; Ahmed, M.U. AuNPs/CNOs/SWCNTs/chitosan-nanocomposite modified electrochemical sensor for the label-free detection of carcinoembryonic antigen. Biosens. Bioelectron. 2018, 107, 211–217. [Google Scholar] [CrossRef]
- Wang, J.; Hui, N. Zwitterionic poly(carboxybetaine) functionalized conducting polymer polyaniline nanowires for the electrochemical detection of carcinoembryonic antigen in undiluted blood serum. Bioelectrochemistry 2019, 125, 90–96. [Google Scholar] [CrossRef]
- Kumar, S.; Lei, Y.; Alshareef, N.H.; Quevedo-Lopez, M.A.; Salama, K.N. Biofunctionalized two-dimensional Ti3C2 MXenes for ultrasensitive detection of cancer biomarker. Biosens. Bioelectron. 2018, 121, 243–249. [Google Scholar] [CrossRef] [PubMed]
- Yang, Y.; Jiang, M.; Cao, K.; Wu, M.; Zhao, C.; Li, H.; Hong, C. An electrochemical immunosensor for CEA detection based on Au-Ag/rGO@ PDA nanocomposites as integrated double signal amplification strategy. Microchem. J. 2019, 151, 104223. [Google Scholar] [CrossRef]
- Gu, X.; She, Z.; Ma, T.; Tian, S.; Kraatz, H.-B. Electrochemical detection of carcinoembryonic antigen. Biosens. Bioelectron. 2018, 102, 610–616. [Google Scholar] [CrossRef] [PubMed]
- Wei, Y.; Ma, H.; Ren, X.; Ding, C.; Wang, H.; Sun, X.; Du, B.; Zhang, Y.; Wei, Q. A dual-signaling electrochemical ratiometric method for sensitive detection of carcinoembryonic antigen based on Au-Cu2S-CuS/graphene and Au-CeO2 supported toluidine blue complex. Sens. Actuators B Chem. 2018, 256, 504–511. [Google Scholar] [CrossRef]
- Li, Y.; Zhang, Y.; Li, F.; Li, M.; Chen, L.; Dong, Y.; Wei, Q. Sandwich-type amperometric immunosensor using functionalized magnetic graphene loaded gold and silver core-shell nanocomposites for the detection of Carcinoembryonic antigen. J. Electroanal. Chem. 2017, 795, 1–9. [Google Scholar] [CrossRef]
- Wu, D.; Ma, H.; Zhang, Y.; Jia, H.; Yan, T.; Wei, Q. Corallite-like Magnetic Fe3O4@MnO2@Pt Nanocomposites as Multiple Signal Amplifiers for the Detection of Carcinoembryonic Antigen. ACS Appl. Mater. Interfaces 2015, 7, 18786–18793. [Google Scholar] [CrossRef]
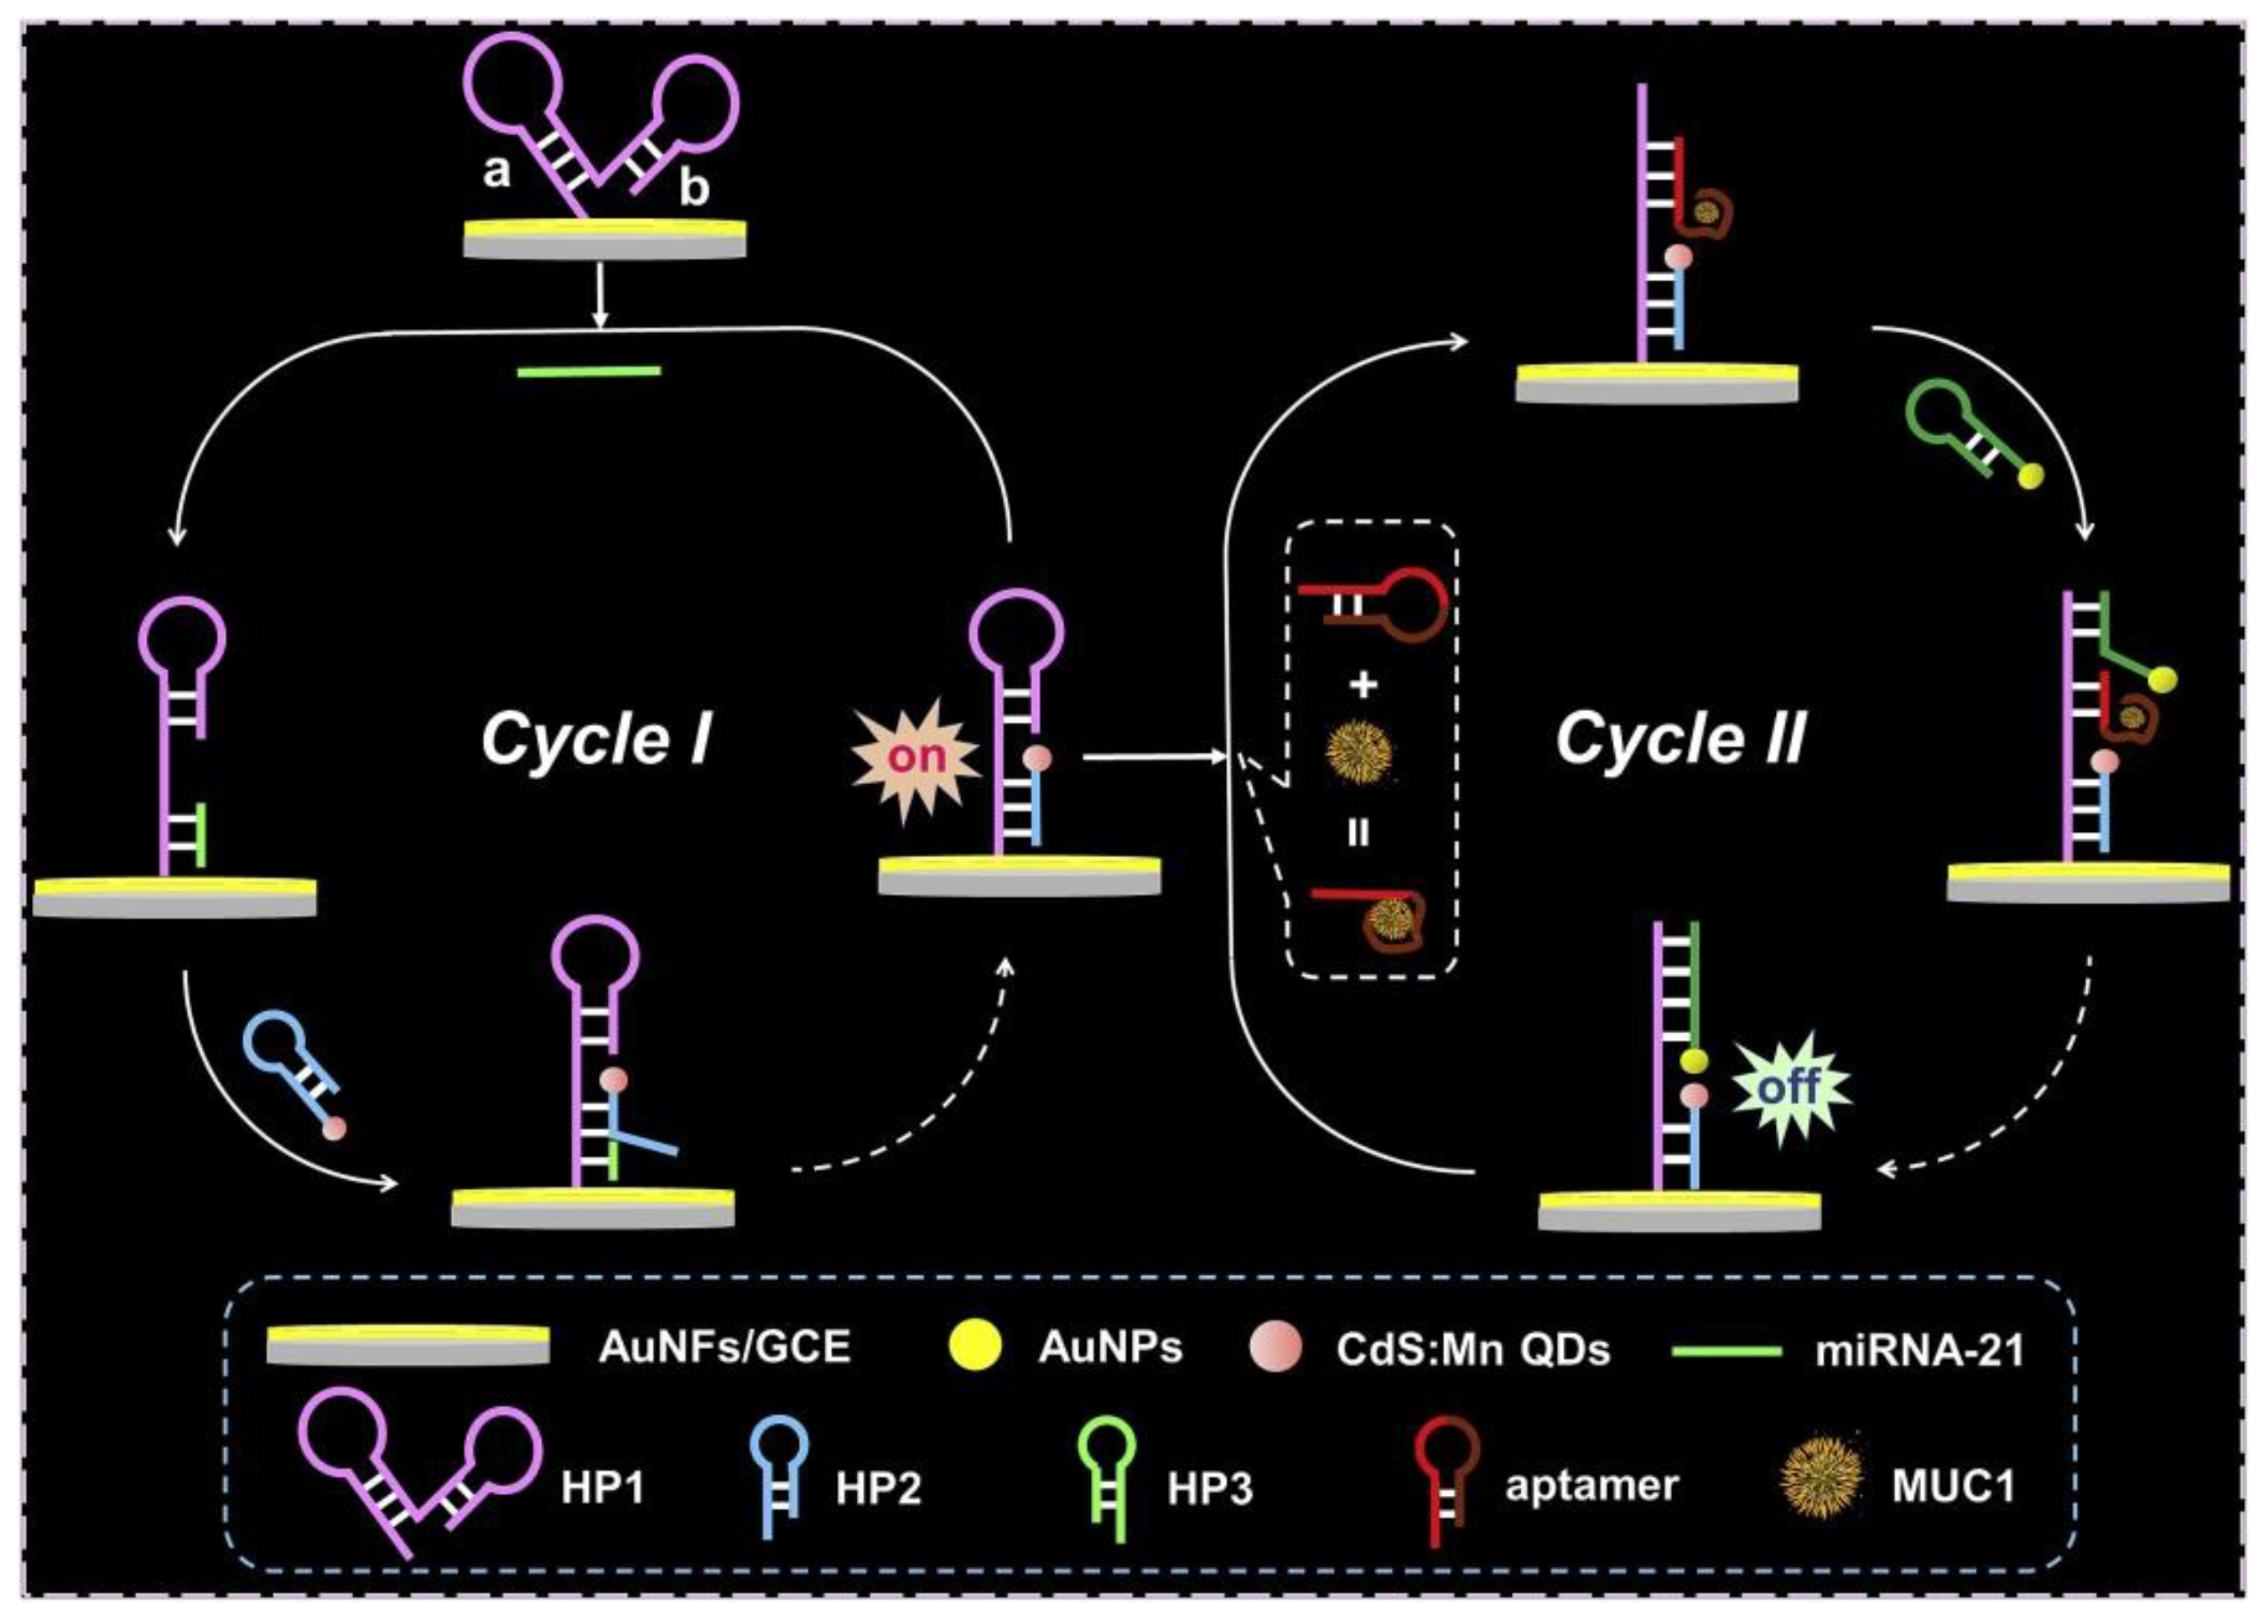
- Li, J.; Liu, J.; Bi, Y.; Sun, M.; Bai, J.; Zhou, M. Ultrasensitive electrochemiluminescence biosensing platform for miRNA-21 and MUC1 detection based on dual catalytic hairpin assembly. Anal. Chim. Acta 2020, 1105, 87–94. [Google Scholar] [CrossRef]
- Jeong, S.; Park, M.-J.; Song, W.; Kim, H.-S. Current immunoassay methods and their applications to clinically used biomarkers of breast cancer. Clin. Biochem. 2020, 78, 43–57. [Google Scholar] [CrossRef]
- Alarfaj, N.A.; El-Tohamy, M.F.; Oraby, H. New label-free ultrasensitive electrochemical immunosensor-based Au/MoS2/rGO nanocomposites for CA 27–29 breast cancer antigen detection. New J. Chem. 2018, 42, 11046–11053. [Google Scholar] [CrossRef]
- Roberts, A.; Tripathi, P.P.; Gandhi, S. Graphene nanosheets as an electric mediator for ultrafast sensing of urokinase plasminogen activator receptor-A biomarker of cancer. Biosens. Bioelectron. 2019, 141, 111398. [Google Scholar] [CrossRef]
- Jilani, T.N.; Siddiqui, A.H. Tissue Plasminogen Activator. In StatPearls; StatPearls Publishing Copyright ©: Treasure Island, FL, USA, 2020; pp. 159–170. [Google Scholar]
- Saify Nabiabad, H.; Piri, K.; Kafrashi, F.; Afkhami, A.; Madrakian, T. Fabrication of an immunosensor for early and ultrasensitive determination of human tissue plasminogen activator (tPA) in myocardial infraction and breast cancer patients. Anal. Bioanal. Chem. 2018, 410, 3683–3691. [Google Scholar] [CrossRef] [PubMed]
- Vajhadin, F.; Ahadian, S.; Travas-Sejdic, J.; Lee, J.; Mazloum-Ardakani, M.; Salvador, J.; Aninwene, G.E., II; Bandaru, P.; Sun, W.; Khademhossieni, A. Electrochemical cytosensors for detection of breast cancer cells. Biosens. Bioelectron. 2019, 151, 111984. [Google Scholar] [CrossRef]
- Lee, A.V.; Oesterreich, S.; Davidson, N.E. MCF-7 Cells—Changing the Course of Breast Cancer Research and Care for 45 Years. J. Natl. Cancer Inst. 2015, 107. [Google Scholar] [CrossRef] [PubMed]
- Comşa, Ş.; Cîmpean, A.M.; Raica, M. The Story of MCF-7 Breast Cancer Cell Line: 40 years of Experience in Research. Anticancer Res. 2015, 35, 3147–3154. [Google Scholar] [PubMed]
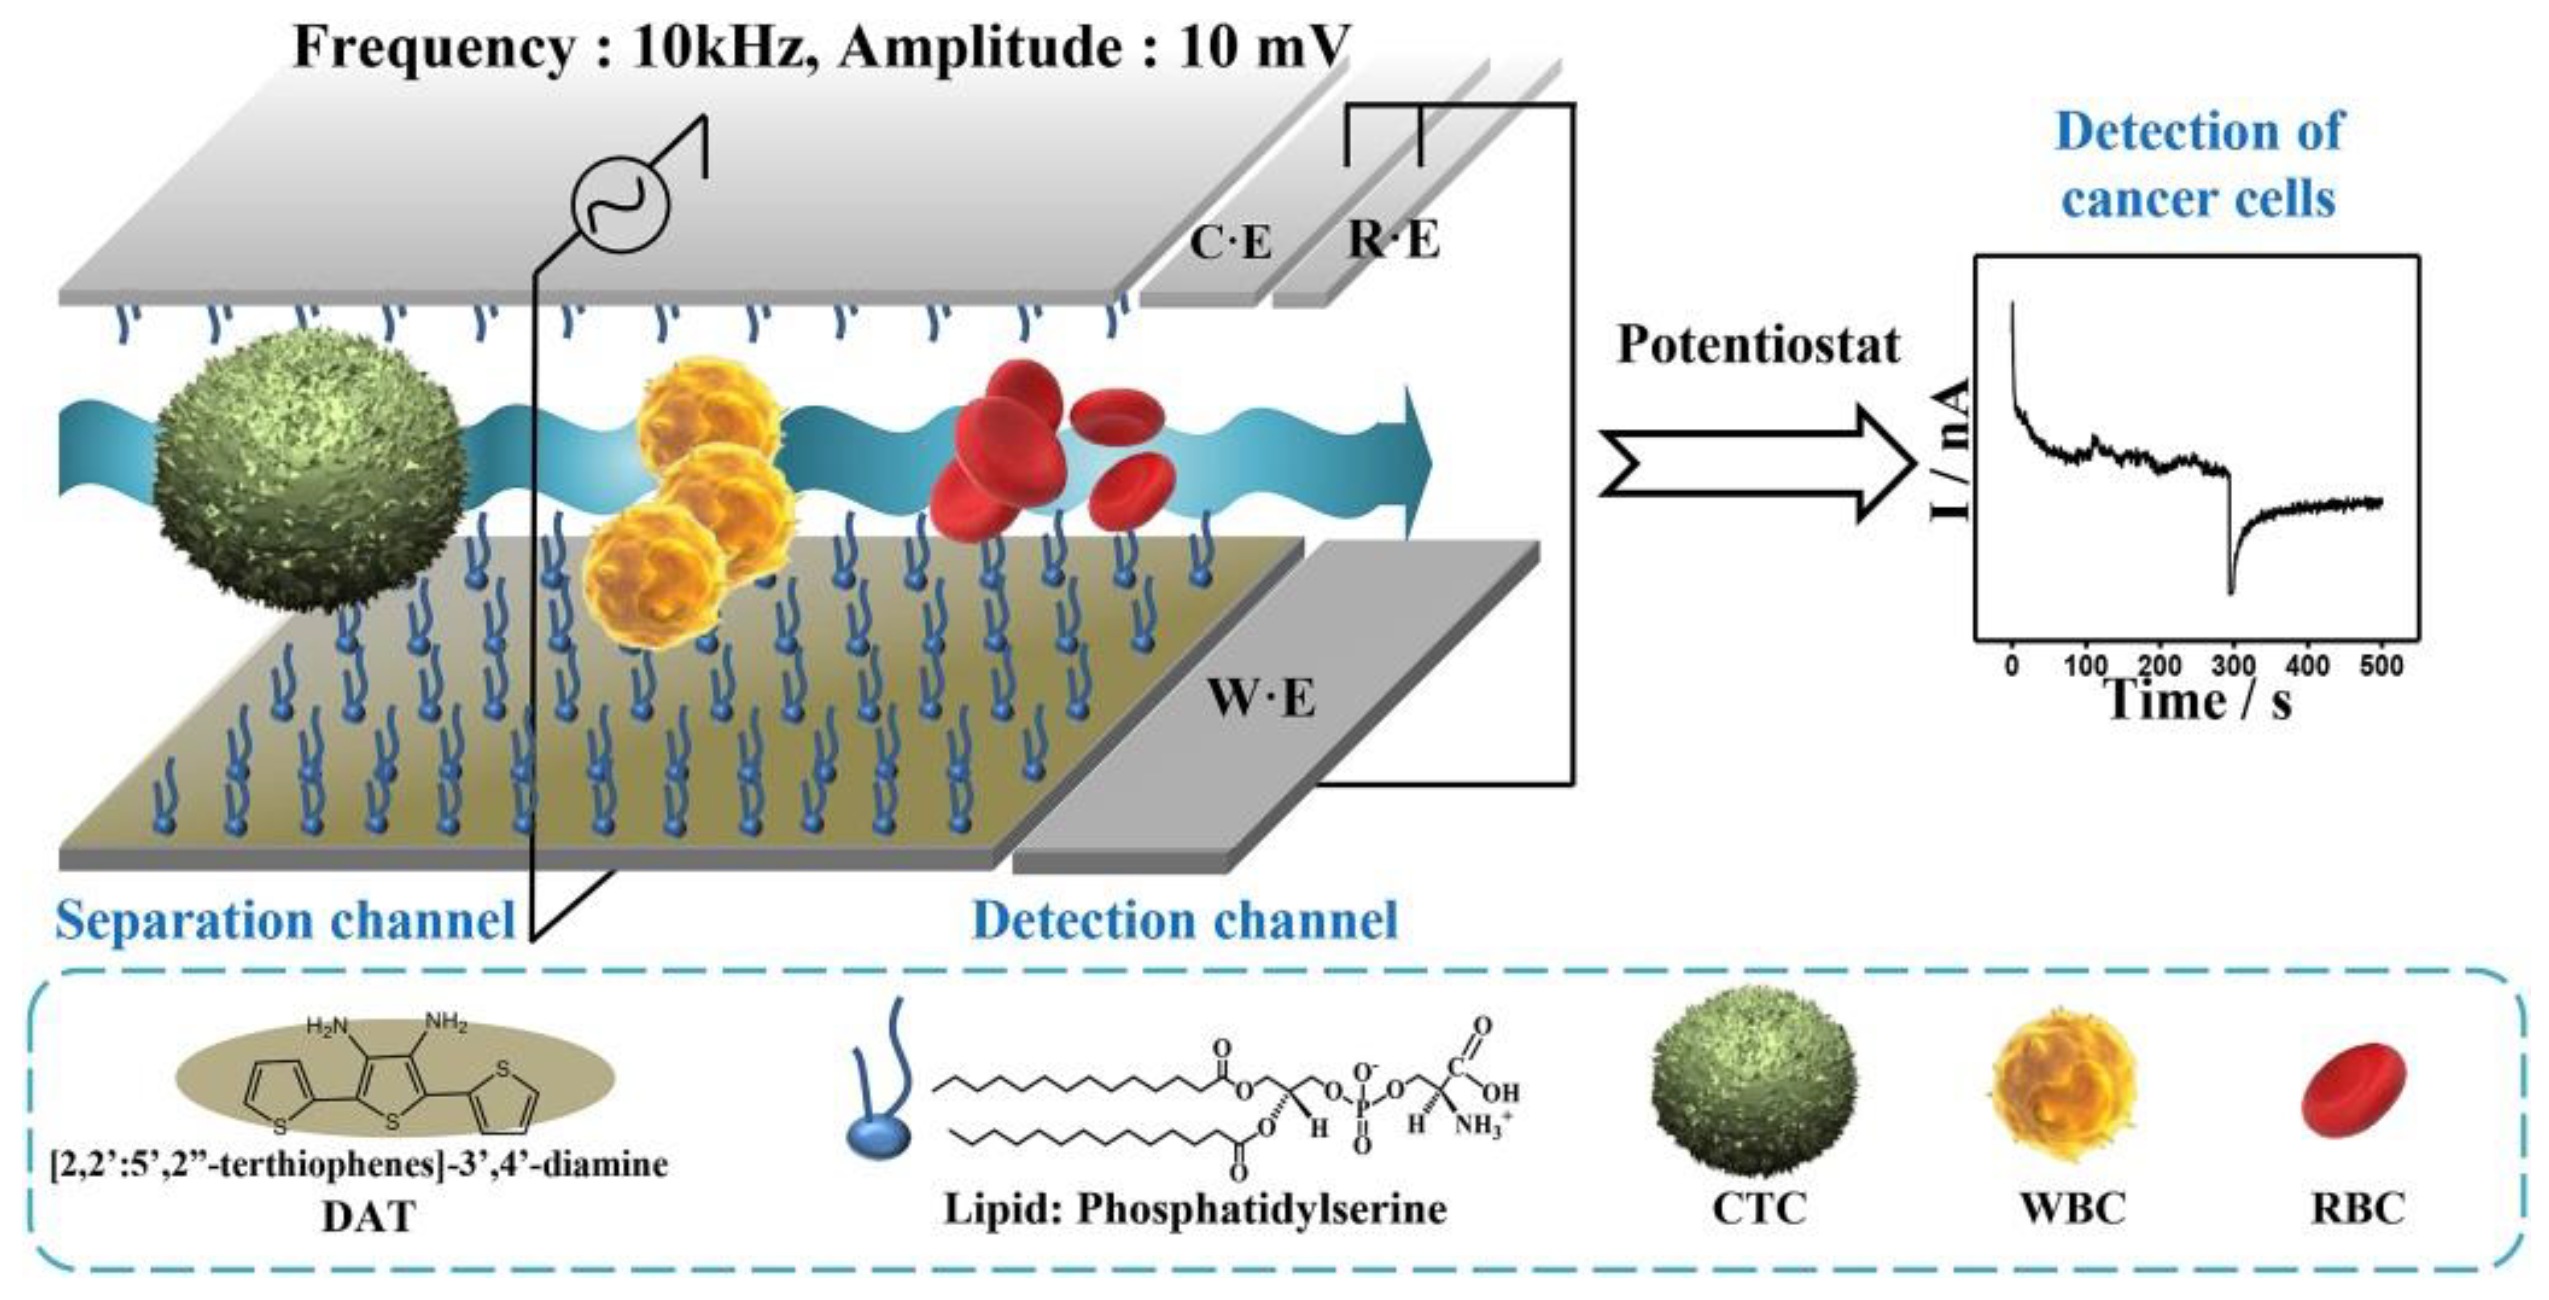
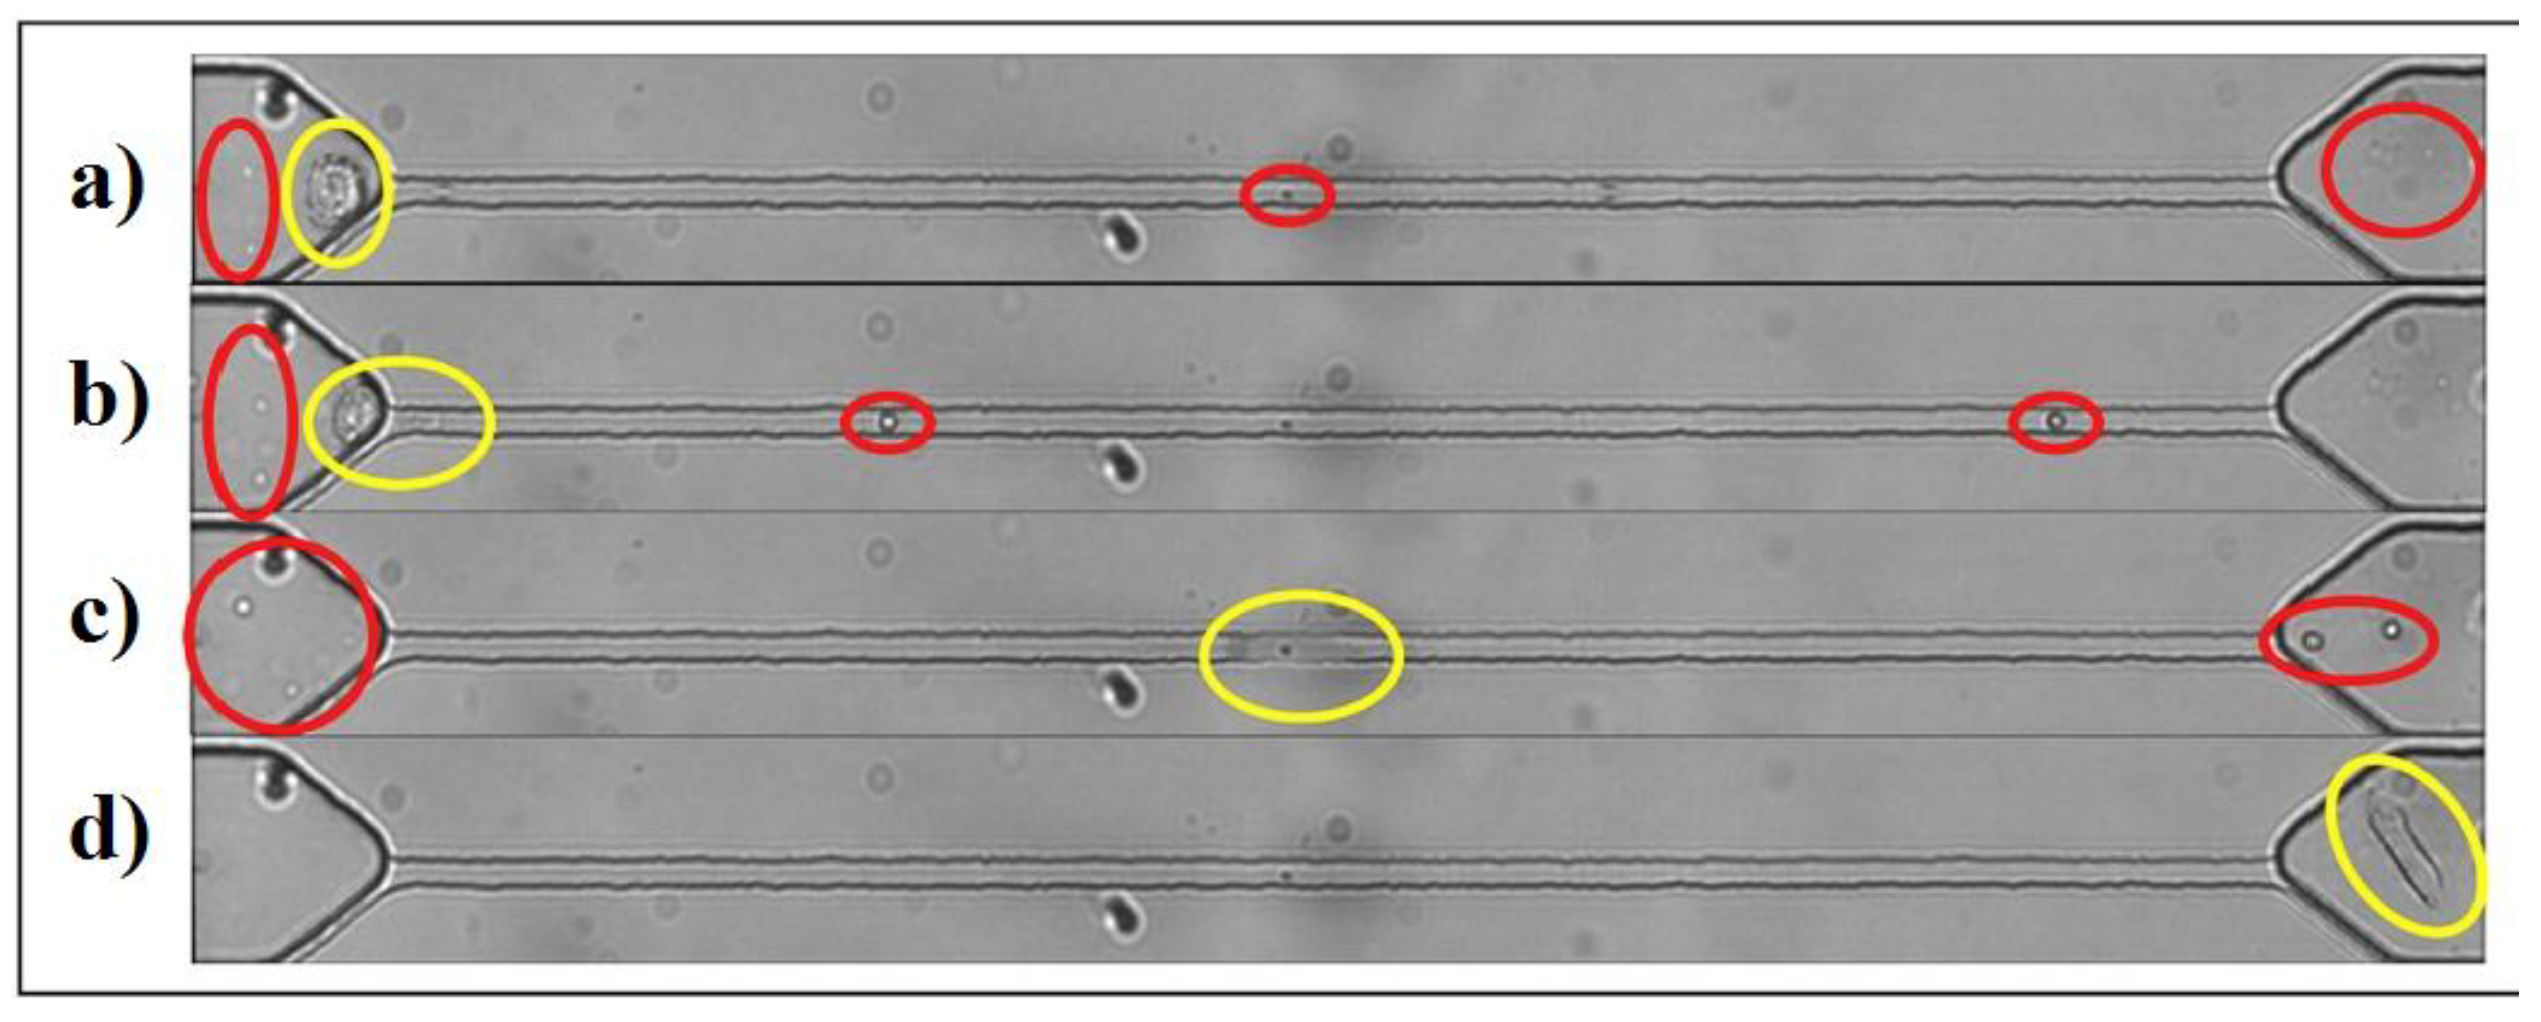
- Gurudatt, N.G.; Chung, S.; Kim, J.-M.; Kim, M.-H.; Jung, D.-K.; Han, J.-Y.; Shim, Y.-B. Separation detection of different circulating tumor cells in the blood using an electrochemical microfluidic channel modified with a lipid-bonded conducting polymer. Biosens. Bioelectron. 2019, 146, 111746. [Google Scholar] [CrossRef] [PubMed]
- Ghassemi, P.; Ren, X.; Foster, B.M.; Kerr, B.A.; Agah, M. Post-enrichment circulating tumor cell detection and enumeration via deformability impedance cytometry. Biosens. Bioelectron. 2020, 150, 111868. [Google Scholar] [CrossRef] [PubMed]
- Liu, P.; Wang, L.; Zhao, K.; Liu, Z.; Cao, H.; Ye, S.; Liang, G. High luminous efficiency Au@CDs for sensitive and label-free electrochemiluminescent detection of circulating tumor cells in serum. Sens. Actuators B Chem. 2020, 316, 128131. [Google Scholar] [CrossRef]
- Tian, L.; Qi, J.; Qian, K.; Oderinde, O.; Liu, Q.; Yao, C.; Song, W.; Wang, Y. Copper (II) oxide nanozyme based electrochemical cytosensor for high sensitive detection of circulating tumor cells in breast cancer. J. Electroanal. Chem. 2018, 812, 1–9. [Google Scholar] [CrossRef]
- Hasanzadeh, M.; Razmi, N.; Mokhtarzadeh, A.; Shadjou, N.; Mahboob, S. Aptamer based assay of plated-derived grow factor in unprocessed human plasma sample and MCF-7 breast cancer cell lysates using gold nanoparticle supported alpha-cyclodextrin. Int. J. Biol. Macromol. 2018, 108, 69–80. [Google Scholar] [CrossRef]
- Yang, Y.; Fu, Y.; Su, H.; Mao, L.; Chen, M. Sensitive detection of MCF-7 human breast cancer cells by using a novel DNA-labeled sandwich electrochemical biosensor. Biosens. Bioelectron. 2018, 122, 175–182. [Google Scholar] [CrossRef]
- Wang, K.; He, M.-Q.; Zhai, F.-H.; He, R.-H.; Yu, Y.-L. A novel electrochemical biosensor based on polyadenine modified aptamer for label-free and ultrasensitive detection of human breast cancer cells. Talanta 2017, 166, 87–92. [Google Scholar] [CrossRef] [PubMed]
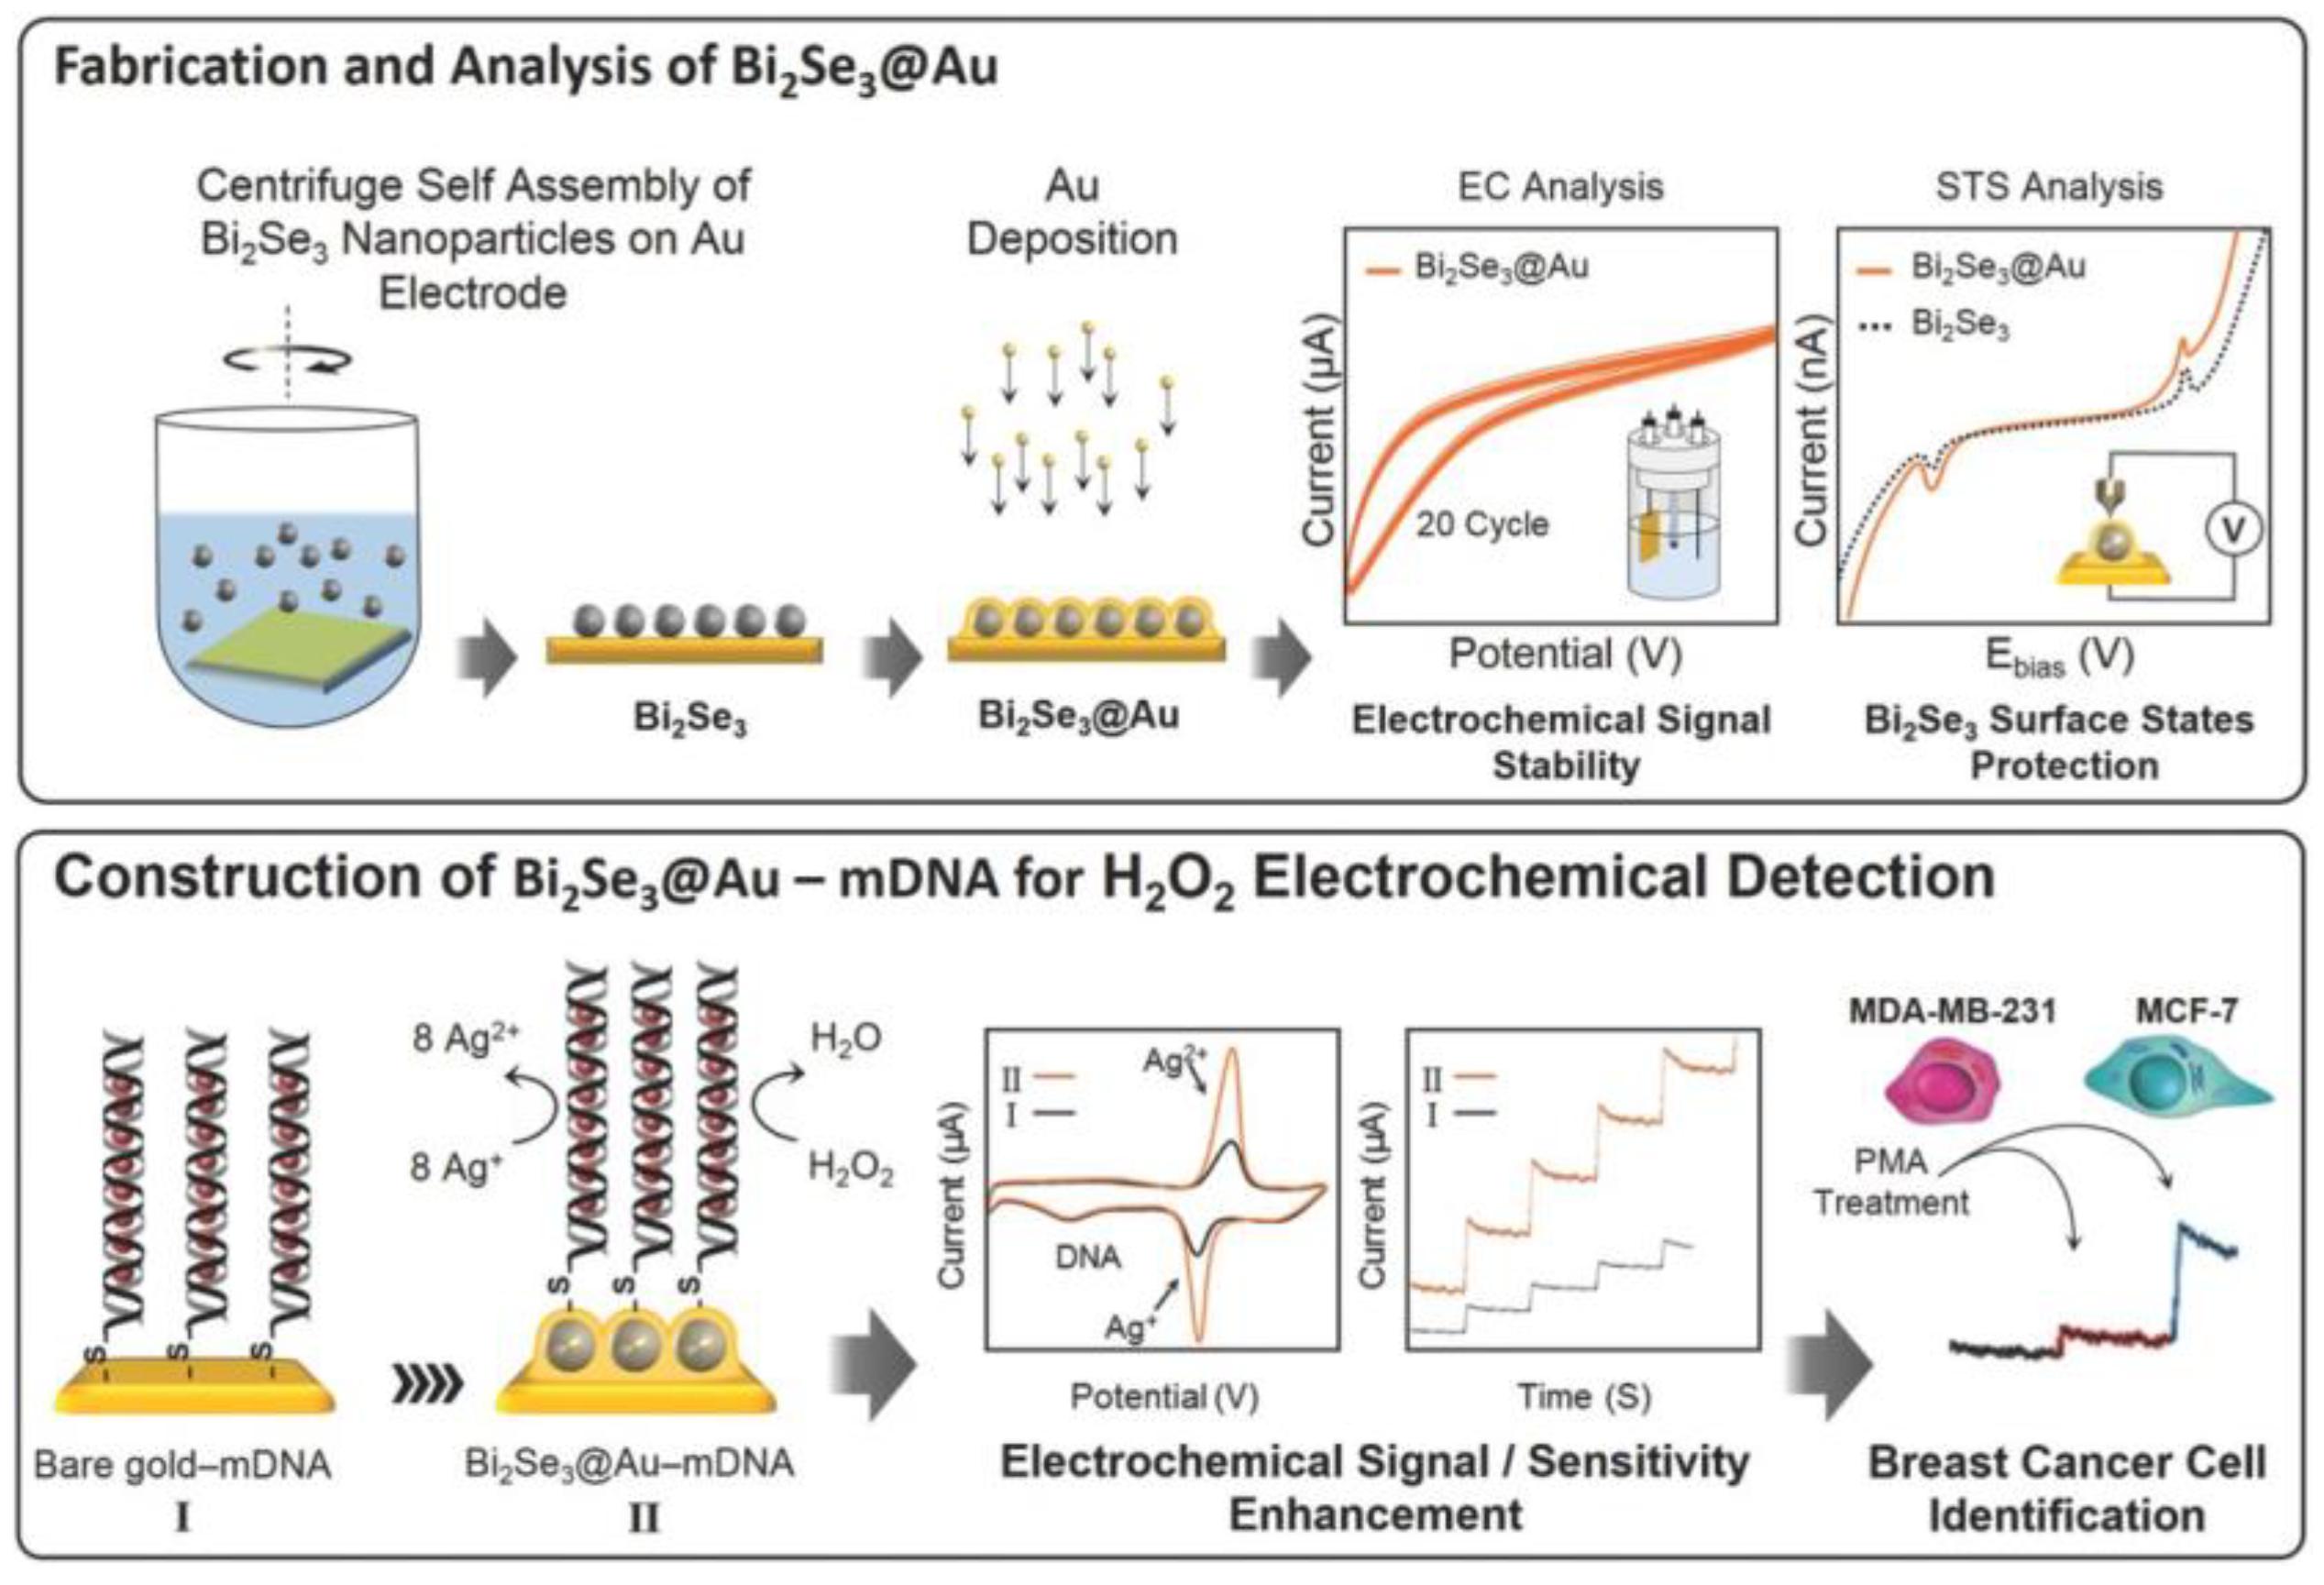
- Mohammadniaei, M.; Yoon, J.; Lee, T.; Bharate, B.G.; Jo, J.; Lee, D.; Choi, J.-W. Electrochemical Biosensor Composed of Silver Ion-Mediated dsDNA on Au-Encapsulated Bi2Se3 Nanoparticles for the Detection of H2O2 Released from Breast Cancer Cells. Small 2018, 14, 1703970. [Google Scholar] [CrossRef] [PubMed]
- Dong, W.; Ren, Y.; Bai, Z.; Yang, Y.; Wang, Z.; Zhang, C.; Chen, Q. Trimetallic AuPtPd nanocomposites platform on graphene: Applied to electrochemical detection and breast cancer diagnosis. Talanta 2018, 189, 79–85. [Google Scholar] [CrossRef] [PubMed]
- Luo, J.; Liang, D.; Li, X.; Deng, L.; Wang, Z.; Yang, M. Aptamer-based photoelectrochemical assay for the determination of MCF-7. Microchim. Acta 2020, 187. [Google Scholar] [CrossRef] [PubMed]
- Safavipour, M.; Kharaziha, M.; Amjadi, E.; Karimzadeh, F.; Allafchian, A. TiO2 nanotubes/reduced GO nanoparticles for sensitive detection of breast cancer cells and photothermal performance. Talanta 2020, 208, 120369. [Google Scholar] [CrossRef]
- Akhtartavan, S.; Karimi, M.; Sattarahmady, N.; Heli, H. An electrochemical signal-on apta-cyto-sensor for quantitation of circulating human MDA-MB-231 breast cancer cells by transduction of electro-deposited non-spherical nanoparticles of gold. J. Pharm. Biomed. Anal. 2020, 178, 112948. [Google Scholar] [CrossRef] [PubMed]
- Al-Hajj, M.; Wicha, M.S.; Benito-Hernandez, A.; Morrison, S.J.; Clarke, M.F. Prospective identification of tumorigenic breast cancer cells. Proc. Natl. Acad. Sci. USA 2003, 100, 3983–3988. [Google Scholar] [CrossRef]
- Tang, Y.; Dai, Y.; Huang, X.; Li, L.; Han, B.; Cao, Y.; Zhao, J. Self-assembling peptide-based multifunctional nanofibers for electrochemical identification of breast cancer stem-like cells. Anal. Chem. 2019, 91, 7531–7537. [Google Scholar] [CrossRef]
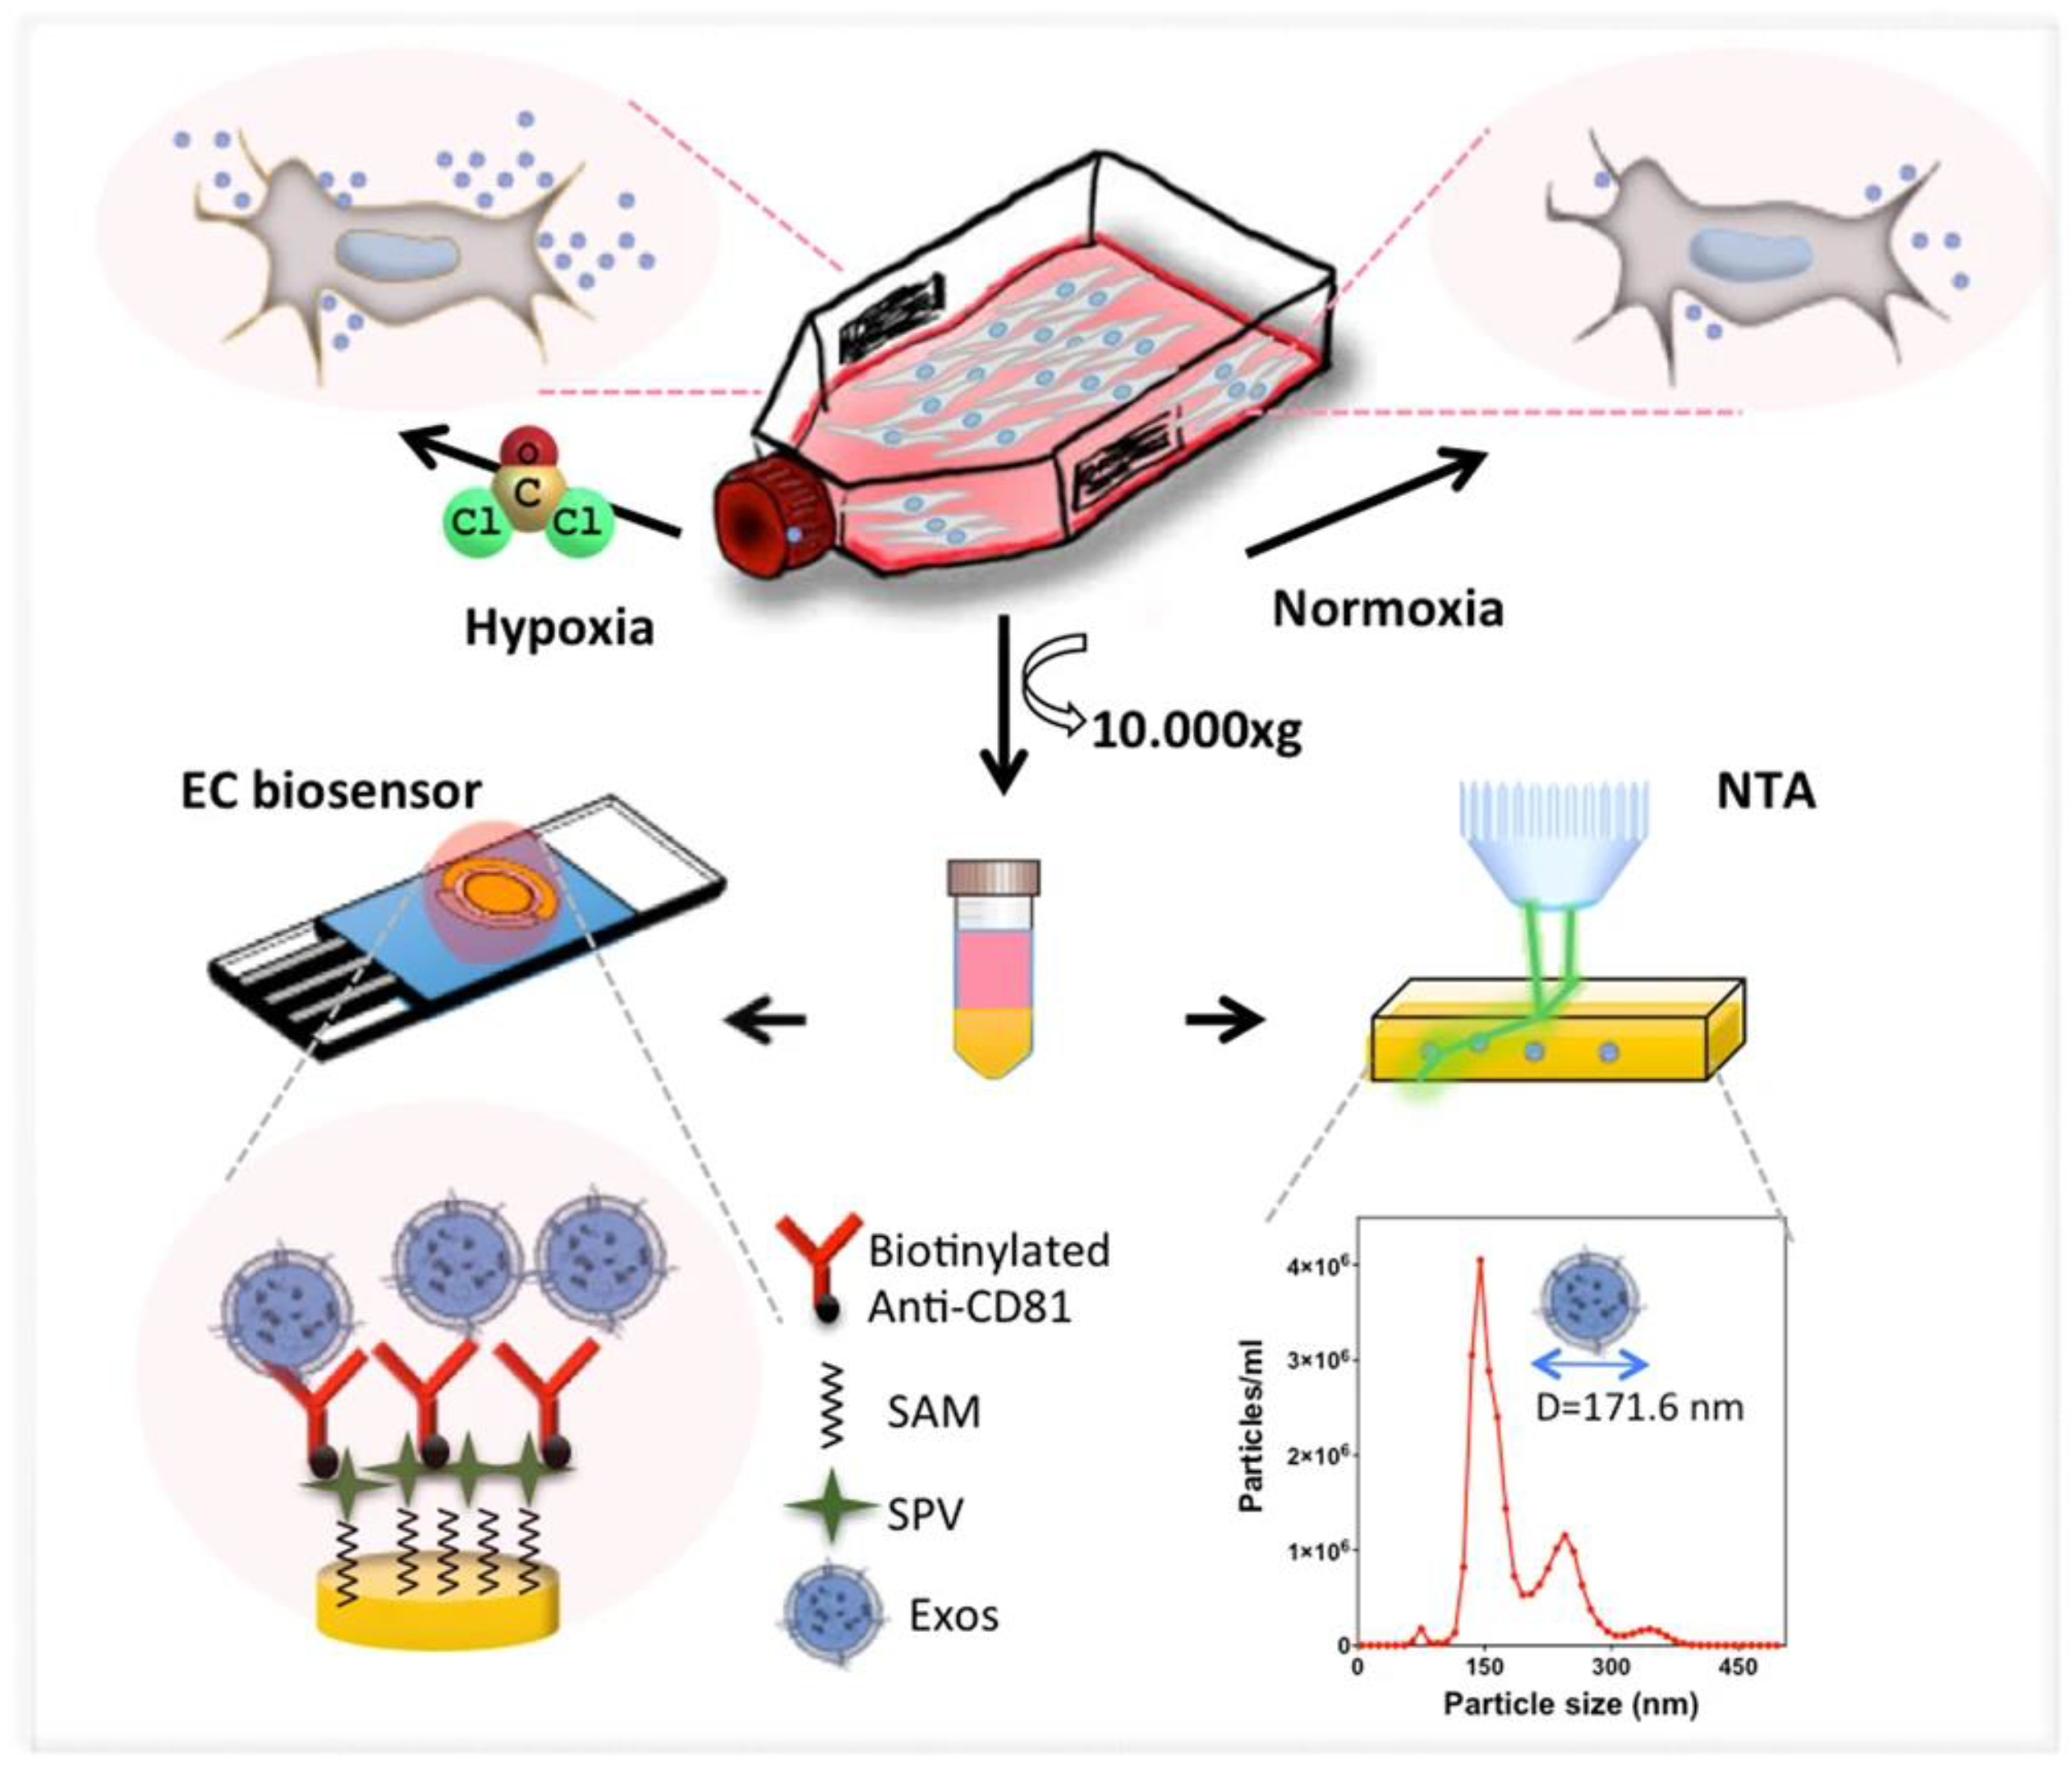
- Kilic, T.; Valinhas, A.T.D.S.; Wall, I.; Renaud, P.; Carrara, S. Label-free detection of hypoxia-induced extracellular vesicle secretion from MCF-7 cells. Sci. Rep. 2018, 8, 9402. [Google Scholar] [CrossRef] [PubMed]
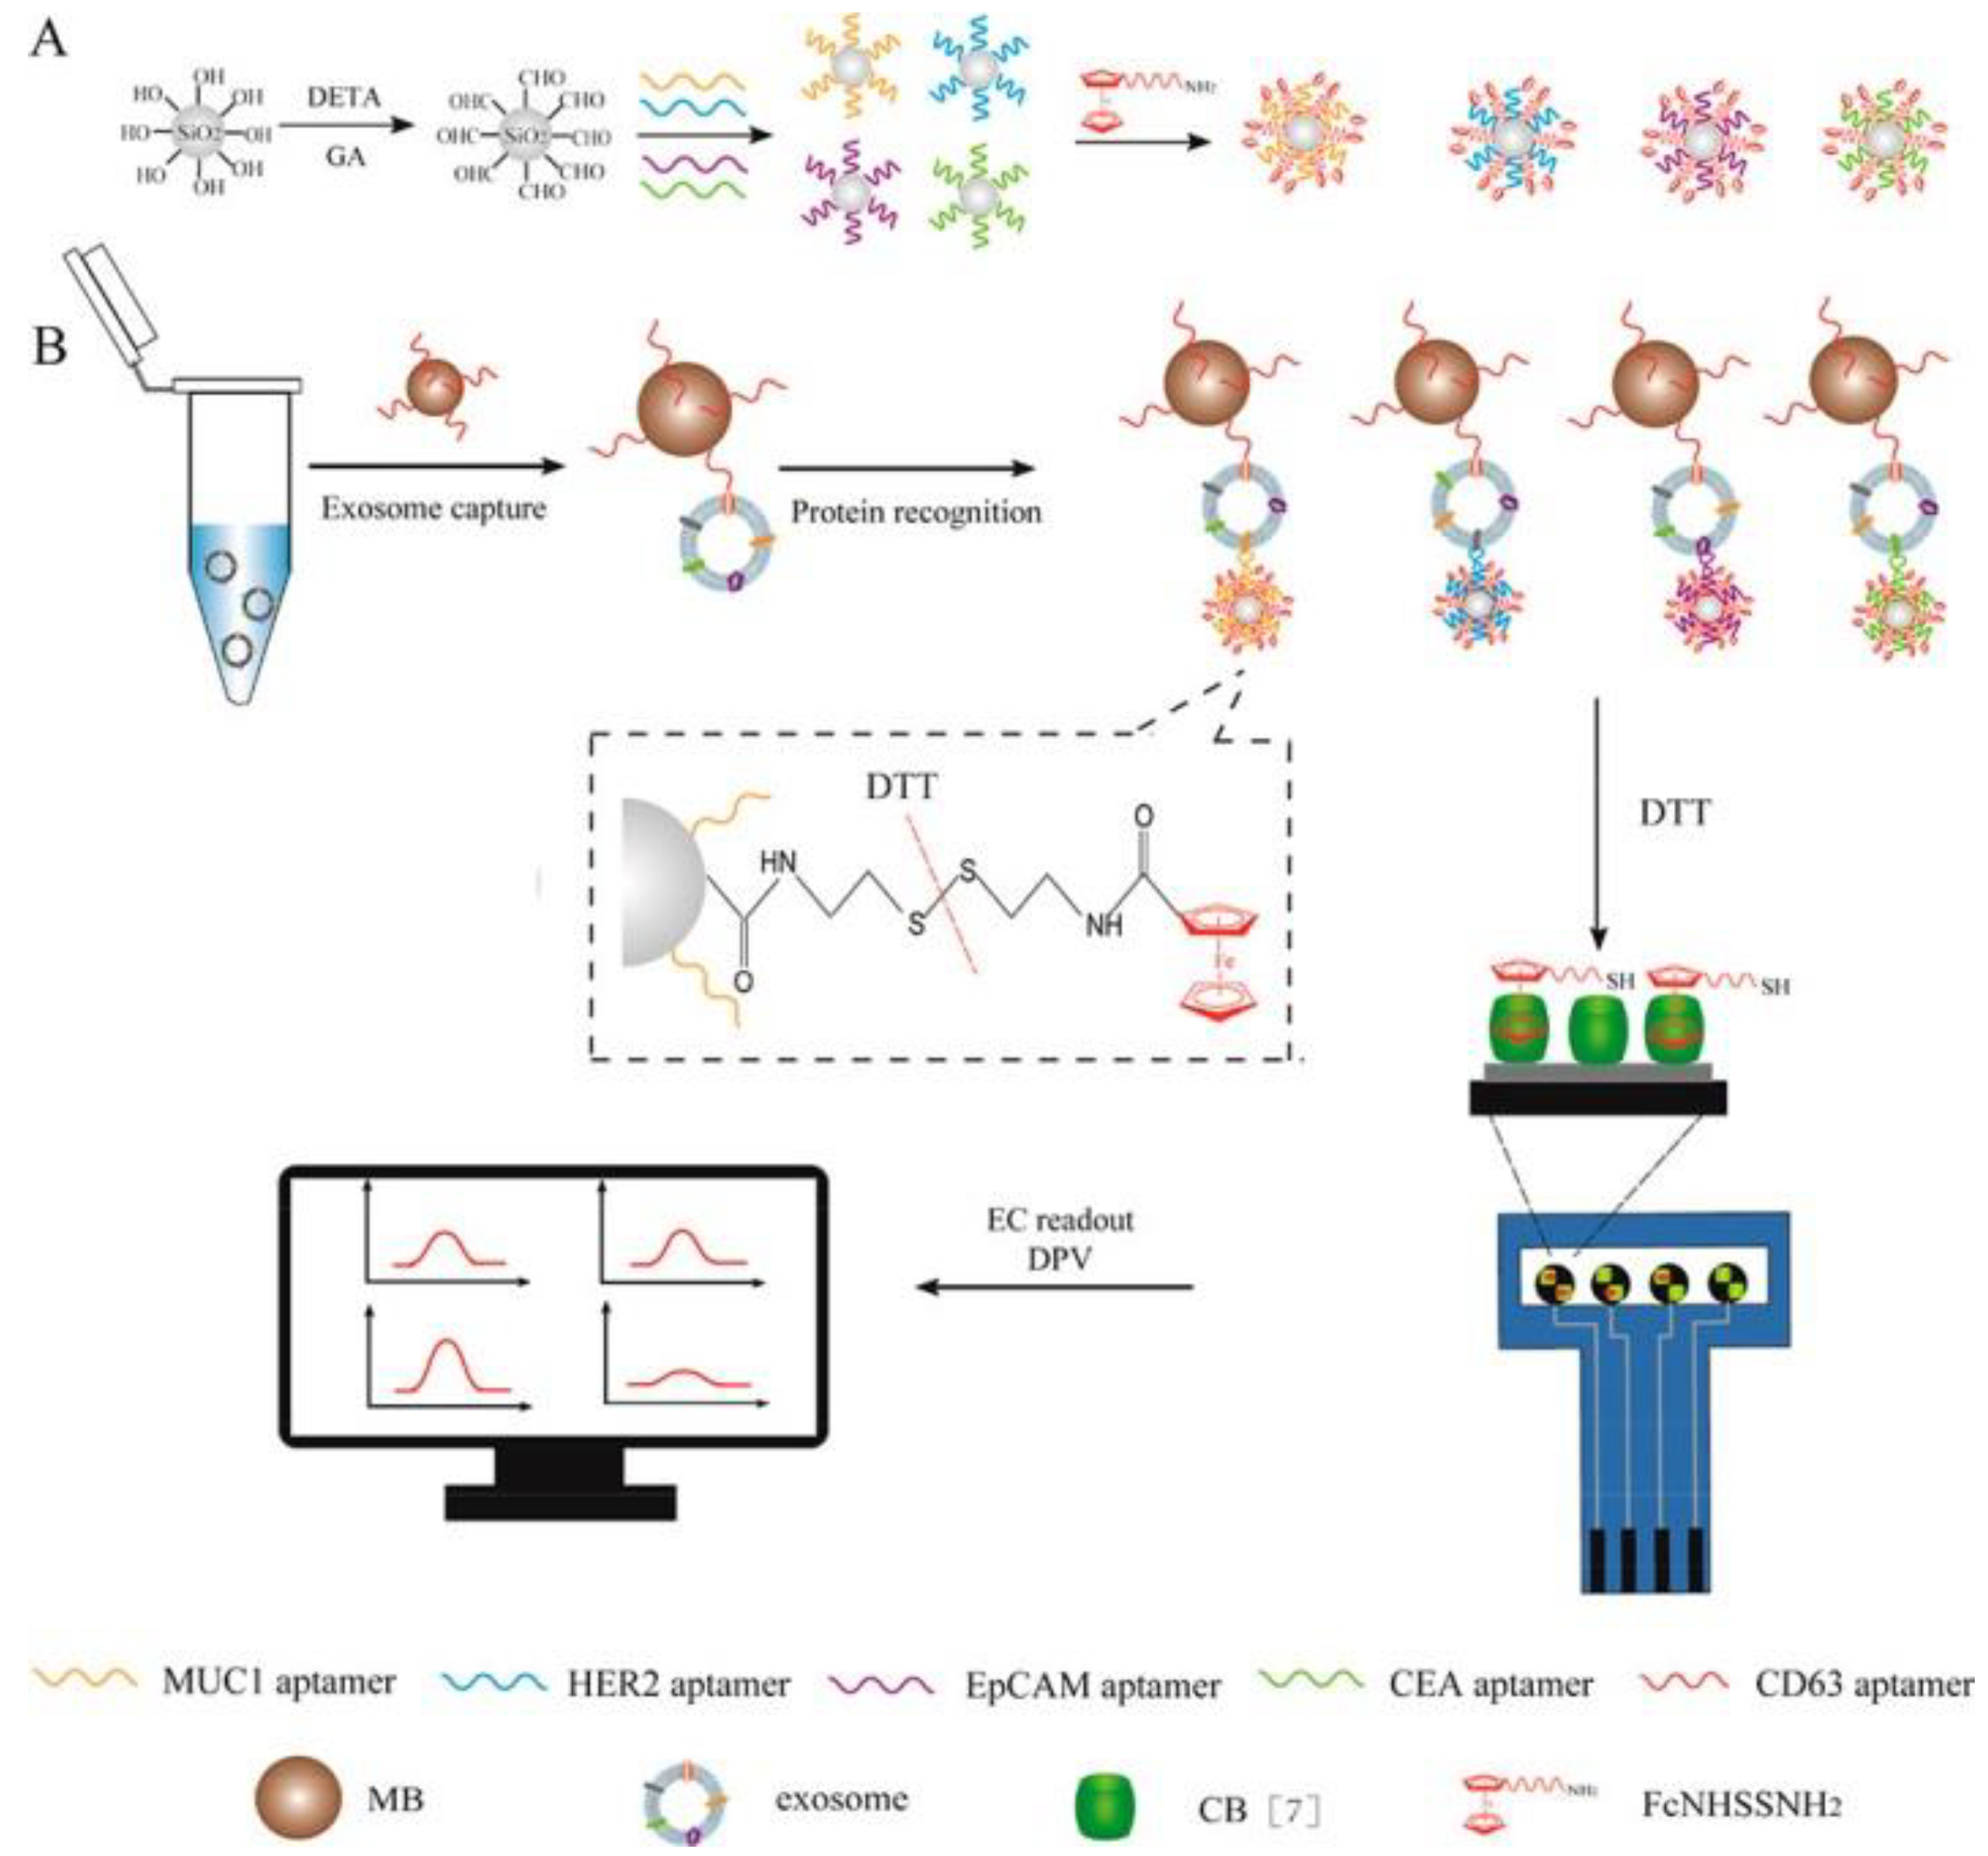
- An, Y.; Li, R.; Zhang, F.; He, P. Magneto-Mediated Electrochemical Sensor for Simultaneous Analysis of Breast Cancer Exosomal Proteins. Anal. Chem. 2020, 92, 5404–5410. [Google Scholar] [CrossRef] [PubMed]
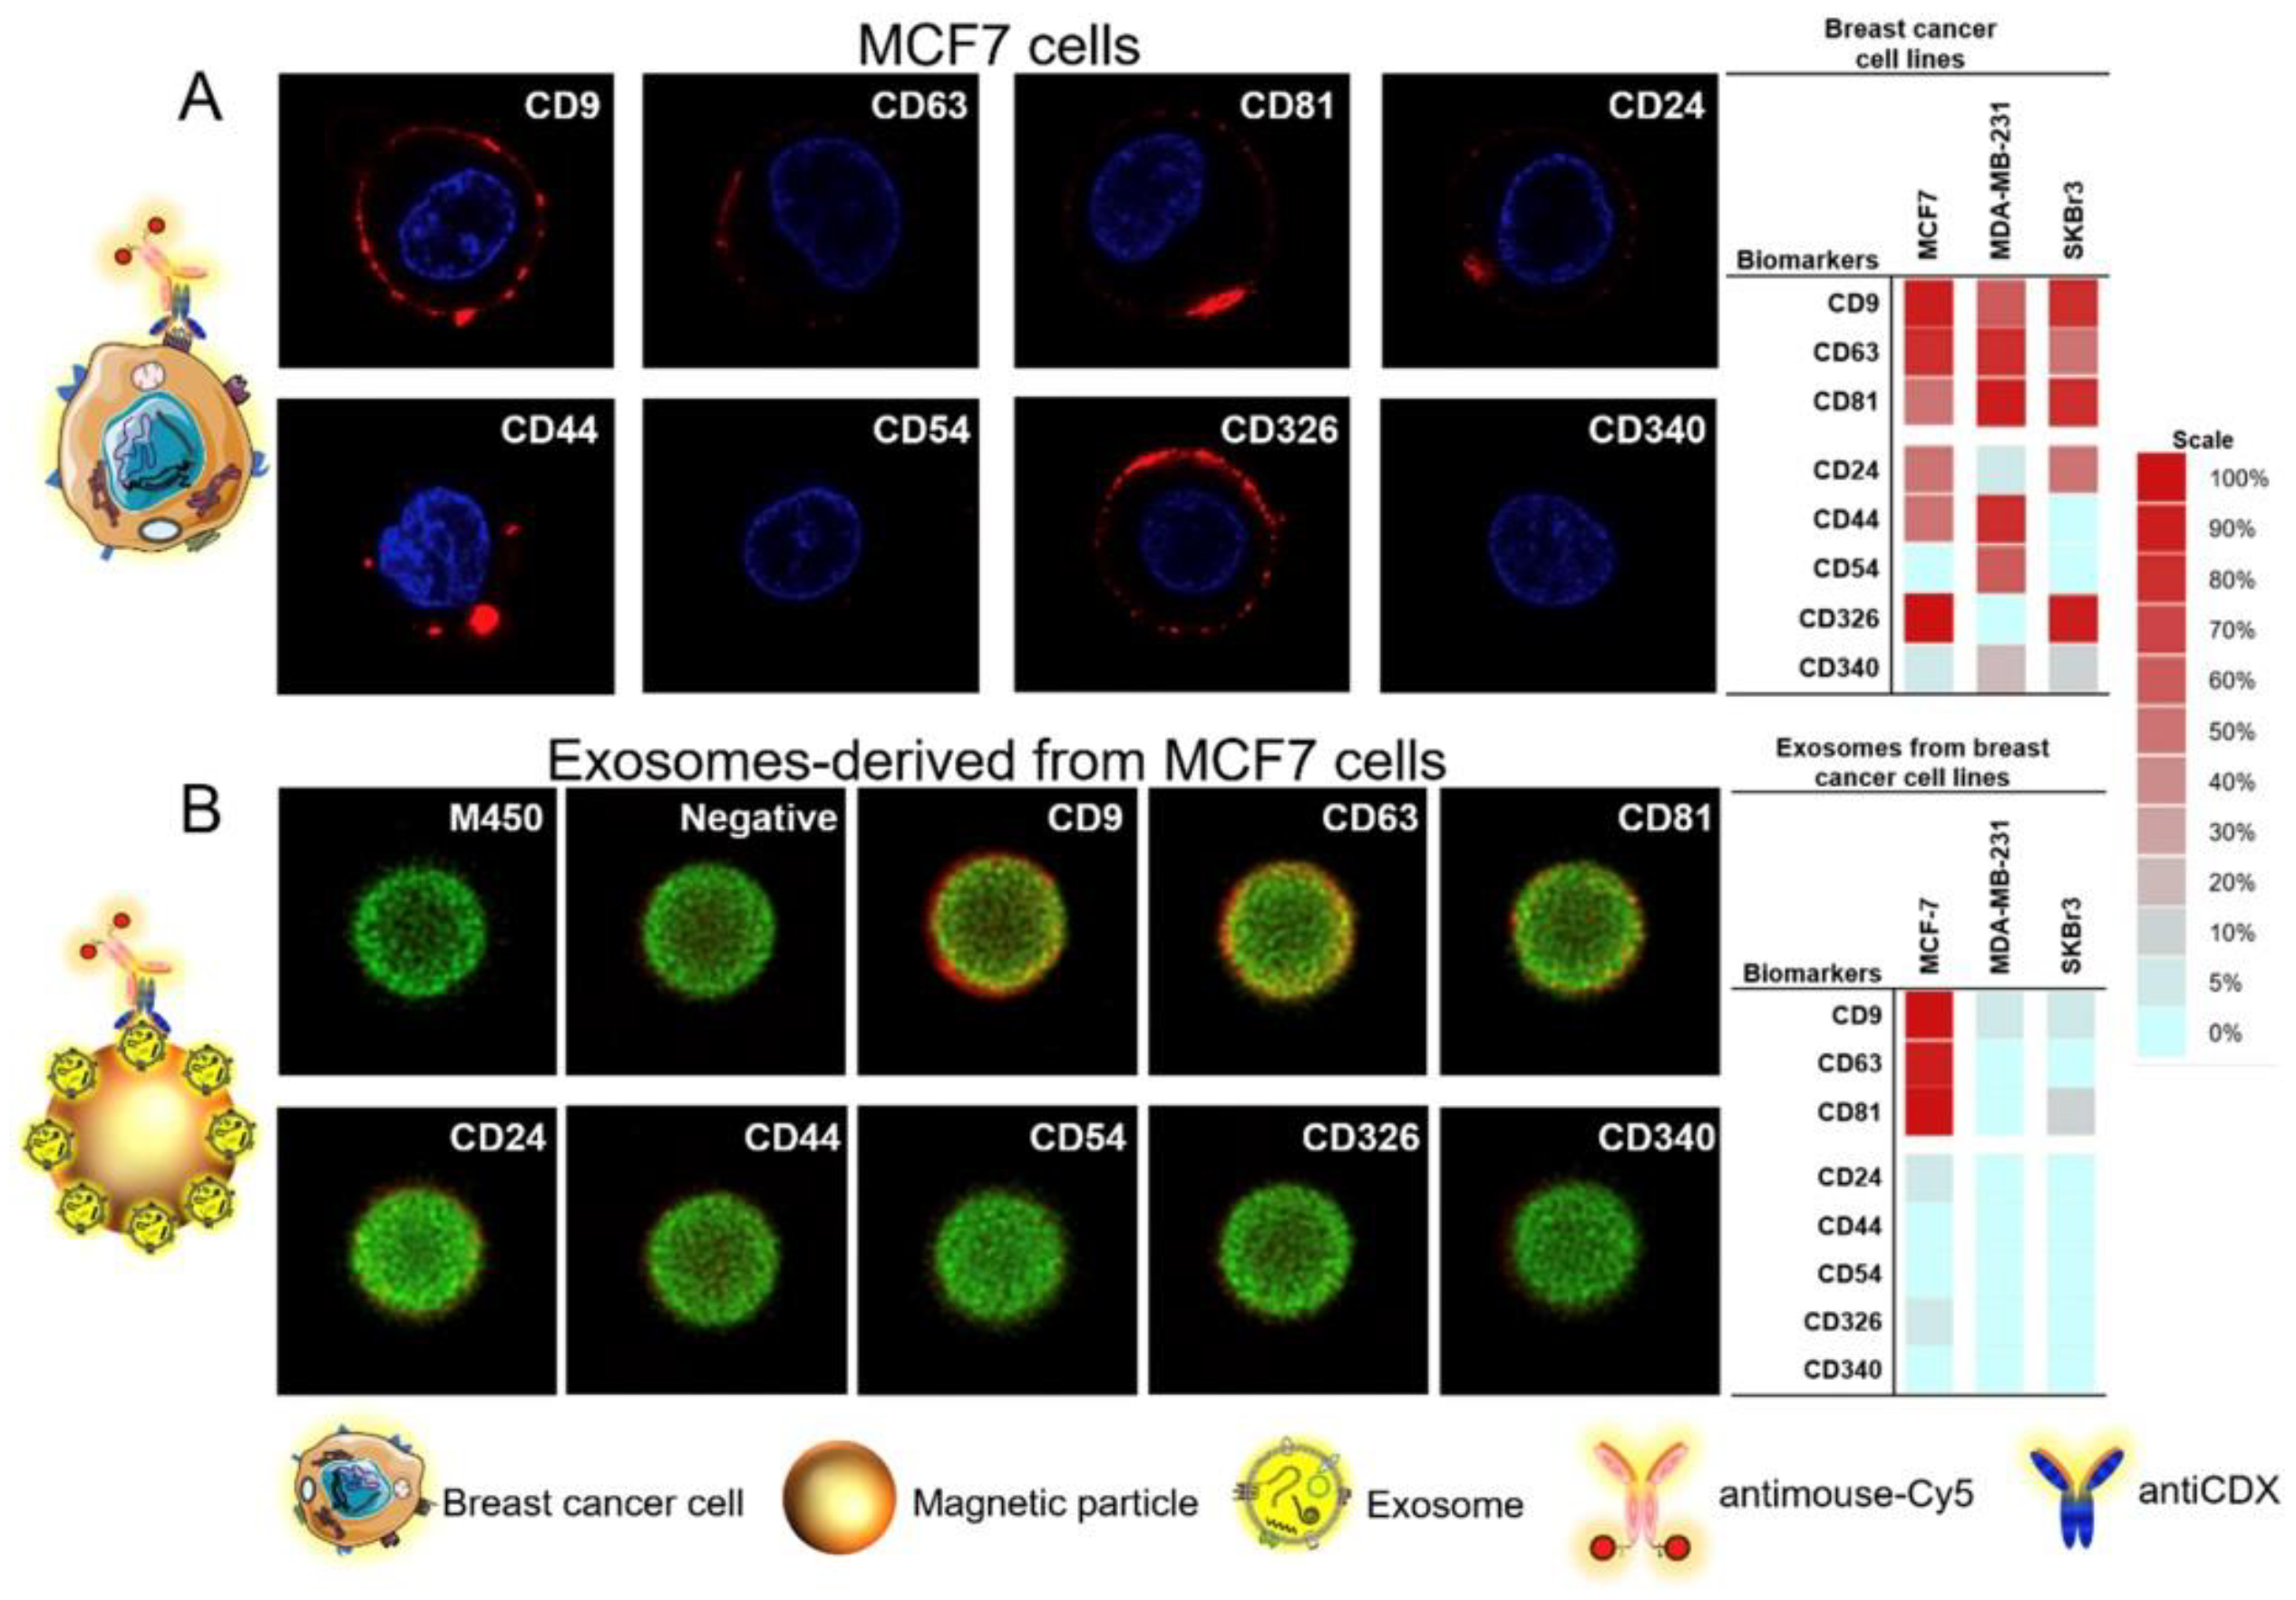
- Moura, S.L.; Martín, C.G.; Martí, M.; Pividori, M.I. Electrochemical immunosensing of nanovesicles as biomarkers for breast cancer. Biosens. Bioelectron. 2020, 150, 111882. [Google Scholar] [CrossRef] [PubMed]
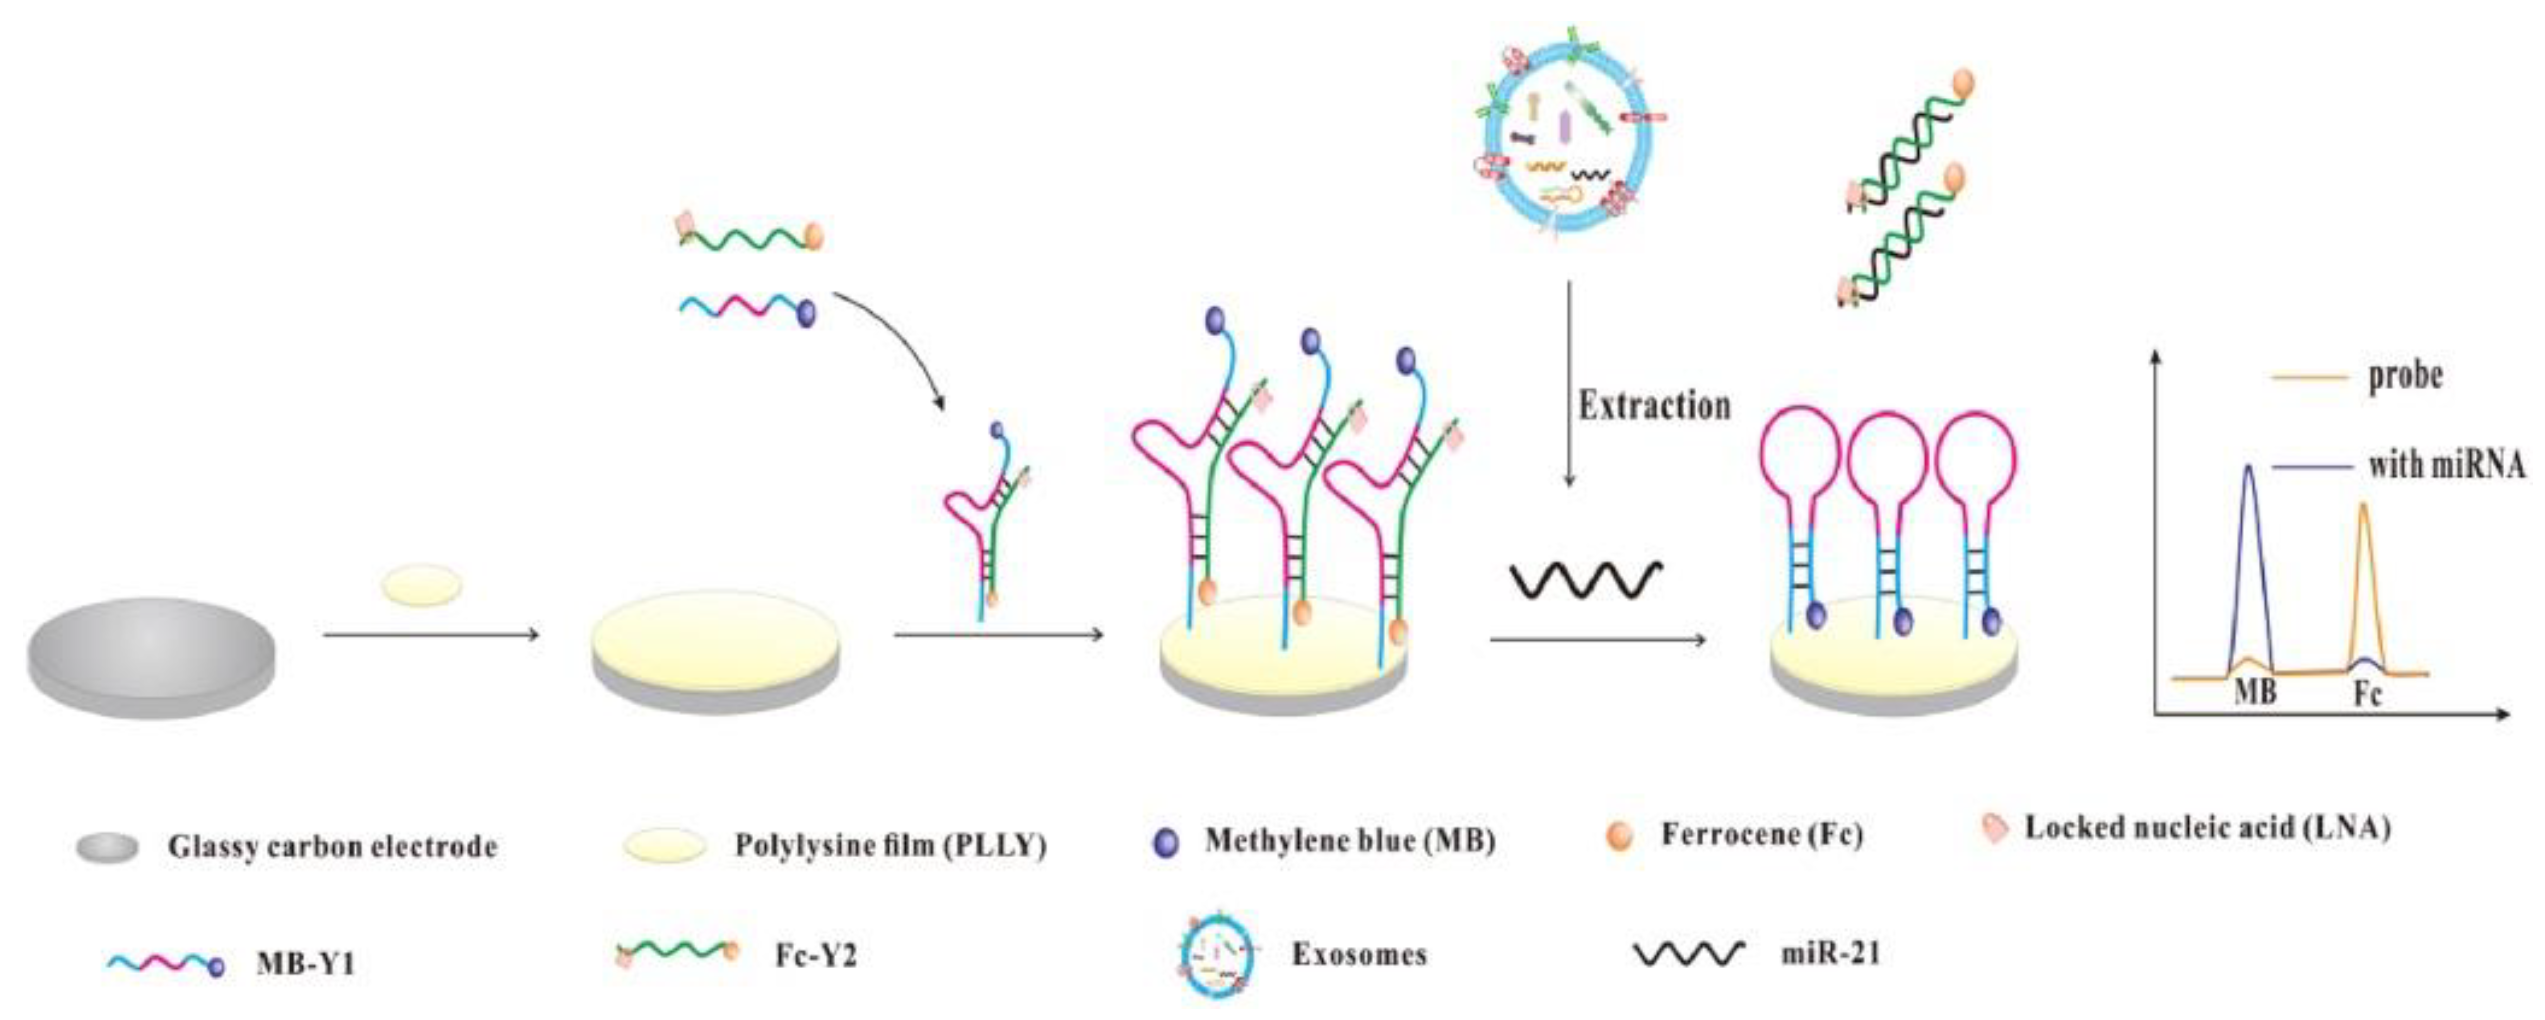
- Luo, L.; Wang, L.; Zeng, L.; Wang, Y.; Weng, Y.; Liao, Y.; Chen, T.; Xia, Y.; Zhang, J.; Chen, J. A ratiometric electrochemical DNA biosensor for detection of exosomal MicroRNA. Talanta 2020, 207, 120298. [Google Scholar] [CrossRef] [PubMed]


| Biomarker | Size/kDa | Incidence in Cancer | Level in Serum |
|---|---|---|---|
| BRCA1 | 207–220 | breast, ovarian, prostate, pancreatic | ND |
| BRCA2 | 384 | Fanconi anemia, breast, ovarian, lung, prostate, pancreatic | ND |
| CA27.29 | 250–1000 | breast | ≤37 U/mL |
| CA15-3 | 290–400 | breast | 3–30 U/mL |
| CEA | 180–200 | gastric, pancreatic, lung, breast, medullary thyroid | 2–4 ng/mL |
| HER-2 | 185 | breast, ovarian, gastric, prostate | 15 ng/mL |
| VEGF | 18–27 | brain, lung, gastrointestinal, hepatobiliary, renal, breast, ovarian | ~220 pg/mL |
| TPA | 20–45 | breast, lung, pancreatic | 109 U/L |
| CIFRA-21-1 | 40 | breast, lung, pancreatic | 50 ng/mL |
| PDGF | 35 | glioblastoma, lung, colorectal, breast, liver and ovarian | (7.5 ± 3.1) ng/mL |
| OPN | 41–75 | breast, colon, liver, lung, ovarian, prostate | 16 ng/mL |
| Target Biomarker (Biomolecule) | Bare Electrode | Electrode Modification | Detection | LR | LOD | Refs. |
|---|---|---|---|---|---|---|
| BRCA 1 | MBCPE | Fe3O4@Ag, DNA probe | EIS | 100 aM–10 nM | 30 aM | [63] |
| GCE | RGO, MWCNTs, PANHS | CV, EIS | 100 aM–10 nM | 37 aM | [64] | |
| PIK3CA gene | CPE | ssDNA/PIn6COOH/ MoS2 | CV, EIS | 100 aM–10 pM | 15 aM | [72] |
| GCE | GO, GNR | EIS | 15 fM–148 pM | 4.5 fM | [77] | |
| GCE | ZrO2-RGO | EIS | 10 fM–100 pM | 4.3 fM | [78] | |
| MUC MUC | SPCE | CNTs | CV, EIS | 0.1–2 U/mL | 0.02 U/mL | [83] |
| GCE | ferrocene-loaded polymeric micelle | CV | 1–1000 cells/mL | 10 cells/mL | [85] | |
| GCE | cDNA-Fc/MXene/Apt/Au | EIS, SWV | 1.0 pM–10 mM | 0.33 pM | [86] | |
| CA15-3 | GE | streptavidin-coated magnetic beads | CV, EIS | ND | 15 × 10−12 U/mL | [87] |
| GE | GO/Py-COOH, MWCNTs | DPV | 0.1–20 U/mL | 0.01 U/mL | [90] | |
| HER2 | ITO | APTES/MoO3@RGO | CV, DPV, EIS | 0.001–500 ng/mL | 0.001 ng/mL (~5.41 fM) | [92] |
| GCE | AuNP-ERGO-SWCNTs | EIS | 0.1 pg/mL–1 ng/mL | 50 fg/mL (~0.27 fM) | [93] | |
| SPGE | MIP | CV | 10–70 ng/mL | 1.6 ng/L (~8.65 fM) | [95] | |
| GE | GNR@Pd SSs—Apt—HRP | EIS | 10–200 ng/mL | 0.15 ng/mL (~0.81 pM) | [101] | |
| SPCE | MBs and CdSe@ZnS QDs | DPASV | 0.50–50 ng/mL | 0.29 ng/mL (~1.57 pM) | [99] | |
| CEA | GCE | aptamer/GLD/CS/ZnS-CdS/MoS2 | CV | 0.05–20 ng/mL | 0.031 ng/mL (~0.16 pM) | [106] |
| CPE | GNPs and MWCNTs. | CV, EIS | 0.4–125 ng/mL | 0.09 ng/mL (~0.45 pM) | [107] | |
| GCE | Au-AgNPs/RGO | CV | 0.001–80 ng/mL | 0.29 pg/mL (~1.45 fM) | [114] | |
| miRNA-21 and MUC1 | GCE | Au nanoflowers | ECL | 20 aM–50 pM (miRNA-21) 1 fg mL−1–10 ng mL−1 (MUC1) | 11 aM (miRNA-21) 0.4 fg/mL (~7.27 aM) (MUC1) | [119] |
| CA 27-29 | GCE | Au/MoS2/RGO | CV | 0.1–100 U/mL | 0.08 U/mL | [121] |
| uPA | FTO | GNS | DPV, CV | 1 fM–1 µM | 4.8 fM | [122] |
| tPA | GCE | SWCNTs | CV, EIS | 0.1–1.0 ng/mL | 0.026 ng/mL (~0.37 pM) | [124] |
| MCF-7/CTC | RGO/AuNPs/CuO | CV, CA | 50–7000 cells/mL | 27 cells/mL | [131] | |
| MCF-7 | GCE | Au NCs/amino-functionalized MWCNT-NH2 | CV, EIS | 100–1.0 × 10⁶ cells/mL | 80 cells/mL | [133] |
| GE | Bi2Se3@Au-mDNA | CV, EIS | 100 nM–27 μM | 10 nM | [135] | |
| GCE | Hexagonal carbon nitride tubes | Photo-current | 100–1 × 10⁵ cells/mL | 17 cells/mL | [137] | |
| GCE | TiO2 nanotubes with graphene | EIS | 1000–1 × 10⁷ cells/mL | 40 cells/mL | [138] | |
| MDA-MB-231 | GE | Non-spherical AuNPs | DPV | 10–1 × 10⁶ cells/mL | 2 cells/mL | [139] |
| Cancer stem cells | GE | AgNPs | DPV | 10–5 × 10⁵ cells/mL | 6 cells/mL | [141] |
| Exosomes Exosomal miRNA-21 | Au SPE | 11-MUA | EIS, DPV | 102–109 particles/mL | 77 particles/mL | [142] |
| SPCE | MB SiO2 NPs | DPC, EIS | 1.2 × 10³–1.2 × 10⁷ particles/μL | 1.0 × 10⁷ particles/μL | [143] | |
| m-GEC magnetic | MPs | Ampero-metry | 0–1 × 10⁶ particles/μL | 105 particles/μL | [144] | |
| GCE | Polylysine | DPV | 10–70 fM | 2.3 fM | [145] |
© 2020 by the authors. Licensee MDPI, Basel, Switzerland. This article is an open access article distributed under the terms and conditions of the Creative Commons Attribution (CC BY) license (http://creativecommons.org/licenses/by/4.0/).
Share and Cite
Gajdosova, V.; Lorencova, L.; Kasak, P.; Tkac, J. Electrochemical Nanobiosensors for Detection of Breast Cancer Biomarkers. Sensors 2020, 20, 4022. https://doi.org/10.3390/s20144022
Gajdosova V, Lorencova L, Kasak P, Tkac J. Electrochemical Nanobiosensors for Detection of Breast Cancer Biomarkers. Sensors. 2020; 20(14):4022. https://doi.org/10.3390/s20144022
Chicago/Turabian StyleGajdosova, Veronika, Lenka Lorencova, Peter Kasak, and Jan Tkac. 2020. "Electrochemical Nanobiosensors for Detection of Breast Cancer Biomarkers" Sensors 20, no. 14: 4022. https://doi.org/10.3390/s20144022
APA StyleGajdosova, V., Lorencova, L., Kasak, P., & Tkac, J. (2020). Electrochemical Nanobiosensors for Detection of Breast Cancer Biomarkers. Sensors, 20(14), 4022. https://doi.org/10.3390/s20144022