Artificial Neural Network for Atrial Fibrillation Identification in Portable Devices


 ,
, 
 ,
,  and
and 
Abstract
:1. Introduction
2. Materials and Methods
2.1. Study Datasets
2.2. ECG Processing and Feature Extraction
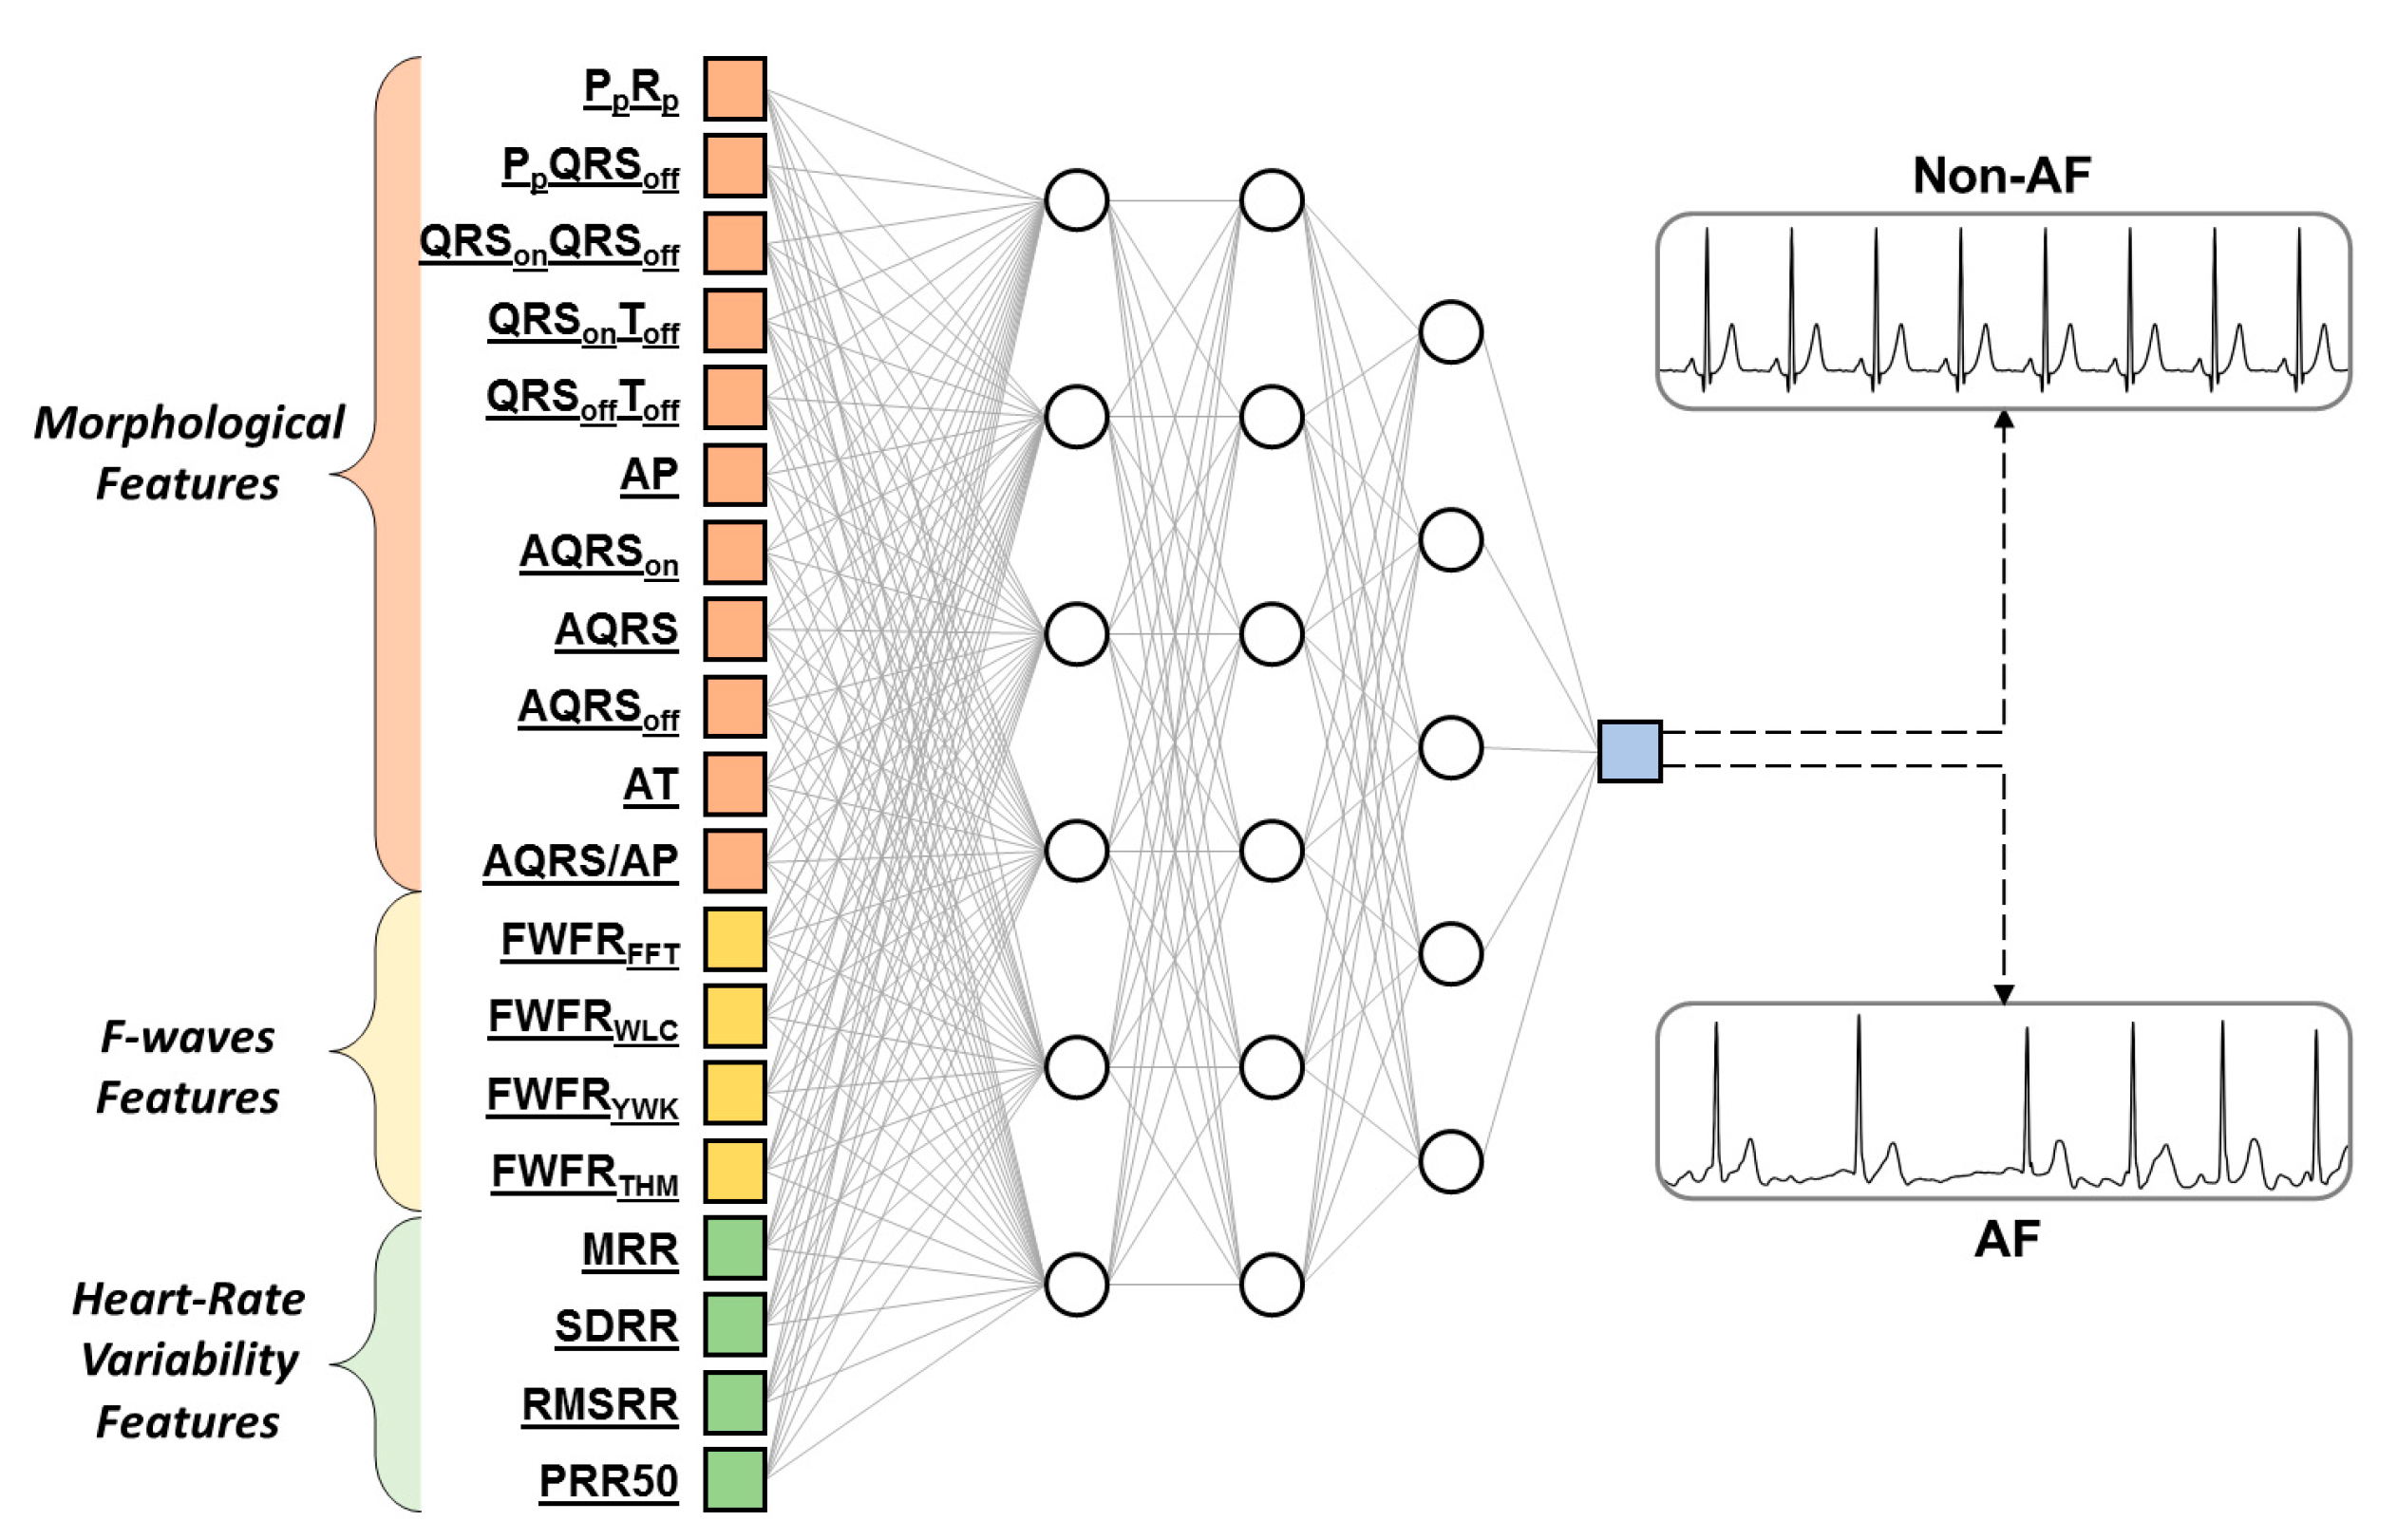
2.3. Artificial Neural Network Construction
2.4. Statistics
3. Results
4. Discussion
5. Conclusions
Author Contributions
Funding
Conflicts of Interest
References
- Jones, N.; Taylor, C.; Hobbs, F.R.; Bowman, L.; Casadei, B. Screening for atrial fibrillation: A call for evidence. Eur. Hear. J. 2019, 41, 1075–1085. [Google Scholar] [CrossRef] [PubMed]
- Lévy, S.; Breithardt, G.; Campbell, R.; Camm, A.; Daubert, J.-C.; Allessie, M.; Aliot, E.; Capucci, A.; Cosio, F.; Crijns, H.; et al. Atrial fibrillation: Current knowledge and recommendations for management *1. Eur. Hear. J. 1998, 19, 1294–1320. [Google Scholar] [CrossRef] [PubMed] [Green Version]
- Chugh, S.S.; Havmoeller, R.; Narayanan, K.; Singh, D.; Rienstra, M.; Benjamin, E.J.; Gillum, R.F.; Kim, Y.-H.; McAnulty, J.H.; Zheng, Z.-J.; et al. Worldwide epidemiology of atrial fibrillation: A Global Burden of Disease 2010 Study. Circulation 2013, 129, 837–847. [Google Scholar] [CrossRef] [PubMed] [Green Version]
- Schmitz, F.; Mohamed, S.; Punjabi, P.P. Book Review: Braunwald’s heart disease: A textbook of cardiovascular medicine. Perfusion 2018, 34, 174. [Google Scholar] [CrossRef]
- Krivoshei, L.; Weber, S.; Burkard, T.; Maseli, A.; Brasier, N.; Kühne, M.; Conen, D.; Huebner, T.; Seeck, A.; Eckstein, J. Smart detection of atrial fibrillation†. Europace 2017, 19, 753–757. [Google Scholar] [CrossRef] [PubMed] [Green Version]
- Mortelmans, C.; Van Haelst, R.; Van Der Auwera, J.; Grieten, L.; Vandervoort, P.; Vaes, B. Validation of a new smartphone application for the diagnosis of atrial fibrillation in primary care. Europace 2017, 19, 16. [Google Scholar] [CrossRef]
- Rozen, G.; Vaid, J.; Hosseini, S.M.; Kaadan, M.I.; Rafael, A.; Róka, A.; Poh, Y.; Poh, M.-Z.; Heist, E.K.; Ruskin, J.N. Diagnostic accuracy of a novel mobile phone application for the detection and monitoring of atrial fibrillation. Am. J. Cardiol. 2018, 121, 1187–1191. [Google Scholar] [CrossRef]
- Chong, J.W.; Esa, N.; McManus, D.D.; Chon, K.H. Arrhythmia discrimination using a smart phone. IEEE J. Biomed. Heal. Inf. 2015, 19, 815–824. [Google Scholar] [CrossRef]
- Lee, J.; Reyes, B.A.; McManus, D.D.; Maitas, O.; Chon, K.H.; Mathias, O. Atrial fibrillation detection using an iPhone 4S. IEEE Trans. Biomed. Eng. 2012, 60, 203–206. [Google Scholar] [CrossRef]
- Lahdenoja, O.; Pankaala, M.; Koivisto, T.; Hurnanen, T.; Iftikhar, Z.; Nieminen, S.; Knuutila, T.; Saraste, A.; Kiviniemi, T.; Vasankari, T.; et al. Atrial fibrillation detection via accelerometer and gyroscope of a smartphone. IEEE J. Biomed. Heal. Informatics 2018, 22, 108–118. [Google Scholar] [CrossRef]
- Erdenebayar, U.; Kim, H.; Park, J.-U.; Kang, D.; Lee, K.-J. Automatic prediction of atrial fibrillation based on convolutional neural network using a short-term normal electrocardiogram signal. J. Korean Med. Sci. 2019, 34, e64. [Google Scholar] [CrossRef] [PubMed]
- Yang, T.-F.; Devine, B.; Macfarlane, P.W. Artificial neural networks for the diagnosis of atrial fibrillation. Med. Boil. Eng. 1994, 32, 615–619. [Google Scholar] [CrossRef] [PubMed]
- Millán, C.A.; Girón, N.A.; López, D.M. Analysis of relevant features from photoplethysmographic signals for atrial fibrillation classification. Int. J. Environ. Res. Public Heal. 2020, 17, 498. [Google Scholar] [CrossRef] [PubMed] [Green Version]
- Nicolet, J.J.; Restrepo, J.F.; Schlotthauer, G. Classification of intracavitary electrograms in atrial fibrillation using information and complexity measures. Biomed. Signal. Process. Control. 2020, 57, 101753. [Google Scholar] [CrossRef]
- Wang, J. A deep learning approach for atrial fibrillation signals classification based on convolutional and modified Elman neural network. Futur. Gener. Comput. Syst. 2020, 102, 670–679. [Google Scholar] [CrossRef]
- Ghosh, S.K.; Tripathy, R.K.; Paternina, M.R.A.; Arrieta, J.J.; Zamora-Mendez, A.; Naik, G. Detection of atrial fibrillation from single lead ECG signal using multirate cosine filter bank and deep neural network. J. Med. Syst. 2020, 44, 114–115. [Google Scholar] [CrossRef]
- Athif, M.; Yasawardene, P.C.; Daluwatte, C. Detecting atrial fibrillation from short single lead ECGs using statistical and morphological features. Physiol. Meas. 2018, 39, 064002. [Google Scholar] [CrossRef]
- Artis, S.; Mark, R.; Moody, G. Detection of atrial fibrillation using artificial neural networks. In Proceedings of the Computers in Cardiology, Venice, Italy, 23–26 September 1991. [Google Scholar] [CrossRef]
- Clifford, G.D.; Liu, C.; Moody, B.; Lehman, L.-W.; Silva, I.; Li, Q.; Johnson, A.; Mark, R.G. AF Classification from a Short Single Lead ECG Recording: The Physionet Computing in Cardiology Challenge 2017. In Proceedings of the 2017 Computing in Cardiology Conference (CinC), Rennes, France, 24–27 September 2017. [Google Scholar]
- Kandala, R.N.V.P.S.; Dhuli, R.; Pławiak, P.; Naik, G.; Moeinzadeh, H.; Gargiulo, G.D.; Gunnam, S. Towards Real-Time Heartbeat Classification: Evaluation of Nonlinear Morphological Features and Voting Method. Sensors 2019, 19, 5079. [Google Scholar] [CrossRef] [Green Version]
- Sbrollini, A.; De Jongh, M.C.; Ter Haar, C.C.; Treskes, R.W.; Man, S.; Burattini, L.; Swenne, C.A. Serial electrocardiography to detect newly emerging or aggravating cardiac pathology: A deep-learning approach. Biomed. Eng. Online 2019, 18, 15. [Google Scholar] [CrossRef] [Green Version]
- Goldberger, A.L.; Amaral, L.A.N.; Glass, L.; Hausdorff, J.M.; Ivanov, P.C.; Mark, R.G.; Mietus, J.E.; Moody, G.B.; Peng, C.-K.; Stanley, H.E. PhysioBank, PhysioToolkit, and PhysioNet. Circulation 2000, 101, e215–e220. [Google Scholar] [CrossRef] [Green Version]
- Pan, J.; Tompkins, W.J. A real-time QRS detection algorithm. IEEE Trans. Biomed. Eng. 1985, 32, 230–236. [Google Scholar] [CrossRef] [PubMed]
- Rundo, F.; Conoci, S.; Ortis, A.; Battiato, S. An advanced bio-inspired photoplethysmography (PPG) and ECG pattern recognition system for medical assessment. Sensors 2017, 18, 405. [Google Scholar] [CrossRef] [PubMed] [Green Version]
- Badilini, F.; Moss, A.; Titlebaum, E. Cubic spline baseline estimation in ambulatory ECG recordings for the measurement of ST segment displacements. In Proceedings of the Annual International Conference of the IEEE Engineering in Medicine and Biology Society, Orlando, FL, USA, 31 October–3 November 1991; pp. 584–585. [Google Scholar] [CrossRef]
- Agostinelli, A.; Sbrollini, A.; Giuliani, C.; Fioretti, S.; Di Nardo, F.; Burattini, L. Segmented beat modulation method for electrocardiogram estimation from noisy recordings. Med. Eng. Phys. 2016, 38, 560–568. [Google Scholar] [CrossRef]
- Sbrollini, A.; Cicchetti, K.; De Martinis, A.; Marcantoni, I.; Morettini, M.; Burattini, L. Automatic identification of atrial fibrillation by spectral analysis of fibrillatory waves. In Proceedings of the 2018 Computing in Cardiology Conference (CinC), Maastricht, The Netherlands, 23–26 September 2018. [Google Scholar] [CrossRef]
- Bettoni, M.; Zimmermann, M. Autonomic tone variations before the onset of paroxysmal atrial fibrillation. Circulation 2002, 105, 2753–2759. [Google Scholar] [CrossRef] [Green Version]
- Møller, M.F. A scaled conjugate gradient algorithm for fast supervised learning. Neural Networks 1993, 6, 525–533. [Google Scholar] [CrossRef]
- Prechelt, L. Early stopping — but when? In Neural Networks: Tricks of the Trade; Montavon, G., Orr, G.B., Müller, K.-R., Eds.; Springer: Berlin, Germany, 2012; pp. 53–67. [Google Scholar] [CrossRef]
- King, G.; Zeng, L.; Tomz, M. Logistic Regression in rare events data. J. Stat. Softw. 2003, 8, 137–163. [Google Scholar] [CrossRef]
- Sbrollini, A.; De Jongh, M.; Ter Haar, C.C.; Treskes, R.W.; Man, S.; Burattini, L.; Swenne, C.A. Serial ECG analysis: Absolute rather than signed changes in the spatial QRS-T angle should be used to detect emerging cardiac pathology. In Proceedings of the 2018 Computing in Cardiology Conference (CinC), Maastricht, The Netherlands, 23–26 September 2018. [Google Scholar] [CrossRef]
- Murat, F.; Yildirim, O.; Talo, M.; Baloglu, U.B.; Demir, Y.; Acharya, U.R. Application of deep learning techniques for heartbeats detection using ECG signals-analysis and review. Comput. Boil. Med. 2020, 120, 103726. [Google Scholar] [CrossRef]
- Liu, M.; Kim, Y. Classification of heart diseases based on ECG signals using long short-term memory. In Proceedings of the 2018 40th Annual International Conference of the IEEE Engineering in Medicine and Biology Society (EMBC), Honolulu, HI, USA, 18–21 July 2018; pp. 2707–2710. [Google Scholar] [CrossRef]
- Li, C.K.; White, F.A.; Tipoe, T.; Liu, T.; Wong, M.C.; Jesuthasan, A.; Baranchuk, A.; Tse, G.; Yan, B.P.; Borges, L.; et al. The current state of mobile phone apps for monitoring heart rate, heart rate variability, and atrial fibrillation: Narrative review. JMIR mHealth uHealth 2019, 7, e11606. [Google Scholar] [CrossRef]

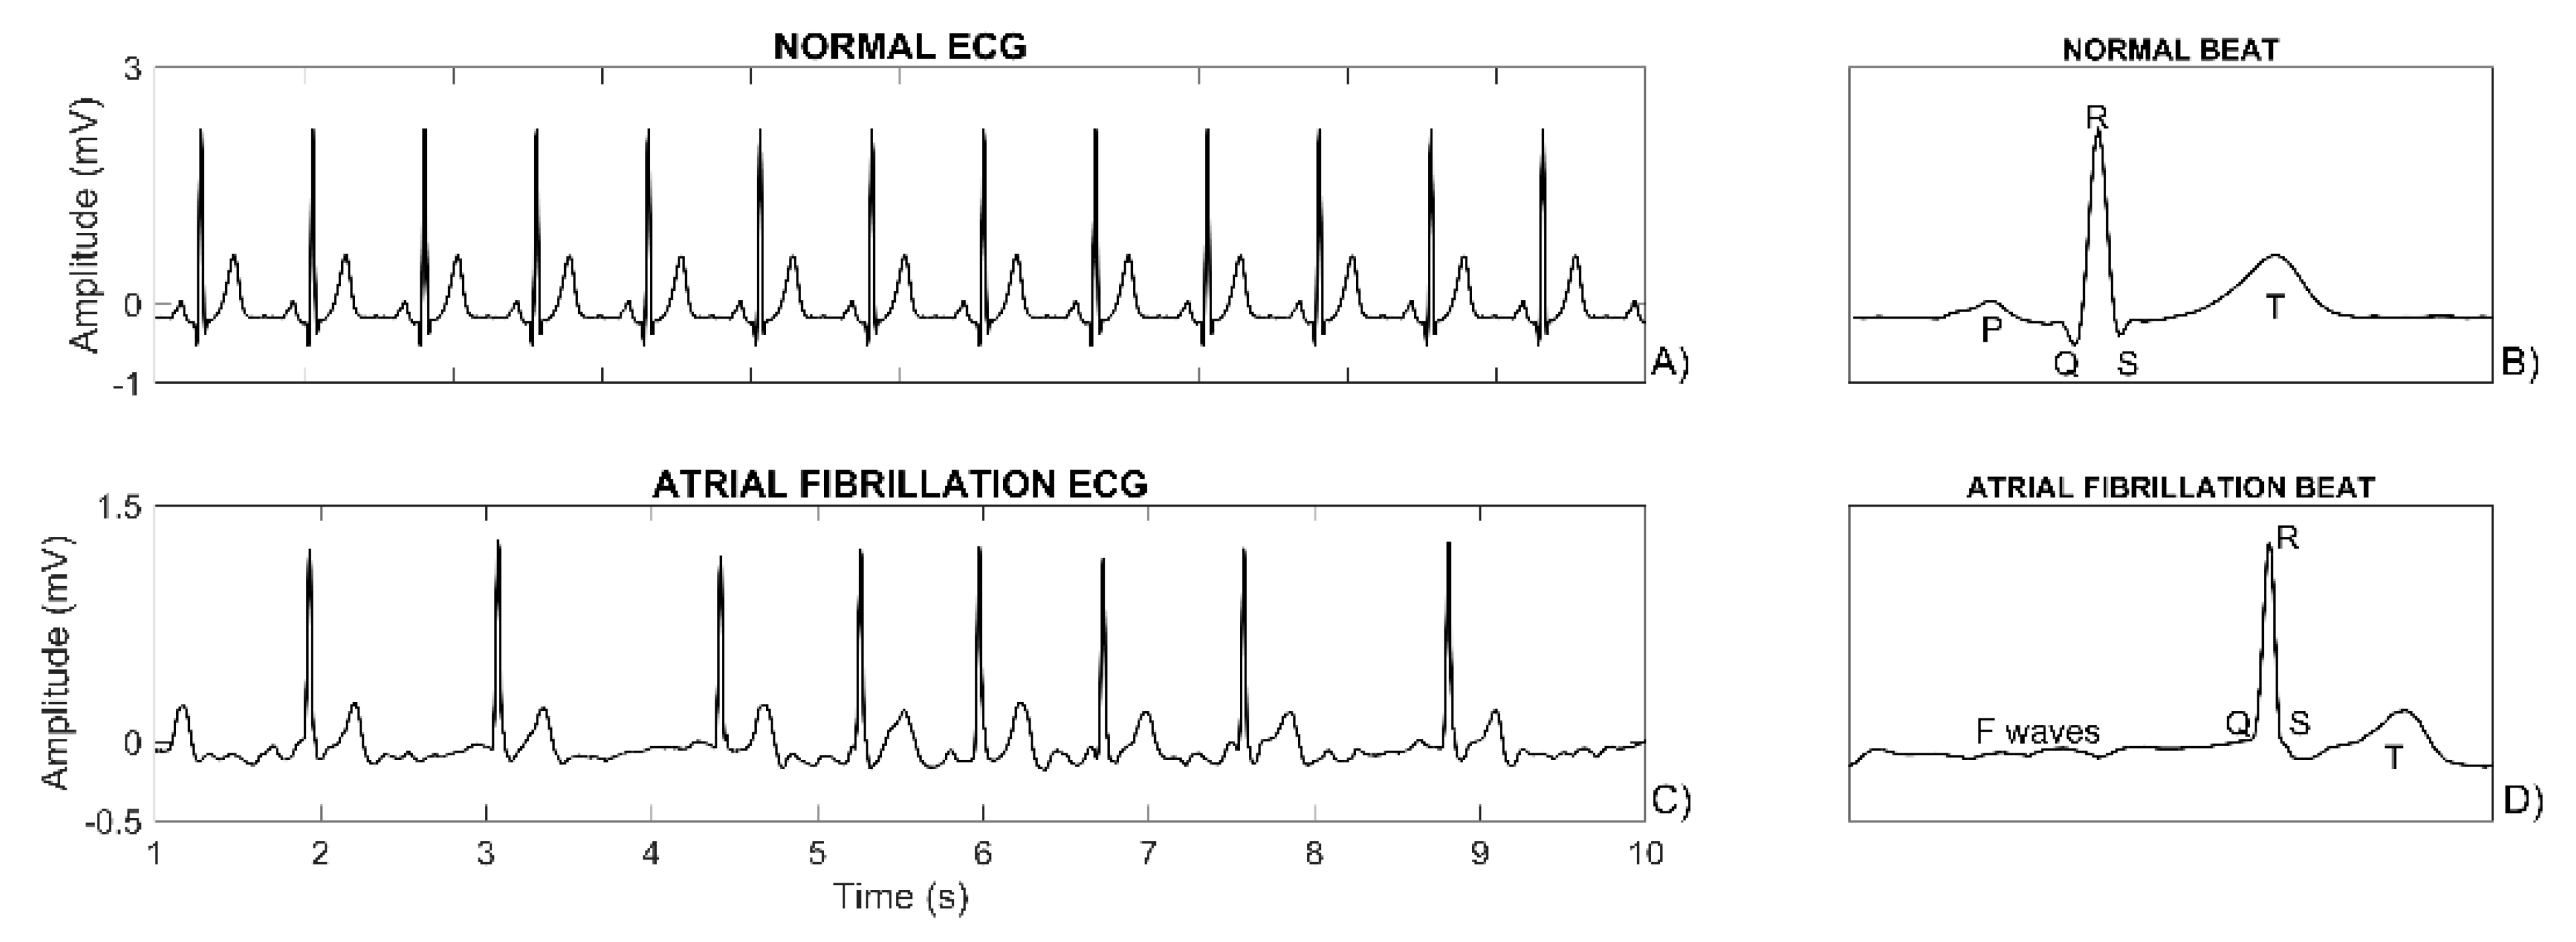
| Feature Type | Feature Name | Feature Unit | Feature Description |
|---|---|---|---|
| Morphology | PpRp | ms | time interval between PP and RP |
| PpQRSoff | ms | time interval between PP and QRSoff | |
| QRSonQRSoff | ms | time interval between QRSon and QRSoff | |
| QRSonToff | ms | time interval between QRSon and Toff | |
| QRSoffToff | ms | time interval between QRSoff and Toff | |
| AP | µV | amplitude of the MECGB at PP | |
| AQRSon | µV | amplitude of the MECGB at QRSon | |
| AQRS | µV | max-min of MECGB amplitude between QRSon and QRSoff | |
| AQRSoff | µV | amplitude of the MECGB at QRSoff | |
| AT | µV | amplitude of the MECGB at TP | |
| AQRS/AP | dimensionless | ratio between AQRS and AP | |
| Fwaves | FWFRFFT | % | Fast Fourier Transform spectral ratio |
| FWFRWLC | % | Welch’s method spectral ratio | |
| FWFRYWK | % | Yule-Walker’s method spectral ratio | |
| FWFRTHM | % | Thomson’s method spectral ratio | |
| Heart-rate variability | MRR | ms | mean RR interval |
| SDRR | ms | RR-interval standard deviation | |
| RMSRR | ms | Root mean square of RR interval | |
| PRR50 | % | % of RR > previous RR of more than 50 ms |
| ALL | TRAINING DATASET | VALIDATION DATASET | TESTING DATASET | |
|---|---|---|---|---|
| AF | 707 | 395 | 99 | 213 |
| Non-AF | 7321 | 4098 | 1026 | 2197 |
| TOTAL | 8028 | 4493 | 1125 | 2410 |
| ALL DATA | TRAINING | VALIDATION | TESTING | ||||||
|---|---|---|---|---|---|---|---|---|---|
| DATASET | DATASET | DATASET | |||||||
| AF | Non-AF | AF | Non-AF | AF | Non-AF | AF | Non-AF | ||
| Morphological Features | PpRp | 207 * | 150 | 203 * | 150 | 197 * | 150 | 220 * | 150 |
| (ms) | [161;243] | [130;183] | [157;240] | [130;180] | [153;237] | [130;187] | [183;247] | [130;183] | |
| PpQRSoff | 257 * | 200 | 250 * | 200 | 250 * | 200 | 267 * | 200 | |
| (ms) | [210;287] | [177;233] | [203;287] | [177;233] | [203;286] | [177;240] | [227;293] | [179;233] | |
| QRSonQRSoff | 103 | 103 | 100 | 103 | 103 | 103 | 103 | 103 | |
| (ms) | [93;113] | [93;113] | [93;113] | [93;113] | [90;113] | [93;113] | [93;113] | [93;113] | |
| QRSonToff | 333 * | 386 | 330 * | 387 | 337 * | 383 | 333 * | 383 | |
| (ms) | [261;387] | [320;427] | [260;383] | [323;427] | [276;399] | [313;423] | [259;407] | [317;427] | |
| QRSoffToff | 230 * | 283 | 223 * | 287 | 240 * | 280 | 230 * | 283 | |
| (ms) | [157;283] | [217;320] | [150;277] | [220;320] | [178;290] | [213;320] | [153;301] | [213;320] | |
| AP | 12 * | 52 | 13 * | 52 | 12 * | 49 | −10 * | 55 | |
| (µV) | [−25;34] | [−34;82] | [−25;37] | [−37;82] | [−26;38] | [−36;80] | [−24;26] | [−27;83] | |
| AQRSon | 0 * | −5 | 0 * | −5 | 0 * | −4 | 1 * | −4 | |
| (µV) | [−7;7] | [−17;4] | [−8;6] | [−18;4] | [−5;7] | [−16;4] | [−5;9] | [−17;4] | |
| AQRS | 852 * | 895 | 852 | 894 | 873 | 873 | 836 * | 905 | |
| (µV) | [637;1075] | [651;1158] | [664;1075] | [646;1533] | [615;1092] | [636;1140] | [631;1062] | [670;1175] | |
| AQRSoff | −27 | −24 | −29 * | −22 | −16 | −22 | −28 | −28 | |
| (µV) | [−73;9] | [−64;13] | [−75;8] | [−63;13] | [−55;16] | [−62;15] | [−76;9] | [−67;11] | |
| AT | 185 * | 246 | 180 * | 248 | 195 * | 236 | 188 * | 247 | |
| (µV) | [109;259] | [165;332] | [109;253] | [167;334] | [127;253] | [156;319] | [105;269] | [167;336] | |
| AQRS/AP | −3 * | 9 | −1 * | 9 | −3 * | 9 | −7 * | 9 | |
| (dimension-less) | [−24;20] | [−1;13] | [−24;19] | [−2;13] | [−26;15] | [−1;13] | [−23;23] | [−1;14] | |
| F-Waves Features | FWFRFFT | 24 * | 14 | 23 * | 14 | 25 * | 14 | 23 * | 15 |
| (%) | [16;31] | [9;21] | [16;30] | [9;21] | [16;31] | [9;21] | [16;31] | [10;21] | |
| FWFRWLC | 25 * | 14 | 25 * | 14 | 25 * | 14 | 24 * | 15 | |
| (%) | [17;32] | [9;21] | [17;32] | [9;21] | [16;32] | [10;22] | [17;32] | [10;21] | |
| FWFRYWK | 35 * | 23 | 35 * | 23 | 37 * | 22 | 34 * | 23 | |
| (%) | [25;45] | [17;31] | [26;45] | [17;31] | [25;44] | [16;31] | [24;43] | [17;31] | |
| FWFRTHM | 24 * | 14 | 24 * | 14 | 25 * | 14 | 23 * | 14 | |
| (%) | [16;31] | [9;21] | [16;32] | [9;21] | [16;31] | [9;21] | [16;31] | [10;21] | |
| HRV Features | MRR | 712 * | 864 | 692 * | 862 | 717 * | 869 | 755 * | 863 |
| (ms) | [580;860] | [758;976] | [565;835] | [760;979] | [577;878] | [751;980] | [616;902] | [758;970] | |
| SDRR | 157 * | 57 | 155 * | 58 | 157 * | 58 | 163 * | 54 | |
| (ms) | [104;224] | [24;134] | [101;208] | [25;136] | [101;227] | [24;133] | [112;242] | [22;129] | |
| RMSRR | 218 * | 57 | 215 * | 59 | 223 * | 56 | 223 * | 52 | |
| (ms) | [144;309] | [19;172] | [138;299] | [20;174] | [142;319] | [19;170] | [159;320] | [18;167] | |
| PRR50 | 92 * | 67 | 93 * | 67 | 93 * | 67 | 93 * | 67 | |
| (%) | [90;94] | [0;83] | [90;94] | [0;83] | [90;94] | [0;83] | [89;94] | [0;80] | |
| Reference | Data acquisition | Confounders | Input | Classifier | AUC | Se | Sp |
|---|---|---|---|---|---|---|---|
| [5] | Portable devices (iPhone 4S); 120 PPGs | Not considered | HRV features | Statistical comparison | 93.1 | 95.0 | 95.0 |
| [6] | Portable devices; 242 PPGs | Not considered | HRV features | Statistical comparison | Not reported | 98.0 | 88.0 |
| [7] | Portable devices (iPhone); 97 PPGs | Not considered | HRV features | Statistical comparison | Not reported | 93.1 | 90.1 |
| [8] | Portable devices (iPhone); 88 PPGs | Not considered | HRV features | Statistical comparison | Not reported | 66.6 | 78.9 |
| [9] | Portable devices (iPhone 4S); 25 PPGs | Not considered | HRV features | Statistical comparison | Not reported | 97.6 | 99.6 |
| [10] | Portable devices (Sony Xperia); 16 PPGs | Noise | HRV features | SVM | Not reported | 93.8 | 100 |
| [11] | Holter ECG recorders; 139 ECGs | Not considered | ECG time sequence | CNN | Not reported | 99.2 | 98.7 |
| [12] | ECG recorders; 2363 ECGs | Other abnormal rhythms | Morphological and HRV features | ANN | Not reported | 89.9 | 92.8 |
| [13] | Holter ECG recorders; 1656 ECGs | Not considered | HRV features | XGB | 98.9 | 98.4 | 99.5 |
| [14] | Atrial ECG recorder; 113 ECGs | Not considered | HRV features | SVM | Not reported | 99.9 | 96.6 |
| [15] | Holter ECG recorders; 23 ECGs | Not considered | ECG time sequence | CNN + MENN | Not reported | 97.9 | 97.1 |
| [16] | ECG recorders; 47 ECGs | Other abnormal rhythms | ECG time sequence | HELM | Not reported | 98.77 | 100 |
| [17] | Portable Devices (KARDIA by AliveCor); 8244 ECGs | Other abnormal rhythms and noise | Morphological and HRV features | SVM | Not reported | 77.5 | 97.9 |
| [18] | ECG recorders; 12 ECGs | Other abnormal rhythms | HRV features | ANN | Not reported | 84.9 | 75.4 |
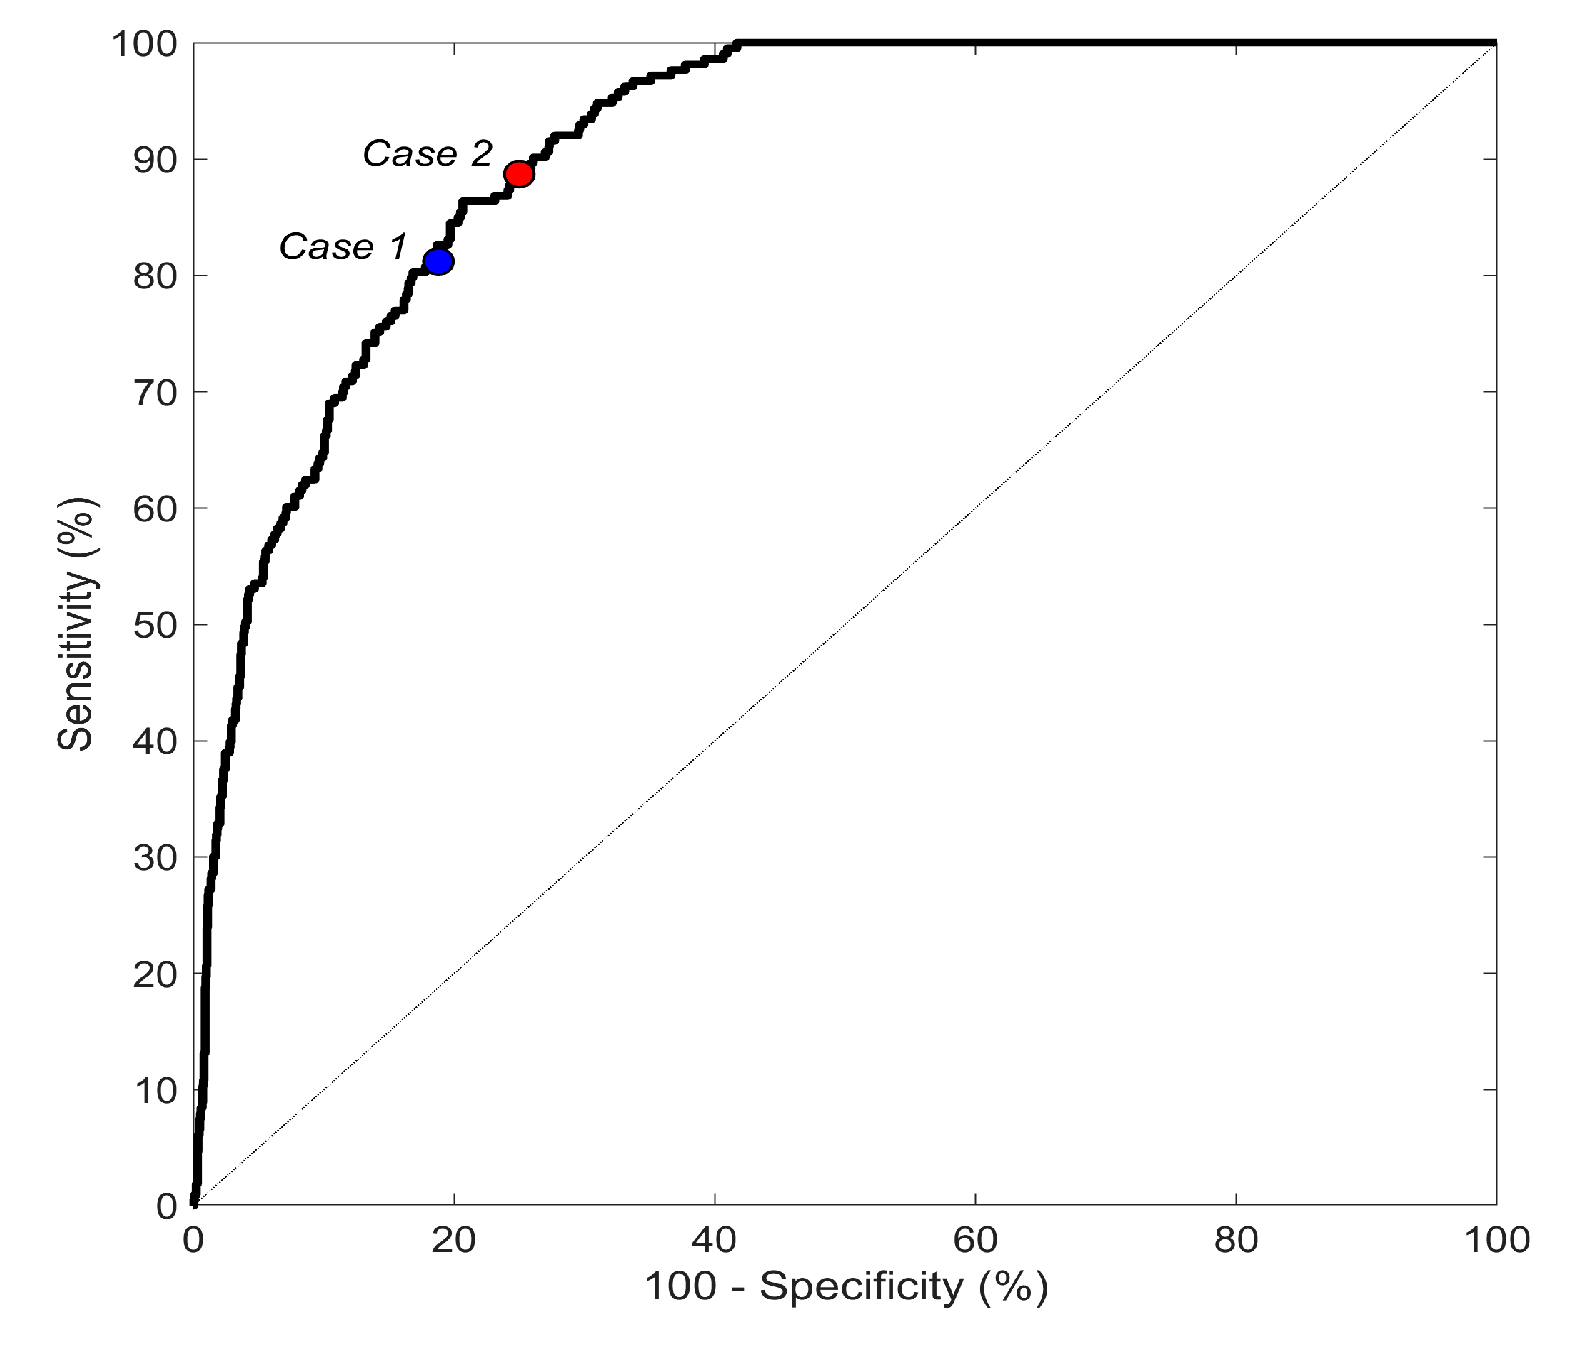
| This work | Portable Devices (KARDIA by AliveCor); 8244 ECGs | Other abnormal rhythms and noise | Morphological, F-waves and HRV features | ANN | 90.8 | Case1: 81.2 Case2: 88.7 | Case1: 81.2 Case2: 75.0 |
© 2020 by the authors. Licensee MDPI, Basel, Switzerland. This article is an open access article distributed under the terms and conditions of the Creative Commons Attribution (CC BY) license (http://creativecommons.org/licenses/by/4.0/).
Share and Cite
Marinucci, D.; Sbrollini, A.; Marcantoni, I.; Morettini, M.; Swenne, C.A.; Burattini, L. Artificial Neural Network for Atrial Fibrillation Identification in Portable Devices. Sensors 2020, 20, 3570. https://doi.org/10.3390/s20123570
Marinucci D, Sbrollini A, Marcantoni I, Morettini M, Swenne CA, Burattini L. Artificial Neural Network for Atrial Fibrillation Identification in Portable Devices. Sensors. 2020; 20(12):3570. https://doi.org/10.3390/s20123570
Chicago/Turabian StyleMarinucci, Daniele, Agnese Sbrollini, Ilaria Marcantoni, Micaela Morettini, Cees A. Swenne, and Laura Burattini. 2020. "Artificial Neural Network for Atrial Fibrillation Identification in Portable Devices" Sensors 20, no. 12: 3570. https://doi.org/10.3390/s20123570
APA StyleMarinucci, D., Sbrollini, A., Marcantoni, I., Morettini, M., Swenne, C. A., & Burattini, L. (2020). Artificial Neural Network for Atrial Fibrillation Identification in Portable Devices. Sensors, 20(12), 3570. https://doi.org/10.3390/s20123570