A Novel Analog Front End with Voltage-Dependent Input Impedance and Bandpass Amplification for Capacitive Biopotential Measurements


Abstract
1. Introduction
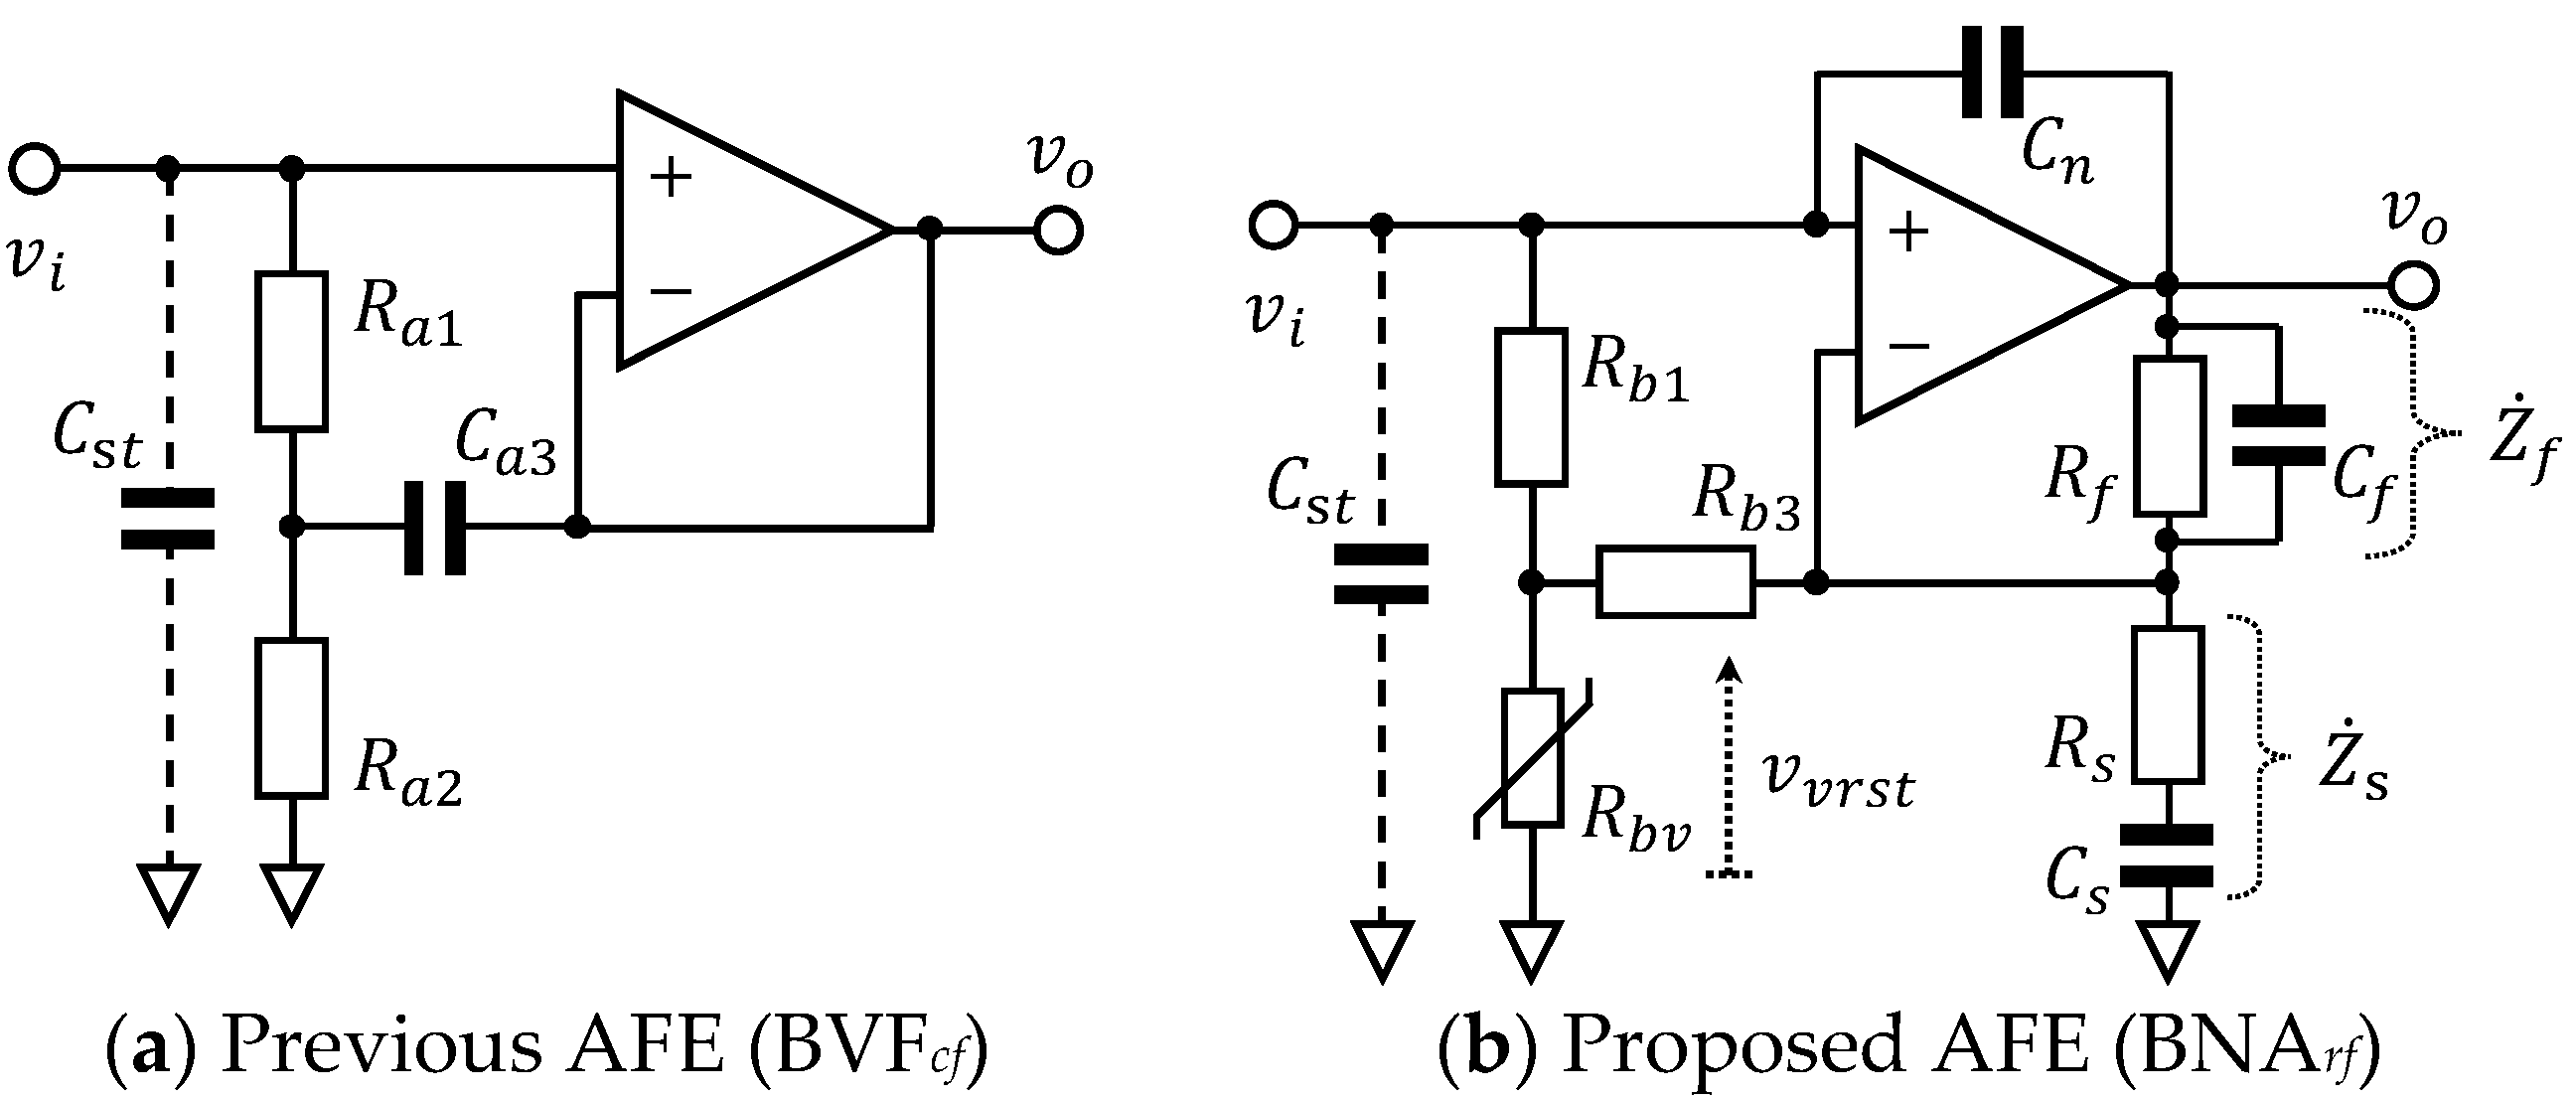
2. Previous and Proposed Analog Front End
3. Experimental and Analytical Methods
3.1. Implementation of Previous and Proposed AFEs for Evaluation
3.2. Measurements of cECG through Thick Clothing in a Low-Humidity Environment
3.3. Analysis of cECG Signals for Evaluation
3.4. Measurements of cEMG in a Low-Humidity Environment
3.5. Analysis of cEMG Signals for Evaluation
4. Results
4.1. cECG Measurements through Thick Clothing in a Low-Humidity Environment
4.2. Evaluation of cECG Signals
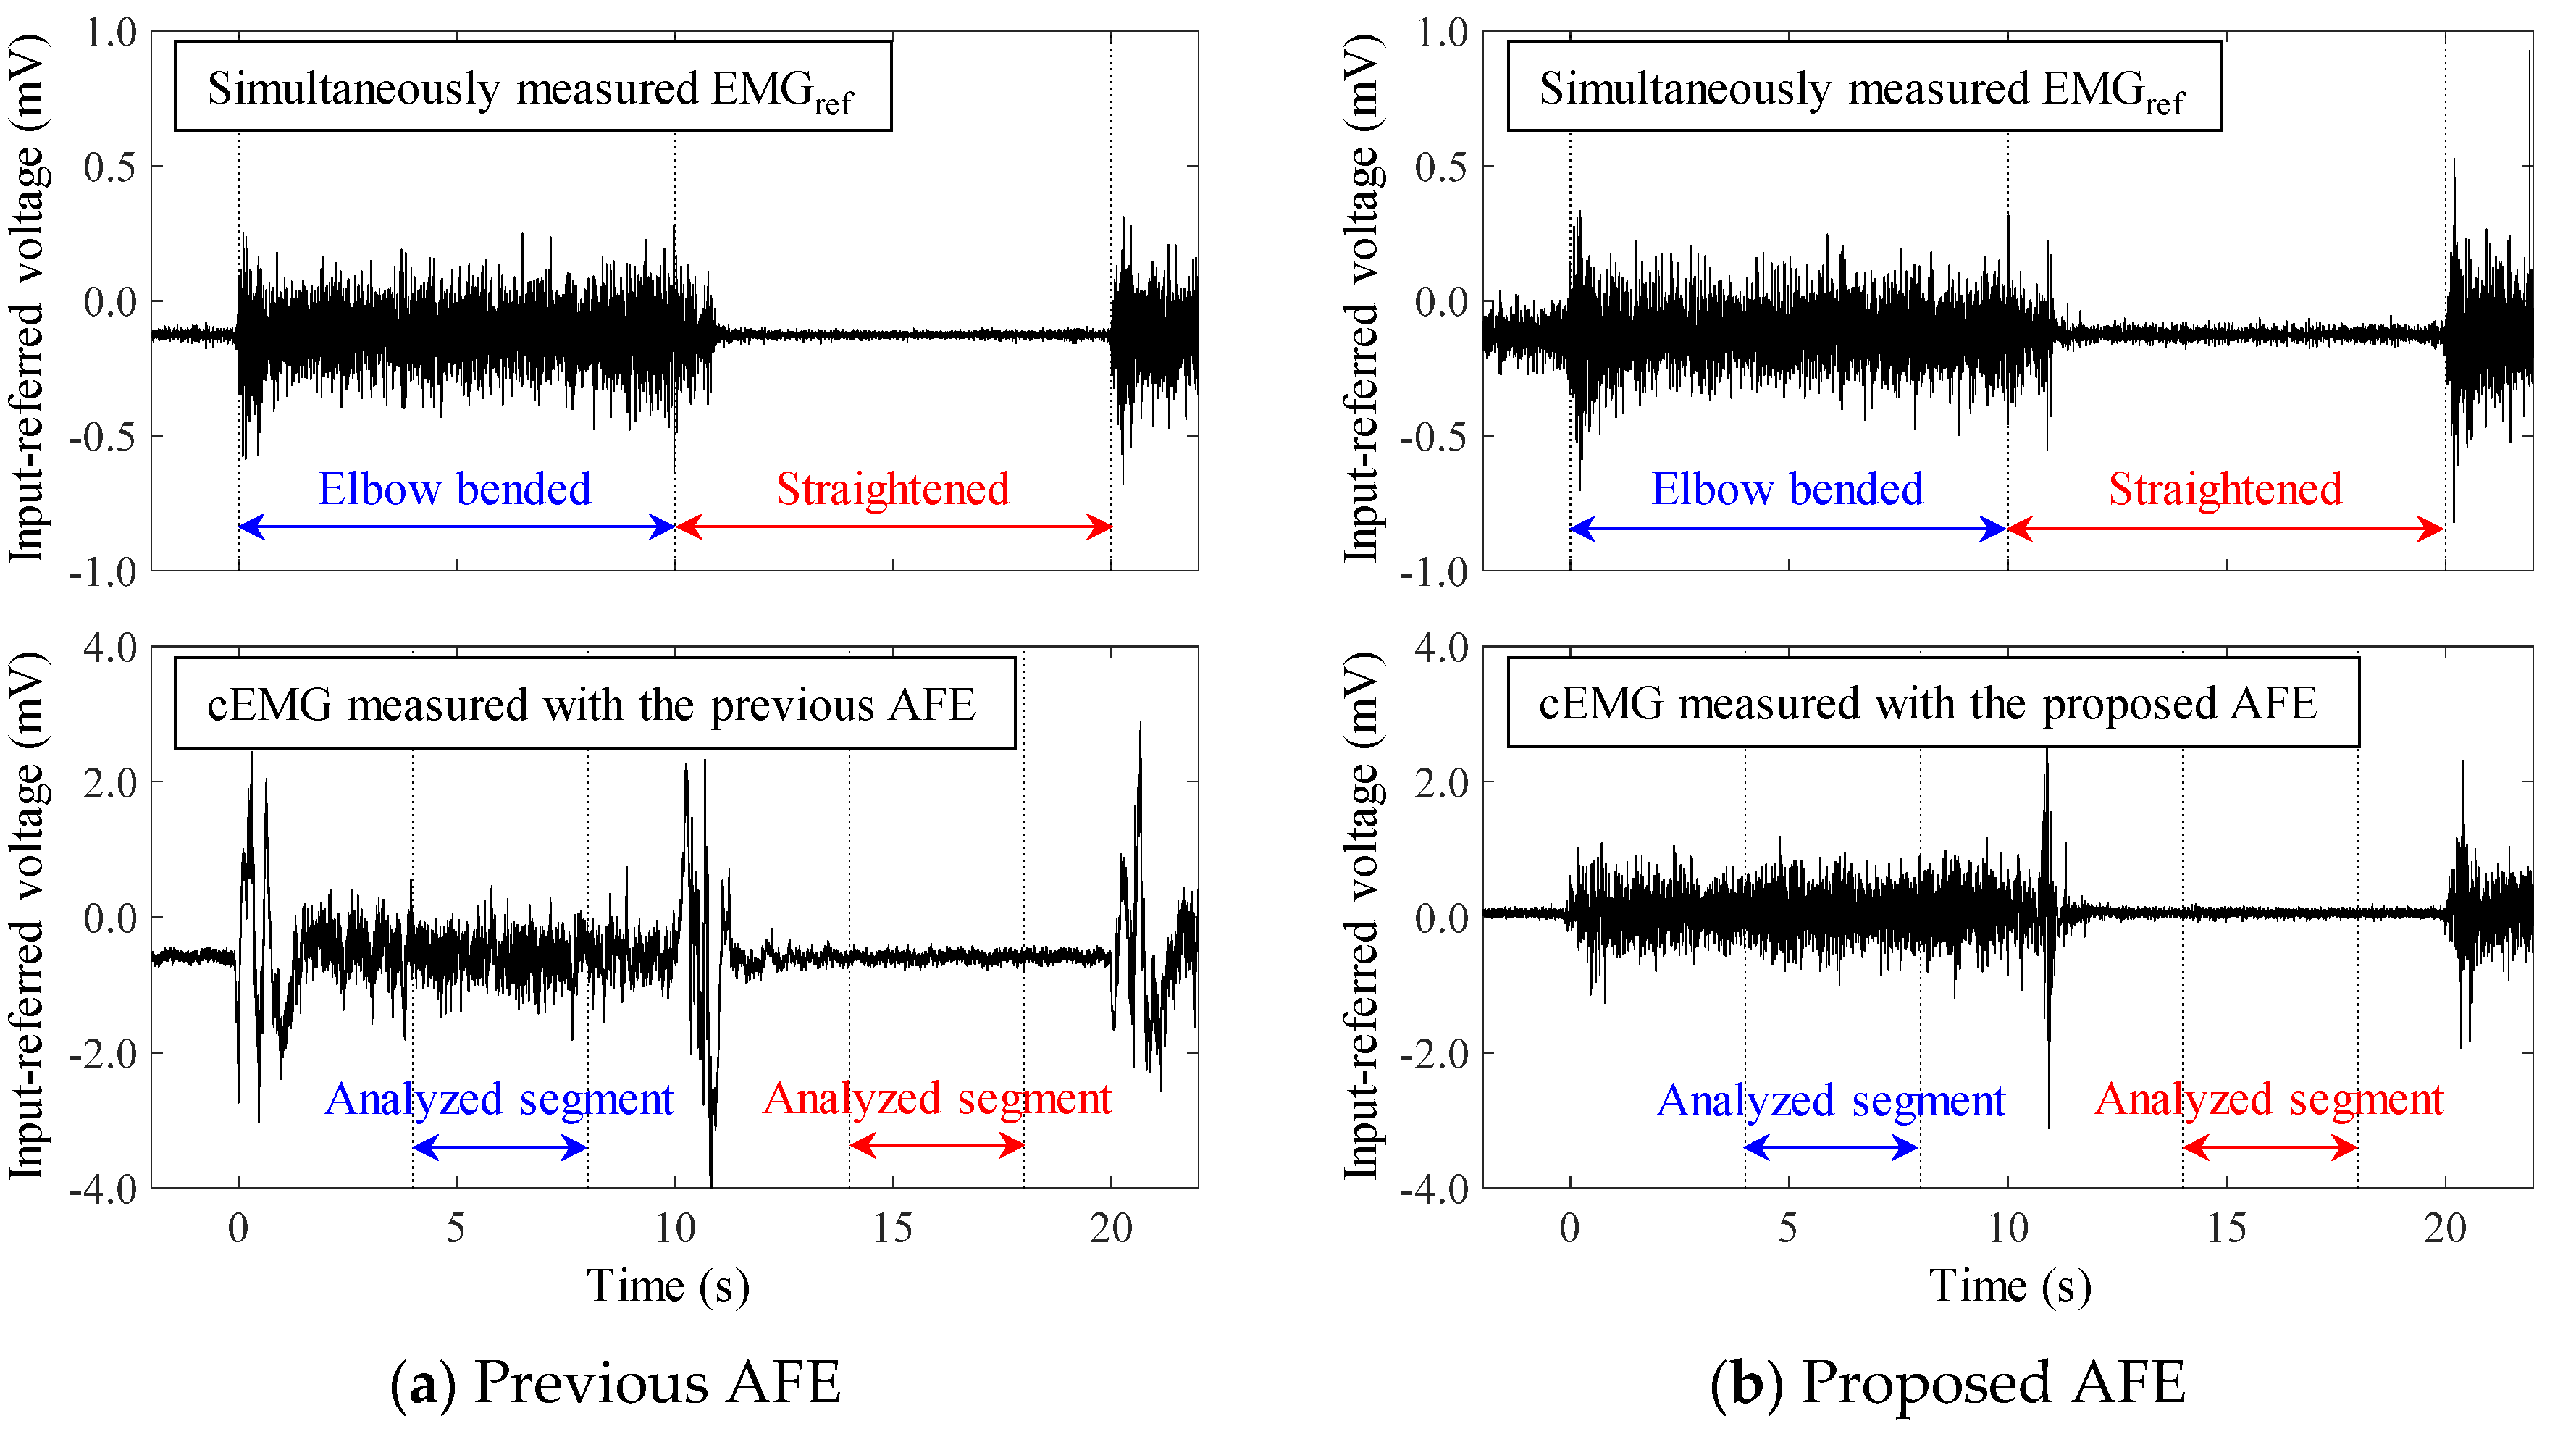
4.3. Measurements of cEMG in a Low-Humidity Environment
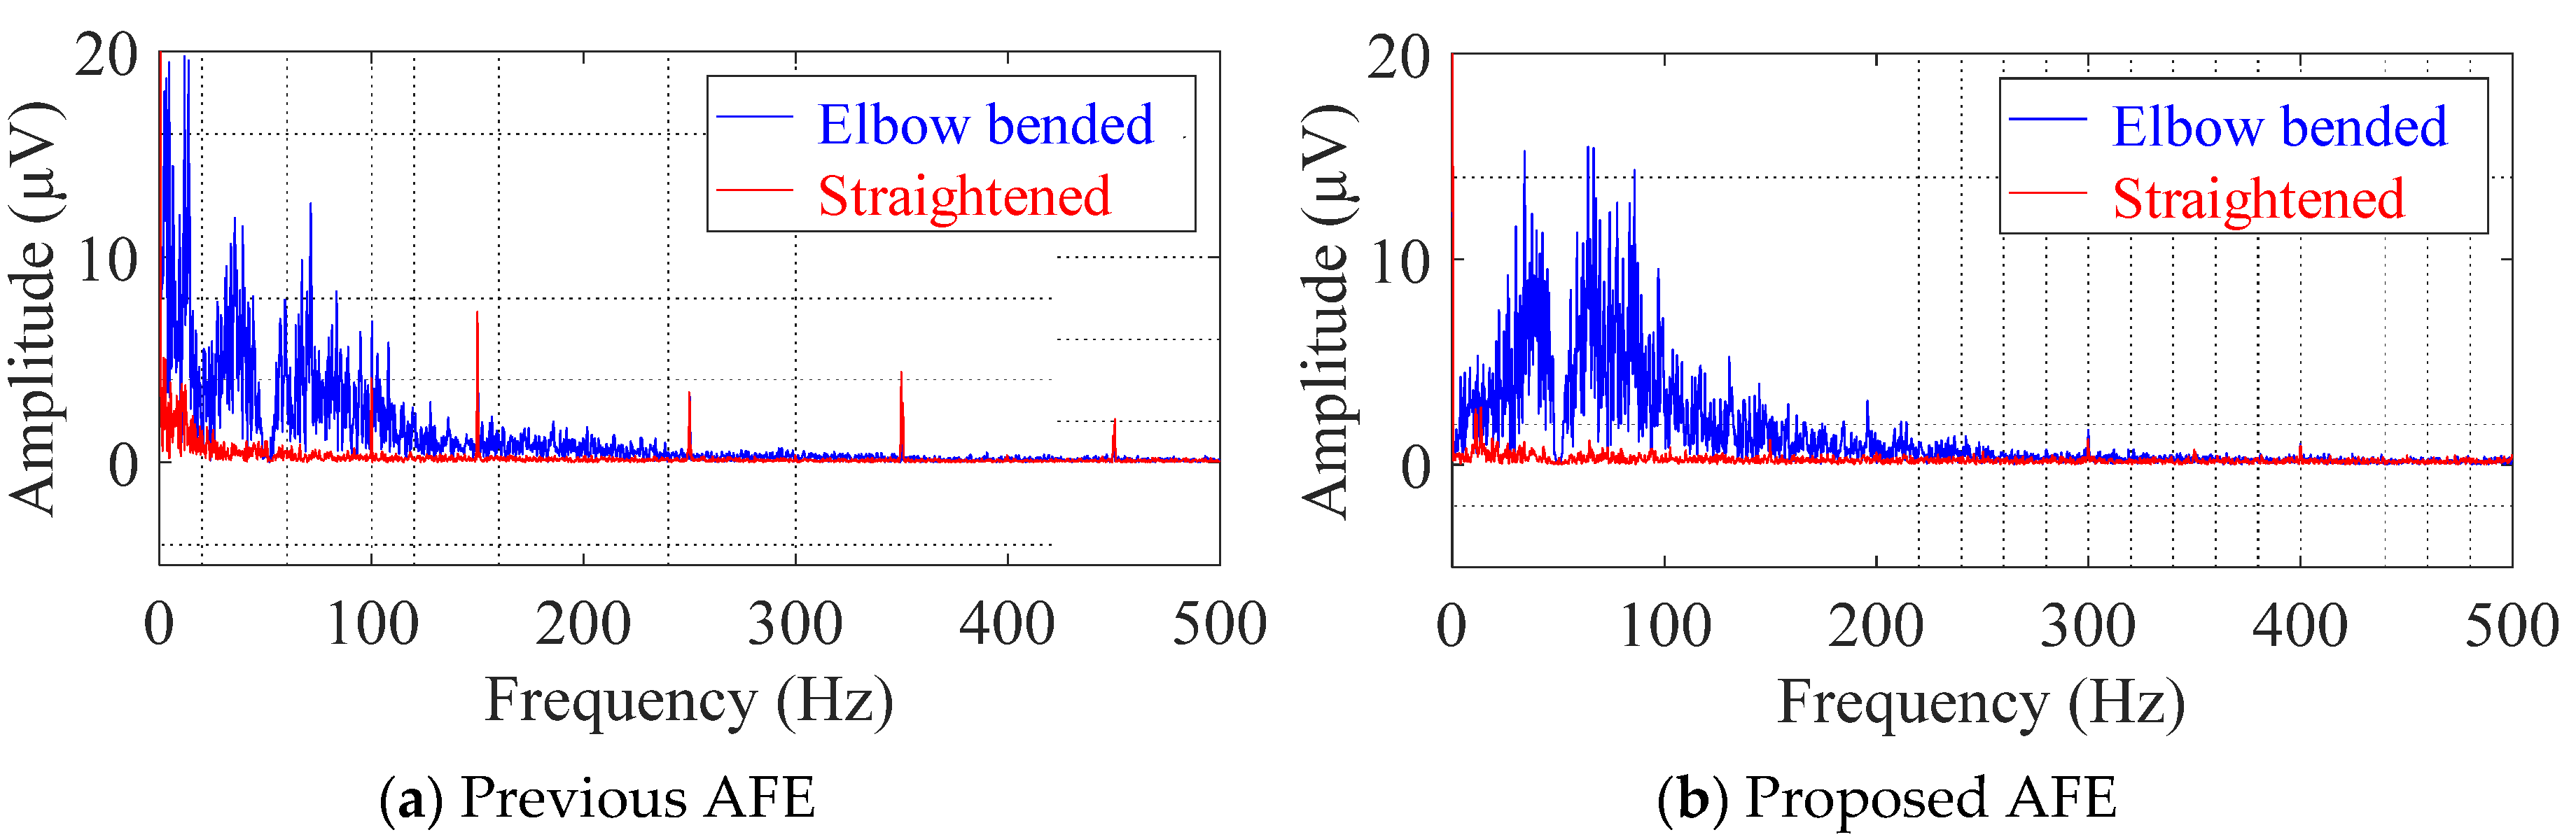
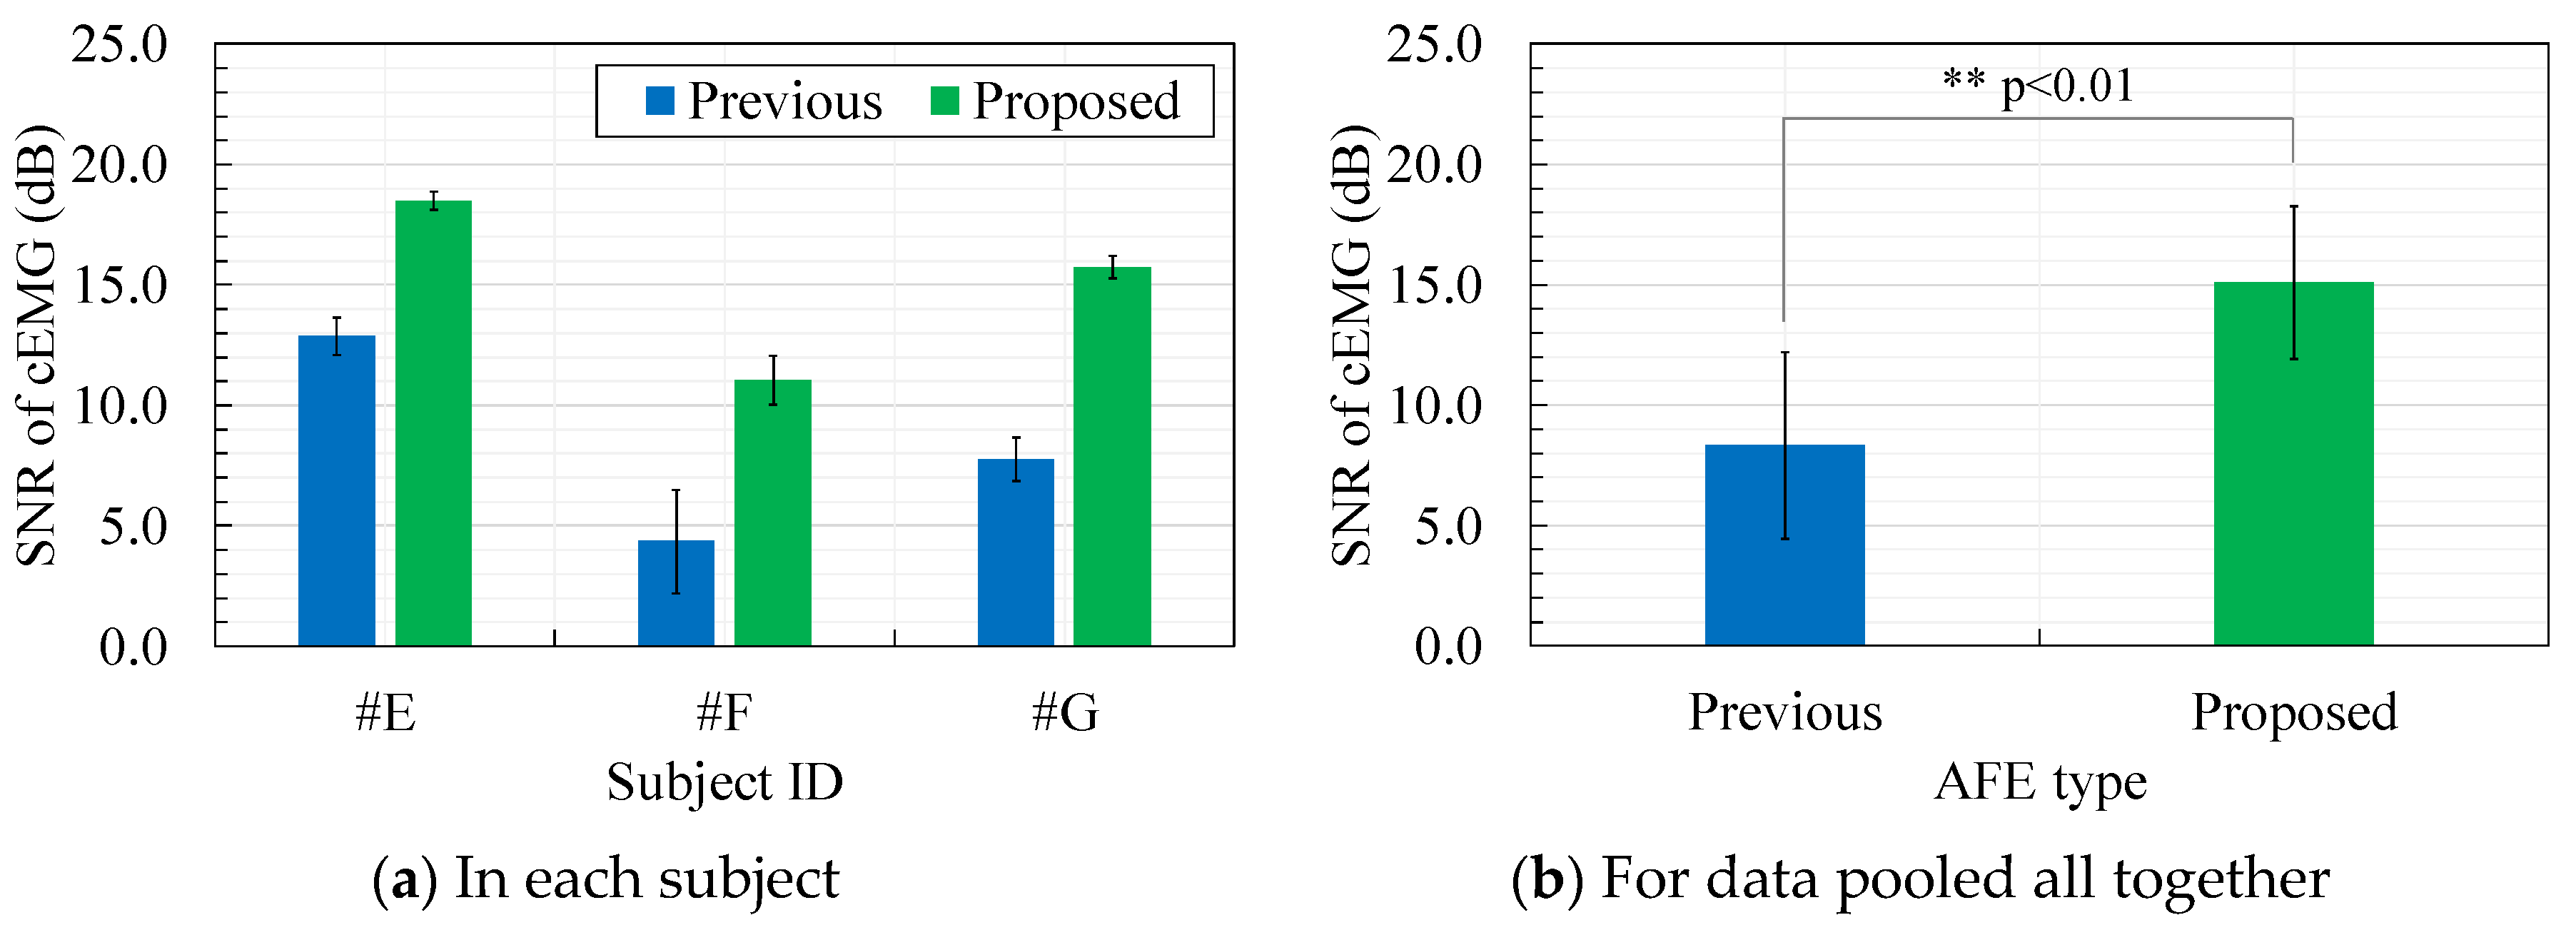
4.4. Evaluation of cEMG Signals
5. Discussion
5.1. Significance of Voltage-Dependent Input Impedance
5.2. Usefullness of Bandpass Amplification in AFE
5.3. Effect of Stray Capacitance Reduction
6. Conclusions
Author Contributions
Funding
Conflicts of Interest
References
- Majumder, S.; Aghayi, E.; Noferesti, M.; Memarzadeh-Tehran, H.; Mondal, T.; Pang, Z.; Deen, M.J. Smart Homes for Elderly Healthcare—Recent Advances and Research Challenges. Sensors 2017, 17, 2496. [Google Scholar] [CrossRef] [PubMed]
- Habibzadeh, H.; Soyata, T. Toward uniform smart healthcare ecosystems: A survey on prospects, security, and privacy considerations. In Connected Health in Smart Cities, 1st ed.; Saddik, A.E., Hossain, M.S., Kantarci, B., Eds.; Springer: Cham, Switzerland, 2020; pp. 75–112. [Google Scholar]
- Tian, S.; Yang, W.; Le Grange, J.M.; Wang, P.; Huang, W.; Ye, Z. Smart healthcare: Making medical care more intelligent. Glob. Health J. 2019, 3, 62–64. [Google Scholar] [CrossRef]
- Laplante, P.A.; Laplante, N. The internet of things in healthcare: Potential applications and challenges. It Prof. 2016, 18, 2–4. [Google Scholar] [CrossRef]
- Islam, S.M.R.; Kwak, D.; Humaun Kabir, M.D.; Hossain, M.; Kwak, K.-S. The internet of things for health care: A comprehensive survey. IEEE Access 2015, 3, 678–708. [Google Scholar] [CrossRef]
- Pantelopoulos, A.; Bourbakis, N.G. A survey on wearable sensor-based systems for health monitoring and prognosis. IEEE Trans. Syst. ManCybern. Part C 2010, 40, 1–12. [Google Scholar] [CrossRef]
- Baig, M.M.; Afifi, S.; GholamHosseini, H.; Mirza, F. A systematic review of wearable sensors and IoT-based monitoring applications for older adults – a focus on ageing population and independent living. J. Med. Syst. 2019, 43, 233. [Google Scholar] [CrossRef]
- Yang, G.; Xie, L.; Mäntysalo, M.; Chen, J.; Tenhunen, H.; Zheng, L.-R. Bio-patch design and implementation based on a low-power system-on-chip and paper-based inkjet printing technology. IEEE Trans. Inf. Technol. Biomed. 2012, 16, 1043–1050. [Google Scholar] [CrossRef]
- Anliker, U.; Ward, J.A.; Lukowicz, P.; Troster, G.; Dolveck, F.; Baer, M.; Keita, F.; Schenker, E.B.; Catarsi, F.; Coluccini, L.; et al. AMON: A wearable multiparameter medical monitoring and alert system. IEEE Trans. Inf. Technol. Biomed. 2004, 8, 415–427. [Google Scholar] [CrossRef]
- Poon, C.C.Y.; Wong, Y.M.; Zhang, Y.-T. M-Health: The Development of Cuff-less and Wearable Blood Pressure Meters for Use in Body Sensor Networks. In Proceedings of the 2006 IEEE/NLM Life Science Systems and Applications Workshop, Bethesda, MD, USA, 13–14 July 2006. [Google Scholar]
- Torfs, T.; Leonov, V.; Hoof, C.V.; Gyselinckx, B. Body-Heat Powered Autonomous Pulse Oximeter. In Proceedings of the IEEE Sensors 2006 (EXCO), Daegu, Korea, 22–25 October 2006; pp. 427–430. [Google Scholar]
- Poh, M.-Z.; Swenson, N.C.; Picard, R.W. Motion-tolerant magnetic earring sensor and wireless earpiece for wearable photoplethysmography. IEEE Trans. Inf. Technol. Biomed. 2010, 14, 786–794. [Google Scholar] [CrossRef]
- Zheng, Y.; Leung, B.; Sy, S.; Zhang, Y.; Poon, C.C.Y. A Clip-free Eyeglasses-based Wearable Monitoring Device for Measuring Photoplethysmograhic Signals. In Proceedings of the 34th Annual International Conference of the IEEE EMBS, San Diego, CA, USA, 28 August–1 September 2012; pp. 5022–5025. [Google Scholar]
- Scilingo, E.P.; Gemignani, A.; Paradiso, R.; Taccini, N.; Ghelarducci, B.; Rossi, D.D. Performance evaluation of sensing fabrics for monitoring physiological and biomechanical variables. IEEE Trans. Inf. Technol. Biomed. 2005, 9, 345–352. [Google Scholar] [CrossRef]
- Paradiso, R.; Loriga, G.; Taccini, N. A wearable health care system based on knitted integrated sensors. IEEE Trans. Inf. Technol. Biomed. 2005, 9, 337–344. [Google Scholar] [CrossRef] [PubMed]
- Pacelli, M.; Loriga, G.; Taccini, N.; Paradiso, R. Sensing Fabrics for Monitoring Physiological and Biomechanical Variables: E-textile Solutions. In Proceedings of the 2006 3rd IEEE/EMBS International Summer School on Medical Devices and Biosensors, Cambridge, MA, USA, 4–6 September 2006. [Google Scholar]
- Pandian, P.S.; Mohanavelu, K.; Safeer, K.P.; Kotresh, T.M.; Shakunthala, D.T.; Gopal, P.; Padaki, V.C. Smart vest: Wearable multi-parameter remote physiological monitoring system. Med. Eng. Phys. 2008, 30, 466–477. [Google Scholar] [CrossRef] [PubMed]
- Lopez, A.; Richardson, P.C. Capacitive electrocardiographic and bioelectric electrodes. IEEE Trans. Biomed. Eng. 1969, BME-16, 99. [Google Scholar] [CrossRef] [PubMed]
- Ueno, A.; Akabane, Y.; Kato, T.; Hoshino, H.; Kataoka, S.; Ishiyama, Y. Capacitive sensing of electrocardiographic potential through cloth from the dorsal surface of the body in a supine position: A preliminary study. IEEE Trans. Biomed. Eng. 2007, 54, 759–766. [Google Scholar] [CrossRef] [PubMed]
- Linz, T.; Gourmelon, L.; Langereis, G. Contactless EMG Sensors Embroidered onto Textile. In Proceedings of the 4th International Workshop on Wearable and Implantable Body Sensor Networks (BSN 2007), Aachen, Germany, 26–28 March 2007; pp. 29–34. [Google Scholar]
- Ueno, A.; Yamaguchi, T.; Iida, T.; Fukuoka, Y.; Uchikawa, Y.; Noshiro, M. Feasibility of capacitive sensing of surface electromyographic potential through cloth. Sens. Mater. 2012, 24, 335–346. [Google Scholar]
- Roland, T.; Amsüssb, S.; Russoldb, M.F.; Wolfa, C.; Baumgartnera, W. Capacitive sensing of surface EMG for upper limb prostheses control. Procedia Eng. 2016, 168, 155–158. [Google Scholar] [CrossRef]
- Matsuo, T.; Iinuma, K.; Esashi, M. A barium-titanate-ceramics capacitive-type EEG electrode. IEEE Trans. Biomed. Eng. 1973, BME-20, 299–300. [Google Scholar] [CrossRef]
- Chi, Y.M.; Wang, Y.-T.; Wang, Y.; Maier, C.; Jung, T.-P.; Cauwenberghs, G. Dry and noncontact EEG sensors for mobile brain–computer interfaces. IEEE Trans. Neural Syst. Rehabil. Eng. 2012, 20, 228–235. [Google Scholar] [CrossRef]
- Baek, H.J.; Lee, H.J.; Lim, Y.G.; Park, K.S. Conductive polymer foam surface improves the performance of a capacitive EEG electrode. IEEE Trans. Biomed. Eng. 2012, 59, 3422–3431. [Google Scholar] [CrossRef]
- Kato, T.; Ueno, A.; Kataoka, S.; Hoshino, H.; Ishiyama, Y. An Application of Capacitive Electrode for Detecting Electrocardiogram of Neonates and Infants. In Proceedings of the 28th Annual International Conference of IEEE EMBS, New York, NY, USA, 31 August–3 September 2006; pp. 916–919. [Google Scholar]
- Takano, M.; Ueno, A. Noncontact in-bed measurements of physiological and behavioral signals using an integrated fabric-sheet sensing scheme. IEEE J. Biomed. Health Inf. 2019, 23, 618–630. [Google Scholar] [CrossRef]
- Kim, K.K.; Lim, Y.K.; Park, K.S. Common Mode Noise Cancellation for Electrically Non-Contact ECG Measurement System on a Chair. In Proceedings of the 2005 IEEE Engineering in Medicine and Biology Society 27th Annual Conference, Shanghai, China, 1–4 September 2005; pp. 5881–5883. [Google Scholar]
- Aleksandrowicz, A.; Leonhardt, S. Wireless and non-contact ECG measurement system—The “Aachen SmartChair”. Acta Polytech. 2007, 47, 68–71. [Google Scholar]
- Kim, K.K.; Lim, Y.K.; Park, K.S. The Electrically Non-contacting ECG Measurement on the Toilet Seat Using the Capacitively-coupled Insulated Electrodes. In Proceedings of the 26th Annual International Conference of the IEEE EMBS, San Francisco, CA, USA, 1–5 September 2004; pp. 2375–2378. [Google Scholar]
- Lim, Y.K.; Kim, K.K.; Park, K.S. The ECG Measurement in the Bathtub Using the Insulated Electrodes. In Proceedings of the 26th Annual International Conference of the IEEE EMBS, San Francisco, CA, USA, 1–5 September 2004; pp. 2383–2385. [Google Scholar]
- Leonhardt, S.; Aleksandrowicz, A. Non-Contact ECG Monitoring for Automotive Application. In Proceedings of the 5th International Summer School and Symposium on Medical Devices and Biosensors, Hong Kong, China, 1–3 June 2008; pp. 183–185. [Google Scholar]
- Wartzek, T.; Eilebrecht, B.; Lem, J.; Lindner, H.-J.; Leonhardt, S.; Walter, M. ECG on the road: Robust and unobtrusive estimation of heart rate. IEEE Trans. Biomed. Eng. 2011, 58, 3112–3120. [Google Scholar] [CrossRef] [PubMed]
- Schumm, J.; Setz, C.; Bächlin, M.; Bächler, M.; Arnrich, B.; Tröster, G. Unobtrusive physiological monitoring in an airplane seat. Pers. Ubiquitous Comput. 2010, 14, 541–550. [Google Scholar] [CrossRef]
- Wartzek, T.; Elfring, R.; Janssen, A.; Eilebrecht, B.; Walter, M.; Leonhardt, S. On the Way to a Cable Free Operating Theater: An Operating Table with Integrated Multimodal Monitoring. In Proceedings of the 2011 Computing in Cardiology, Hangzhou, China, 18–21 September 2011; pp. 129–132. [Google Scholar]
- Wartzek, T.; Lammersen, T.; Eilebrecht, B.; Walter, M.; Leonhardt, S. Triboelectricity in capacitive biopotential measurements. IEEE Trans. Biomed. Eng. 2011, 58, 1268–1277. [Google Scholar] [CrossRef] [PubMed]
- Chi, Y.M.; Jung, T.-P.; Cauwenberghs, G. Dry-contact and noncontact biopotential electrodes: Methodological review. IEEE Rev. Biomed. Eng. 2010, 3, 106–119. [Google Scholar] [CrossRef]
- Fukuyama, Y.; Suzuki, R.; Takayama, S.; Ueno, A. Multi-layered Fabric Electrode for Movement Artifact Reduction in Capacitive ECG Measurement. In Proceedings of the 35th Annual International Conference of IEEE (EMBS), Osaka, Japan, 3–7 July 2013; pp. 555–558. [Google Scholar]
- Thakor, N.V.; Webster, J.G. Ground-free ECG recording with two electrodes. IEEE Trans. Biomed. Eng. 1980, BME-27, 699–704. [Google Scholar] [CrossRef]
- Chi, Y.M.; Maier, C.; Cauwenberghs, G. Ultra-high input impedance, low noise integrated amplifier for noncontact biopotential sensing. IEEE Trans. Emerg. Sel. Top. Circuits Syst. 2011, 1, 526–535. [Google Scholar] [CrossRef]
- Takano, M.; Yamagishi, S.; Ohmuta, T.; Fukuoka, Y.; Ueno, A. Non-contact simultaneous measurements of electrocardiogram and respiratory movements using capacitive sheet electrodes. Adv. Biomed. Eng. 2017, 6, 28–36. [Google Scholar] [CrossRef]
- Borelli, G.; Bonnet, J.J.; Hernandez, Y.R.; Matsuda, K.; Damerau, J. Spectral-distance-based detection of EMG activity from capacitive measurements. IEEE Sens. J. 2018, 18, 8502–8509. [Google Scholar] [CrossRef]
- Nakamura, H.; Kato, Y.; Ueno, A. Design and Validation of Front-End Voltage Follower for Capacitive Electrocardiogram Measurement Using Bootstrapping Technique. In Proceedings of the 40th Annual International Conference of the IEEE (EMBS), Honolulu, HI, USA, 18–21 July 2018; pp. 5780–5783. [Google Scholar]
- Chi, Y.M.; Cauwenberghs, G. Micropower Non-contact EEG Electrode with Active Common-Mode Noise Suppression and Input Capacitance Cancellation. In Proceedings of the 31st Annual International Conference of the IEEE (EMBS), Minneapolis, MN, USA, 2–6 September 2009; pp. 4218–4221. [Google Scholar]
- Takano, M.; Komiya, H.; Ueno, A. Stability Improvement and Noise Suppression in Non-Contact In-Bed Electrocardiogram Measurement Using Laminated Feedback Electrode. In Proceedings of the 2017 IEEE Biomedical Circuits and Systems Conference, Turin, Italy, 19–21 October 2017; pp. 364–367. [Google Scholar]


| Item | Previous AFE (BVFcf) | Proposed AFE (BNArf) | ||||
|---|---|---|---|---|---|---|
| Gain | Total 60 dB | AFE 0 dB | Subsequent 60 dB | Total 60 dB | AFE (Rs, Rf) 20 dB (30 k, 270 k Ω) | Subsequent 40 dB |
| Bootstrap | Ra1 100 MΩ | Ra2 100 MΩ | Ca3 100 µF | Rb1 100 MΩ | Rbv 20 MΩ/0 Ω | Rb3 1.0 kΩ |
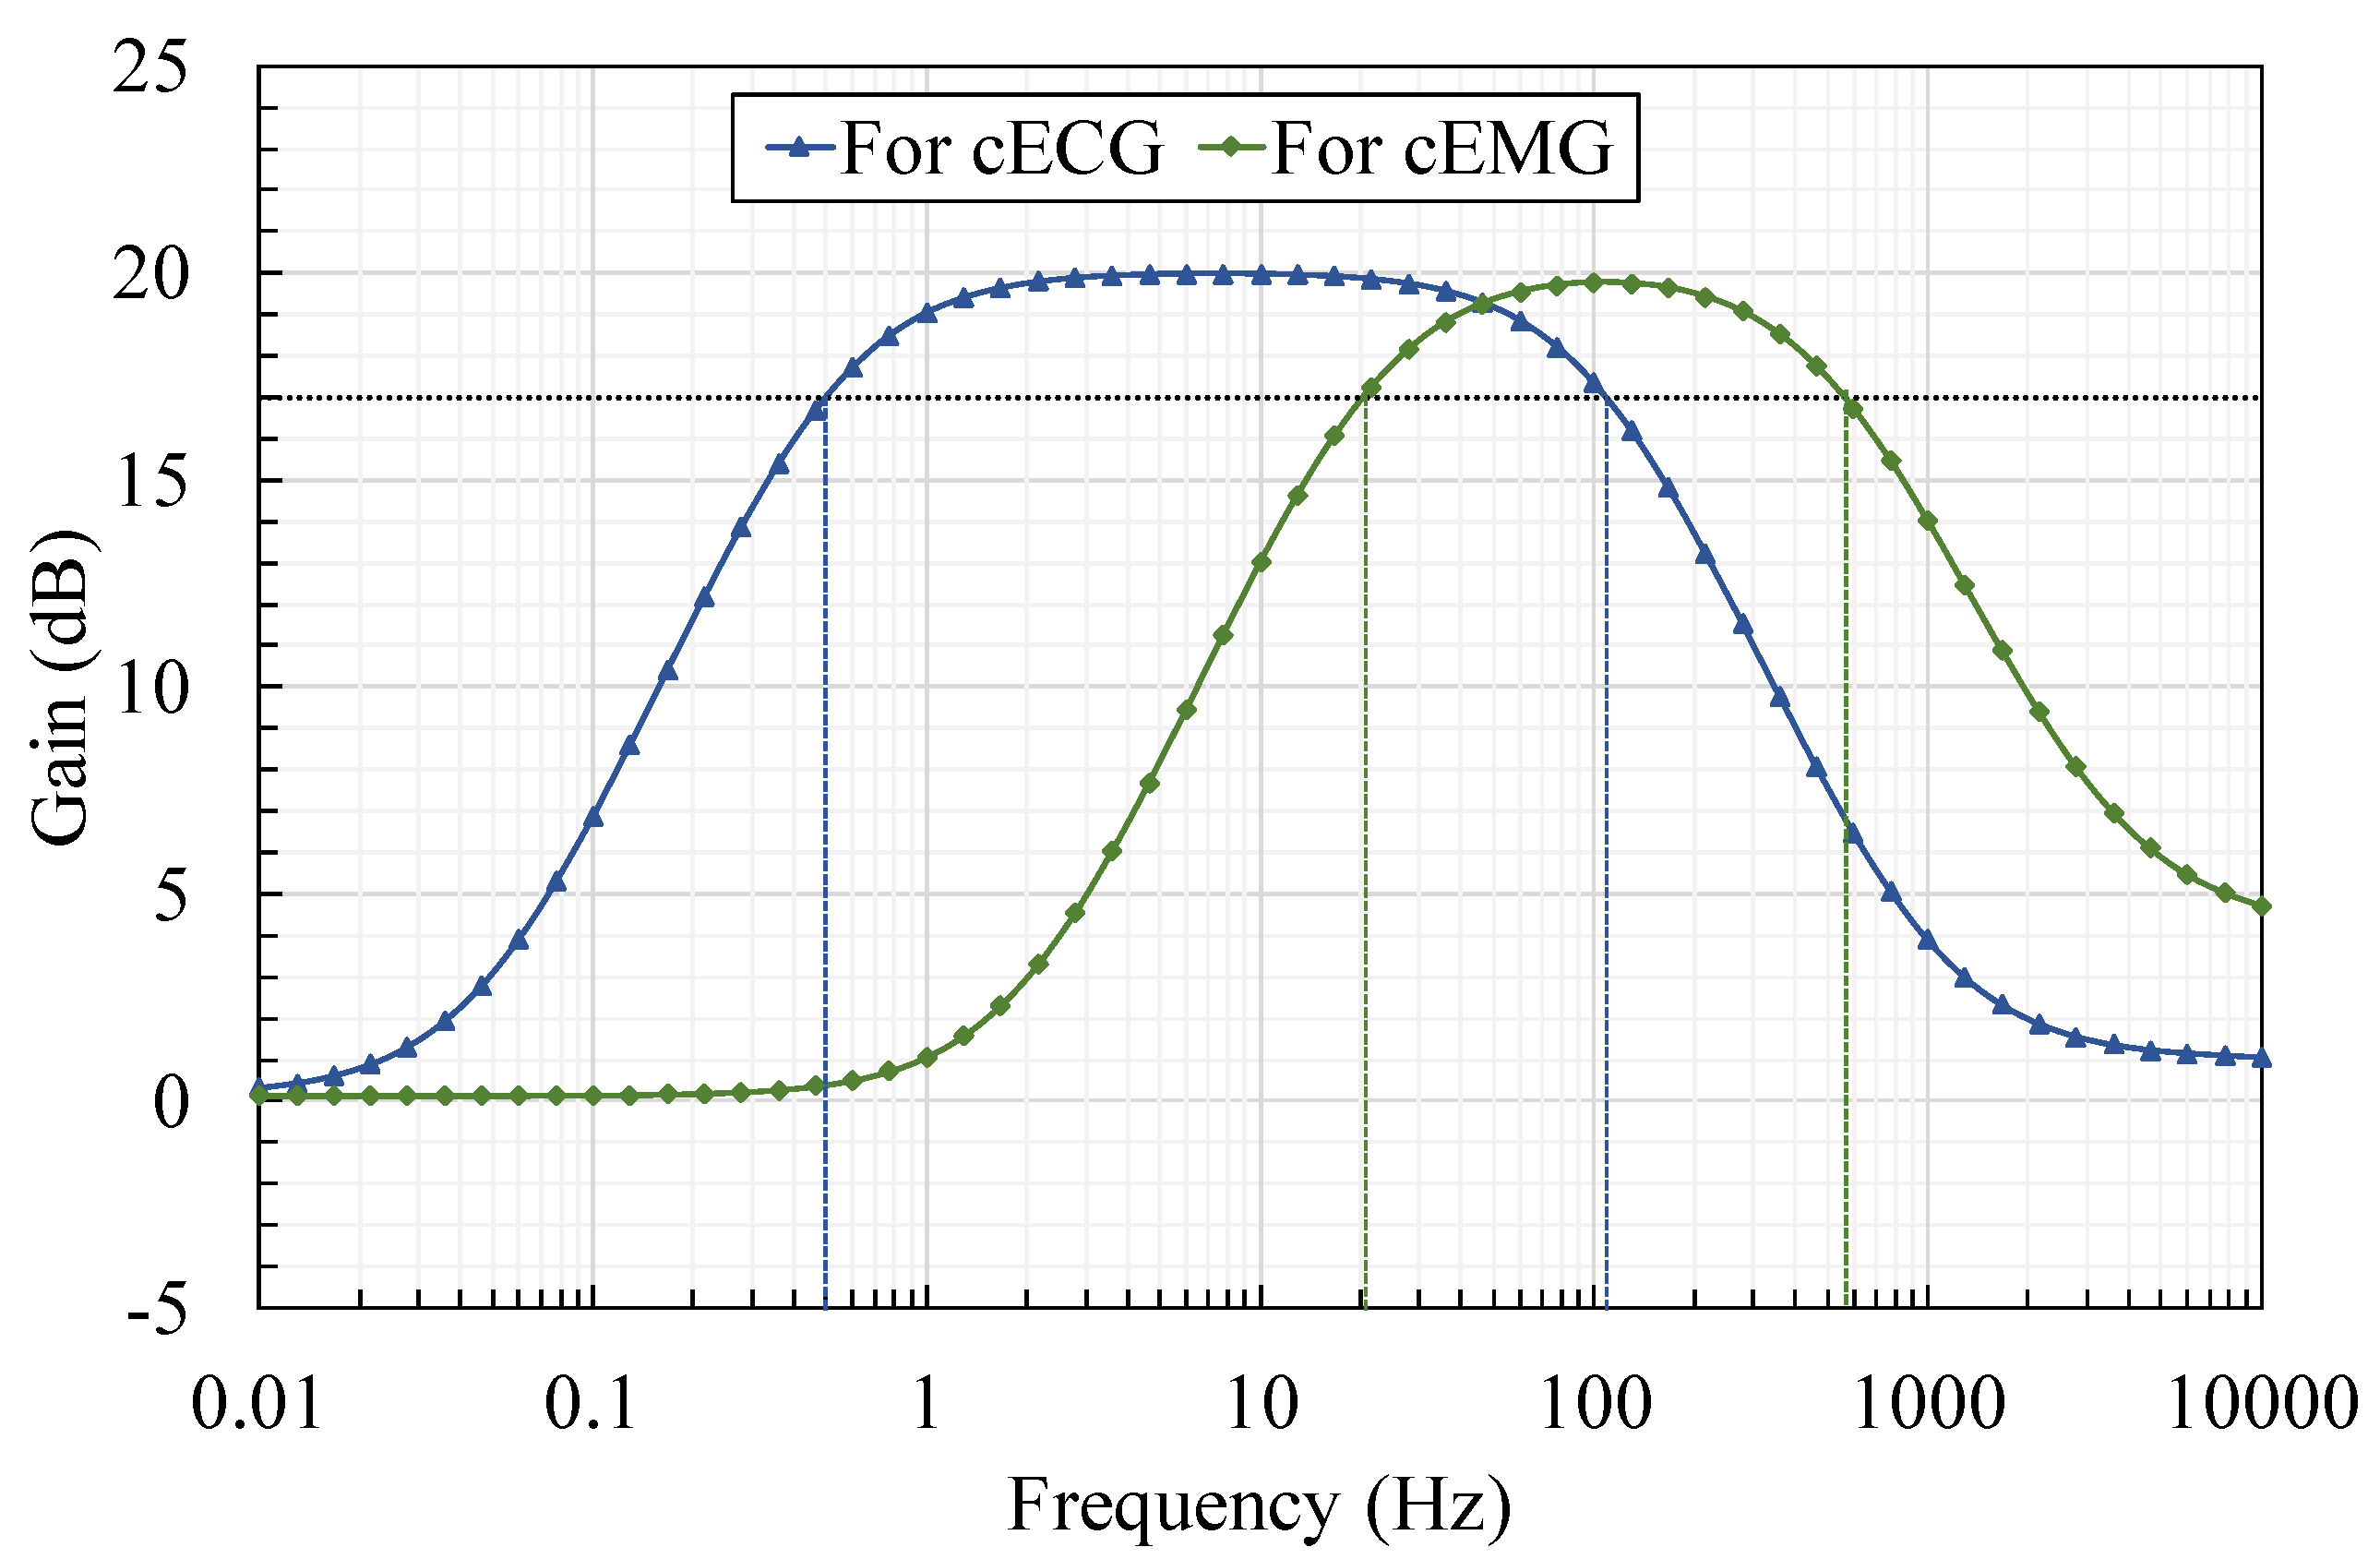
| Bandpass | NA | Measurand cECG cEMG | fcs (Cs µF) 0.50 Hz (10.7) 20.0 Hz (2.67) | fcf (Cf nF) 103 Hz (5.70) 513 Hz (1.15) | ||
| StrayCap.Reduction | NA | Cn 1.0 pF | ||||
| ID | Subject Information | Clothing | Experimental Conditions | |||||
|---|---|---|---|---|---|---|---|---|
| Height (m) | Weight (kg) | BMI (kg/m2) | Age | Thickness (mm) | RH (%) | Temperature (°C) | VH (g/m3) | |
| #A | 1.65 | 60 | 22.0 | 22 | 1.70 | 22.0 | 24.0 | 4.79 |
| #B | 1.63 | 70 | 26.4 | 23 | 1.70 | 22.0 | 24.0 | 4.79 |
| #C | 1.61 | 74 | 28.6 | 23 | 1.70 | 32.6 | 25.0 | 7.52 |
| #D | 1.69 | 59 | 20.7 | 23 | 1.70 | 17.0 | 24.8 | 3.88 |
| ID | Subject Information | Clothing | Experimental Conditions | |||||
|---|---|---|---|---|---|---|---|---|
| Height (m) | Weight (kg) | BMI (kg/m2) | Age | Thickness (mm) | RH (%) | Temperature (°C) | VH (g/m3) | |
| #E | 1.71 | 56 | 19.2 | 24 | 0.26 | 19.0 | 23.0 | 3.91 |
| #F | 1.80 | 92 | 28.4 | 23 | 0.26 | 19.0 | 23.0 | 3.91 |
| #G | 1.70 | 73 | 25.3 | 23 | 0.26 | 33.0 | 23.2 | 6.87 |
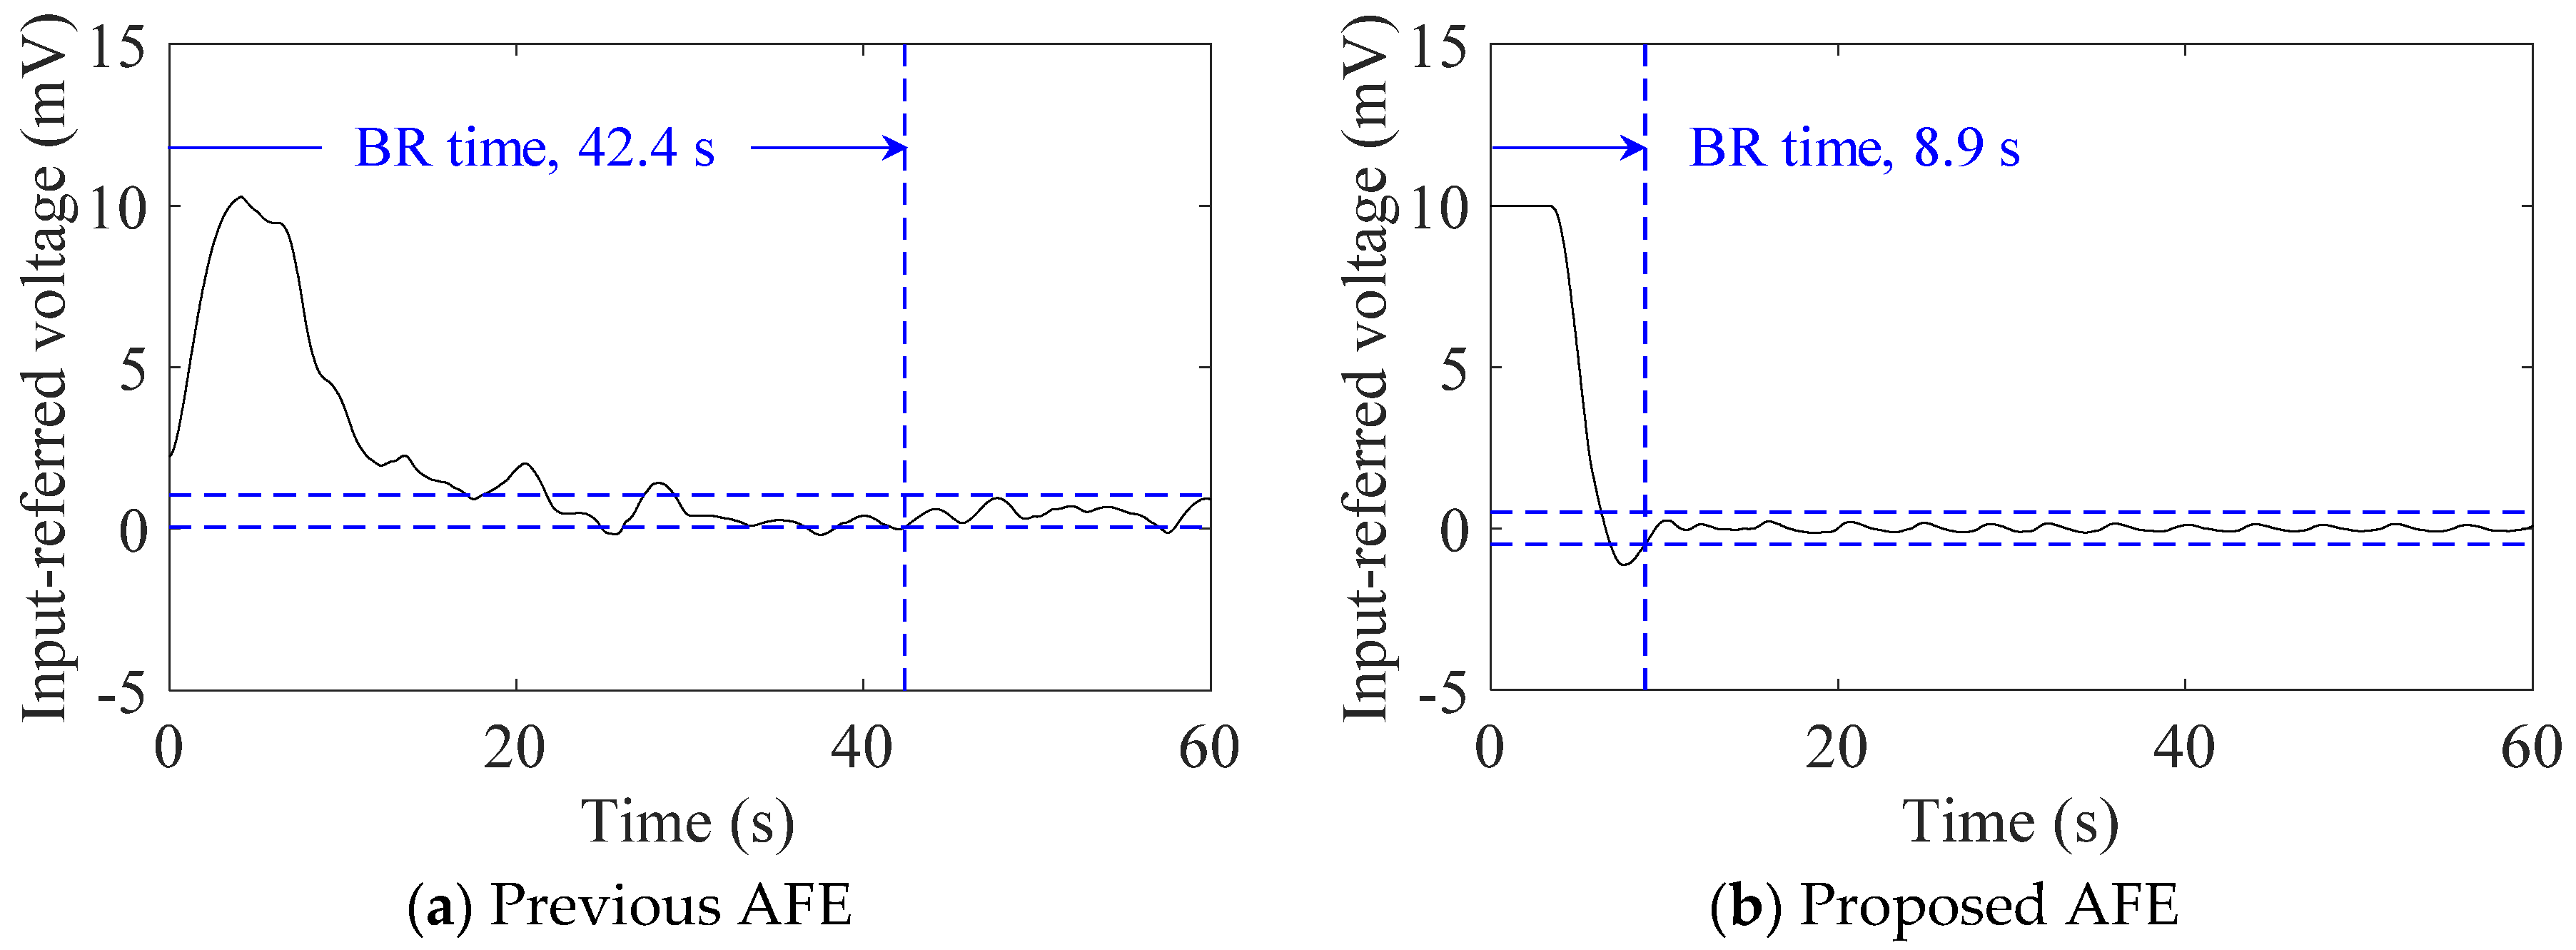
| Subject ID | BR Time (s) | BMI (kg/m2) | Humidity | ||
|---|---|---|---|---|---|
| Previous | Proposed | RH (%) | VH (g/m3) | ||
| #A | 42.4 | 8.9 | 22.0 | 22.0 | 4.79 |
| #B | 4.2 | 5.1 | 26.4 | 22.0 | 4.79 |
| #C | 6.6 | 6.4 | 28.6 | 32.6 | 7.52 |
| #D | 69.2 | 8.0 | 20.7 | 17.0 | 3.88 |
| Mean ± SD | 30.6 ± 26.9 | 7.1 ± 1.5 | 24.4 ± 3.7 | 23.4 ± 5.7 | 5.25 ± 1.37 |
© 2020 by the authors. Licensee MDPI, Basel, Switzerland. This article is an open access article distributed under the terms and conditions of the Creative Commons Attribution (CC BY) license (http://creativecommons.org/licenses/by/4.0/).
Share and Cite
Nakamura, H.; Sakajiri, Y.; Ishigami, H.; Ueno, A. A Novel Analog Front End with Voltage-Dependent Input Impedance and Bandpass Amplification for Capacitive Biopotential Measurements. Sensors 2020, 20, 2476. https://doi.org/10.3390/s20092476
Nakamura H, Sakajiri Y, Ishigami H, Ueno A. A Novel Analog Front End with Voltage-Dependent Input Impedance and Bandpass Amplification for Capacitive Biopotential Measurements. Sensors. 2020; 20(9):2476. https://doi.org/10.3390/s20092476
Chicago/Turabian StyleNakamura, Hajime, Yuichiro Sakajiri, Hiroshi Ishigami, and Akinori Ueno. 2020. "A Novel Analog Front End with Voltage-Dependent Input Impedance and Bandpass Amplification for Capacitive Biopotential Measurements" Sensors 20, no. 9: 2476. https://doi.org/10.3390/s20092476
APA StyleNakamura, H., Sakajiri, Y., Ishigami, H., & Ueno, A. (2020). A Novel Analog Front End with Voltage-Dependent Input Impedance and Bandpass Amplification for Capacitive Biopotential Measurements. Sensors, 20(9), 2476. https://doi.org/10.3390/s20092476