Non-Destructive Detection of Strawberry Quality Using Multi-Features of Hyperspectral Imaging and Multivariate Methods
Abstract
:1. Introduction
2. Materials and Methods
2.1. Samples Preparation
2.2. Acquisition of Hyperspectral Images
2.3. Reference Values Measurement of SSC, pH, and VC
2.4. Extraction of the Spectrum, Color, and Texture of Strawberries
2.4.1. Extraction of Spectral Features
2.4.2. Extraction of Color and Textural Features
2.5. Spectra Pretreatment and Variable Selection Methods
2.6. Models Establishment and Performance Evaluation
3. Results and Discussion
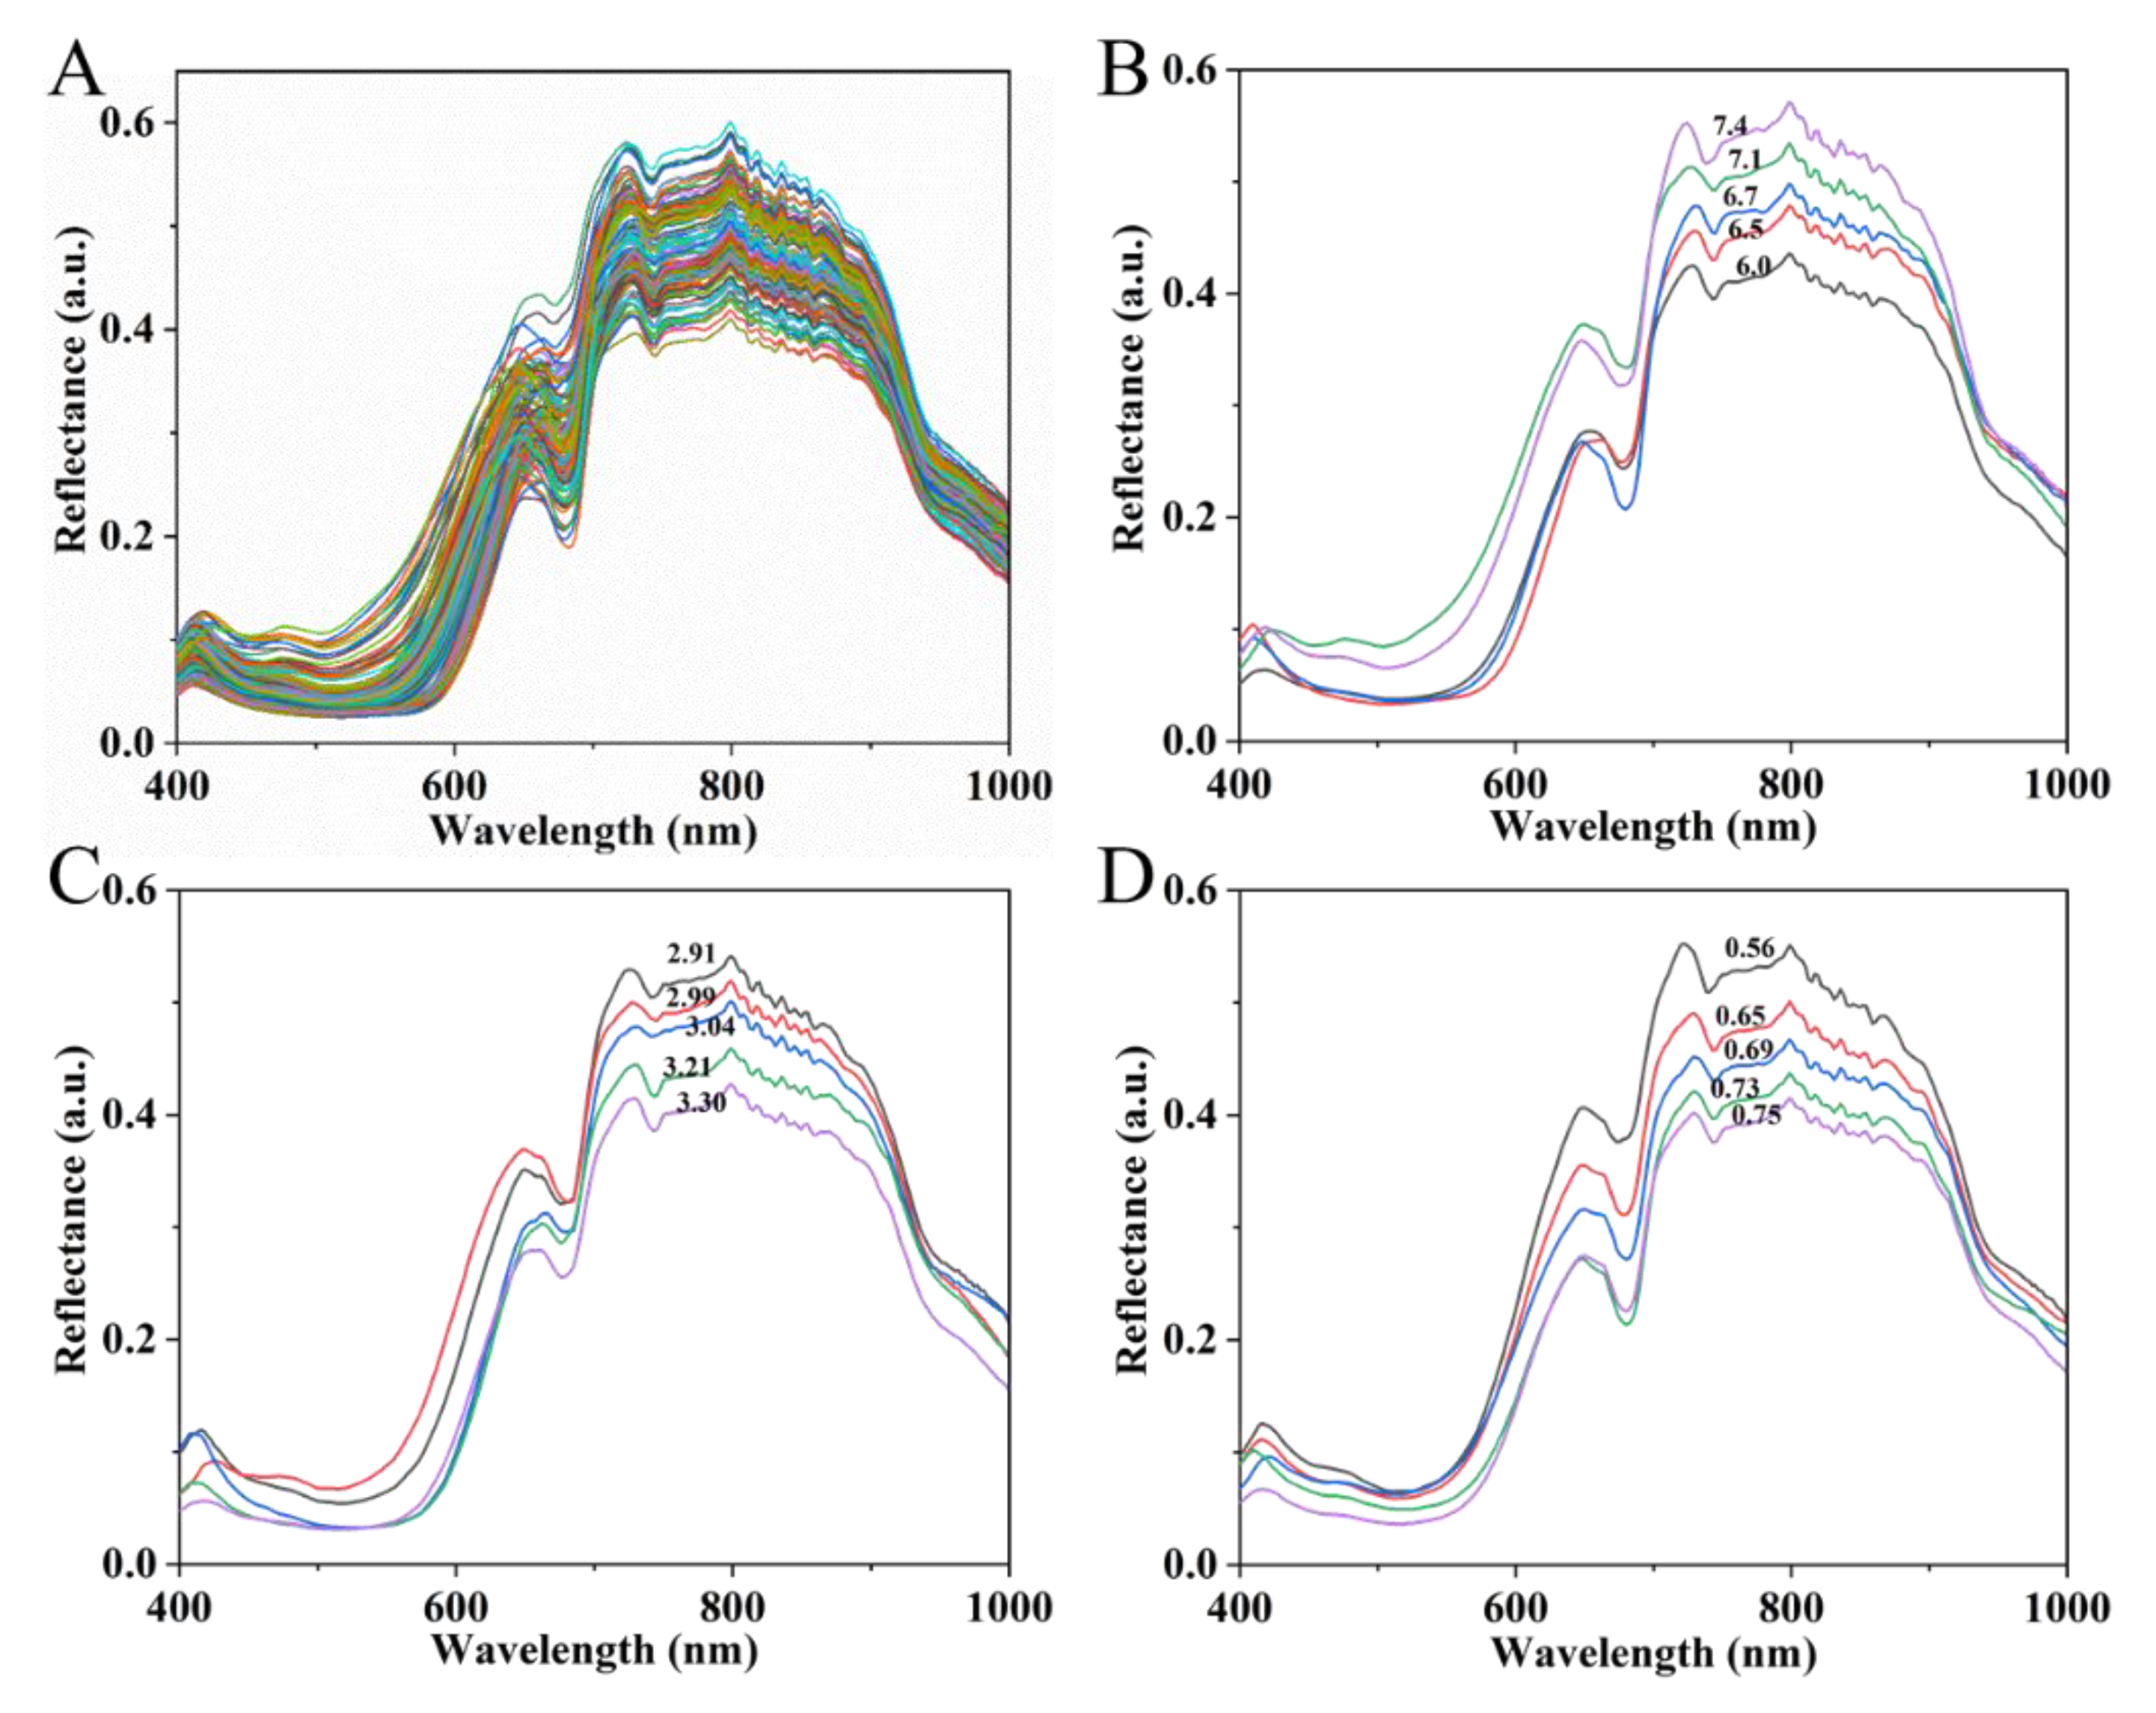
3.1. Spectral Characteristics
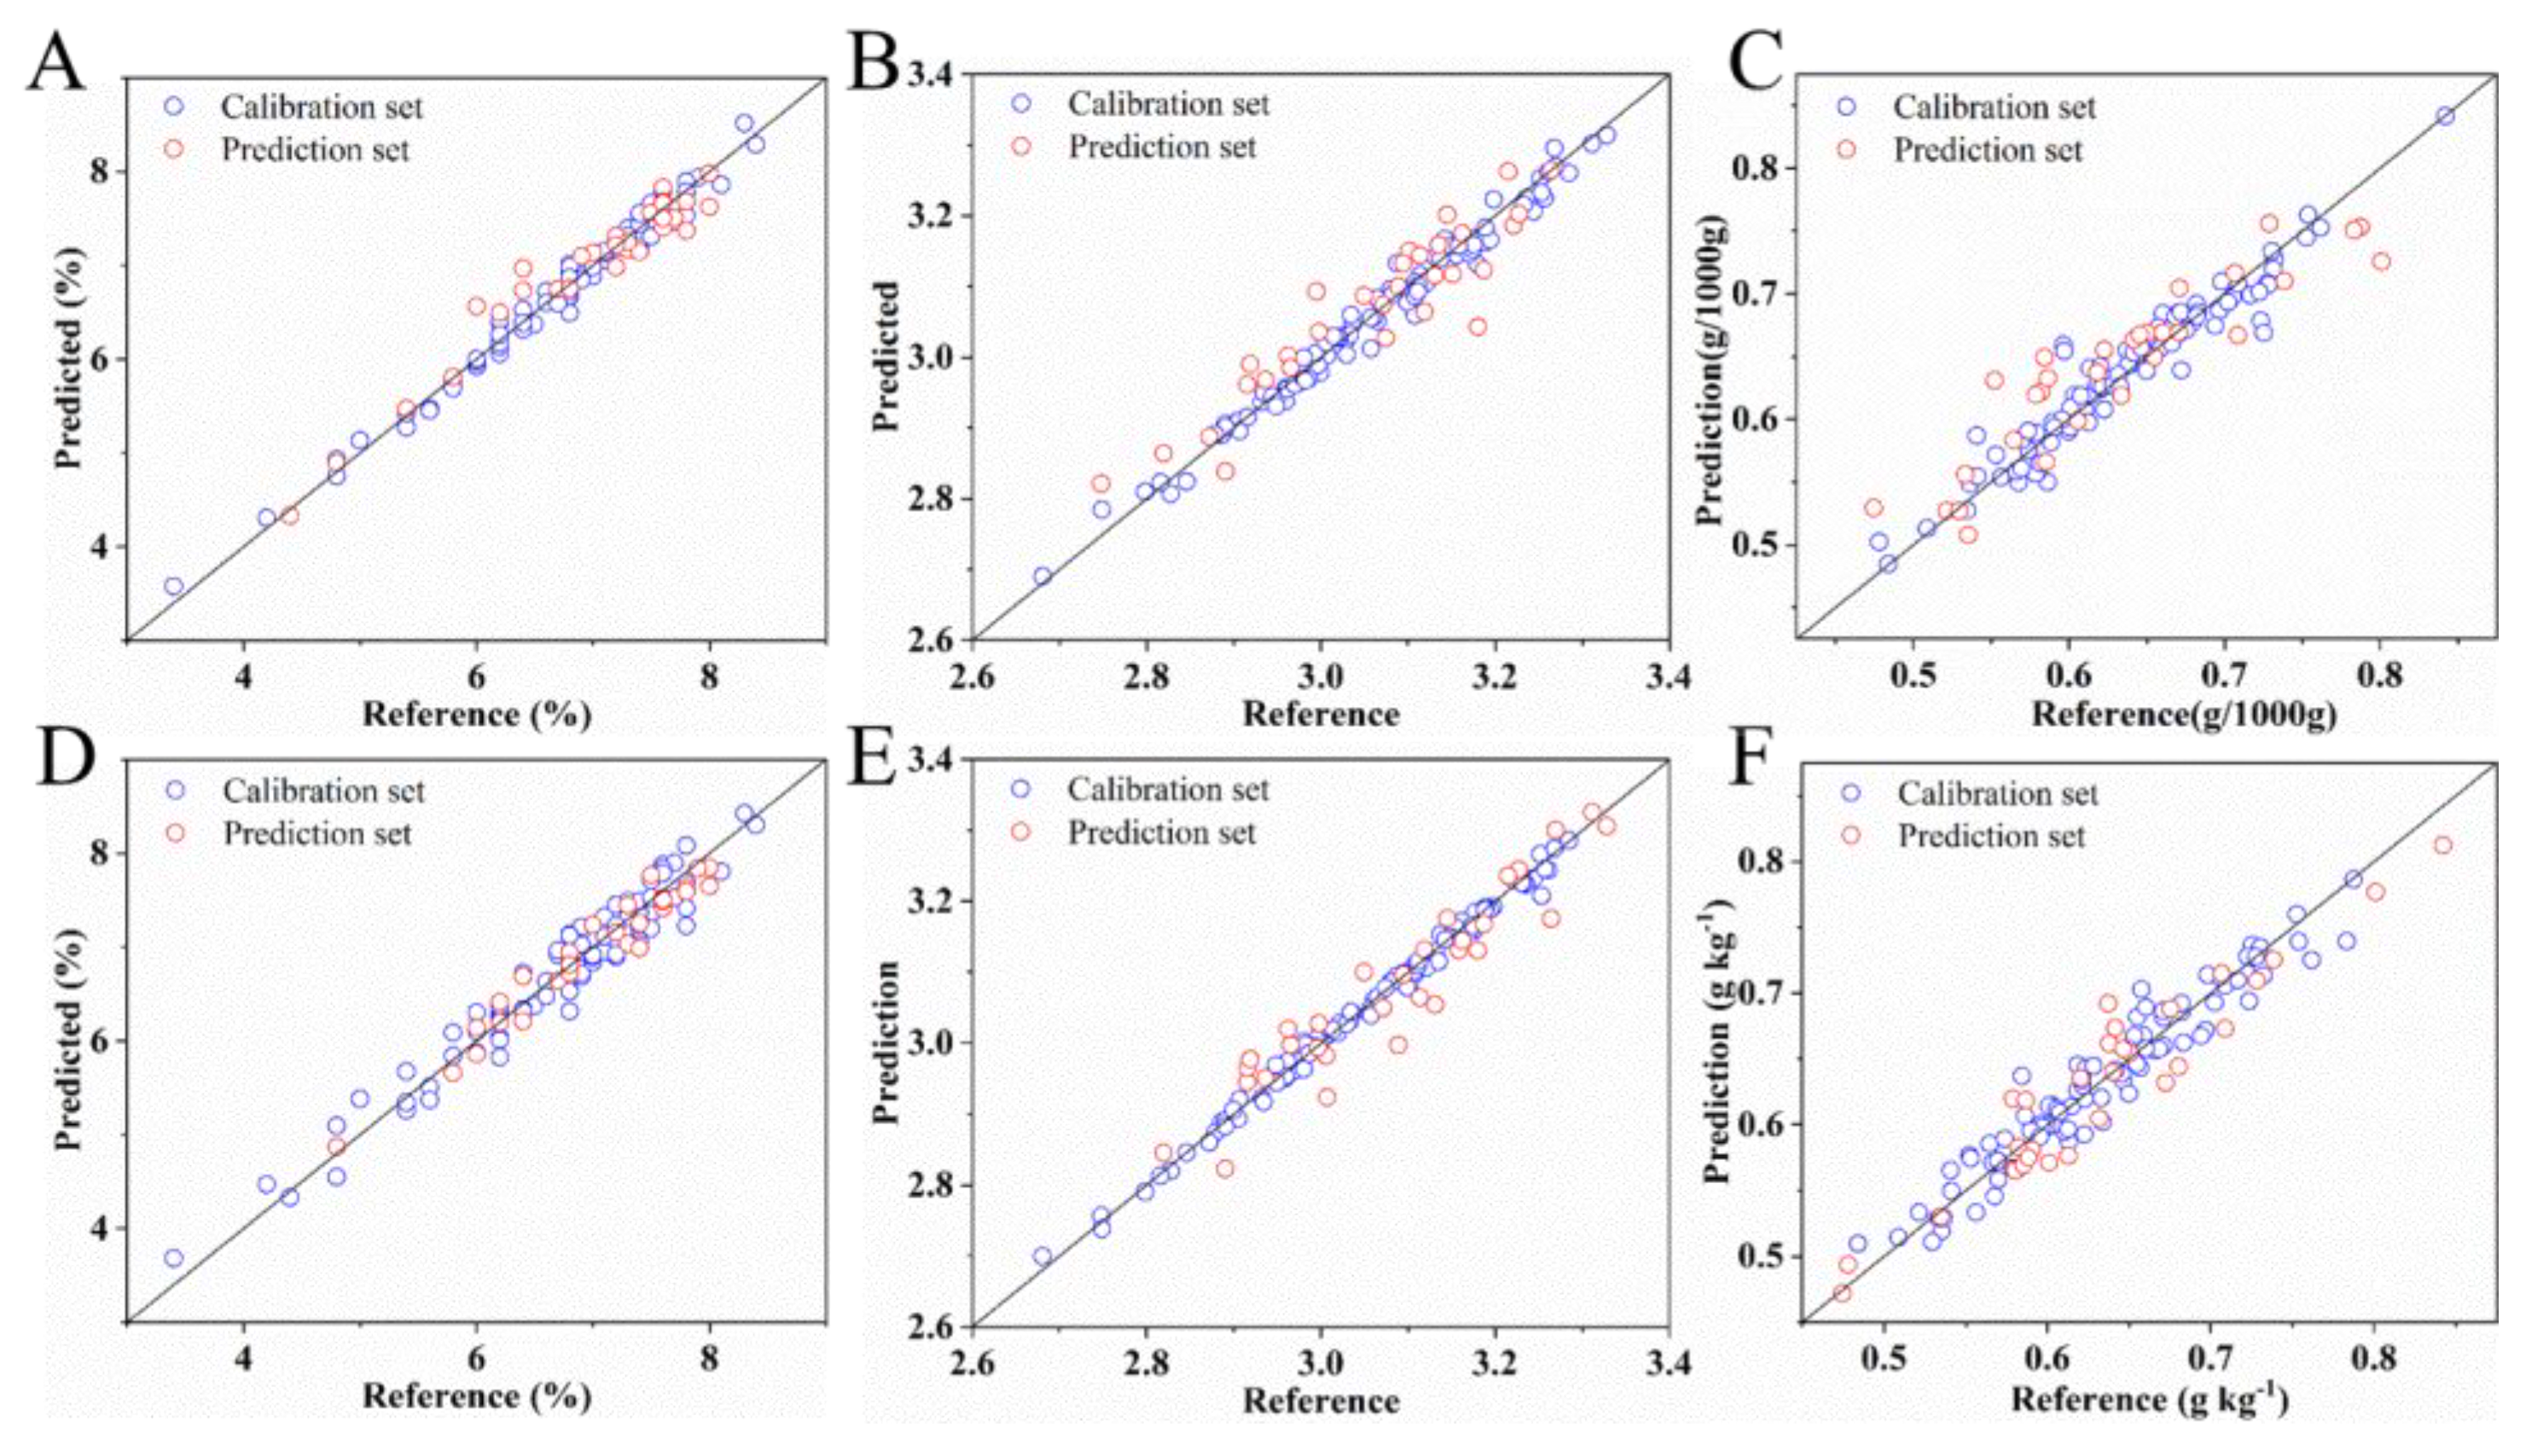
3.2. Detection of SSC, pH, and VC Using Spectroscopy
3.3. Color and Textural Features of Strawberries
3.4. Detection of SSC, pH, and VC Based on Spectral, Color, and Textural Features
3.5. Detection of SSC, pH, and VC Using Important Variables of Multiple Features
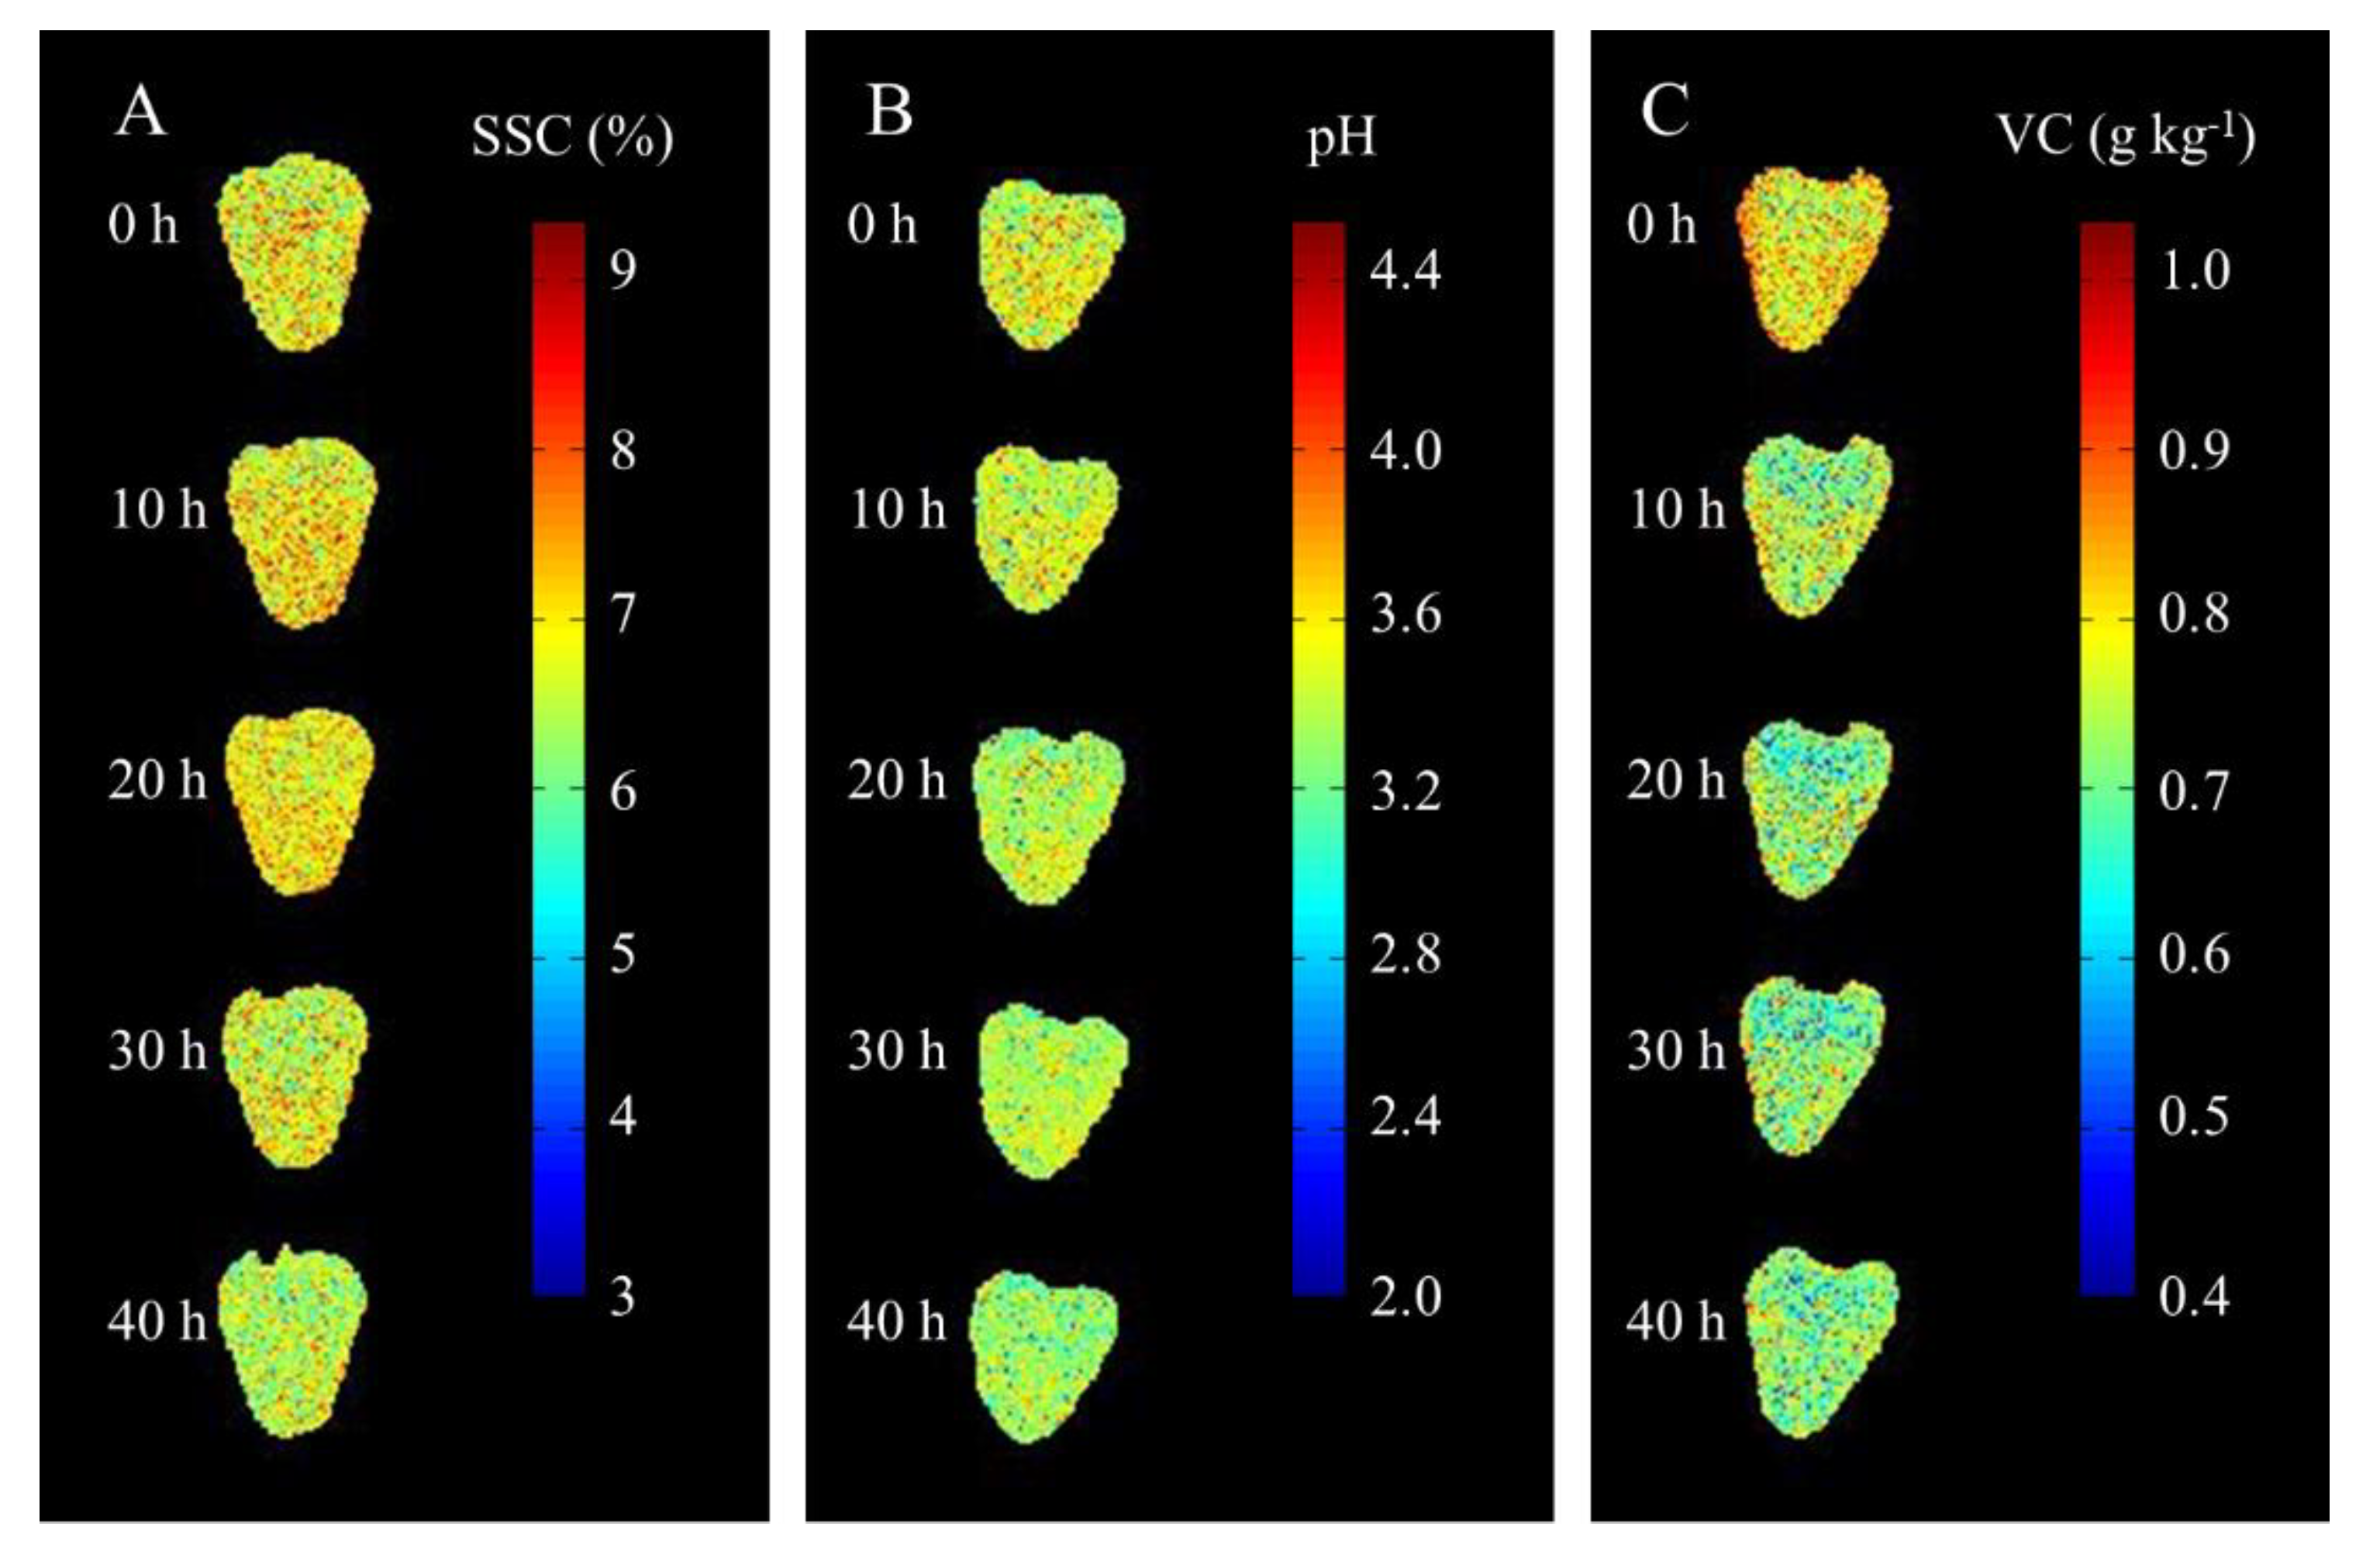
3.6. Visualization of SSC, pH, and VC of Strawberries Over Storage Time
4. Conclusions
Supplementary Materials
Author Contributions
Funding
Conflicts of Interest
References
- Liu, Q.; Wei, K.; Xiao, H.; Tu, S.; Sun, K.; Sun, Y.; Pan, L.; Tu, K. Near-Infrared Hyperspectral Imaging Rapidly Detects the Decay of Postharvest Strawberry Based on Water-Soluble Sugar Analysis. Food Anal. Methods 2019, 12, 936–946. [Google Scholar] [CrossRef]
- Liu, Q.; Sun, K.; Zhao, N.; Yang, J.; Zhang, Y.; Ma, C.; Pan, L.; Tu, K. Information fusion of hyperspectral imaging and electronic nose for evaluation of fungal contamination in strawberries during decay. Postharvest Boil. Technol. 2019, 153, 152–160. [Google Scholar] [CrossRef]
- Zhang, C.; Guo, C.; Liu, F.; Kong, W.; He, Y.; Lou, B. Hyperspectral imaging analysis for ripeness evaluation of strawberry with support vector machine. J. Food Eng. 2016, 179, 11–18. [Google Scholar] [CrossRef]
- Elmasry, G.; Wang, N.; Elsayed, A.; Ngadi, M. Hyperspectral imaging for nondestructive determination of some quality attributes for strawberry. J. Food Eng. 2007, 81, 98–107. [Google Scholar] [CrossRef]
- Sun, M.; Zhang, N.; Liu, L.; Wang, Z. How to predict the sugariness and hardness of melons: A near-infrared hyperspectral imaging method. Food Chem. 2017, 218, 413–421. [Google Scholar] [CrossRef]
- Li, X.; Wei, Y.; Xu, J.; Feng, X.; Wu, F.; Zhou, R.; Jin, J.; Xu, K.; Yu, X.; He, Y. SSC and pH for sweet assessment and maturity classification of harvested cherry fruit based on NIR hyperspectral imaging technology. Postharvest Boil. Technol. 2018, 143, 112–118. [Google Scholar] [CrossRef]
- Yang, X.; Liu, G.; Ding, J.; Chen, Y. A Rapid Evaluation of VC Content on Lingwu Long Jujube Using Hyperspectral Technique. Spectrosc. Spectr. Anal. 2019, 39, 230–234. [Google Scholar]
- Pu, H.; Sun, D.-W.; Ma, J.; Cheng, J.-H. Classification of fresh and frozen-thawed pork muscles using visible and near infrared hyperspectral imaging and textural analysis. Meat Sci. 2015, 99, 81–88. [Google Scholar] [CrossRef]
- Hui, G.; Sun, L.; Wang, J.; Dai, C. Research on the pre-processing methods of wheat hardness prediction model based on visible-near infrared spectroscopy. Spectrosc. Spectr. Anal. 2016, 36, 2111–2116. [Google Scholar]
- Mendoza, F.; Cichy, K.; Sprague, C.; Goffnett, A.; Lu, R.; Kelly, J.D. Prediction of canned black bean texture (Phaseolus vulgarisL.) from intact dry seeds using visible/near infrared spectroscopy and hyperspectral imaging data. J. Sci. Food Agric. 2017, 98, 283–290. [Google Scholar] [CrossRef]
- Wiedemair, V.; Ramoner, R.; Huck, C.W. Investigations into the total antioxidant capacities of cultivars of gluten-free grains using near-infrared spectroscopy. Food Control. 2019, 95, 189–195. [Google Scholar] [CrossRef]
- Wang, J.; Liu, H.; Ren, G. Near-infrared spectroscopy (NIRS) evaluation and regional analysis of Chinese faba bean (Vicia faba L.). Crop. J. 2014, 2, 28–37. [Google Scholar] [CrossRef] [Green Version]
- Zhang, B.; Li, J.; Fan, S.; Huang, W.; Zhao, C.; Liu, C.; Huang, D. Hyperspectral imaging combined with multivariate analysis and band math for detection of common defects on peaches (Prunus persica). Comput. Electron. Agric. 2015, 114, 14–24. [Google Scholar] [CrossRef]
- Feng, C.; Makino, Y.; Yoshimura, M.; Rodríguez-Pulido, F.J. Real-time prediction of pre-cooked Japanese sausage color with different storage days using hyperspectral imaging. J. Sci. Food Agric. 2017, 98, 2564–2572. [Google Scholar] [CrossRef] [PubMed]
- Teerachaichayut, S.; Ho, H.T. Non-destructive prediction of total soluble solids, titratable acidity and maturity index of limes by near infrared hyperspectral imaging. Postharvest Boil. Technol. 2017, 133, 20–25. [Google Scholar] [CrossRef]
- Nagata, M.; Tallada, J.G.; Kobayashi, T.; Cui, Y.; Gejima, Y. Proceedings of the Predicting Maturity Quality Parameters of Strawberries Using Hyperspectral Imaging, Ottawa, ON, Canada, 1–4 August 2004. [CrossRef]
- Ding, X.-B.; Zhang, C.; Liu, F.; Song, X.-L.; Kong, W.; He, Y. Determination of Soluble Solid Content in Strawberry Using Hyperspectral Imaging Combined with Feature Extraction Methods. Spectrosc. Spectr. Anal. 2015, 35, 1020–1024. [Google Scholar]
- Siedliska, A.; Baranowski, P.; Zubik, M.; Mazurek, W.; Sosnowska, B. Detection of fungal infections in strawberry fruit by VNIR/SWIR hyperspectral imaging. Postharvest Boil. Technol. 2018, 139, 115–126. [Google Scholar] [CrossRef]
- Liu, Q.; Sun, K.; Peng, J.; Xing, M.; Pan, L.; Tu, K. Identification of Bruise and Fungi Contamination in Strawberries Using Hyperspectral Imaging Technology and Multivariate Analysis. Food Anal. Methods 2018, 11, 1518–1527. [Google Scholar] [CrossRef]
- Jiang, H.; Zhang, C.; Liu, F.; Zhu, H.; He, Y. Identification of strawberry ripeness based on multispectral indexes extracted from hyperspectral images. Spectrosc. Spectr. Anal. 2016, 36, 1423–1427. [Google Scholar] [CrossRef]
- Yeh, Y.-H.; Chung, W.-C.; Liao, J.-Y.; Chung, C.-L.; Kuo, Y.-F.; Lin, T.-T. Strawberry foliar anthracnose assessment by hyperspectral imaging. Comput. Electron. Agric. 2016, 122, 1–9. [Google Scholar] [CrossRef]
- Khulal, U.; Zhao, J.; Hu, W.; Chen, Q. Intelligent evaluation of total volatile basic nitrogen (TVB-N) content in chicken meat by an improved multiple level data fusion model. Sens. Actuators B Chem. 2017, 238, 337–345. [Google Scholar] [CrossRef]
- Fu, D.-D.; Wang, Q.-H.; Ma, M.-H.; Ma, Y.-X.; Wang, B. Nondestructive prediction modeling of S-ovalbumin content in stored eggs based on hyperspectral fusion information. J. Food Process. Eng. 2019, 42, e13015. [Google Scholar] [CrossRef]
- Ding, H.; Chang, R.C. Comparison of photometric stereo and spectral analysis for visualization and assessment of burn injury from hyperspectral imaging. In Proceedings of the 2015 IEEE International Conference on Computational Intelligence and Virtual Environments for Measurement Systems and Applications (CIVEMSA); Institute of Electrical and Electronics Engineers (IEEE), Shenzhen, China, 12–14 June 2015; pp. 1–6. [Google Scholar]
- Yan, C. Study on Cold Chain Preservation of Postharvest Strawberry; Shanghai Ocean University: Shanghai, China, 2016. [Google Scholar]
- Li, J.; Huang, W.; Zhao, C.; Zhang, B. A comparative study for the quantitative determination of soluble solids content, pH and firmness of pears by Vis/NIR spectroscopy. J. Food Eng. 2013, 116, 324–332. [Google Scholar] [CrossRef]
- Suhag, Y.; Nanda, V. Optimisation of process parameters to develop nutritionally rich spray-dried honey powder with vitamin C content and antioxidant properties. Int. J. Food Sci. Technol. 2015, 50, 1771–1777. [Google Scholar] [CrossRef]
- Ruiz, B.G.; Roux, S.; Courtois, F.; Bonazzi, C. Spectrophotometric method for fast quantification of ascorbic acid and dehydroascorbic acid in simple matrix for kinetics measurements. Food Chem. 2016, 211, 583–589. [Google Scholar] [CrossRef]
- Da Silva, T.; Aguiar-Oliveira, E.; Mazalli, M.; Kamimura, E.; Maldonado, R. Comparison between titrimetric and spectrophotometric methods for quantification of vitamin C. Food Chem. 2017, 224, 92–96. [Google Scholar] [CrossRef]
- Tian, X.; Li, J.; Wang, Q.; Fan, S.; Huang, W. A bi-layer model for nondestructive prediction of soluble solids content in apple based on reflectance spectra and peel pigments. Food Chem. 2018, 239, 1055–1063. [Google Scholar] [CrossRef]
- Wan, P.; Long, C. An Inspection Method of Rice Milling Degree Based on Machine Vision and Gray-Gradient Co-occurrence Matrix. In Proceedings of the Nonlinear Model Predictive Control; Springer Science and Business Media LLC: Berlin/Heidelberg, Germany, 2011; Volume 344, pp. 195–202. [Google Scholar]
- Hafez, S.F.; Selim, M.M.; Zayed, H.H. 2D Face Recognition System Based on Selected Gabor Filters and Linear Discriminant Analysis LDA. 2015; arXiv:1503.03741. [Google Scholar]
- Poul, A.K.; Shourian, M.; Ebrahimi, H. A Comparative Study of MLR, KNN, ANN and ANFIS Models with Wavelet Transform in Monthly Stream Flow Prediction. Water Resour. Manag. 2019, 33, 2907–2923. [Google Scholar] [CrossRef]
- Travers, S.; Bertelsen, M.G.; Petersen, K.K.; Kucheryavskiy, S. Predicting pear (cv. Clara Frijs) dry matter and soluble solids content with near infrared spectroscopy. LWT 2014, 59, 1107–1113. [Google Scholar] [CrossRef]
- Li, S.; Shan, Y.; Fan, W.; Yin, Y.; Zhou, Z.; Li, G. Analysis of pH and acidity of honey by near infrared spectroscopy based on MCCV outlier detection and CARS variable selection. Food Sci. 2011, 32, 182–185. [Google Scholar]
- Yu, L.; Hong, Y.; Geng, L.; Zhou, Y. Hyperspectral estimation of soil organic matter content based on partial least squares regression. Trans. Chin. Soc. Agr. Eng. 2015, 31, 103–109. [Google Scholar]
- Zhang, N.; Liu, X.; Jin, X.; Li, C.; Wu, X.; Yang, S.; Ning, J.; Yanne, P. Determination of total iron-reactive phenolics, anthocyanins and tannins in wine grapes of skins and seeds based on near-infrared hyperspectral imaging. Food Chem. 2017, 237, 811–817. [Google Scholar] [CrossRef] [PubMed]
- Raza, A.; Zhong, M. Lane-based short-term urban traffic parameters forecasting using multivariate artificial neural network and locally weighted regression models: A genetic approach. Can. J. Civ. Eng. 2019, 46, 371–380. [Google Scholar] [CrossRef]
- Saptoro, A.; Tadé, M.O.; Vuthaluru, H. A Modified Kennard-Stone Algorithm for Optimal Division of Data for Developing Artificial Neural Network Models. Chem. Prod. Process. Model. 2012, 7. [Google Scholar] [CrossRef]
- Fan, S.; Huang, W.; Guo, Z.; Zhang, B.; Zhao, C. Prediction of Soluble Solids Content and Firmness of Pears Using Hyperspectral Reflectance Imaging. Food Anal. Methods 2015, 8, 1936–1946. [Google Scholar] [CrossRef]
- Zhang, D.; Xu, L.; Liang, D.; Xu, C.; Jin, X.; Weng, S. Fast Prediction of Sugar Content in Dangshan Pear (Pyrus spp.) Using Hyperspectral Imagery Data. Food Anal. Methods 2018, 11, 2336–2345. [Google Scholar] [CrossRef]
- Xia, J.; Cao, H.; Yang, Y.; Zhang, W.; Wan, Q.; Xu, L.; Ge, D.; Zhang, W.; Ke, Y.; Huang, B. Detection of waterlogging stress based on hyperspectral images of oilseed rape leaves (Brassica napus L.). Comput. Electron. Agric. 2019, 159, 59–68. [Google Scholar] [CrossRef]
- Li, J.; Huang, W.; Chen, L.; Fan, S.; Zhang, B.; Guo, Z.; Zhao, C. Variable Selection in Visible and Near-Infrared Spectral Analysis for Noninvasive Determination of Soluble Solids Content of ‘Ya’ Pear. Food Anal. Methods 2014, 7, 1891–1902. [Google Scholar] [CrossRef]
- Yan, L.; Xiong, C.; Qu, H.; Liu, C.; Chen, W.; Zheng, L. Non-destructive determination and visualisation of insoluble and soluble dietary fibre contents in fresh-cut celeries during storage periods using hyperspectral imaging technique. Food Chem. 2017, 228, 249–256. [Google Scholar] [CrossRef]
- Shen, J.; Qi, H.; Li, C.; Zeng, S.; Deng, C. Experimental on storage and preservation of strawberry. Food Sci. Tech. 2011, 36, 48–51. [Google Scholar]
- Li, Q.; Ge, H.; Zhang, G.; Jin, L.; Zhang, J. The study on the changes of nutrition composition in growth and maturation of strawberry fruit. J. Agr. Univ. Hebei 2002, 25, 46–48. [Google Scholar]
- Li, L.; Yang, L.; Yang, L.; Hao, B. Study on growth rhythm and changes of main nutrients of strawberry fruit. Acta Agr. Jiangxi 2006, 18, 67–70. [Google Scholar]


| Parameters | Calibration | Prediction | ||||
|---|---|---|---|---|---|---|
| Mean | SD | Range | Mean | SD | Range | |
| SSC (%) | 6.7734 | 0.8642 | 3.4–8.4 | 6.9668 | 0.9126 | 4.4–8.0 |
| pH | 3.0605 | 0.1347 | 2.68–3.33 | 3.0585 | 0.1290 | 2.75–3.26 |
| VC (g kg−1) | 0.6383 | 0.0706 | 0.4745–0.8421 | 0.6265 | 0.0673 | 0.4780–0.7832 |
| Parameters | Methods | Pretreatment | Rc2 | RMSEC | Rp2 | RMSEP |
|---|---|---|---|---|---|---|
| SSC | PLSR | Raw | 0.9769 | 0.0657 | 0.9044 | 0.1411 |
| WT | 0.9776 | 0.0647 | 0.9182 | 0.1305 | ||
| MSC | 0.9530 | 0.0971 | 0.8656 | 0.1465 | ||
| SVR | Raw | 0.8772 | 0.1630 | 0.7867 | 0.2279 | |
| WT | 0.8600 | 0.1763 | 0.7748 | 0.2346 | ||
| MSC | 0.8059 | 0.2171 | 0.7666 | 0.2426 | ||
| LWR | Raw | 0.9999 | 0.0040 | 0.8850 | 0.1548 | |
| WT | 0.9999 | 0.0007 | 0.9364 | 0.1151 | ||
| MSC | 0.9999 | 0.0104 | 0.8325 | 0.1635 | ||
| pH | PLSR | Raw | 0.9429 | 0.0322 | 0.8230 | 0.0543 |
| WT | 0.9488 | 0.0305 | 0.8048 | 0.0570 | ||
| MSC | 0.9131 | 0.0405 | 0.7162 | 0.0617 | ||
| SVR | Raw | 0.9497 | 0.0303 | 0.8060 | 0.0588 | |
| WT | 0.9286 | 0.0362 | 0.7771 | 0.0669 | ||
| MSC | 0.7435 | 0.0698 | 0.6598 | 0.0680 | ||
| LWR | Raw | 0.9819 | 0.0181 | 0.8493 | 0.0501 | |
| WT | 0.9978 | 0.0063 | 0.8399 | 0.0516 | ||
| MSC | 0.8530 | 0.0527 | 0.8237 | 0.0587 | ||
| VC | PLSR | Raw | 0.9698 | 0.0123 | 0.8216 | 0.0284 |
| WT | 0.9587 | 0.0143 | 0.8245 | 0.0282 | ||
| MSC | 0.9221 | 0.0182 | 0.8007 | 0.0318 | ||
| SVR | Raw | 0.9628 | 0.0139 | 0.8035 | 0.0301 | |
| WT | 0.9494 | 0.0162 | 0.8204 | 0.0286 | ||
| MSC | 0.9243 | 0.0180 | 0.8415 | 0.0247 | ||
| LWR | Raw | 0.9912 | 0.0066 | 0.7841 | 0.0313 | |
| WT | 0.9998 | 0.0011 | 0.8144 | 0.0290 | ||
| MSC | 0.9504 | 0.0145 | 0.8091 | 0.0295 |
| Parameters | Methods | Features | Rc2 | RMSEC | Rp2 | RMSEP |
|---|---|---|---|---|---|---|
| SSC | PLSR | Spectroscopy + color | 0.9800 | 0.0611 | 0.9370 | 0.1145 |
| Spectroscopy + texture | 0.9951 | 0.0259 | 0.9299 | 0.1599 | ||
| Spectroscopy + color + texture | 0.9984 | 0.0146 | 0.8746 | 0.2139 | ||
| SVR | Spectroscopy + color | 0.9351 | 0.1104 | 0.8968 | 0.1498 | |
| Spectroscopy + texture | 0.8862 | 0.1612 | 0.7866 | 0.2282 | ||
| Spectroscopy + color + texture | 0.9226 | 0.1243 | 0.8987 | 0.1541 | ||
| LWR | Spectroscopy + color | 0.9998 | 0.0057 | 0.9294 | 0.1212 | |
| Spectroscopy + texture | 0.9999 | 0.0009 | 0.9172 | 0.1313 | ||
| Spectroscopy + color + texture | 0.9993 | 0.0112 | 0.9106 | 0.1365 | ||
| pH | PLSR | Spectroscopy + color | 0.9618 | 0.0263 | 0.8230 | 0.0543 |
| Spectroscopy + texture | 0.9822 | 0.0181 | 0.7110 | 0.0674 | ||
| Spectroscopy + color + texture | 0.9831 | 0.0176 | 0.7087 | 0.0677 | ||
| SVR | Spectroscopy + color | 0.9385 | 0.0341 | 0.8281 | 0.0562 | |
| Spectroscopy + texture | 0.9392 | 0.0333 | 0.7879 | 0.0638 | ||
| Spectroscopy + color + texture | 0.9307 | 0.0355 | 0.7879 | 0.0632 | ||
| LWR | Spectroscopy + color | 0.9682 | 0.0236 | 0.8404 | 0.0515 | |
| Spectroscopy + texture | 0.9701 | 0.0233 | 0.8343 | 0.0525 | ||
| Spectroscopy + color + texture | 0.9687 | 0.0239 | 0.8401 | 0.0516 | ||
| VC | PLSR | Spectroscopy + color | 0.9685 | 0.0125 | 0.8039 | 0.0298 |
| Spectroscopy + texture | 0.9567 | 0.0138 | 0.8769 | 0.0279 | ||
| Spectroscopy + color + texture | 0.9515 | 0.0147 | 0.8423 | 0.0315 | ||
| SVR | Spectroscopy + color | 0.9533 | 0.0155 | 0.7843 | 0.0312 | |
| Spectroscopy + texture | 0.9285 | 0.0193 | 0.8253 | 0.0275 | ||
| Spectroscopy + color + texture | 0.9070 | 0.0217 | 0.7718 | 0.0322 | ||
| LWR | Spectroscopy + color | 0.9907 | 0.0068 | 0.7651 | 0.0326 | |
| Spectroscopy + texture | 0.9896 | 0.0071 | 0.8444 | 0.0271 | ||
| Spectroscopy + color + texture | 0.9950 | 0.0050 | 0.7708 | 0.0322 |
| Variable Selection | Parameters | Methods | Features | Variables | Rc2 | RMSEC | Rp2 | RMSEP |
|---|---|---|---|---|---|---|---|---|
| CARS | SSC | PLSR | Spectroscopy + color | 59 + 3 | 0.9445 | 0.1076 | 0.9431 | 0.0895 |
| pH | LWR | Spectroscopy | 45 | 0.9934 | 0.0447 | 0.8858 | 0.0108 | |
| VC | PLSR | Spectroscopy + texture | 27 + 23 | 0.9228 | 0.0185 | 0.9109 | 0.0237 | |
| UVE | SSC | PLSR | Spectroscopy + color | 46 + 3 | 0.9541 | 0.0959 | 0.8716 | 0.1432 |
| pH | LWR | Spectroscopy | 57 | 0.8783 | 0.0554 | 0.7859 | 0.0474 | |
| VC | PLSR | Spectroscopy + texture | 31 + 28 | 0.9591 | 0.0134 | 0.9102 | 0.0251 |
© 2020 by the authors. Licensee MDPI, Basel, Switzerland. This article is an open access article distributed under the terms and conditions of the Creative Commons Attribution (CC BY) license (http://creativecommons.org/licenses/by/4.0/).
Share and Cite
Weng, S.; Yu, S.; Guo, B.; Tang, P.; Liang, D. Non-Destructive Detection of Strawberry Quality Using Multi-Features of Hyperspectral Imaging and Multivariate Methods. Sensors 2020, 20, 3074. https://doi.org/10.3390/s20113074
Weng S, Yu S, Guo B, Tang P, Liang D. Non-Destructive Detection of Strawberry Quality Using Multi-Features of Hyperspectral Imaging and Multivariate Methods. Sensors. 2020; 20(11):3074. https://doi.org/10.3390/s20113074
Chicago/Turabian StyleWeng, Shizhuang, Shuan Yu, Binqing Guo, Peipei Tang, and Dong Liang. 2020. "Non-Destructive Detection of Strawberry Quality Using Multi-Features of Hyperspectral Imaging and Multivariate Methods" Sensors 20, no. 11: 3074. https://doi.org/10.3390/s20113074
APA StyleWeng, S., Yu, S., Guo, B., Tang, P., & Liang, D. (2020). Non-Destructive Detection of Strawberry Quality Using Multi-Features of Hyperspectral Imaging and Multivariate Methods. Sensors, 20(11), 3074. https://doi.org/10.3390/s20113074


