Experimental Investigation of Ground Radiation on Dielectric and Brightness Temperature of Soil Moisture and Soil Salinity


 ,
,
Abstract
1. Introduction
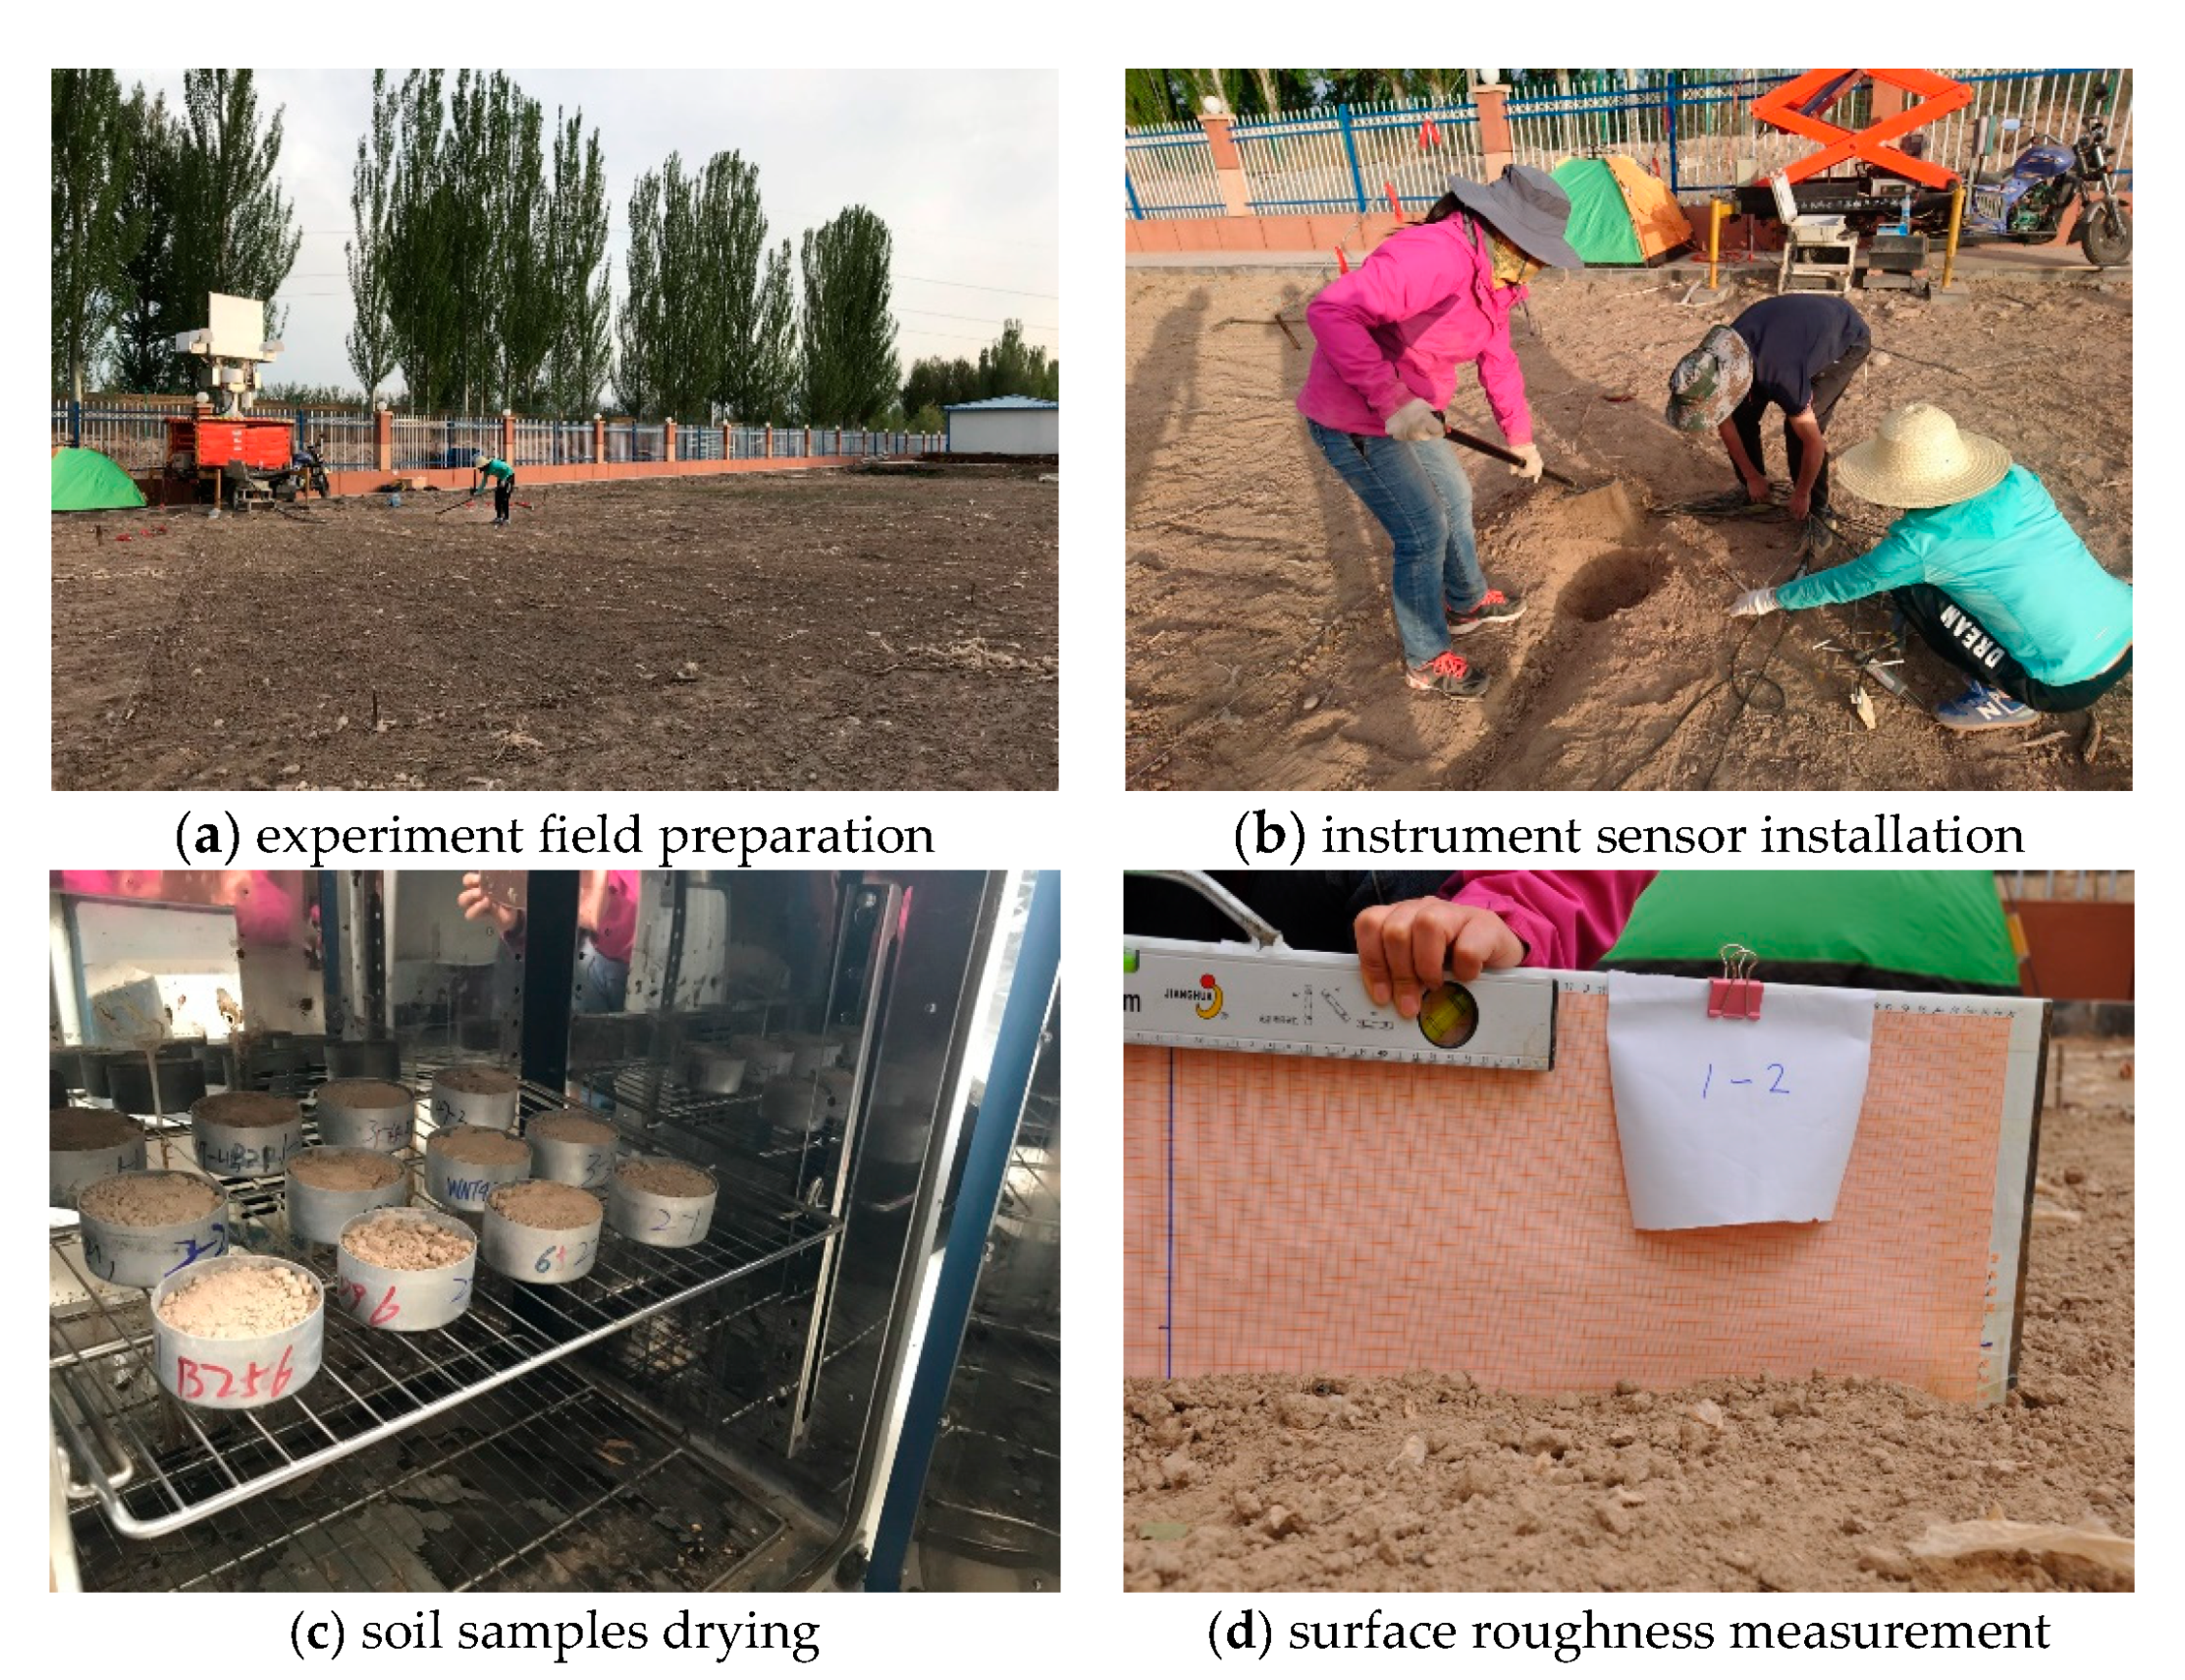
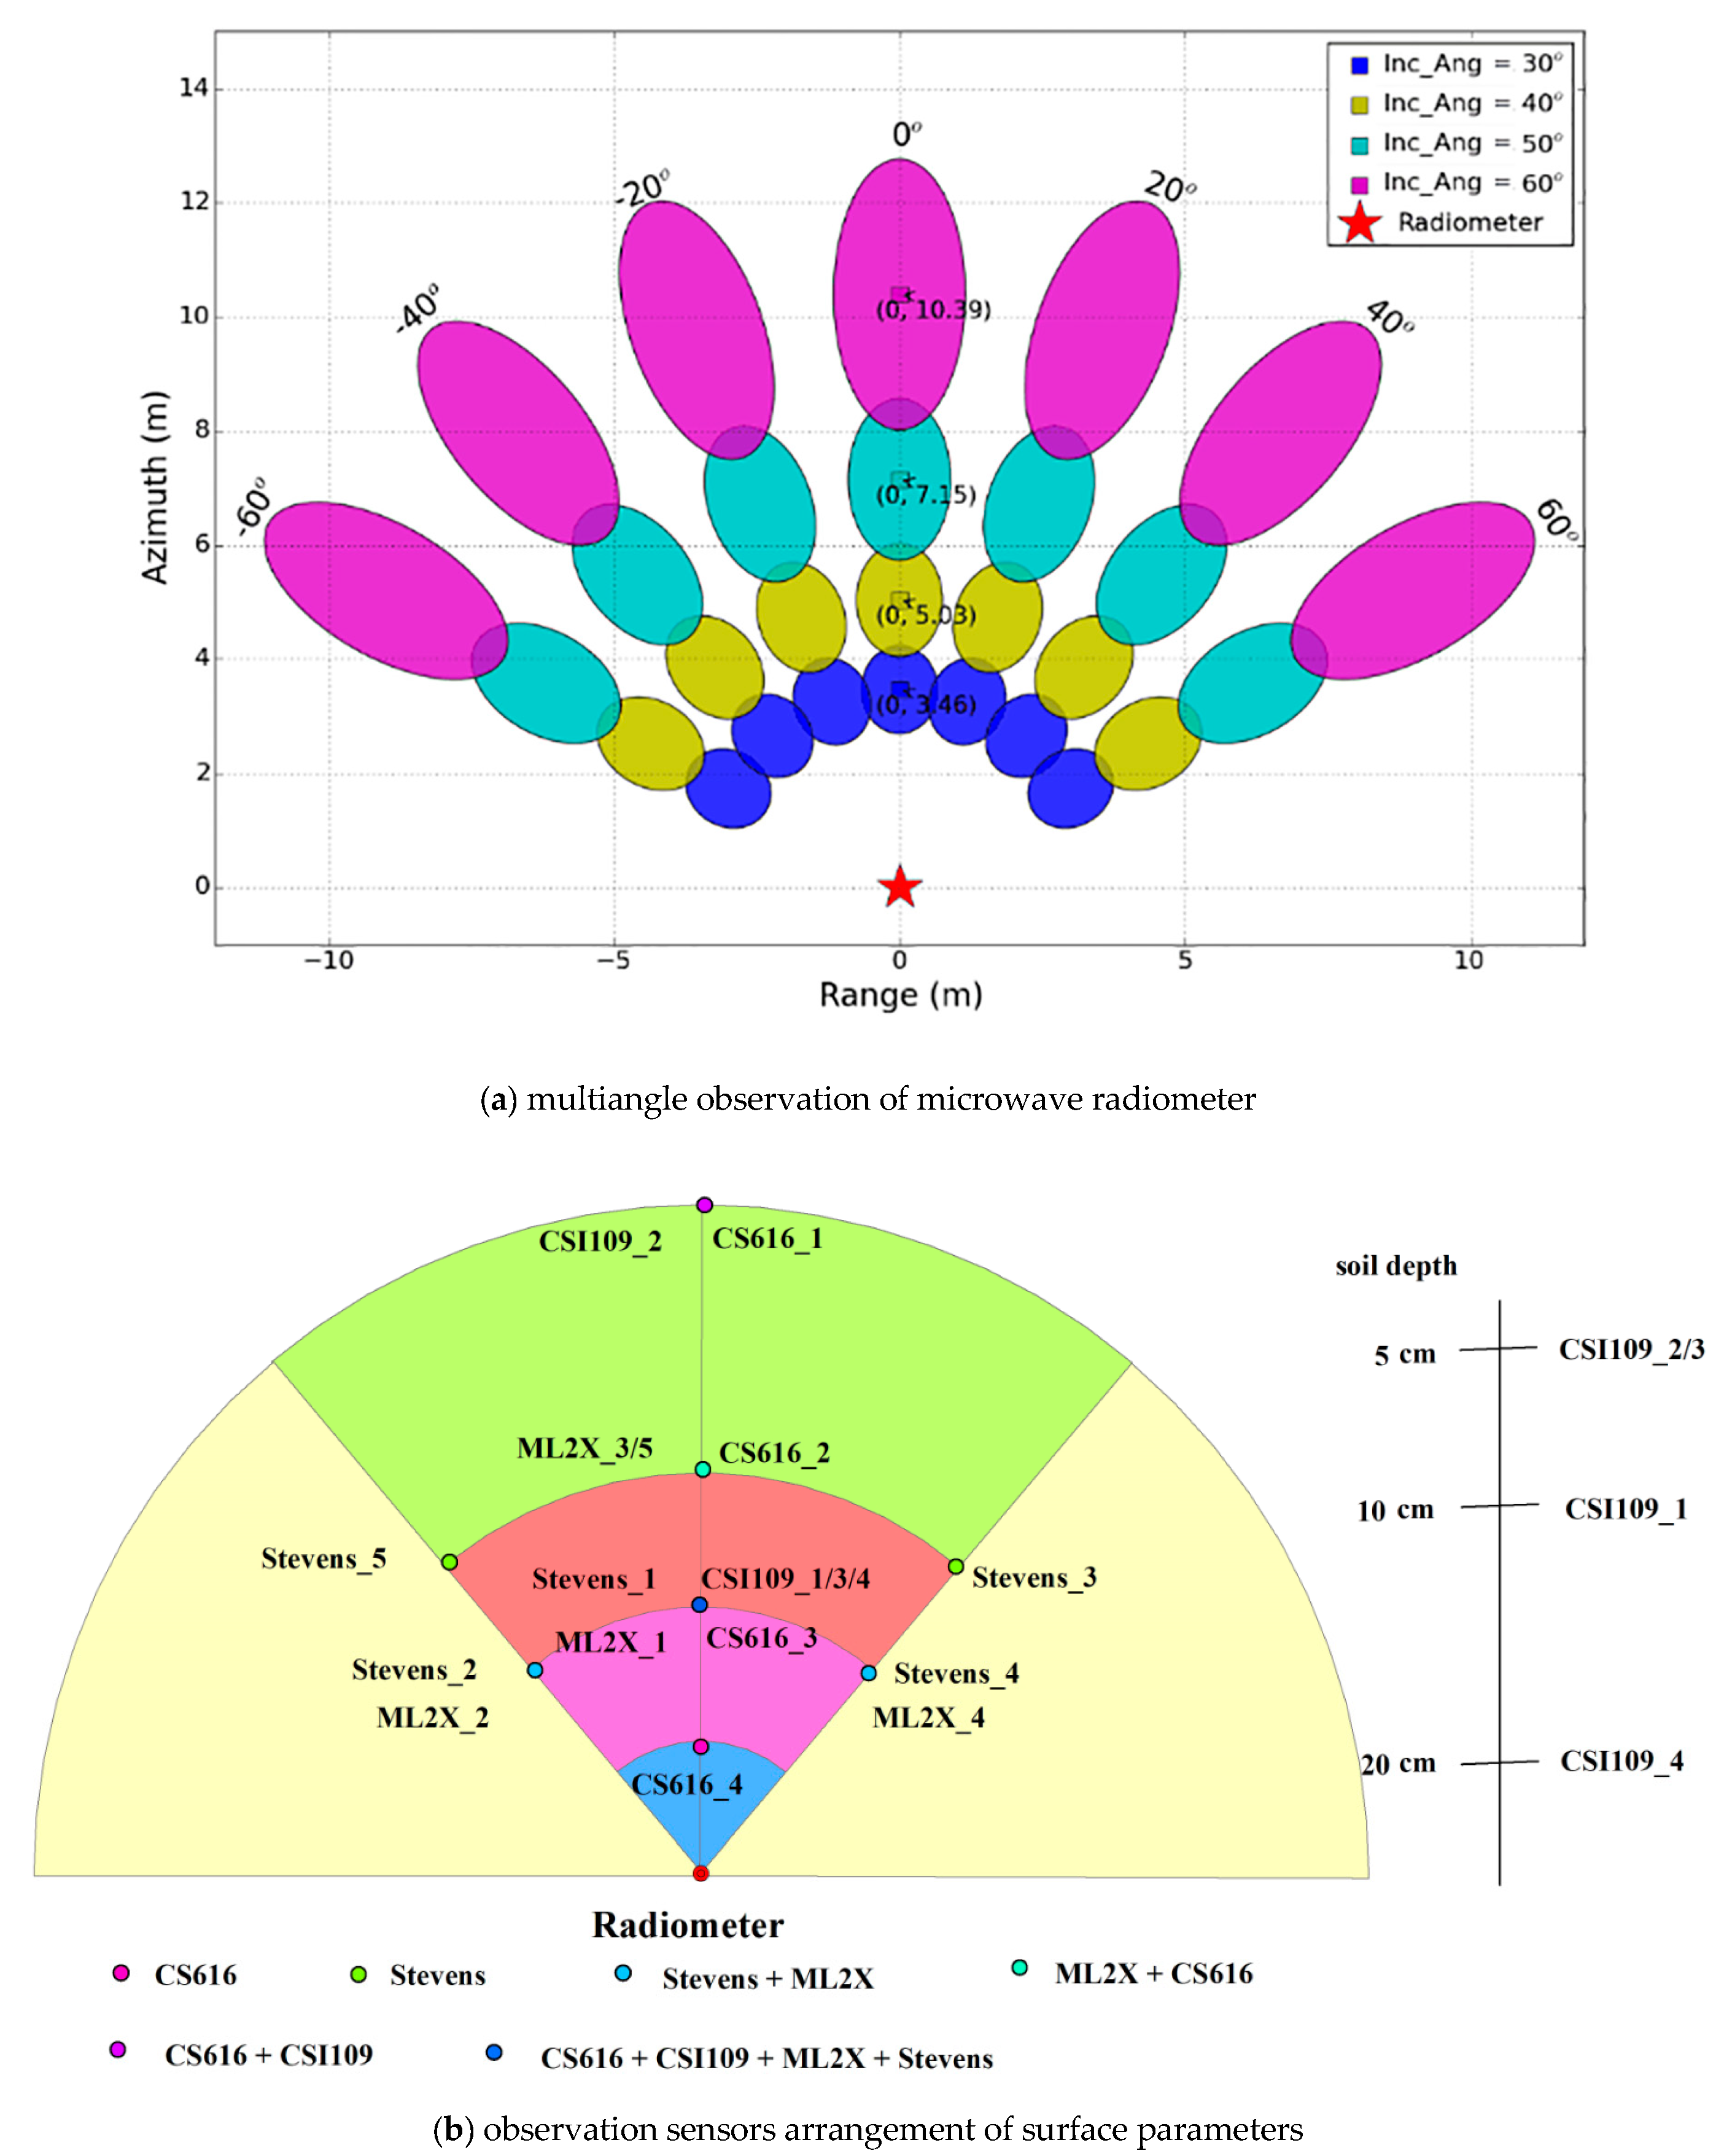
2. Materials
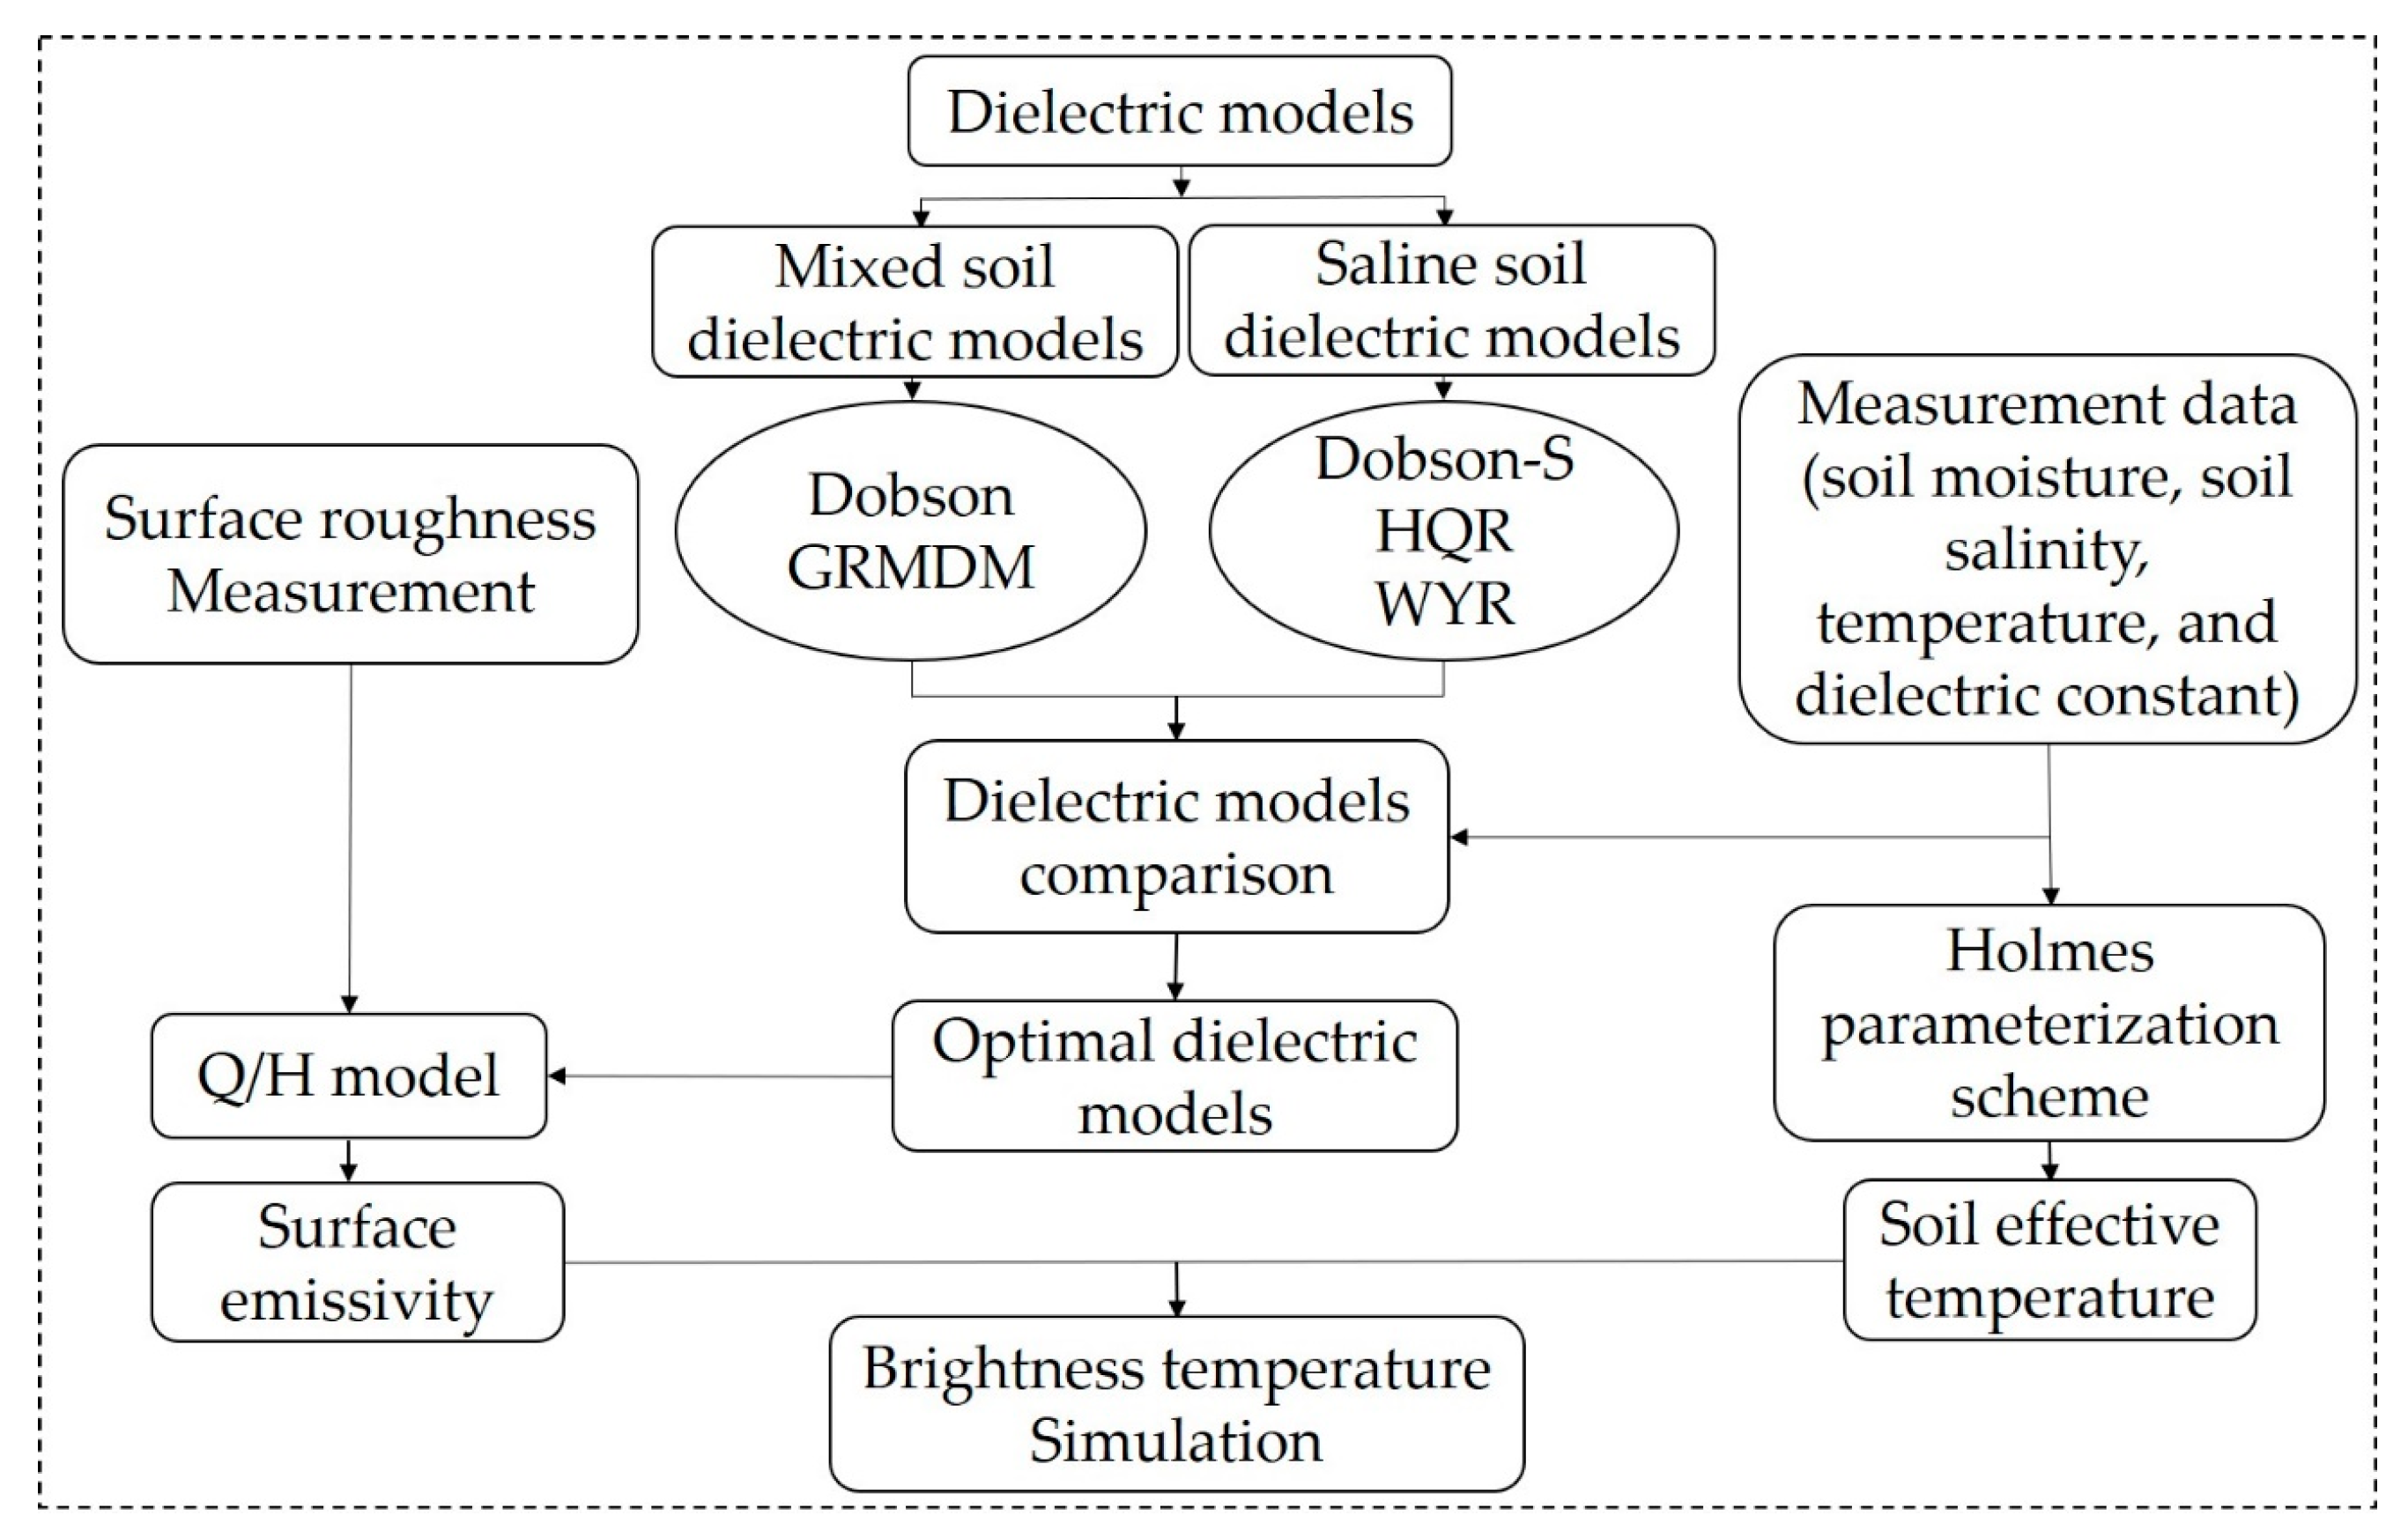
3. Methods
3.1. Soil Dielectric Model
3.1.1. Dielectric Model of Non-Saline-Alkali Soil
Dobson Model
GRMDM Model
3.1.2. Dielectric Model of Saline-Alkali Soil
Dobson-S Model
HQR Model
WYR Model
3.2. Emissivity Model of Rough Surface
3.3. Soil Effective Temperature
3.4. Brightness Temperature Simulation
4. Results
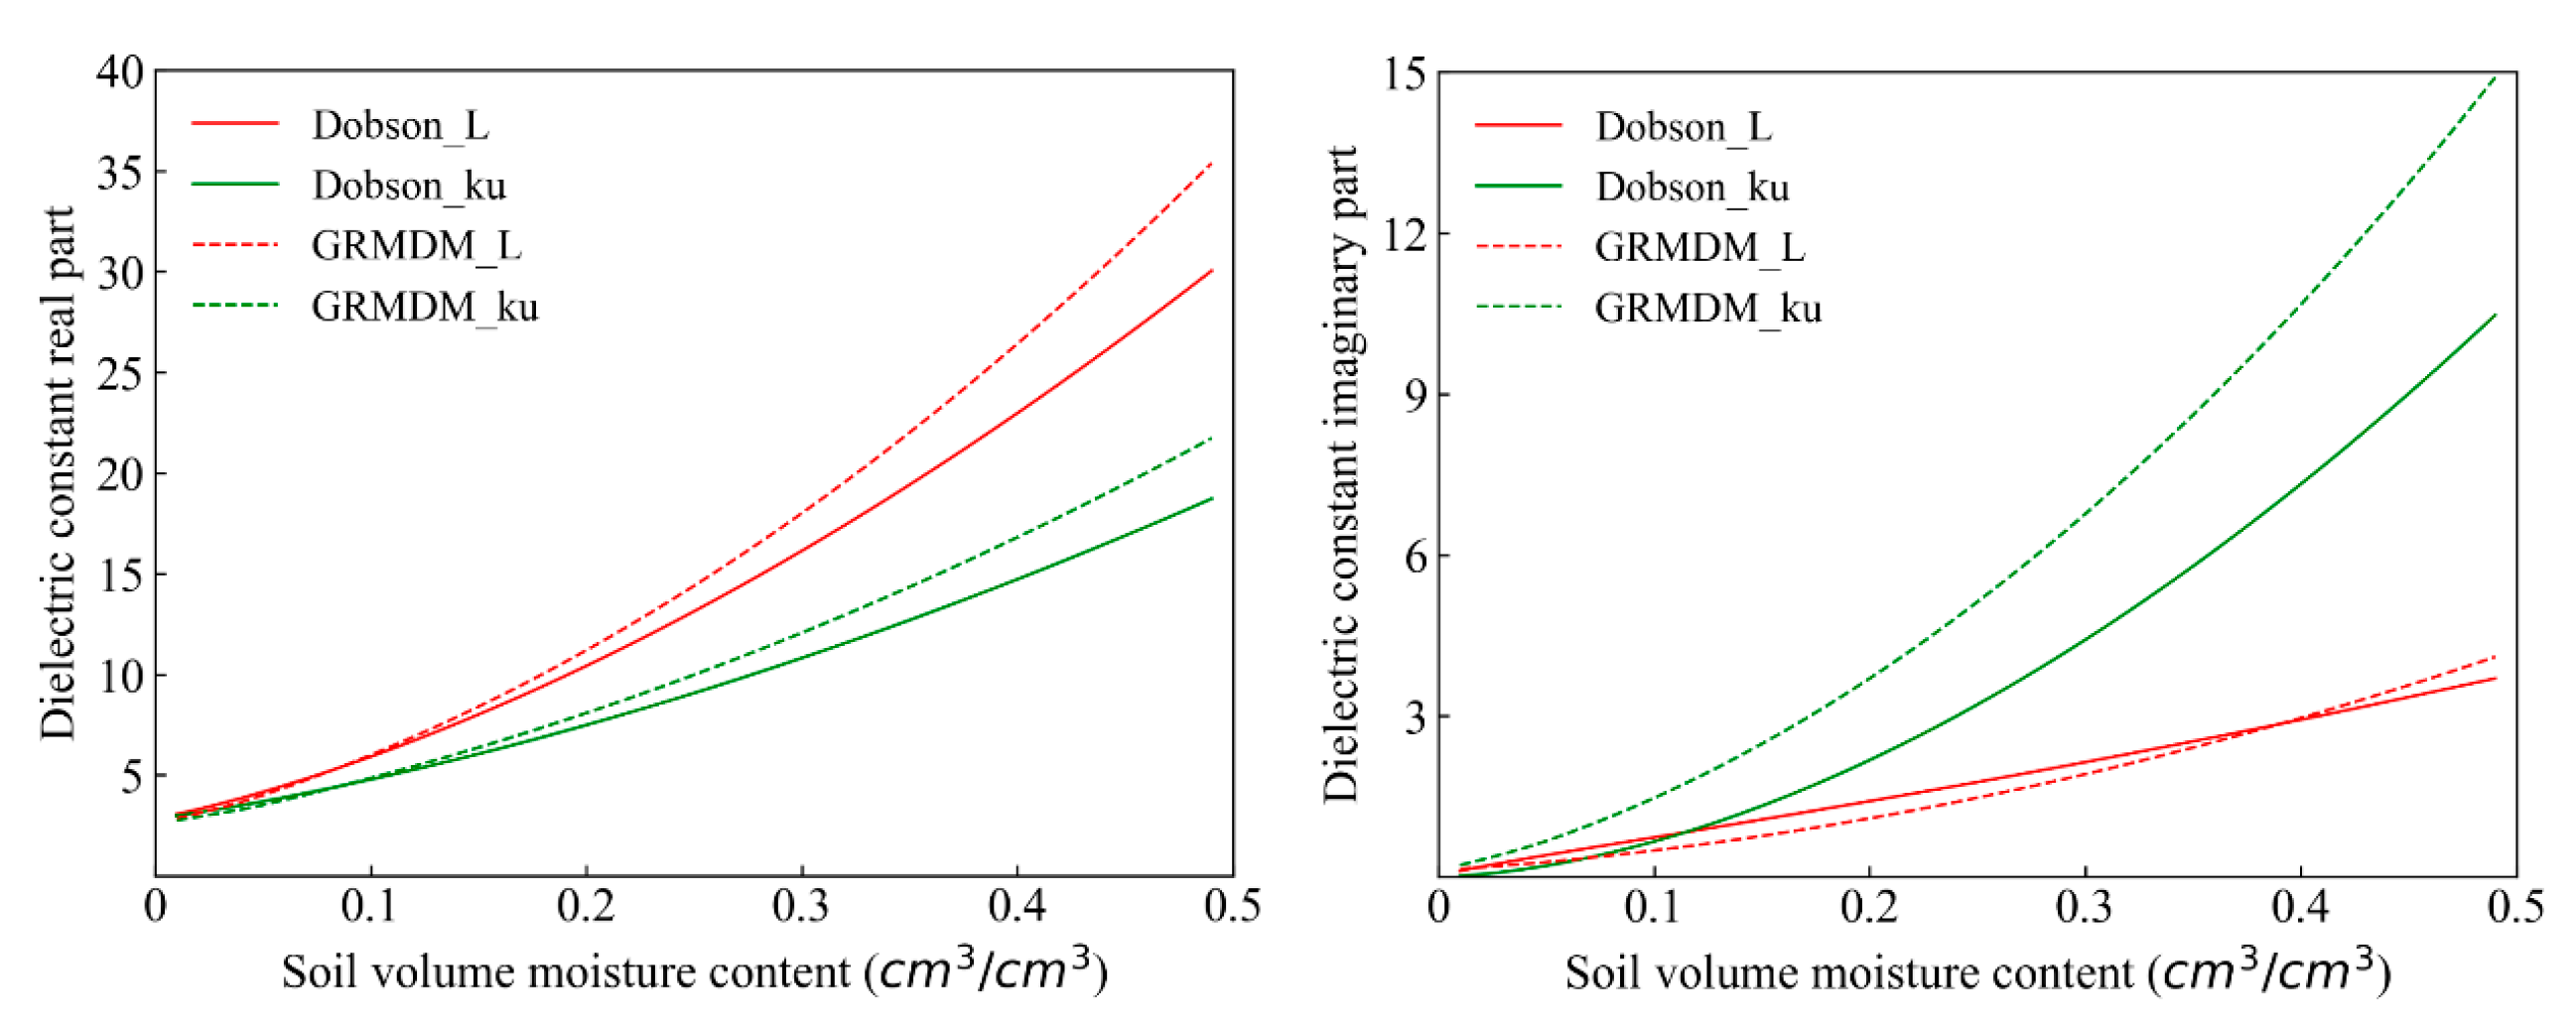
4.1. Dielectric Constant Comparison of Non-Saline-Alkali Soil
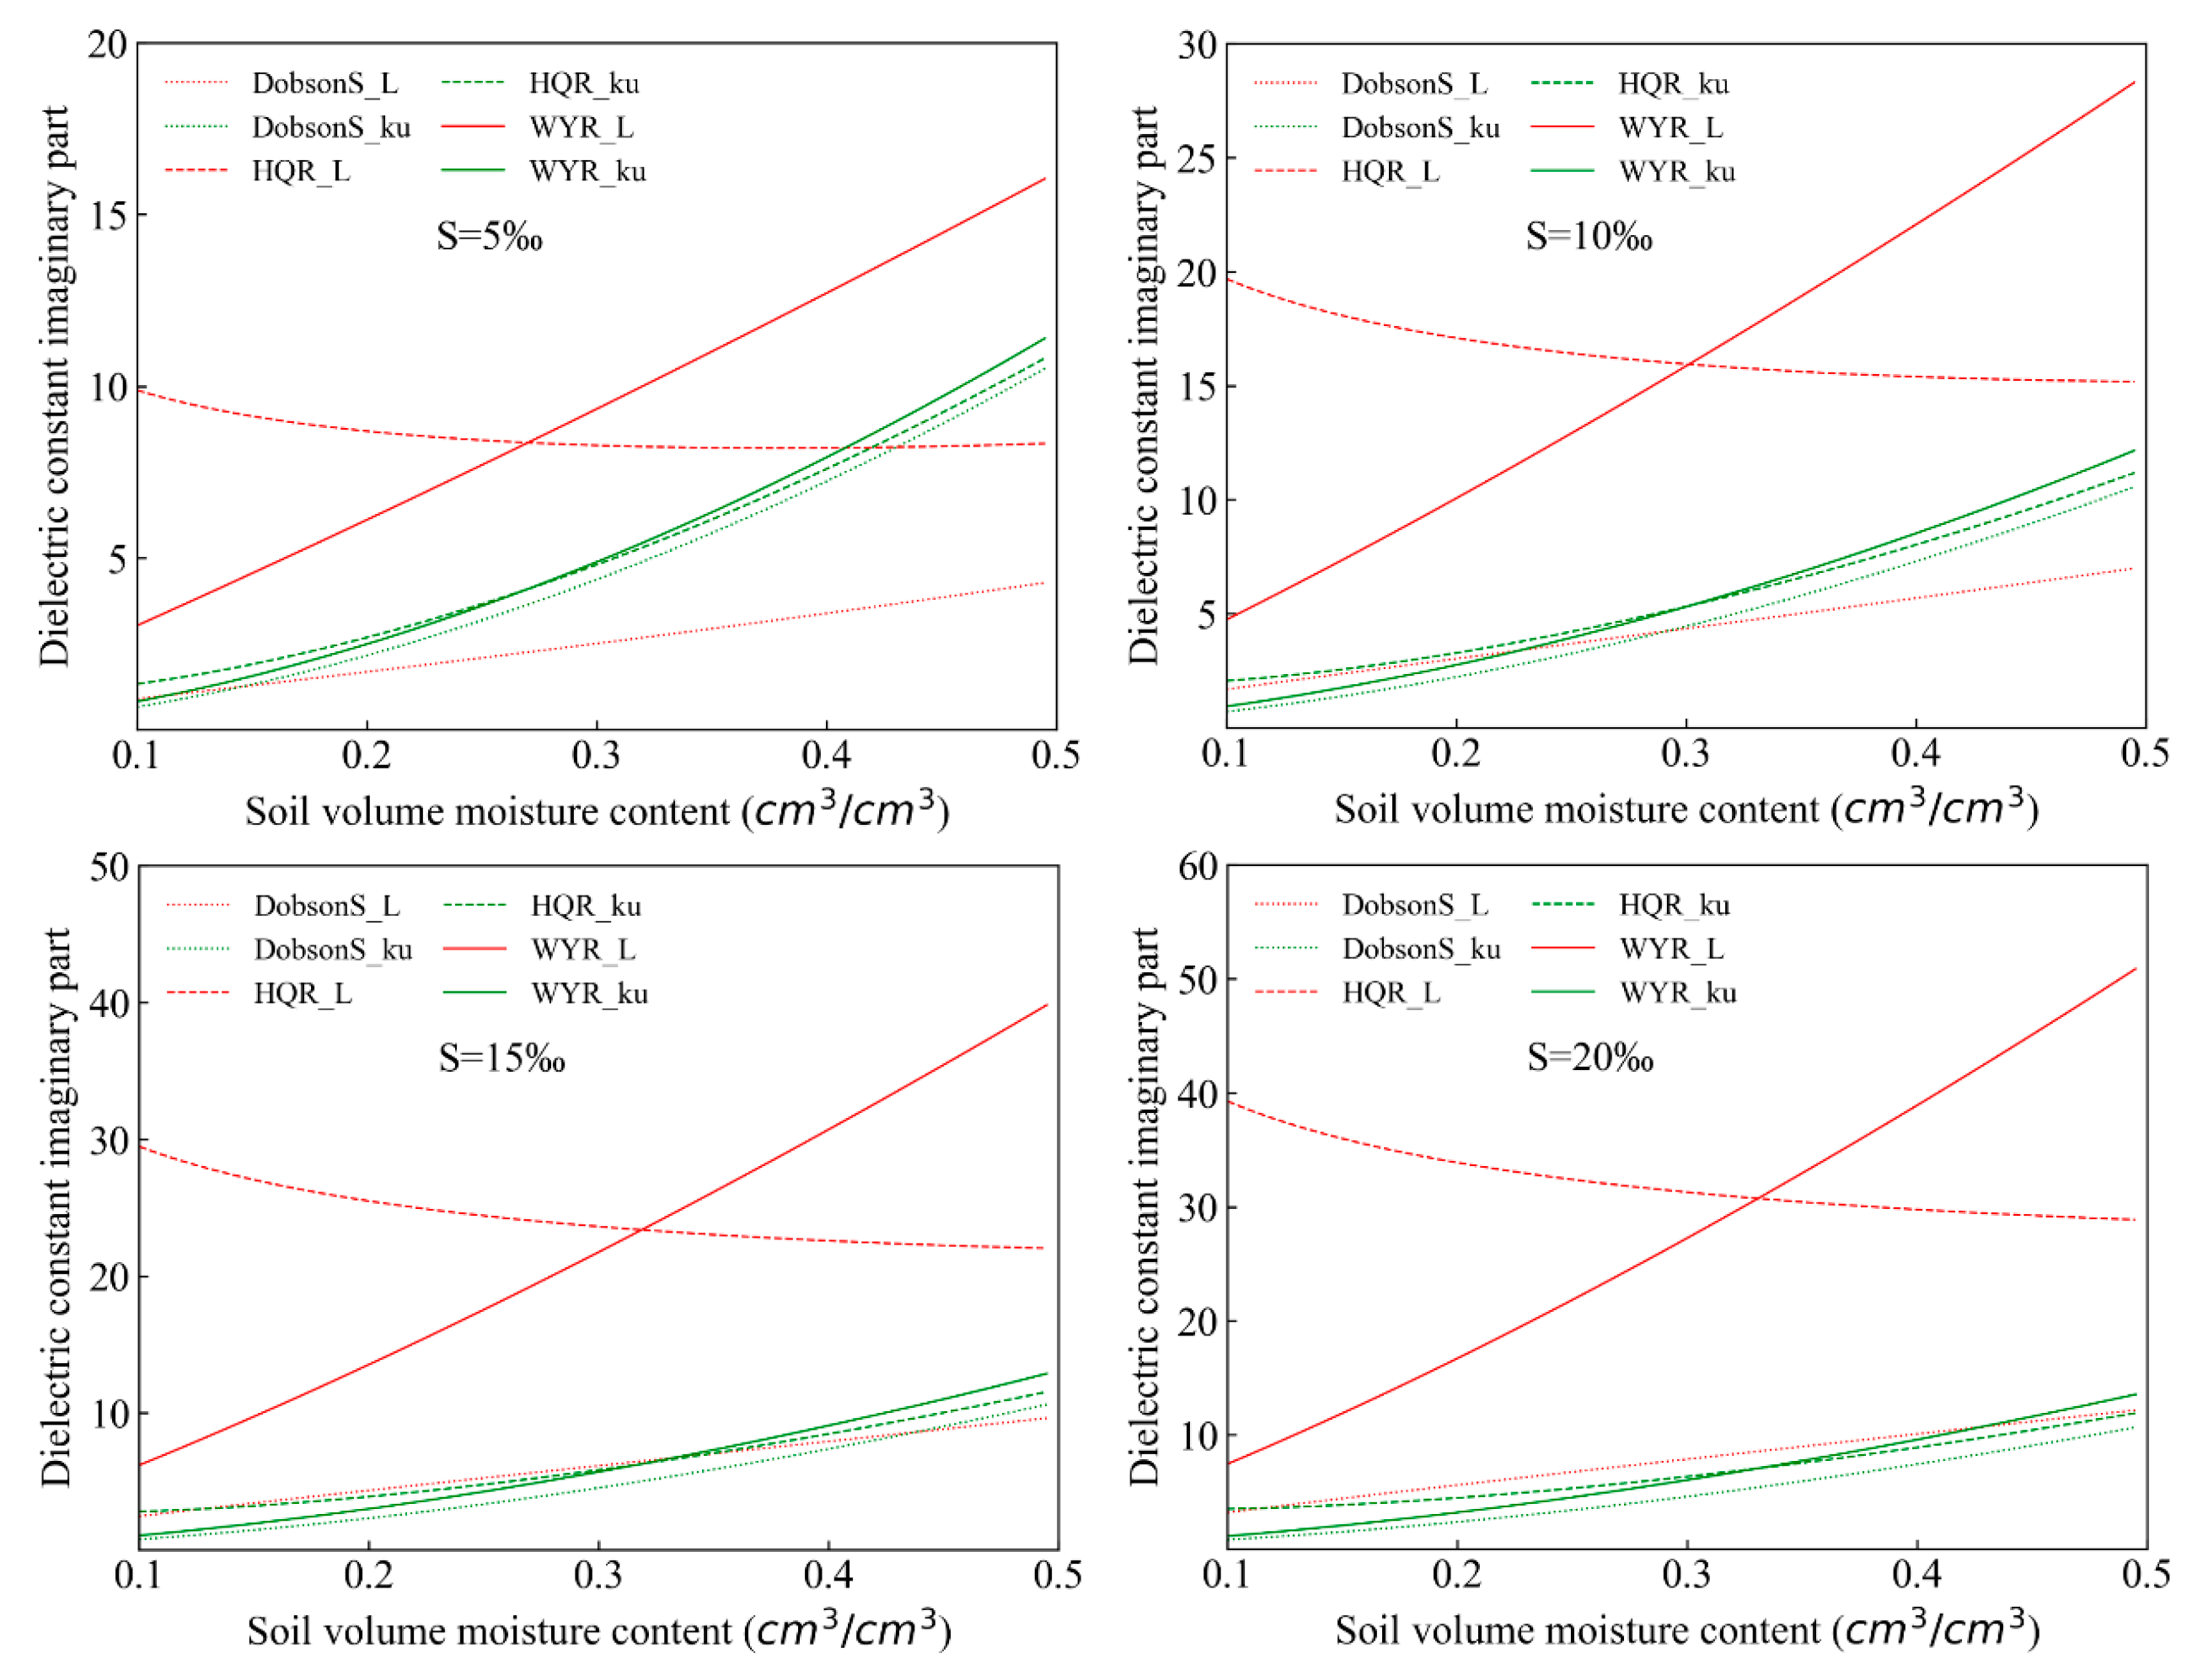
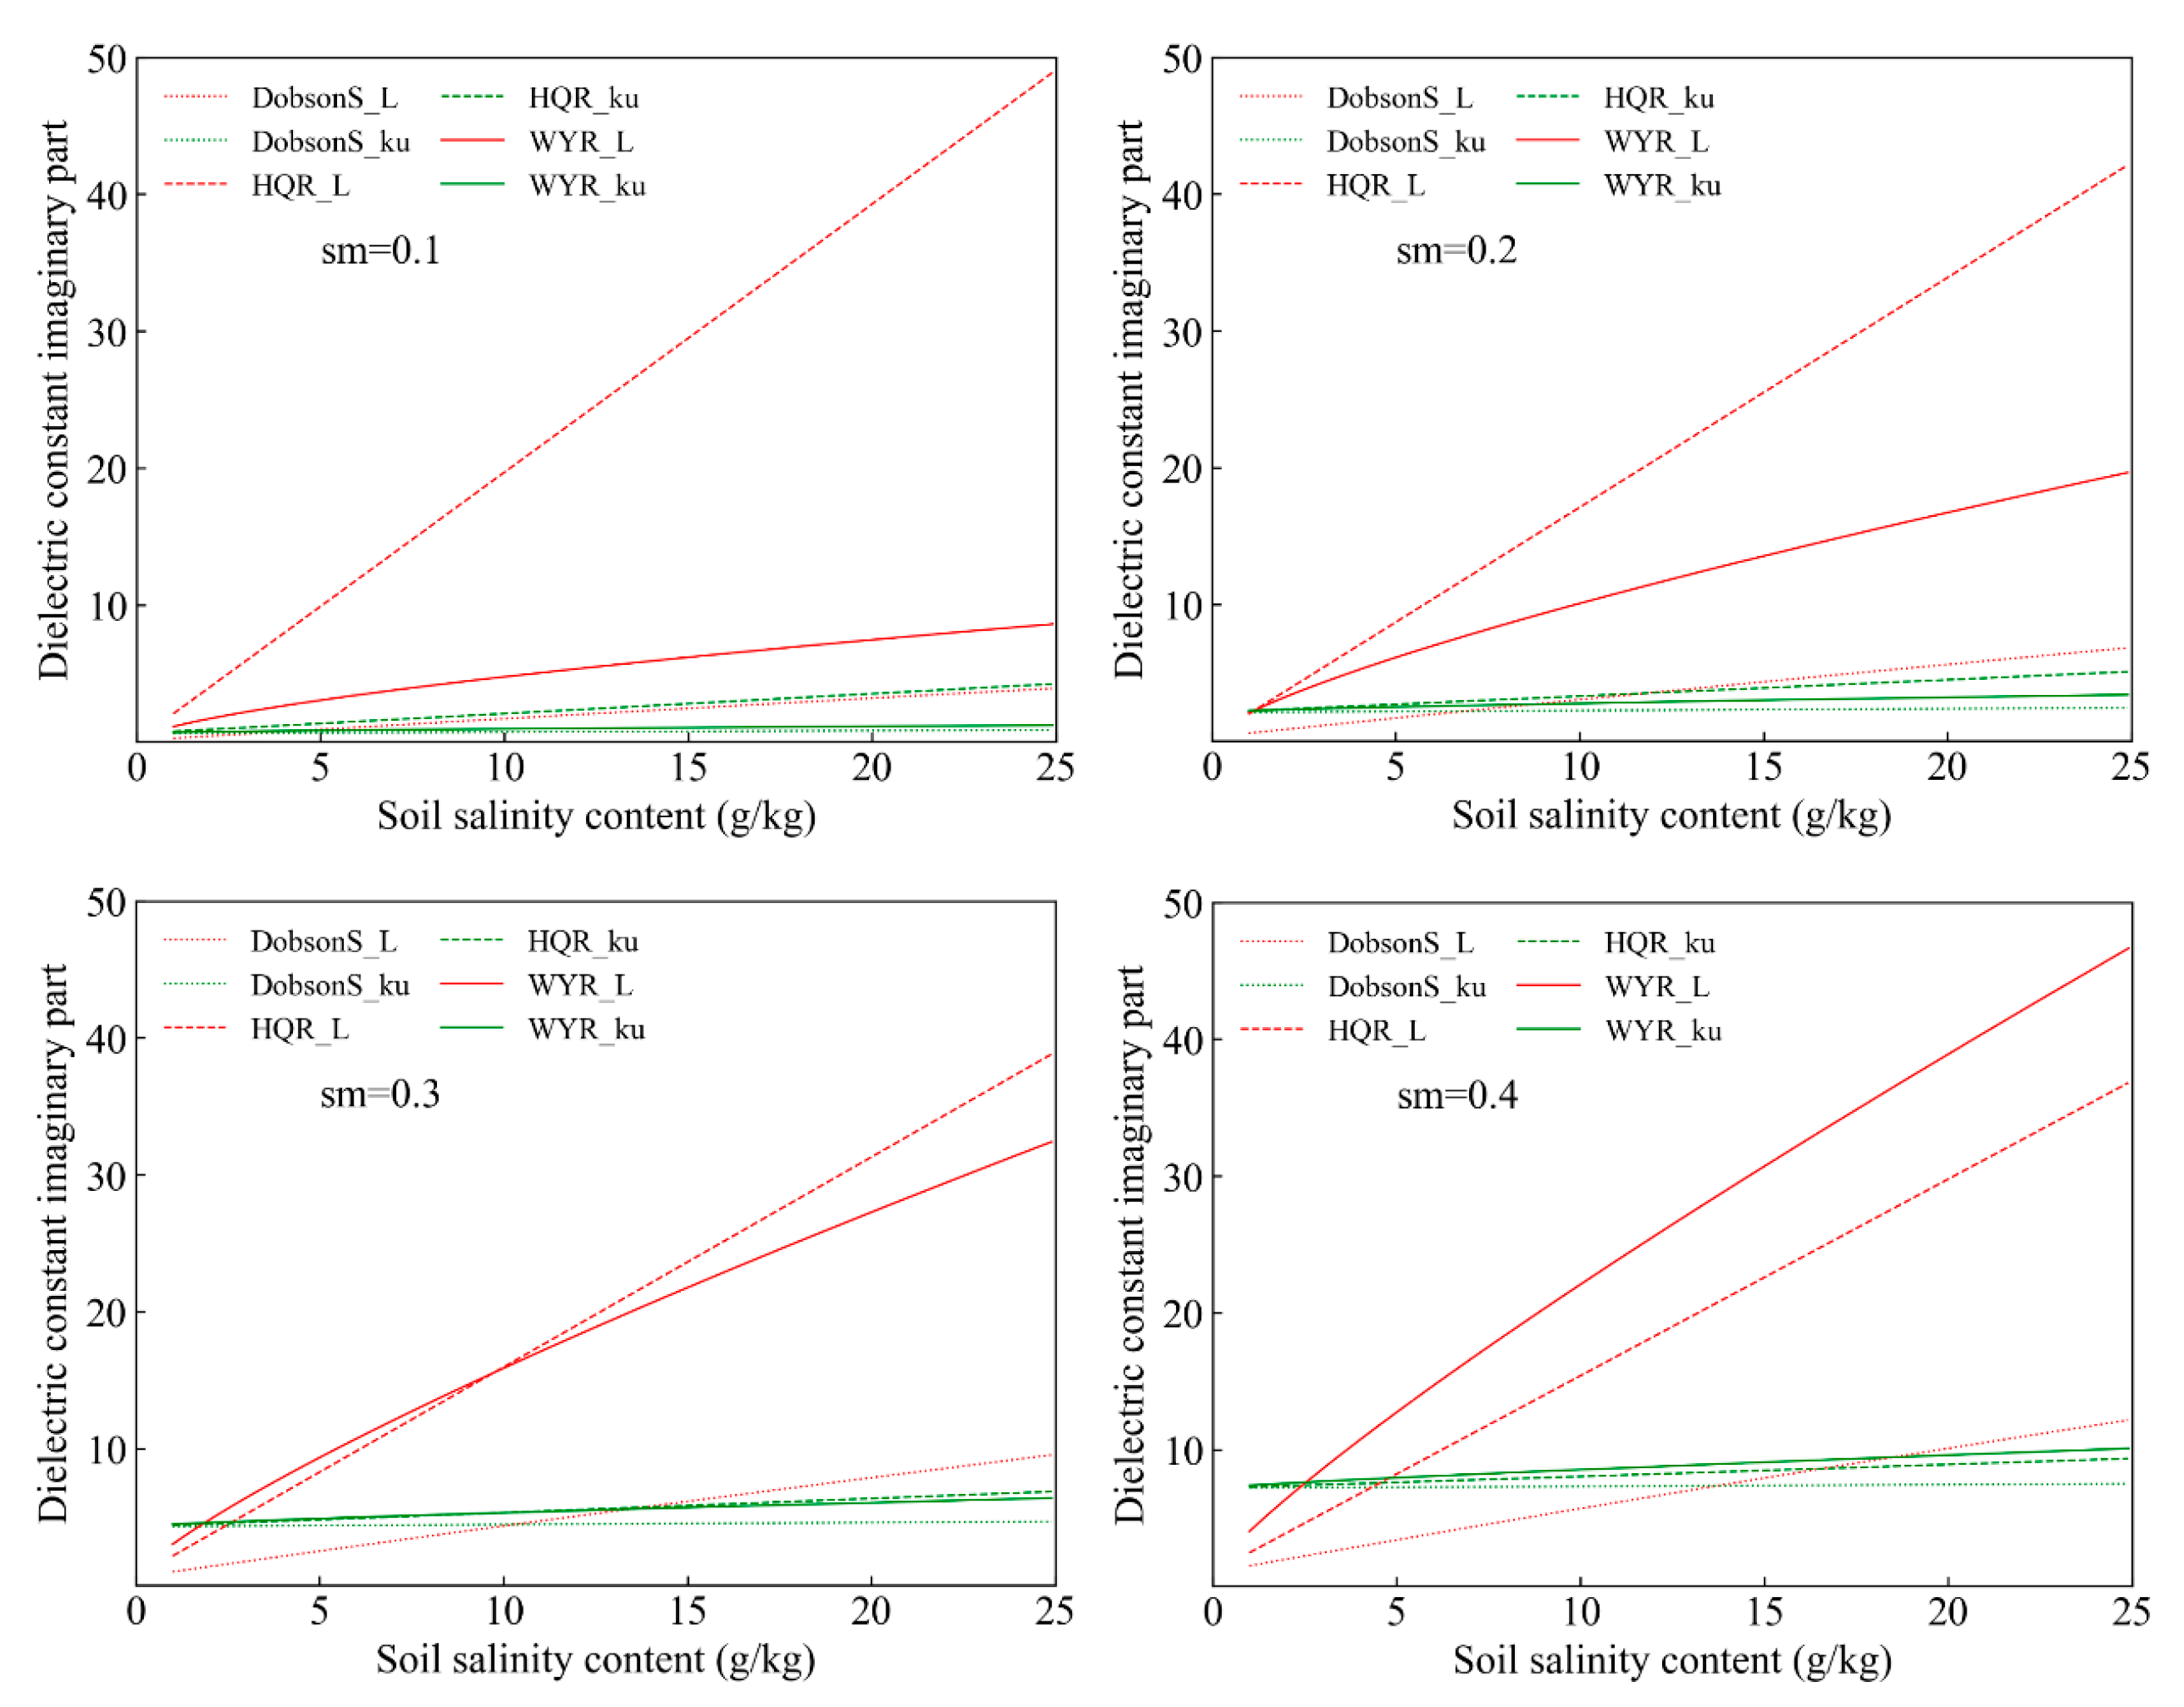
4.2. Dielectric Constant Comparison of the Saline-Alkali Soil
4.3. Brightness Temperature Simulation of the Non-Saline-Alkali Soil
4.4. Brightness Temperature Simulation of the Multilevel Saline-Alkali Soil
5. Discussion
6. Conclusions
- Both the Dobson model and GRMDM model can simulate the real part and imaginary part of dielectric constant well in the mixed soil, but the simulated error of the GRMDM model was smaller. Therefore, the GRMDM model was introduced to simulate the brightness temperature of non-saline soil in the L (1.4 GHz) band.
- There are obvious differences in the dielectric models of the saline-alkali soil, and the disadvantage exists in each model. The simulated error of the Dobson-S model, HQR model, and WYR model increased as the frequency increased. The simulated result of the WYR model in the L (1.4 GHz) band was better than that of the Dobson-S model and HQR model. Therefore, the WYR model was used to simulate the brightness temperature of the multilevel saline soil.
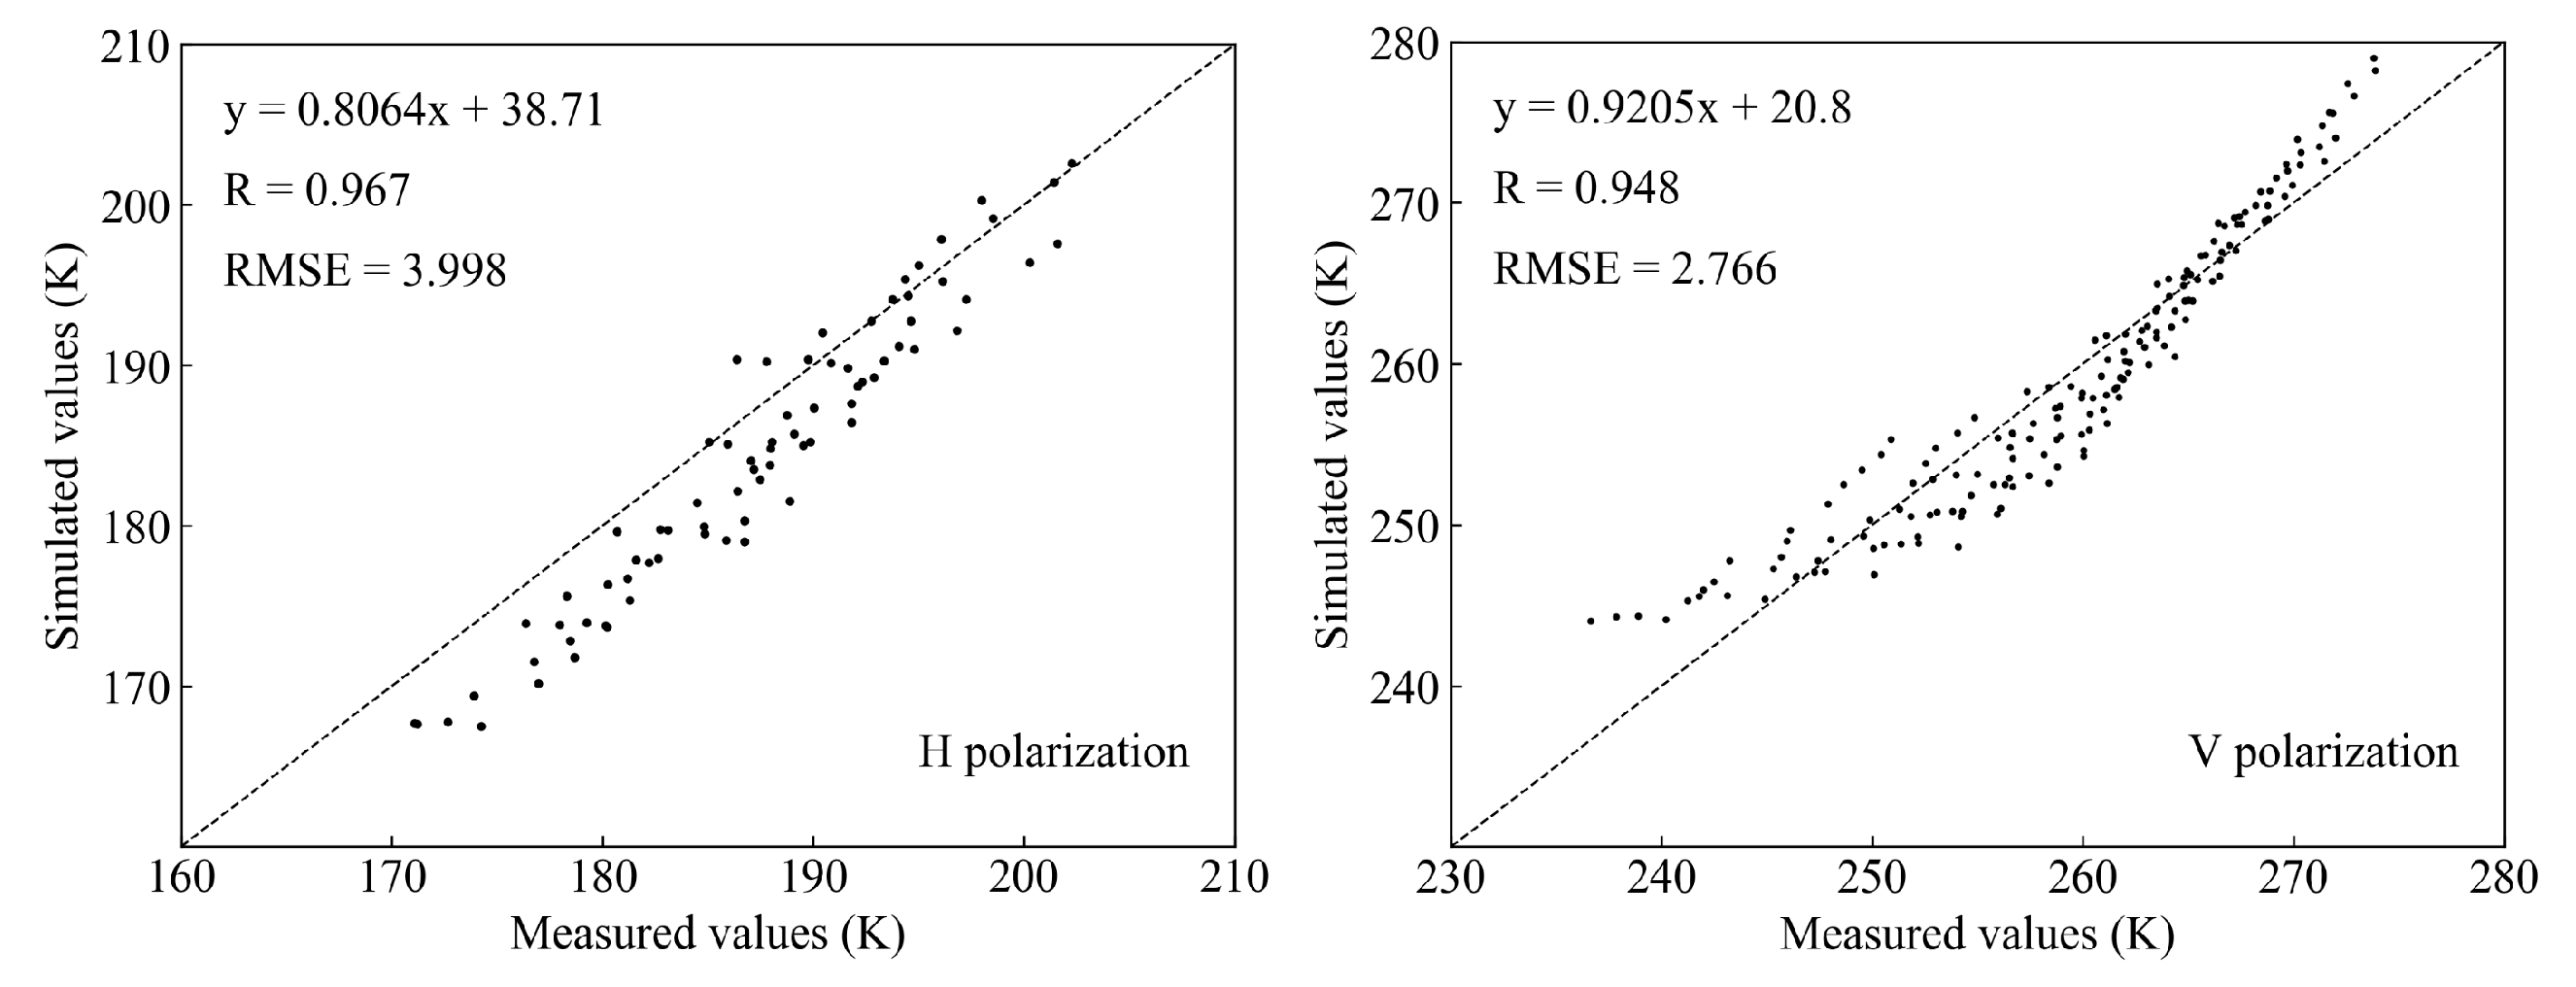
- The simulated result of the brightness temperature of soil moisture presented a high correlation, and the correlation coefficients of H polarization and V polarization were 0.967 and 0948, respectively, and the RMSEs were 3.998 K and 2.766 K, respectively.
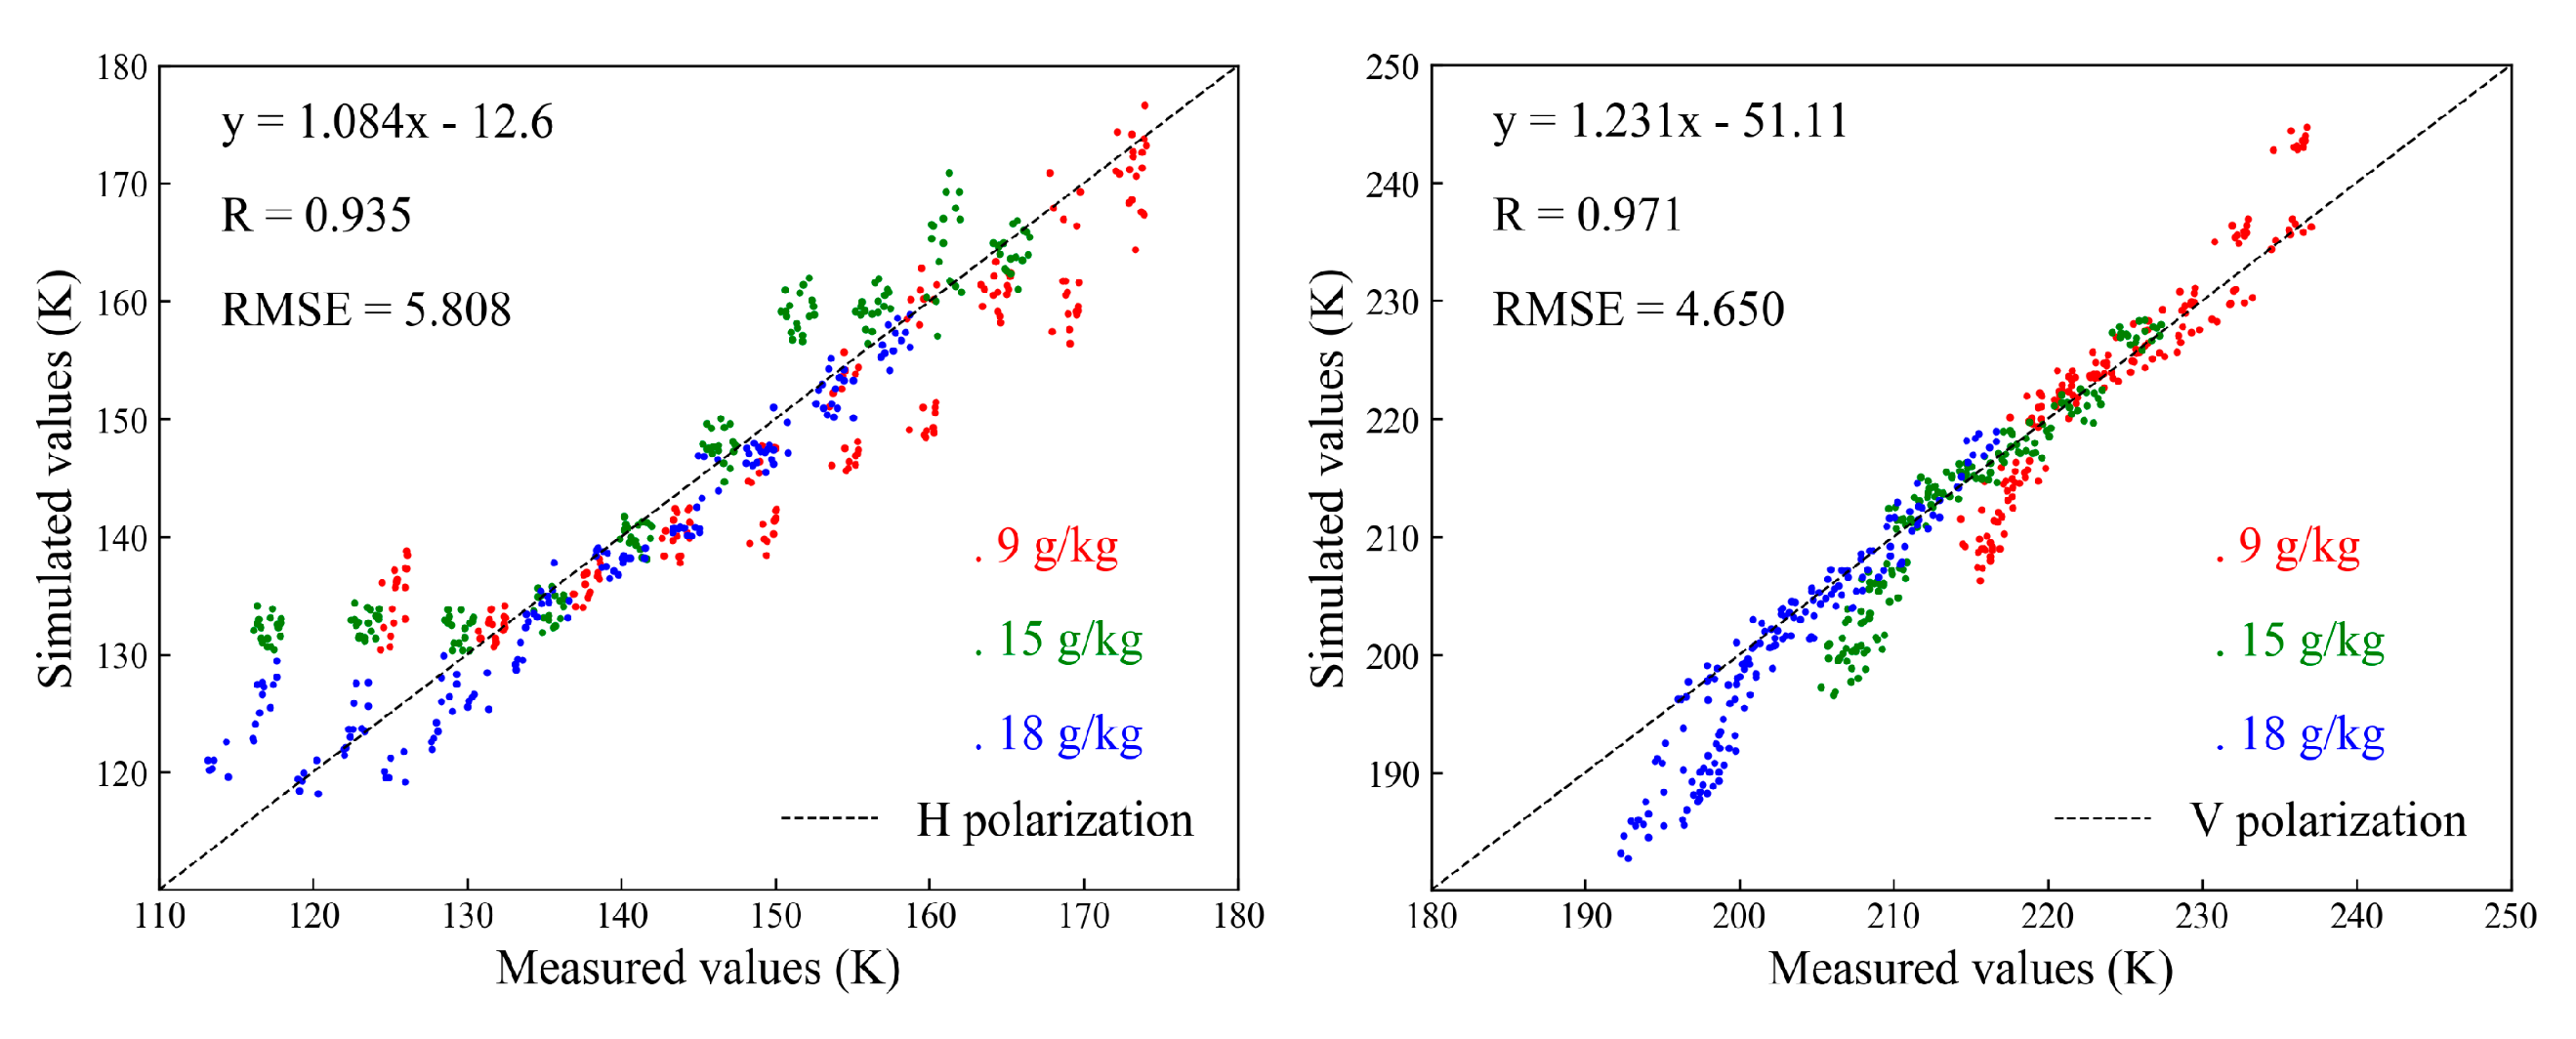
- The simulated result of the brightness temperature of the multilevel saline soil demonstrated that the brightness temperature decreased gradually as the soil salinity increased both in H polarization and V polarization. The higher the soil salinity was, the greater the decreasing amplitude of the brightness temperature became. The correlation coefficients of H polarization and V polarization were 0.935 and 0.971, respectively, and the RMSEs were 5.808 K and 4.65 K, respectively.
Author Contributions
Funding
Conflicts of Interest
References
- Wanders, N.; Bierkens, M.F.P.; Jong, S.M.D.; Roo, A.D.; Karssenberg, D. The benefits of using remotely sensed soil moisture in parameter identification of large-scale hydrological models. Water Resour. Res. 2014, 50, 6874–6891. [Google Scholar] [CrossRef]
- Sun, Y.; Huang, S.; Ma, J.; Li, J.; Li, X.; Wang, H.; Chen, S.; Zang, W. Preliminary Evaluation of the SMAP Radiometer Soil Moisture Product over China Using in Situ Data. Remote Sens. 2017, 9, 292. [Google Scholar] [CrossRef]
- Zhang, W.; Wang, C.; Xue, R.; Wang, L. Effects of salinity on the soil microbial community and soil fertility. J. Integr. Agric. 2019, 18, 1360–1368. [Google Scholar] [CrossRef]
- El, S.H.; Wang, J.; Georgakakos, A.P. Modeling Regional Crop Yield and Irrigation Demand Using SMAP Type of Soil Moisture Data. J. Hydrometeorol. 2015, 16, 904–916. [Google Scholar] [CrossRef]
- Dutra, E.; Magnusson, L.; Wetterhall, F.; Cloke, H.L.; Balsamo, G.; Boussetta, S.; Pappenberger, F. The 2010–2011 drought in the Horn of Africa in ECMWF reanalysis and seasonal forecast products. Int. J. Climatol. 2013, 33, 1720–1729. [Google Scholar] [CrossRef]
- Miralles, D.G.; Holmes, T.R.H.; De, J.R.A.M.; Gash, J.H.; Meesters, A.G.C.A.; Dolman, A.J. Global land–surface evaporation estimated from satellite-based observations. Hydrol. Earth Syst. Sci. 2011, 15, 453–469. [Google Scholar] [CrossRef]
- Hauck, C.; Barthlott, C.; Krauss, L.; Kalthoff, N. Soil moisture variability and its influence on convective precipitation over complex terrain. Q. J. R. Meteorol. Soc. 2011, 137, 42–56. [Google Scholar] [CrossRef]
- Zeng, J.; Li, Z.; Chen, Q.; Bi, H.; Qiu, J.; Zou, P. Evaluation of remotely sensed and reanalysis soil moisture products over the Tibetan Plateau using in-situ observations. Remote Sens. Environ. 2015, 163, 91–110. [Google Scholar] [CrossRef]
- Zeng, Y.; Su, Z.; Velde, R.V.D.; Wang, L.; Xu, K.; Wang, X.; Wen, J. Blending Satellite Observed, Model Simulated, and in Situ Measured Soil Moisture over Tibetan Plateau. Remote Sens. 2016, 8, 268. [Google Scholar] [CrossRef]
- Allbed, A.; Kumar, L. Soil Salinity Mapping and Monitoring in Arid and Semi-Arid Regions Using Remote Sensing Technology: A Review. Adv. Remote Sens. 2013, 2, 373–385. [Google Scholar] [CrossRef]
- Muyen, Z.; Moore, G.A.; Wrigley, R.J. Soil salinity and sodicity effects of wastewater irrigation in South East Australia. Agric. Water Manag. 2011, 99, 33–41. [Google Scholar] [CrossRef]
- Fan, X.; Pedroli, B.; Liu, G.; Liu, Q.; Liu, H.; Shu, L. Soil salinity development in the yellow river delta in relation to groundwater dynamics. Land Degrad. Dev. 2012, 23, 175–189. [Google Scholar] [CrossRef]
- Engman, E.T. Progress in Microwave Remote Sensing of Soil Moisture. Can. J. Remote Sens. 1990, 16, 6–14. [Google Scholar] [CrossRef]
- Njoku, E.G.; Jackson, T.J.; Lakshmi, V.; Chan, T.K.; Nghiem, S.V. Soil Moisture Retrieval from AMSR-E. IEEE Trans. Geosci. Remote Sens. 2003, 41, 215–229. [Google Scholar] [CrossRef]
- Santi, E.; Paloscia, S.; Pettinato, S.; Brocca, L.; Ciabatta, L.; Entekhabi, D. Integration of microwave data from SMAP and AMSR2 for soil moisture monitoring in Italy. Remote Sens. Environ. 2018, 212, 21–30. [Google Scholar] [CrossRef]
- Periasamy, S.; Shanmugam, R.S. Multispectral and Microwave Remote Sensing Models to Survey Soil Moisture and Salinity. Land Degrad. Dev. 2017, 28, 1412–1425. [Google Scholar] [CrossRef]
- Ma, C.; Li, X.; Wang, S. A Global Sensitivity Analysis of Soil Parameters Associated with Backscattering Using the Advanced Integral Equation Model. IEEE Trans. Geosci. Remote Sens. 2015, 53, 5613–5623. [Google Scholar] [CrossRef]
- Tashpolat, N.; Ding, J.; Yu, D. Dielectric Properties of Saline Soil Based on a Modified Dobson Dielectric Model. J. Arid Land 2015, 7, 696–705. [Google Scholar] [CrossRef][Green Version]
- Loor, G.P.D. Dielectric Properties of Heterogeneous Mixtures Containing Water*. J. Microw. Power. 1968, 3, 67–73. [Google Scholar] [CrossRef]
- Topp, G.C.; Davis, J.L.; Annan, A.P. Electromagnetic Determination of Soil Water Content: Measurements in Coaxial Transmission Lines. Water Resour. Res. 1980, 16, 574–582. [Google Scholar] [CrossRef]
- Wang, J.R. The dielectric properties of soil-water mixtures at microwave frequencies. Radio Sci. 1980, 15, 977–985. [Google Scholar] [CrossRef]
- Hallikainen, M.T.; Ulaby, F.T.; Dobson, M.C.; Elrayes, M.A.; Wu, L. Microwave Dielectric Behavior of Wet Soil-Part 1_ Empirical Models and Experimental Observations. IEEE Trans. Geosci. Remote Sens. 1985, 23, 25–34. [Google Scholar] [CrossRef]
- Dobson, M.C.; Ulaby, F.T.; Hallikainen, M.T.; Elrayes, M.A. Microwave Dielectric Behavior of Wet Soil-Part II_ Dielectric-Mixing Models. IEEE Trans. Geosci. Remote Sens. 1985, 23, 35–46. [Google Scholar] [CrossRef]
- Mironov, V.L.; Dobson, M.C.; Kaupp, V.H.; Komarov, S.A.; Kleshchenko, V.N. Generalized refractive mixing dielectric model for moist soils. IEEE Trans. Geosci. Remote Sens. 2004, 42, 773–785. [Google Scholar] [CrossRef]
- Lasne, Y.; Paillou, P.; Freeman, A.; Farr, T.; McDonald, K.C.; Ruffie, G.; Malezieux, J.-M.; Chapman, B.; Demontoux, F. Effect of Salinity on the Dielectric Properties of Geological Materials: Implication for Soil Moisture Detection by Means of Radar Remote Sensing. IEEE Trans. Geosci. Remote Sens. 2008, 46, 1674–1688. [Google Scholar] [CrossRef]
- Sreenivas, K.; Venkataratnam, L.; Rao, P.V.N. Dielectric properties of salt-affected soils. Int. J. Remote Sens. 1995, 16, 641–649. [Google Scholar] [CrossRef]
- Shao, Y.; Guo, H.; Hu, Q.; Lu, Y.; Dong, Q.; Han, C. Effect of Dielectric Properties of Moist Salinized Soils on Backscattering Coefficients Extracted from RADARSAT Image. IEEE Trans. Geosci. Remote Sens. 2003, 41, 1879–1888. [Google Scholar] [CrossRef]
- Hu, Q.; Shao, Y.; Guo, H. Microwave dielectric behavior of moist salt soil-experimental observations and improved dielectric models. In Proceedings of the IEEE International Geoscience and Remote Sensing Symposium, Toulouse, France, 21–25 July 2003; pp. 1685–1687. [Google Scholar]
- Wu, Y.; Wang, W.; Zhao, S.; Liu, S. Dielectric Properties of Saline Soils and an Improved Dielectric Model in C-Band. IEEE Trans. Geosci. Remote Sens. 2015, 53, 440–452. [Google Scholar] [CrossRef]
- Stogryn, A. Equations for Calculating the Dielectric Constant of Saline Water. IEEE Trans. Microwave Theory Tech. 1971, 19, 733–736. [Google Scholar] [CrossRef]
- Peng, J.; Loew, A.; Merlin, O.; Verhoest, N.E.C. A review of spatial downscaling of satellite remotely sensed soil moisture. Rev. Geophys. 2017, 55, 341–366. [Google Scholar] [CrossRef]
- Leng, P.; Song, X.; Duan, S.; Li, Z. A practical algorithm for estimating surface soil moisture using combined optical and thermal infrared data. Int. J. Appl. Earth Obs. 2016, 52, 338–348. [Google Scholar] [CrossRef]
- Shi, J.; Du, Y.; Du, J.; Jiang, L.; Chai, L.; Mao, K.; Xu, P.; Ni, W.; Xiong, C.; Liu, Q.; et al. Progresses on microwave remote sensing of land surface parameters. Sci. China Earth Sci. 2012, 55, 1052–1078. [Google Scholar] [CrossRef]
- Chaturvedi, L.; Carver, K.R.; Harlan, J.C.; Hancock, G.D.; Small, F.V.; Dalstead, K.J. Multispectral Remote Sensing of Saline Seeps. IEEE Trans. Geosci. Remote Sens. 1983, 21, 239–251. [Google Scholar] [CrossRef]
- Jackson, T.J.; O’Neill, P. Salinity Effects on the Microwave Emission of Soils. IEEE Trans. Geosci. Remote Sens. 1987, 25, 214–220. [Google Scholar] [CrossRef]
- McColl, K.A.; Ryu, D.; Matic, V.; Walker, J.P.; Costelloe, J.; Rudiger, C. Soil Salinity Impacts on L-Band Remote Sensing of Soil Moisture. IEEE Geosci. Remote Sens. Lett. 2012, 9, 262–266. [Google Scholar] [CrossRef]
- Li, Y.; Zhao, K.; Zheng, X.; Ren, J.; Ding, Y.; Wu, L. Identification of saline-alkali soil based on target decomposition of full-polarization radar data. J. Appl. Remote Sens. 2014, 8, 083511. [Google Scholar] [CrossRef]
- Chen, Q.; Liu, J.; Tang, Z.; Zeng, J.; Li, Y. Study on the relationship between soil moisture and its dielectric constant obtained by space-borne microwave radiometers and scatter meters. In Proceedings of the 35th International Symposium on Remote Sensing of Environment (ISRSE35), Beijing, China, 22–26 April 2013. [Google Scholar]
- Srivastava, P.K.; O’Neill, P.; Cosh, M.; Kurum, M.; Lang, R.; Joseph, A. Evaluation of Dielectric Mixing Models for Passive Microwave Soil Moisture Retrieval Using Data from ComRAD Ground-Based SMAP Simulator. IEEE J. STARS 2014, 8, 4345–4354. [Google Scholar] [CrossRef]
- Peplinski, N.R.; Ulaby, F.T.; Dobson, M.C. Dielectric Properties of Soils in the 0.3-1.3-GHz Range. IEEE Trans. Geosci. Remote Sens. 1995, 33, 803–807. [Google Scholar] [CrossRef]
- Haggis, G.H.; Hasted, J.B.; Buchanan, T.J. The Dielectric Properties of Water in Solutions. J. Chem. Phys. 1952, 20, 1452–1465. [Google Scholar] [CrossRef]
- Birchak, J.R.; Gardner, C.G.; Hipp, J.E.; Victor, J.M. High dielectric constant microwave probes for sensing soil moisture. Proc. IEEE. 1974, 62, 93–98. [Google Scholar] [CrossRef]
- Mironov, V.L.; Kosolapova, L.G.; Fomin, S.V. Physically and Mineralogically Based Spectroscopic Dielectric Model for Moist Soils. IEEE Trans. Geosci. Remote Sens. 2009, 47, 2059–2070. [Google Scholar] [CrossRef]
- Choudhury, B.J.; Schmugge, T.J.; Mo, T. A parameterization of effective soil temperature for microwave emission. J. Geophys. Res. 1982, 87, 1301–1304. [Google Scholar] [CrossRef]
- Wang, J.R.; Choudhury, B.J. Remote sensing of soil moisture content, over bare field at 1.4 GHz frequency. J. Geophys. Res. 1981, 86, 5277–5282. [Google Scholar] [CrossRef]
- Shi, J.; Jiang, L.; Zhang, L.; Chen, K.S.; Wigneron, J.P.; Chanzy, A. A parameterized multifrequency-polarization surface emission model. IEEE Trans. Geosci. Remote Sens. 2005, 43, 2831–2841. [Google Scholar] [CrossRef]
- Wilheit, T.T. Radiative Transfer in a Plane Stratified Dielectric. IEEE Trans. Geosci. Electron. 1978, 16, 138–143. [Google Scholar] [CrossRef]
- Wigneron, J.P.; Chanzy, A.; Rosnay, P.d.; Rudiger, C.; Calvet, J.C. Estimating the Effective Soil Temperature at L-Band as a Function of Soil Properties. IEEE Trans. Geosci. Remote Sens. 2008, 46, 797–807. [Google Scholar] [CrossRef]
- Holmes, T.R.H.; Rosnay, P.D.; Jeu, R.D.; Wigneron, R.J.P.; Kerr, Y.; Calvet, J.C.; Escorihuela, M.J.; Saleh, K.; Lemaître, F. A new parameterization of the effective temperature for L band radiometry. Geophys. Res. Lett. 2006, 33. [Google Scholar] [CrossRef]
- Lv, S.; Wen, J.; Zeng, Y.; Tian, H.; Su, Z. An improved two-layer algorithm for estimating effective soil temperature in microwave radiometry using in situ temperature and soil moisture measurements. Remote Sens. Environ. 2014, 152, 356–363. [Google Scholar] [CrossRef]
- Ma, C.; Li, X.; Wang, J.; Wang, C.; Duan, Q.; Wang, W. A Comprehensive Evaluation of Microwave Emissivity and Brightness Temperature Sensitivities to Soil Parameters Using Qualitative and Quantitative Sensitivity Analyses. IEEE Trans. Geosci. Remote Sens. 2017, 55, 1025–1038. [Google Scholar] [CrossRef]
- Bauder, J.W.; Brock, T.A. Irrigation Water Quality, Soil Amendment, and Crop Effects on Sodium Leaching. Arid Land Res. Manag. 2001, 15, 101–113. [Google Scholar] [CrossRef]
- Ilyas, M.; Qureshi, R.H.; Qadir, M.A. Chemical changes in a saline-sodic soil after gypsum application and cropping. Soil Technol. 1997, 10, 247–260. [Google Scholar] [CrossRef]
- Rengasamy, P.; Chittleborough, D.; Helyar, K. Root-zone constraints and plant-based solutions for dryland salinity. Plant Soil. 2003, 257, 249–260. [Google Scholar] [CrossRef]


| Soil Moisture (cm3/cm3) | The Real Part | The Imaginary Part | ||||||
|---|---|---|---|---|---|---|---|---|
| Dobson-L | Dobson-Ku | GRMDM-L | GRMDM-Ku | Dobson-L | Dobson-Ku | GRMDM-L | GRMDM-Ku | |
| 0.01 | 3.063 | 2.992 | 2.839 | 2.757 | 0.110 | 0.018 | 0.148 | 0.217 |
| 0.1 | 5.914 | 4.783 | 5.998 | 4.850 | 0.736 | 0.659 | 0.492 | 1.469 |
| 0.2 | 10.422 | 7.486 | 11.199 | 8.083 | 1.411 | 2.177 | 1.091 | 3.699 |
| 0.3 | 16.140 | 10.817 | 18.010 | 12.072 | 2.138 | 4.420 | 1.915 | 6.766 |
| 0.4 | 22.982 | 14.731 | 26.431 | 16.816 | 2.930 | 7.324 | 2.963 | 10.670 |
| 0.5 | 30.049 | 18.727 | 35.358 | 21.723 | 3.699 | 10.469 | 4.099 | 14.899 |
| The Real Part | The Imaginary Part | ||||
|---|---|---|---|---|---|
| Frequency (GHz) | Models | R | RMSE | R | RMSE |
| 1.4 | Dobson | 0.999 | 0.510 | 0.871 | 2.631 |
| GRMDM | 0.999 | 0.503 | 0.894 | 2.430 | |
| 18.7 | Dobson | 0.999 | 1.462 | 0.910 | 2.524 |
| GRMDM | 0.999 | 1.433 | 0.895 | 1.856 | |
| Soil Salinity (g/kg) | Soil Moisture (cm3/cm3) | DobsonS-L | DobsonS-Ku | HQR-L | HQR-Ku | WYR-L | WYR-Ku |
|---|---|---|---|---|---|---|---|
| 5 | 0.1 | 0.897 | 0.661 | 9.884 | 1.333 | 3.032 | 0.820 |
| 0.2 | 1.684 | 2.161 | 8.964 | 2.686 | 6.112 | 2.493 | |
| 0.3 | 2.508 | 4.373 | 8.279 | 4.805 | 9.342 | 4.885 | |
| 0.4 | 3.388 | 7.235 | 8.205 | 7.595 | 12.715 | 7.933 | |
| 0.5 | 4.279 | 10.517 | 8.333 | 10.821 | 16.047 | 11.398 | |
| 10 | 0.1 | 1.682 | 0.710 | 19.682 | 2.058 | 4.742 | 0.939 |
| 0.2 | 3.029 | 2.231 | 17.091 | 3.283 | 10.066 | 2.757 | |
| 0.3 | 4.349 | 4.466 | 15.948 | 5.315 | 15.865 | 5.308 | |
| 0.4 | 5.686 | 7.298 | 15.393 | 8.025 | 22.070 | 8.525 | |
| 0.5 | 6.987 | 10.562 | 15.180 | 11.175 | 28.301 | 12.158 | |
| 15 | 0.1 | 2.445 | 0.759 | 29.479 | 2.783 | 6.172 | 1.038 |
| 0.2 | 4.334 | 2.299 | 25.489 | 3.883 | 13.528 | 2.987 | |
| 0.3 | 6.135 | 4.520 | 23.618 | 5.828 | 21.752 | 5.689 | |
| 0.4 | 7.916 | 7.364 | 22.581 | 8.462 | 30.706 | 9.071 | |
| 0.5 | 9.615 | 10.611 | 22.029 | 10.541 | 39.813 | 12.872 | |
| 20 | 0.1 | 3.186 | 0.806 | 39.277 | 3.508 | 7.445 | 1.125 |
| 0.2 | 5.603 | 2.366 | 33.866 | 4.483 | 16.707 | 3.197 | |
| 0.3 | 7.871 | 4.592 | 31.288 | 6.345 | 27.262 | 6.044 | |
| 0.4 | 10.084 | 7.431 | 29.770 | 8.904 | 38.906 | 9.588 | |
| 0.5 | 12.169 | 10.662 | 28.877 | 11.913 | 50.868 | 13.559 |
| Soil Moisture (cm3/cm3) | Soil Salinity (g/kg) | DobsonS-L | DobsonS-Ku | HQR-L | HQR-Ku | WYR-L | WYR-Ku |
|---|---|---|---|---|---|---|---|
| 0.1 | 1 | 0.251 | 0.620 | 2.046 | 0.755 | 1.104 | 0.684 |
| 5 | 0.897 | 0.661 | 9.884 | 1.333 | 3.032 | 0.820 | |
| 10 | 1.682 | 0.710 | 19.682 | 2.058 | 4.742 | 0.939 | |
| 15 | 2.445 | 0.759 | 29.479 | 2.783 | 6.172 | 1.038 | |
| 20 | 3.186 | 0.806 | 39.277 | 3.508 | 7.445 | 1.125 | |
| 25 | 3.893 | 0.851 | 48.879 | 4.219 | 8.591 | 1.203 | |
| 0.2 | 1 | 0.578 | 2.106 | 1.976 | 2.211 | 2.041 | 2.215 |
| 5 | 1.684 | 2.161 | 8.694 | 2.686 | 6.112 | 2.493 | |
| 10 | 3.029 | 2.231 | 17.091 | 3.283 | 10.066 | 2.757 | |
| 15 | 4.334 | 2.299 | 25.489 | 3.883 | 13.528 | 2.987 | |
| 20 | 5.603 | 2.366 | 33.886 | 4.483 | 16.707 | 3.197 | |
| 25 | 6.812 | 2.430 | 42.116 | 5.073 | 19.630 | 3.389 | |
| 0.3 | 1 | 0.995 | 4.316 | 2.144 | 4.402 | 3.001 | 4.466 |
| 5 | 2.508 | 4.373 | 8.279 | 4.805 | 9.342 | 4.885 | |
| 10 | 4.349 | 4.446 | 15.948 | 5.315 | 15.865 | 5.308 | |
| 15 | 6.135 | 4.520 | 23.618 | 5.828 | 21.752 | 5.689 | |
| 20 | 7.871 | 4.529 | 31.288 | 6.345 | 27.262 | 6.044 | |
| 25 | 9.527 | 4.661 | 38.805 | 6.853 | 32.403 | 6.373 | |
| 0.4 | 1 | 1.498 | 7.186 | 2.456 | 7.258 | 4.007 | 7.374 |
| 5 | 3.388 | 7.235 | 8.205 | 7.595 | 12.715 | 7.933 | |
| 10 | 5.686 | 7.298 | 15.393 | 8.025 | 22.070 | 8.525 | |
| 15 | 7.916 | 7.364 | 22.581 | 8.462 | 30.706 | 9.071 | |
| 20 | 10.084 | 7.431 | 29.770 | 8.904 | 38.906 | 9.588 | |
| 25 | 12.151 | 7.494 | 36.815 | 9.430 | 46.641 | 10.076 |
| Real Part | Imaginary Part | ||||
|---|---|---|---|---|---|
| Frequency (GHz) | Models | R | RMSE | R | RMSE |
| 1.4 | Dobson-S | 0.999 | 3.240 | 0.969 | 8.702 |
| HQR | −0.952 | 11.159 | |||
| WYR | 0.972 | 4.508 | |||
| 18.7 | Dobson-S | 0.999 | 7.721 | 0.975 | 10.448 |
| HQR | 0.976 | 9.086 | |||
| WYR | 0.975 | 9.475 | |||
© 2020 by the authors. Licensee MDPI, Basel, Switzerland. This article is an open access article distributed under the terms and conditions of the Creative Commons Attribution (CC BY) license (http://creativecommons.org/licenses/by/4.0/).
Share and Cite
Wang, W.; Dong, L.; Ma, C.; Wei, L.; Xu, F.; Feng, J. Experimental Investigation of Ground Radiation on Dielectric and Brightness Temperature of Soil Moisture and Soil Salinity. Sensors 2020, 20, 2806. https://doi.org/10.3390/s20102806
Wang W, Dong L, Ma C, Wei L, Xu F, Feng J. Experimental Investigation of Ground Radiation on Dielectric and Brightness Temperature of Soil Moisture and Soil Salinity. Sensors. 2020; 20(10):2806. https://doi.org/10.3390/s20102806
Chicago/Turabian StyleWang, Weizhen, Leilei Dong, Chunfeng Ma, Long Wei, Feinan Xu, and Jiaojiao Feng. 2020. "Experimental Investigation of Ground Radiation on Dielectric and Brightness Temperature of Soil Moisture and Soil Salinity" Sensors 20, no. 10: 2806. https://doi.org/10.3390/s20102806
APA StyleWang, W., Dong, L., Ma, C., Wei, L., Xu, F., & Feng, J. (2020). Experimental Investigation of Ground Radiation on Dielectric and Brightness Temperature of Soil Moisture and Soil Salinity. Sensors, 20(10), 2806. https://doi.org/10.3390/s20102806