Article

Characteristics of Highly Sensitive Hydrogen Sensor Based on Pt-WO3/Si Microring Resonator

Graduate School of Engineering, Yokohama National University, Yokohama 240-8501, Japan
*
Author to whom correspondence should be addressed.
Sensors 2020, 20(1), 96; https://doi.org/10.3390/s20010096
Submission received: 8 November 2019 / Revised: 10 December 2019 / Accepted: 18 December 2019 / Published: 23 December 2019
(This article belongs to the Special Issue Optical Micro-Resonators for Sensing)

Abstract

:
Hydrogen gas has attracted attention as a new energy carrier, and simple but highly sensitive hydrogen sensors are required. We fabricated an optical hydrogen sensor based on a silicon microring resonator (MRR) with tungsten oxide (WO3) using a complementary metal-oxide-semiconductor (CMOS)-compatible process for the MRR and a sol-gel method for the WO3 layer and investigated its sensing characteristics at device temperatures of 5, 20, and 30 °C. At each temperature, a hydrogen concentration of as low as 0.1 vol% was successfully detected. The gas sensitivity increased with decreasing temperature. The dependence of the sensitivity on the device temperature can be attributed to the thickness of tungsten bronze (HxWO3) formed by WO3 during exposure to hydrogen gas. In addition, a hydrogen gas sensor based on a silicon-MRR-enhanced Mach–Zehnder interferometer (MRR-MZI) is proposed and its significantly high sensing ability using improved changes in the transmittance of light is theoretically discussed.

1. Introduction

Recently, hydrogen gas has attracted attention as a new energy carrier. Although hydrogen has an ignition temperature of as high as 585 °C in air, it is flammable, its ignition energy is as small as 0.002 mJ, and its explosive range is from 4.0 to 75 vol%. Therefore, the development of highly sensitive hydrogen gas sensors and their systems capable of detecting low concentrations of hydrogen gas below the lower explosive limit is required [1]. Several papers have been comprehensively reviewed on various types of hydrogen sensor devices [2,3]. Metal-oxide-semiconductor [4] and electrochemical [5,6] sensors have been practically used and showed good performances, and hydrogen gas with a wide range of concentrations between 5 ppm and 100% has been detected. On the other hand, there are still many technical challenges left, such as the reduction of electrical power consumption for device heating, risk mitigation against accidental electric discharge by short-circuit of sensor electrodes, and improvement in durability for easy maintenance, and long-term usage. To solve these problems, room-temperature-operated sensors using functional nanocomposites, for example, have been reported [7,8,9,10,11,12,13]. Hydrogen concentrations of as low as 100 ppm have been detected at room temperature using resistance-type hydrogen sensors [8,11].
Optical sensors including fiber-optic gas sensors are also good candidates for hydrogen gas and have many advantages over conventional sensors [14]. They can provide good reliability because of their immunity to electromagnetic interferences and their explosion-proof structures that have no electrical contacts. Optical hydrogen sensors using optical fibers and nanostructures have been developed [15,16,17,18,19], and hydrogen gas with a concentration as low as 0.1 vol% has been detected [2]. On the other hand, optical gas sensors based on optical waveguides such as microring resonators (MRR) have also been developed for gas sensing [20,21,22,23,24,25,26,27,28,29,30]. In particular, an Si-MRR has a simple structure and a compact footprint and is promising for large scale integrated optical circuits. The Si-MRRs have been applied to sensors for various gases [20,24,26,27,29,30]. However, most of the MRR-based sensors are for ammonia, CO, CO2, and volatile organic compound gases. There are few reports on experimental hydrogen gas sensing [20,30].
In this study, we have investigated a highly sensitive silicon-on-insulator (SOI)-MRR-based hydrogen sensor with Pt-doped tungsten oxide (WO3) with high sensitivity and rapid response. WO3 tis a suitable material for hydrogen gas sensing [19]. When hydrogen gas is exposed to a WO3 film, WO3 reacts with hydrogen atoms to form tungsten bronze (HxWO3). As a result, the optical properties of the film, such as the absorption coefficient and refractive index, change, and transmittance of light also changes. Many of the optical hydrogen gas sensors with WO3 use these effects [15,16,19,28]. On the other hand, the proposed silicon (Si)-MRR-based hydrogen sensor uses the exothermic reaction in the WO3 film. A WO3/Si-MRR hydrogen sensor has already been proposed and hydrogen gas with a concentration of 1 vol% was successfully detected [20]. However, its detailed sensing characteristics, such as response times, have not been discussed. We have also obtained sensing characteristics for pure (100 vol%) hydrogen using a WO3/Si-MRR sensor [30]. However, its response to hydrogen was very slow (typically approximately 20 min), and the sensing characteristics for lower hydrogen concentrations have never been investigated. In this paper, we show that it is possible for the MRR sensor to detect hydrogen with a concentration of as low as 0.1 vol% and a response time as short as 10 s. The MRR sensor has realized the highest sensitivity and the fastest response at room temperature as an optical hydrogen sensor based on optical waveguides to the best of our knowledge.

2. Structure and Operation Principle of Sensor
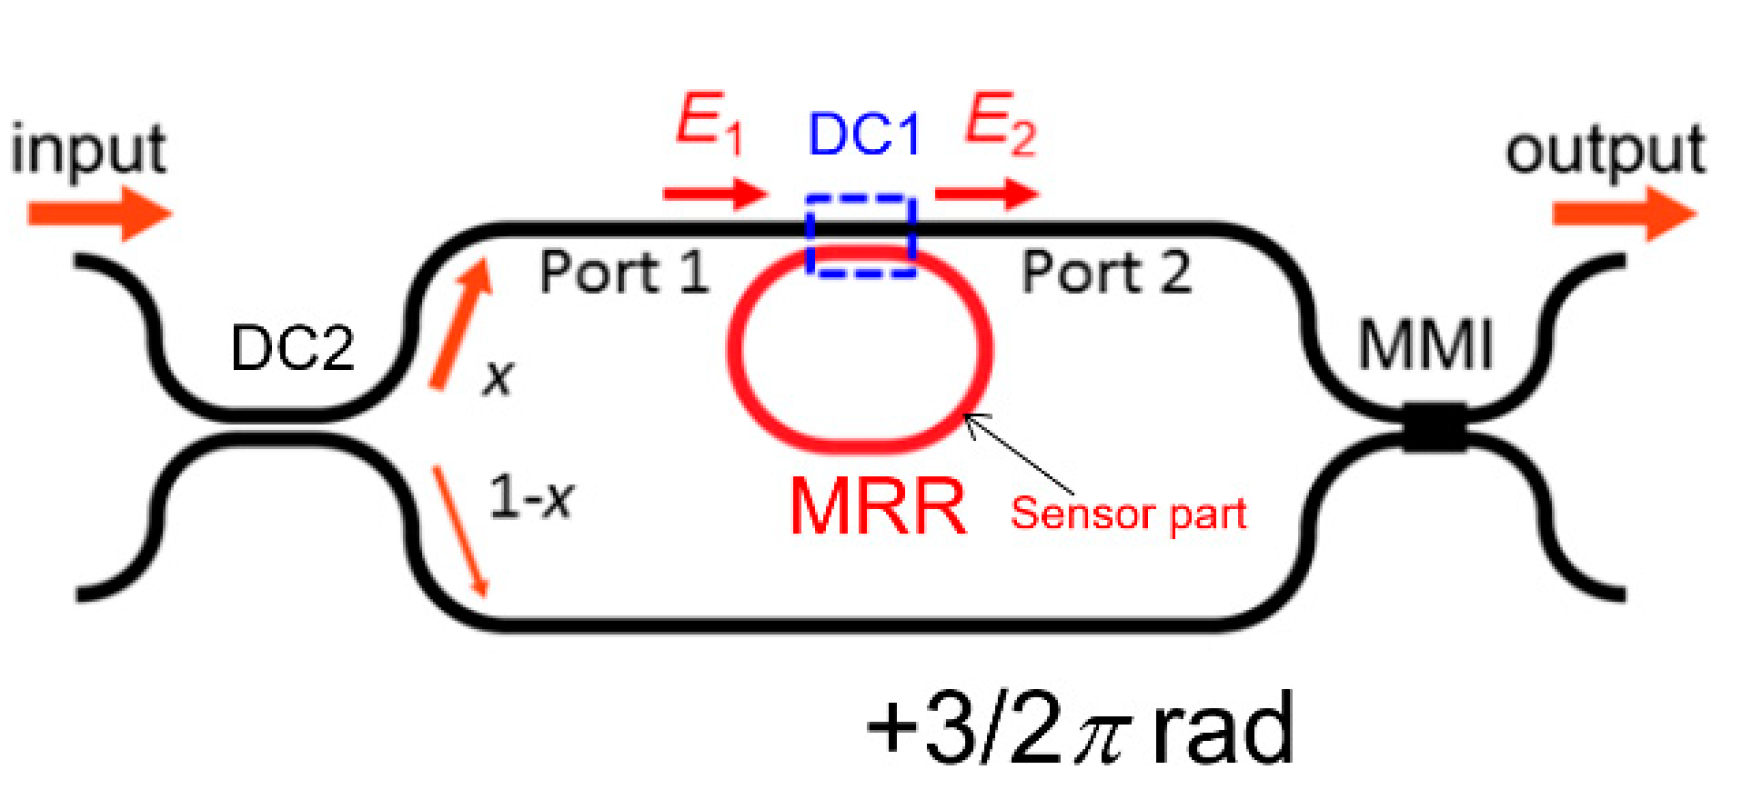
2.1. Structure

Figure 1 shows a schematic view of the proposed Pt-WO3/Si-MRR-based H2 gas sensor. The racetrack-type Si-MRR is coupled with two busline waveguides through directional couplers. The optical power coupling efficiency K is controlled by the length of the directional coupler. The waveguides are Si wires with a height of 210 nm and a width of 400 nm. The Si waveguides are surrounded by SiO2 cladding layers. The upper cladding layer of the waveguide of the MRR is composed of Pt-WO3/SiO2 layers. The thicknesses of the Pt-WO3 and SiO2 upper cladding layers are both 700 nm. The MRR is thermo-optic-driven and senses a change in temperature. When the temperature in the MRR changes, the equivalent refractive index of the waveguide also changes, leading to a shift in the resonant wavelength of the MRR. The device parameters of the sensor are summarized in Table 1.

2.2. Principle of Sensing
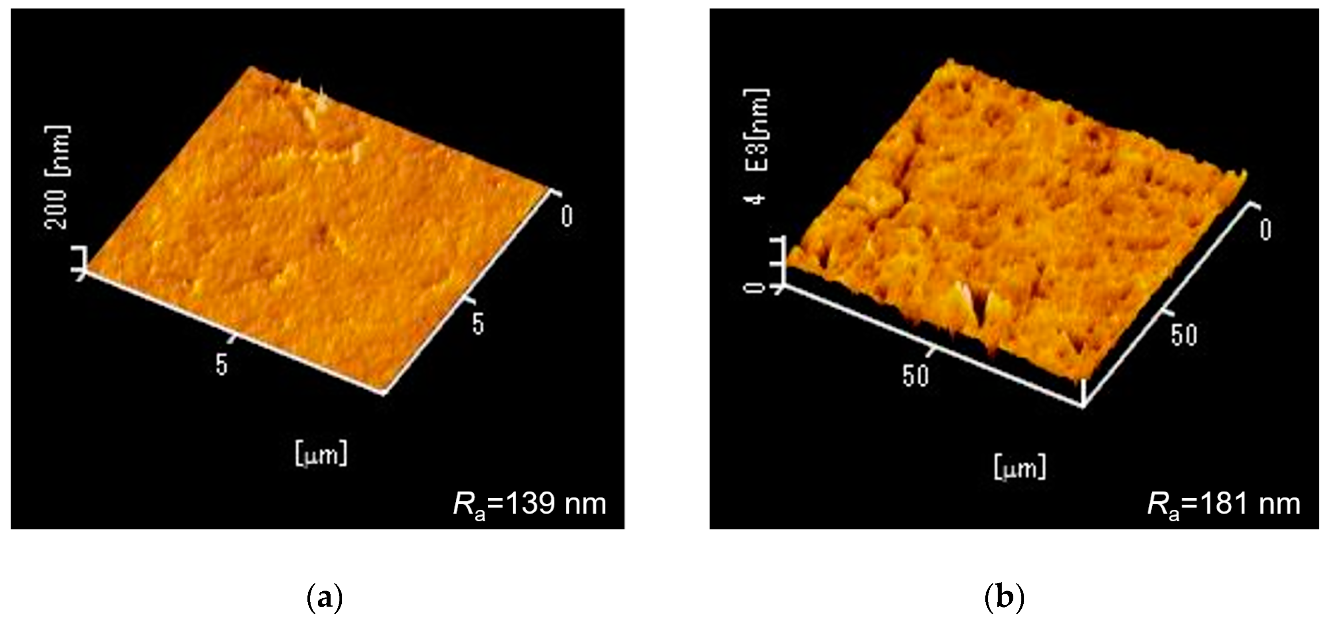
The resonant wavelength of an MRR is given by
λ 0 = L n e q N ,
where N is the resonance order. When neq changes, λ0 shifts in the longer/shorter wavelength direction. WO3 is known as a gasochromatic material; when it absorbs hydrogen atoms, it forms tungsten bronze (HxWO3) with the reaction given by
( x / 2 ) H 2 + WO 3 H x WO 3 .
Upon reaction with oxygen, it returns to WO3 with the reaction
H x WO 3 + ( x / 4 ) O 2 ( x / 2 ) H 2 O + WO 3 .
To induce the above reactions at room temperature, Pt is doped into WO3 as a catalyst. Reactions (2) and (3) are exothermic. Therefore, when hydrogen atoms are absorbed into the WO3 layer of the upper cladding layers, the temperature of the Si waveguide of the MRR and neq increase, leading to a redshift in resonant wavelength owing to the thermo-optic (TO) effect of Si. The measured temperature coefficient of the resonant wavelength, dλ0/dT, was approximately 57 pm/°C, which is slightly smaller than the theoretical value (72.2 pm/°C) calculated using the TO coefficient dΔn/dT of Si (1.62 × 10⁻⁴). Owing to reaction (2), the refractive index and extinction coefficient of the cladding layer also change, as shown in Table 2.
In the proposed sensor, only the TO effect induces the shift in the resonant wavelength, and it is preferable that the effects of the changes in the refractive index and extinction coefficient should be removed. Therefore, the thickness of the SiO2 upper cladding layer between the WO3 layer and the Si waveguide is important. The thicker the SiO2 layer, the lower the propagation loss in the MRR, which increases the depth and sharpness of the dip. As a result, the dip can be observed more clearly but the sensitivity decreases. Figure 2 shows the calculated dip depth and width at 0.1 dB from the bottom of the dip for the MRR with LMRR = 69.3 μm and K = 0.2 as a function of the thickness of the upper SiO2 layer. When the thickness of the SiO2 layer is 700 nm, a sufficient dip depth of as large as 10 dB is obtained. Moreover, if we assume that the dip depth at 0.2 dB from the bottom of the dip is required to read the wavelength at the bottom of the dip with an accuracy higher than 10 pm, a SiO2 thickness of more than 700 nm is required. Therefore, the thickness of the SiO2 layer in the device was designed to be 700 nm in the experiment.
The sensitivity depends on the thickness of the upper SiO2 cladding layer. If we assume that the temperature of the Si layer under a buried oxide (BOX) layer in an SOI substrate is kept at the value controlled by a thermoelectric temperature controller, the change in temperature at the MRR, ΔTMRR, is roughly estimated to be ΔTMRR = ΔTs dbox/(d + dbox) considering the temperature gradient in the SiO2 layers, where ΔTs is the change in temperature at the surface of the upper SiO2 cladding layer, and d and dbox are the thicknesses of the upper SiO2 cladding and BOX layers, respectively. This means that the lower the value of d is, the higher the temperature sensitivity. In the proposed sensor, d is 700 nm and dbox is 3 μm, therefore, ΔTMRRTs is calculated to be approximately 0.8, which means that the change in temperature at the MRR decreases by 20%.

3. Fabrication

MRR sensors were fabricated on an SOI substrate using a complementary metal-oxide-semiconductor (CMOS)-compatible process. The thick upper SiO2 cladding layer in the vicinity of the Si-MRR was removed, and a 700-nm-thick SiO2 layer was deposited as a spacer between the MRR waveguide and the WO3 layer by magnetron sputtering.
A Pt-WO3 layer was deposited by a sol-gel method [30]. A precursor solution of Pt/WO3 was prepared as follows. First, hydrogen hexachloroplatinate (IV) hexahydrate was dissolved in distilled water. The solution was dissolved in ethanol aq. Then, 1 vol% acetylene glycol surfactant was added dropwise and the mixture was stirred for more than 30 min (Solution A). Next, 0.5 M sodium tungstate aq. was prepared by dissolving sodium tungstate (IV) dehydrate in distilled water. To gain 0.5 M tungstic acid aq., it was ion-exchanged with a hydrogen ion type of cation exchange resin. Then, tungsten acid was dissolved in Solution A and stirred. The Si-MRR sample was spin-coated with the precursor solution. The spin rate was 500 rpm and the spin time was 300 s. The sample was desiccated in a desiccator for 60 min and subsequently calcined in a furnace for 60 min at 500 °C. After calcination, it was cooled to room temperature in the furnace. The fabrication process is described in more detail in Ref. [30].
Scanning electron microscopy (SEM) images of the fabricated MRR before the deposition of the Pt-WO3/SiO2 upper cladding layer and after the deposition of the WO3/SiO2 layer are shown in Figure 3a,b, respectively. The surface of the WO3 layer was macroscopically smooth. Figure 4 shows atomic force microscopy (AFM) images of the surface of the WO3 layer. There is some roughness of approximately 140–180 nm and some cracks were observed. This roughness and cracks increase the surface area of the WO3 layer, resulting in high sensitivity to hydrogen gas. Figure 5 shows an X-ray diffraction (XRD) pattern of the WO3 layer. Some peaks from the plane orientation (110) and other orientations were observed. These experimental results show that the WO3 layer is mainly amorphous but crystalline to some extent.
Figure 6 shows a transmittance spectrum of the fabricated MRR. The free spectral range (FSR) was approximately 4.05 nm, which is almost equal to the theoretical value. The Q factor of the MRR evaluated from the full width at half maximum of the resonant dips was 5164.

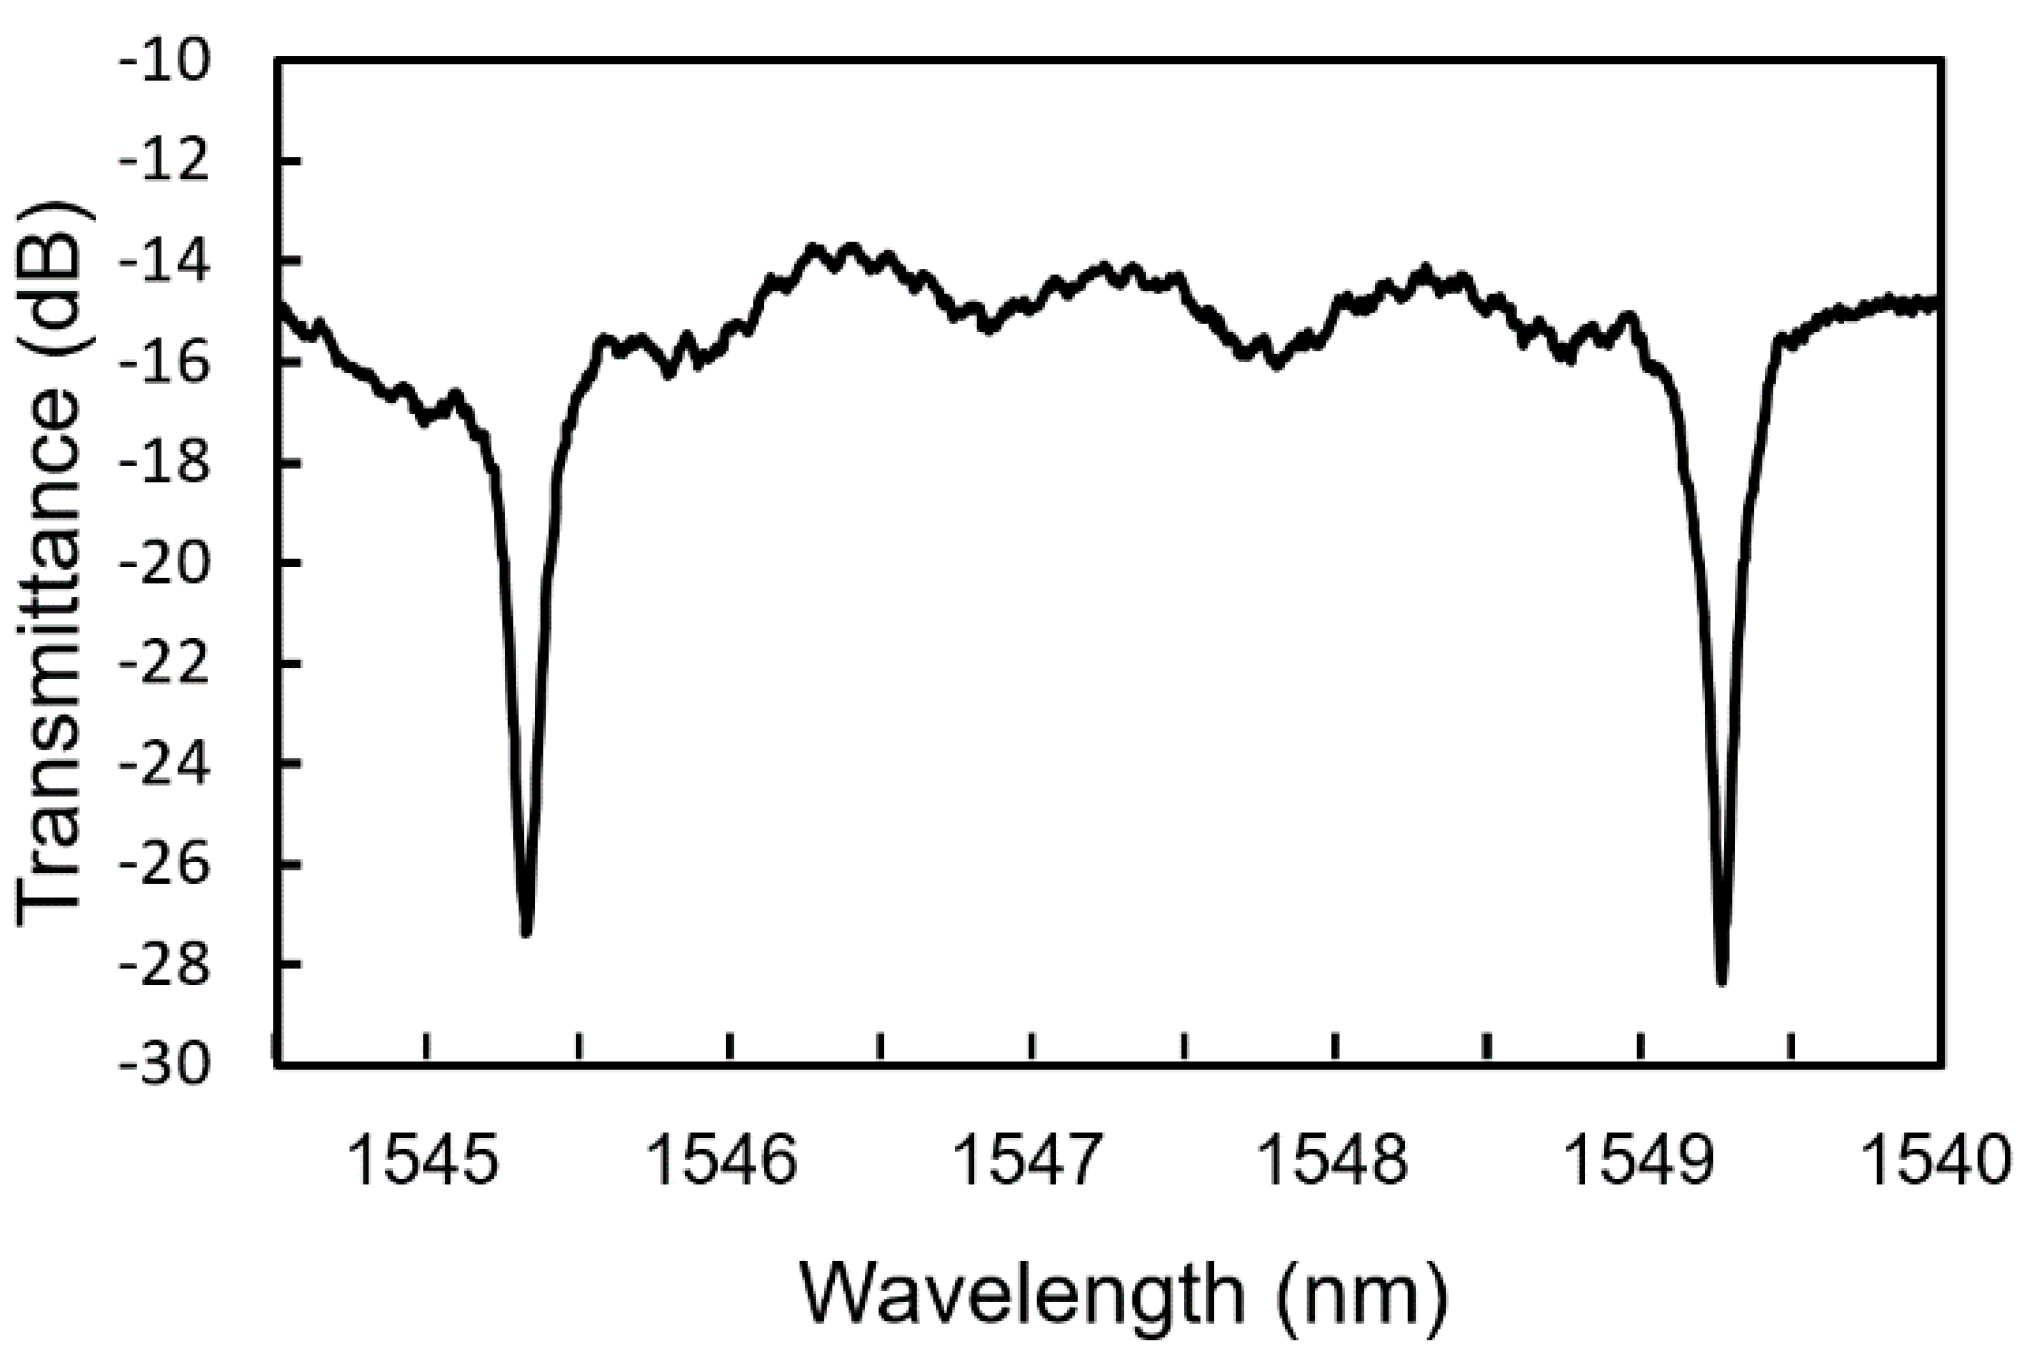
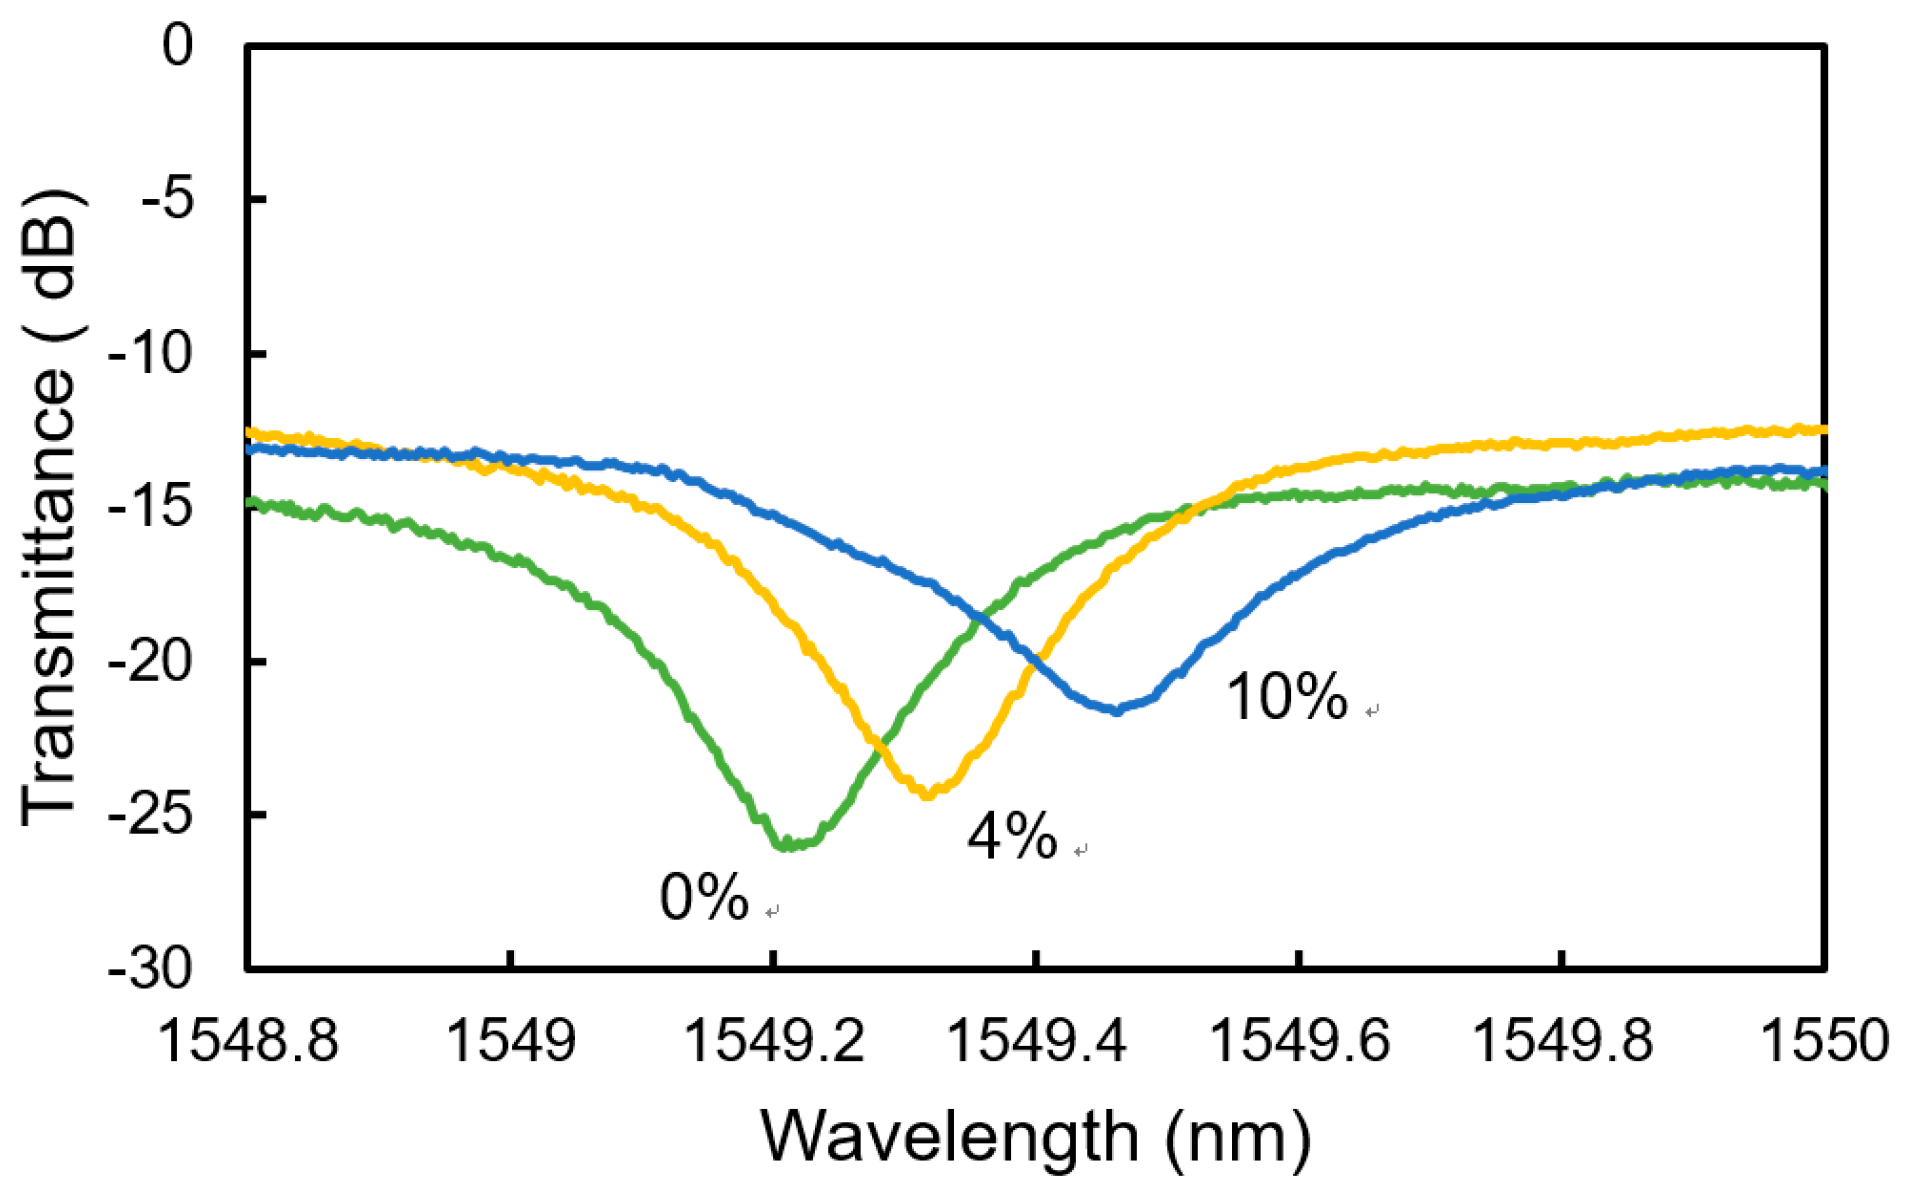
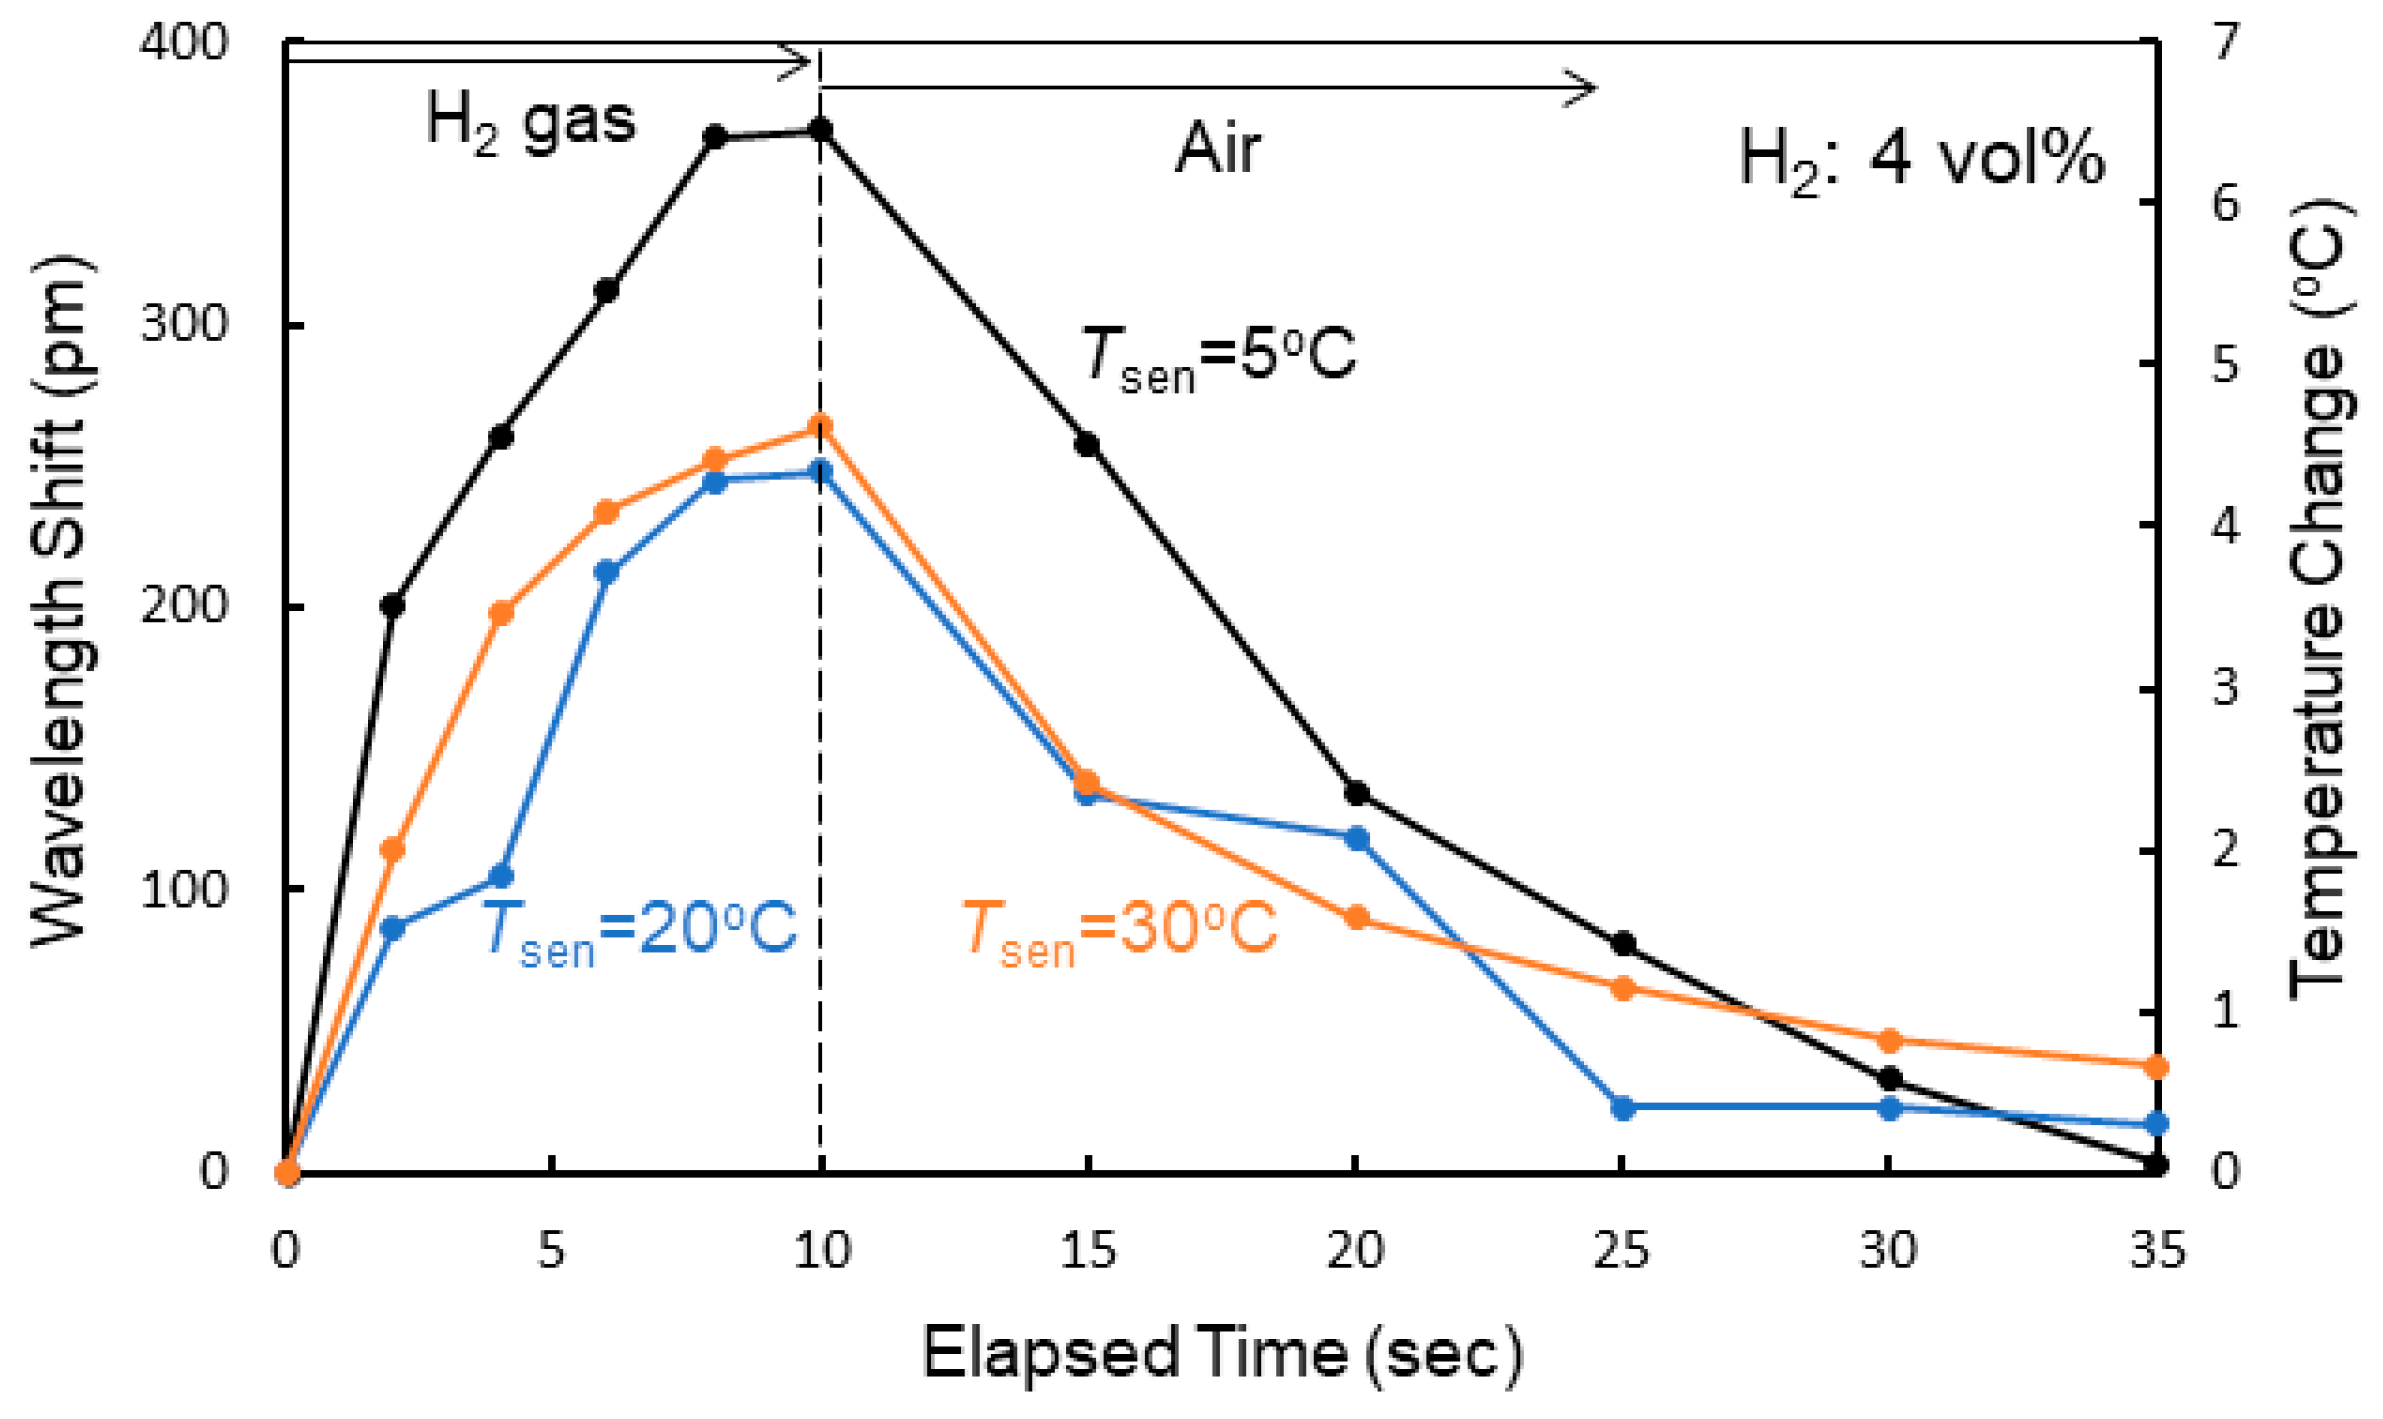
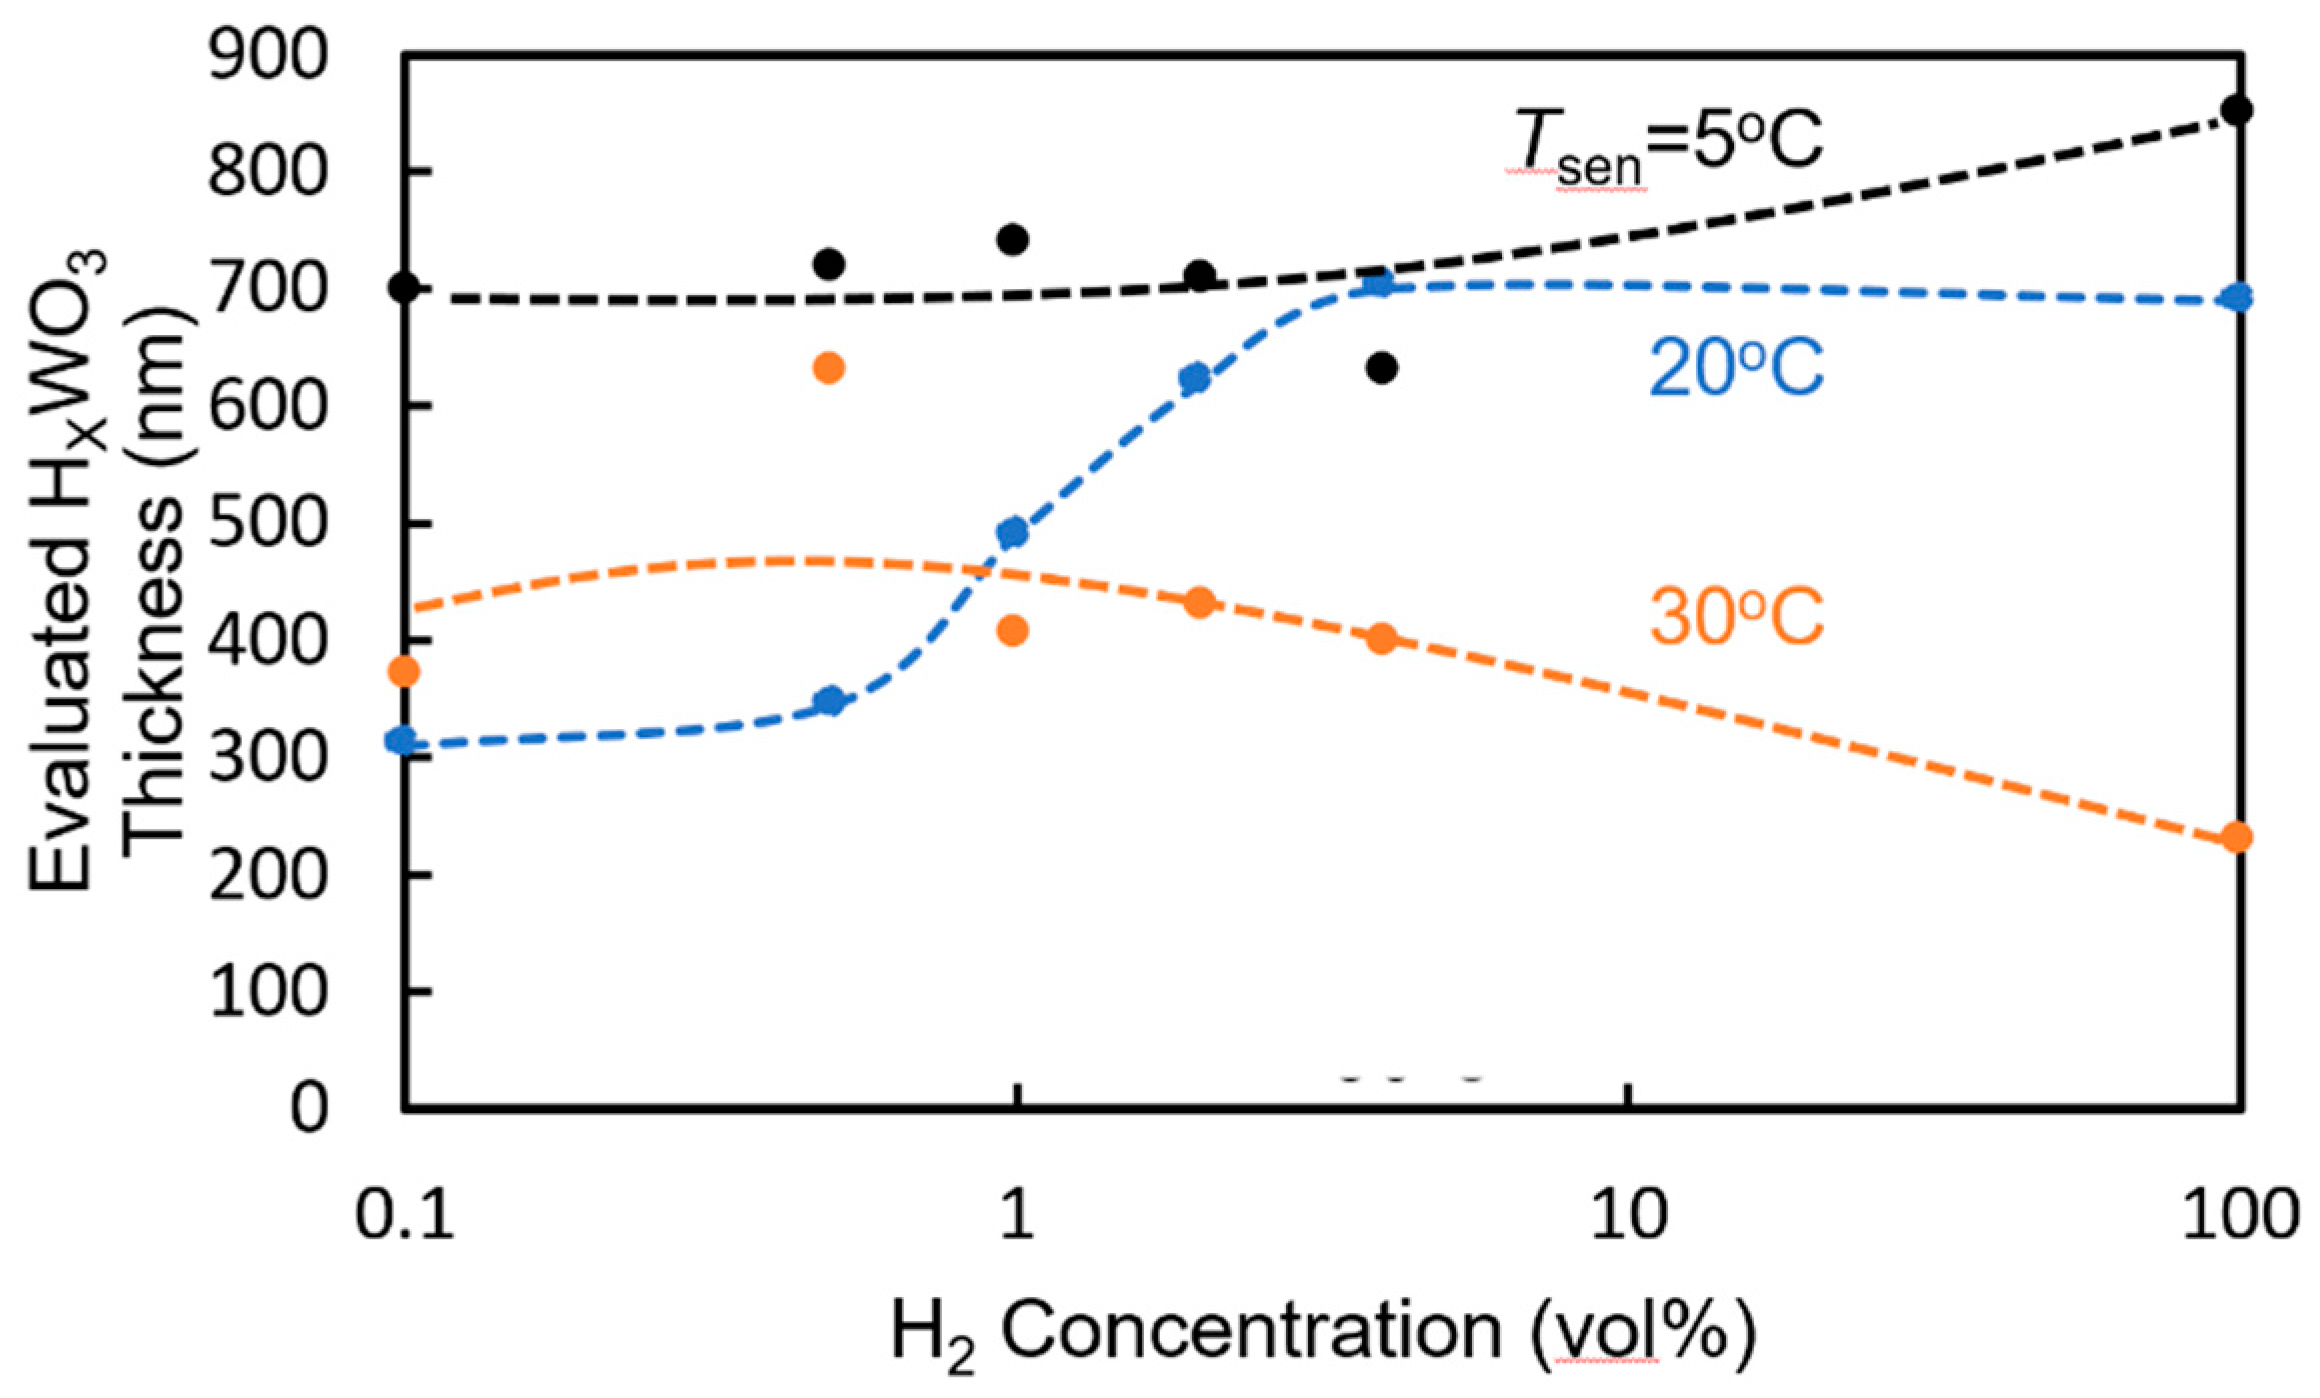
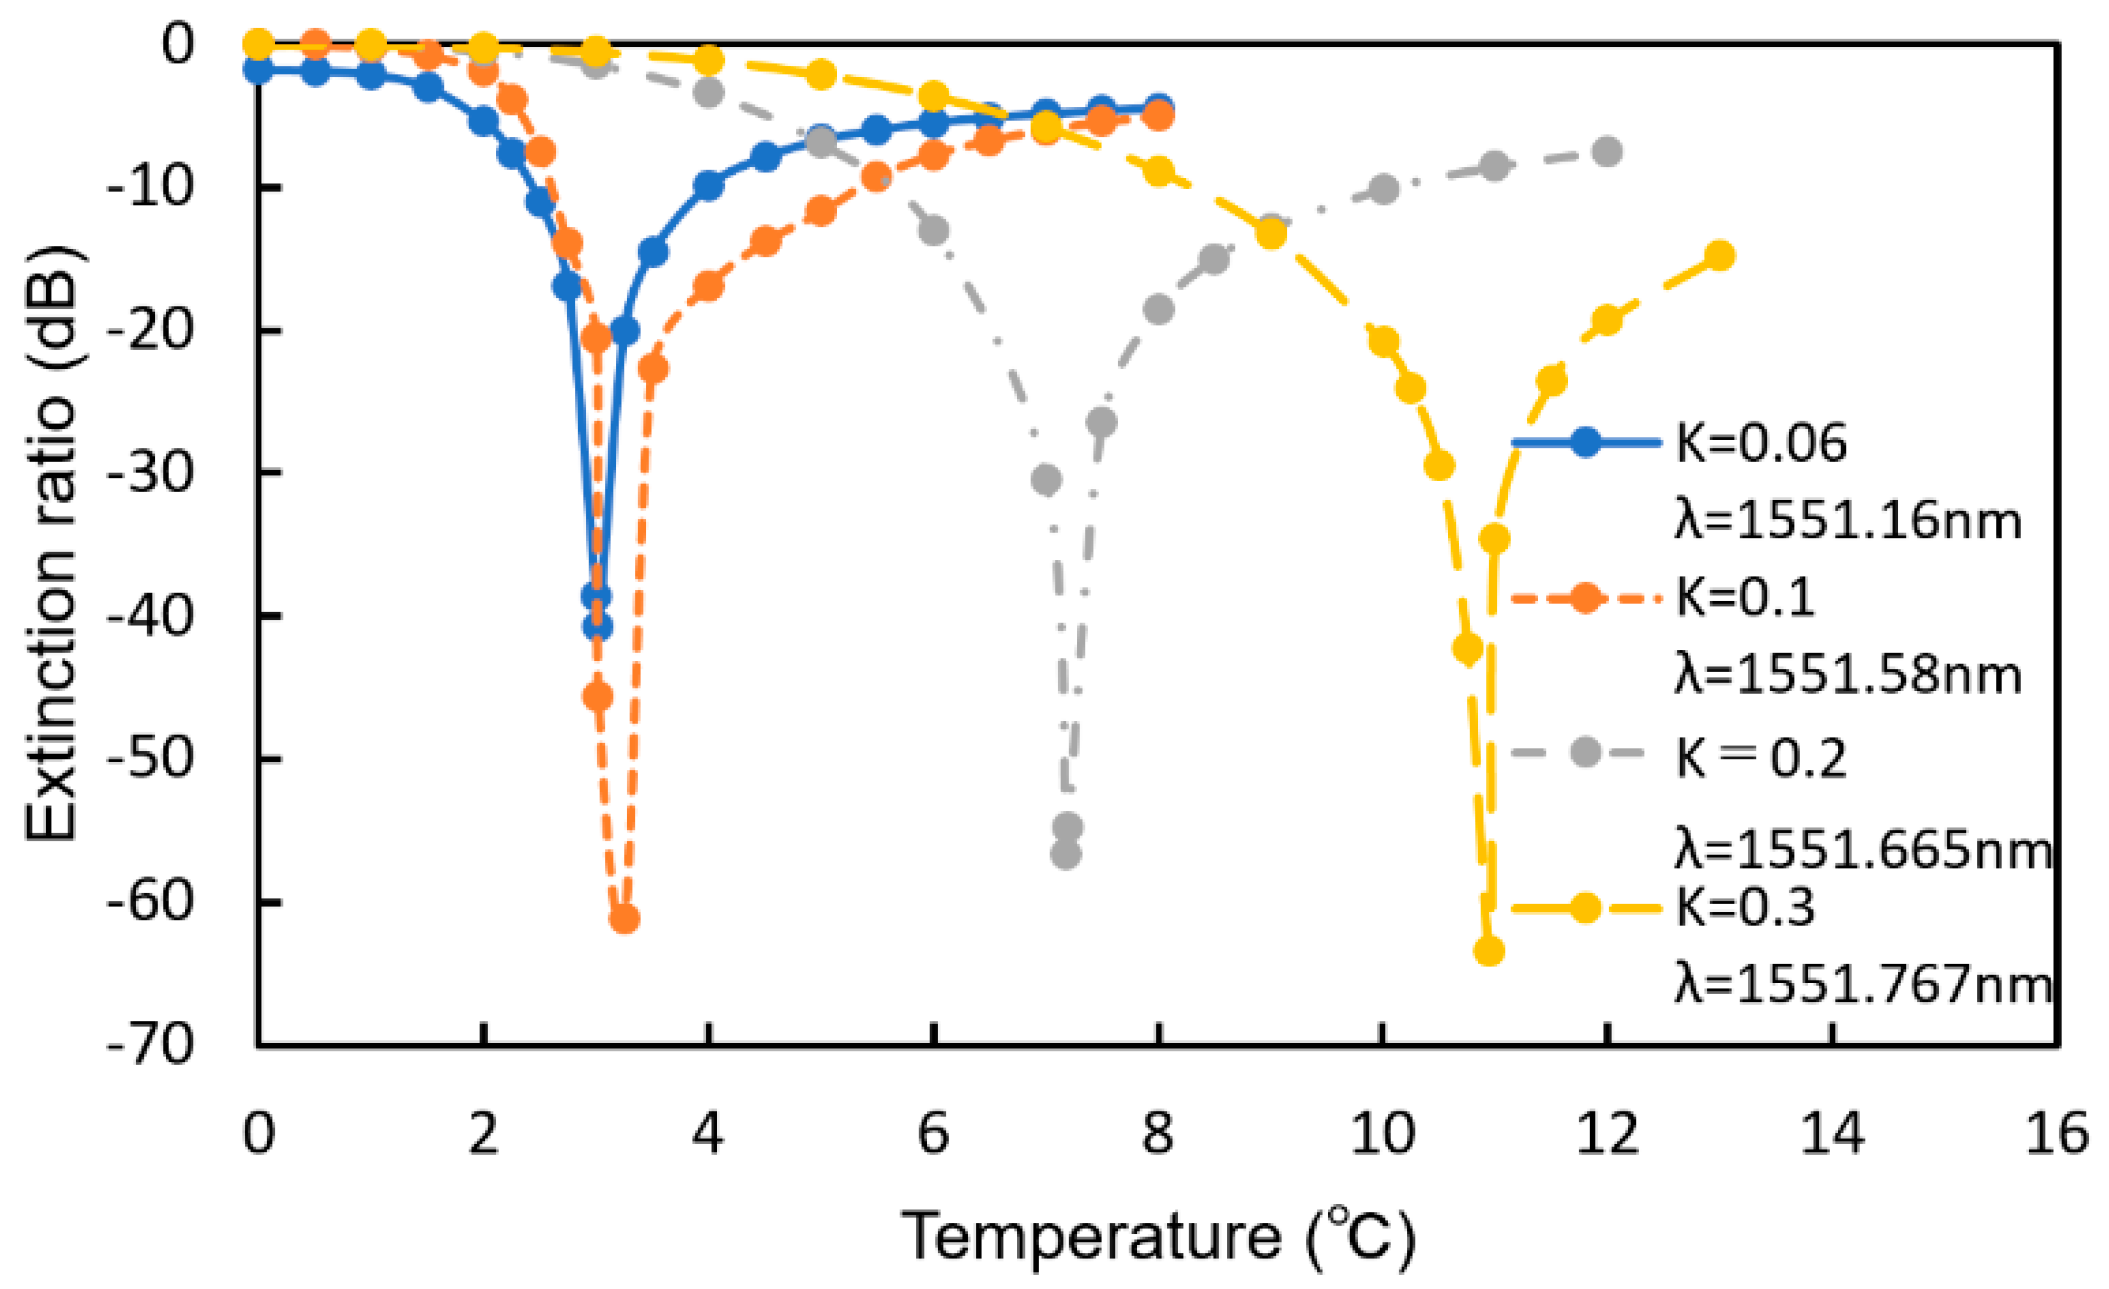
4. Sensing Characteristics of MRR Sensor

Figure 7 shows a measurement setup for the characterization of the MRR sensor. The fabricated MRR sensor was directly exposed to hydrogen/air mixed gases with different hydrogen concentrations. Pure hydrogen and dry air from gas cylinders were mixed with a gas mixer (KOFLOC Corp., Kyoto, Japan). The flow rate of the mixed gas was fixed at 1.0 L/min with a mass flow controller in the gas mixer. The polarization of a continuous-wave light from a tunable laser (8164A, Agilent Technologies, Inc., Santa Clara, USA) was controlled to the transverse electric (TE) mode using a polarization controller (PAT9000B, Thorlabs Japan Inc., Tokyo, Japan), and the TE-polarized light was incident on the input port of the MRR sensor. The transmittance of the laser light in the vicinity of 1550 nm from the input port to the drop port was measured using a spectrum analyzer (Agilent, 8164A). The temperature of the sensor, Tsen, was controlled using a thermoelectric temperature controller based on a Peltier device.
Figure 8 shows the measured spectra of the transmitted light for hydrogen gases with the concentrations of 0 to 10 vol% at Tsen = 20 °C. With the exposure to the gas, a resonant wavelength showed a redshift with a change in the depth of the dip at the resonant wavelength. The change in the depth of the dip was caused by the increase in the absorption coefficient when the WO3 formed HxWO3, which is discussed later.
Figure 9a shows the dependence of the shift in resonant wavelength on the elapsed time measured at Tsen = 20 °C for various hydrogen concentrations. The corresponding increases in temperature in the Si waveguide evaluated using the measured temperature coefficient dλ0/dT are also shown. The shift in resonant wavelength saturated at the elapsed time of 10 s after exposure to the hydrogen gas; therefore, the gas flow was stopped at 10 s in the experiment, and the atmosphere was switched to air. The response time was approximately 8 s for all gases. After stopping the exposure to the hydrogen gas, the resonant wavelength returned to its original value with the reaction of oxygen in air. Although the wavelength shift decreased with decreasing hydrogen gas concentration, a wavelength shift of as large as 117 pm was obtained for 0.1% hydrogen gas, showing the high sensitivity of the fabricated sensor to hydrogen gas. The shift in wavelength and response time depend on the gas flow rate. For example, the wavelength shift decreased by 20% and the response time increased by 50% for 4 vol% hydrogen gas at Tsen = 20 °C when the gas flow rate was changed from 1 to 0.25 L/min. This is probably because the rate at which hydrogen was absorbed into the WO3 layer decreased by lowering the gas flow rate. Figure 9b,c, respectively, shows the dependence of the shift in resonant wavelength on the elapsed time measured at Tsen = 5 and 30 °C for various hydrogen concentrations. At each temperature, similar resonant wavelength shifts were observed, but there was a difference in the magnitude of the wavelength shift. Figure 10 shows the wavelength shift as a function of the elapsed time upon exposure to 4.0 vol% hydrogen gas at different temperatures. The wavelength shift decreased with increasing Tsen, although there was little difference in response time. There is a reading error of ± 5 pm and the resolution of a wavelength of the spectrum analyzer is 10 pm. Therefore, the accuracy of the wavelength is ± 15 pm (7.5% error for the wavelength shift of 200 pm) in the wavelength measurements.
Figure 11 shows the dependence of the wavelength shift at an elapsed time of 10 s on the hydrogen concentration at each temperature. Although the wavelength shift shows dependence on Tsen, high sensitivity to hydrogen was obtained at each temperature. The wavelength shifts saturated above 1 vol%. The cause of this saturation is considered to be the saturation of coverage of hydrogen molecules on the platinum catalyst, that is, the number of hydrogen molecules absorbed on the Pt-doped WO3 saturated. To increase the sensitivity at higher hydrogen concentrations, the dispersion of Pt atoms in the WO3 layer must be improved.
As shown in Figure 8, the depth of the dip at the resonant wavelength changes upon exposure to hydrogen gas. This change in dip depth is mainly caused by the increase in the absorption coefficient when WO3 forms HxWO3. However, the measured change is not consistent with that when the entire WO3 layer is assumed to form HxWO3. This shows that only part of the WO3 layer on the surface side forms HxWO3. We evaluated the thickness of the HxWO3 layer using the measured change in dip depth on the assumption that the cause of the change is the increase in the propagation loss of the WO3/HxWO3 layer. Figure 12 shows the relationship between the evaluated thickness of the HxWO3 layer on the surface side and the hydrogen concentration of the gas to which the sensor is exposed. At Tsen = 20 °C, the evaluated thickness of the HxWO3 layer increases with increasing hydrogen concentration. On the other hand, at Tsen = 5 °C, the evaluated thickness of the HxWO3 layer is approximately 700 nm, and the entire WO3 layer is considered to have formed HxWO3. In the case of Tsen = 30 °C, the evaluated thickness of the HxWO3 layer is approximately 400 nm and almost constant. One of the reasons for the dependence of the change in resonant wavelength on Tsen in Figure 9 is considered to be the change in the thickness of the HxWO3 layer with Tsen. To improve the sensitivity to lower hydrogen concentrations of less than 2.0 vol% at higher Tsen, the thickness of the WO3 layer must be decreased, even though the accuracy of hydrogen concentration measurement decreases at higher concentrations.

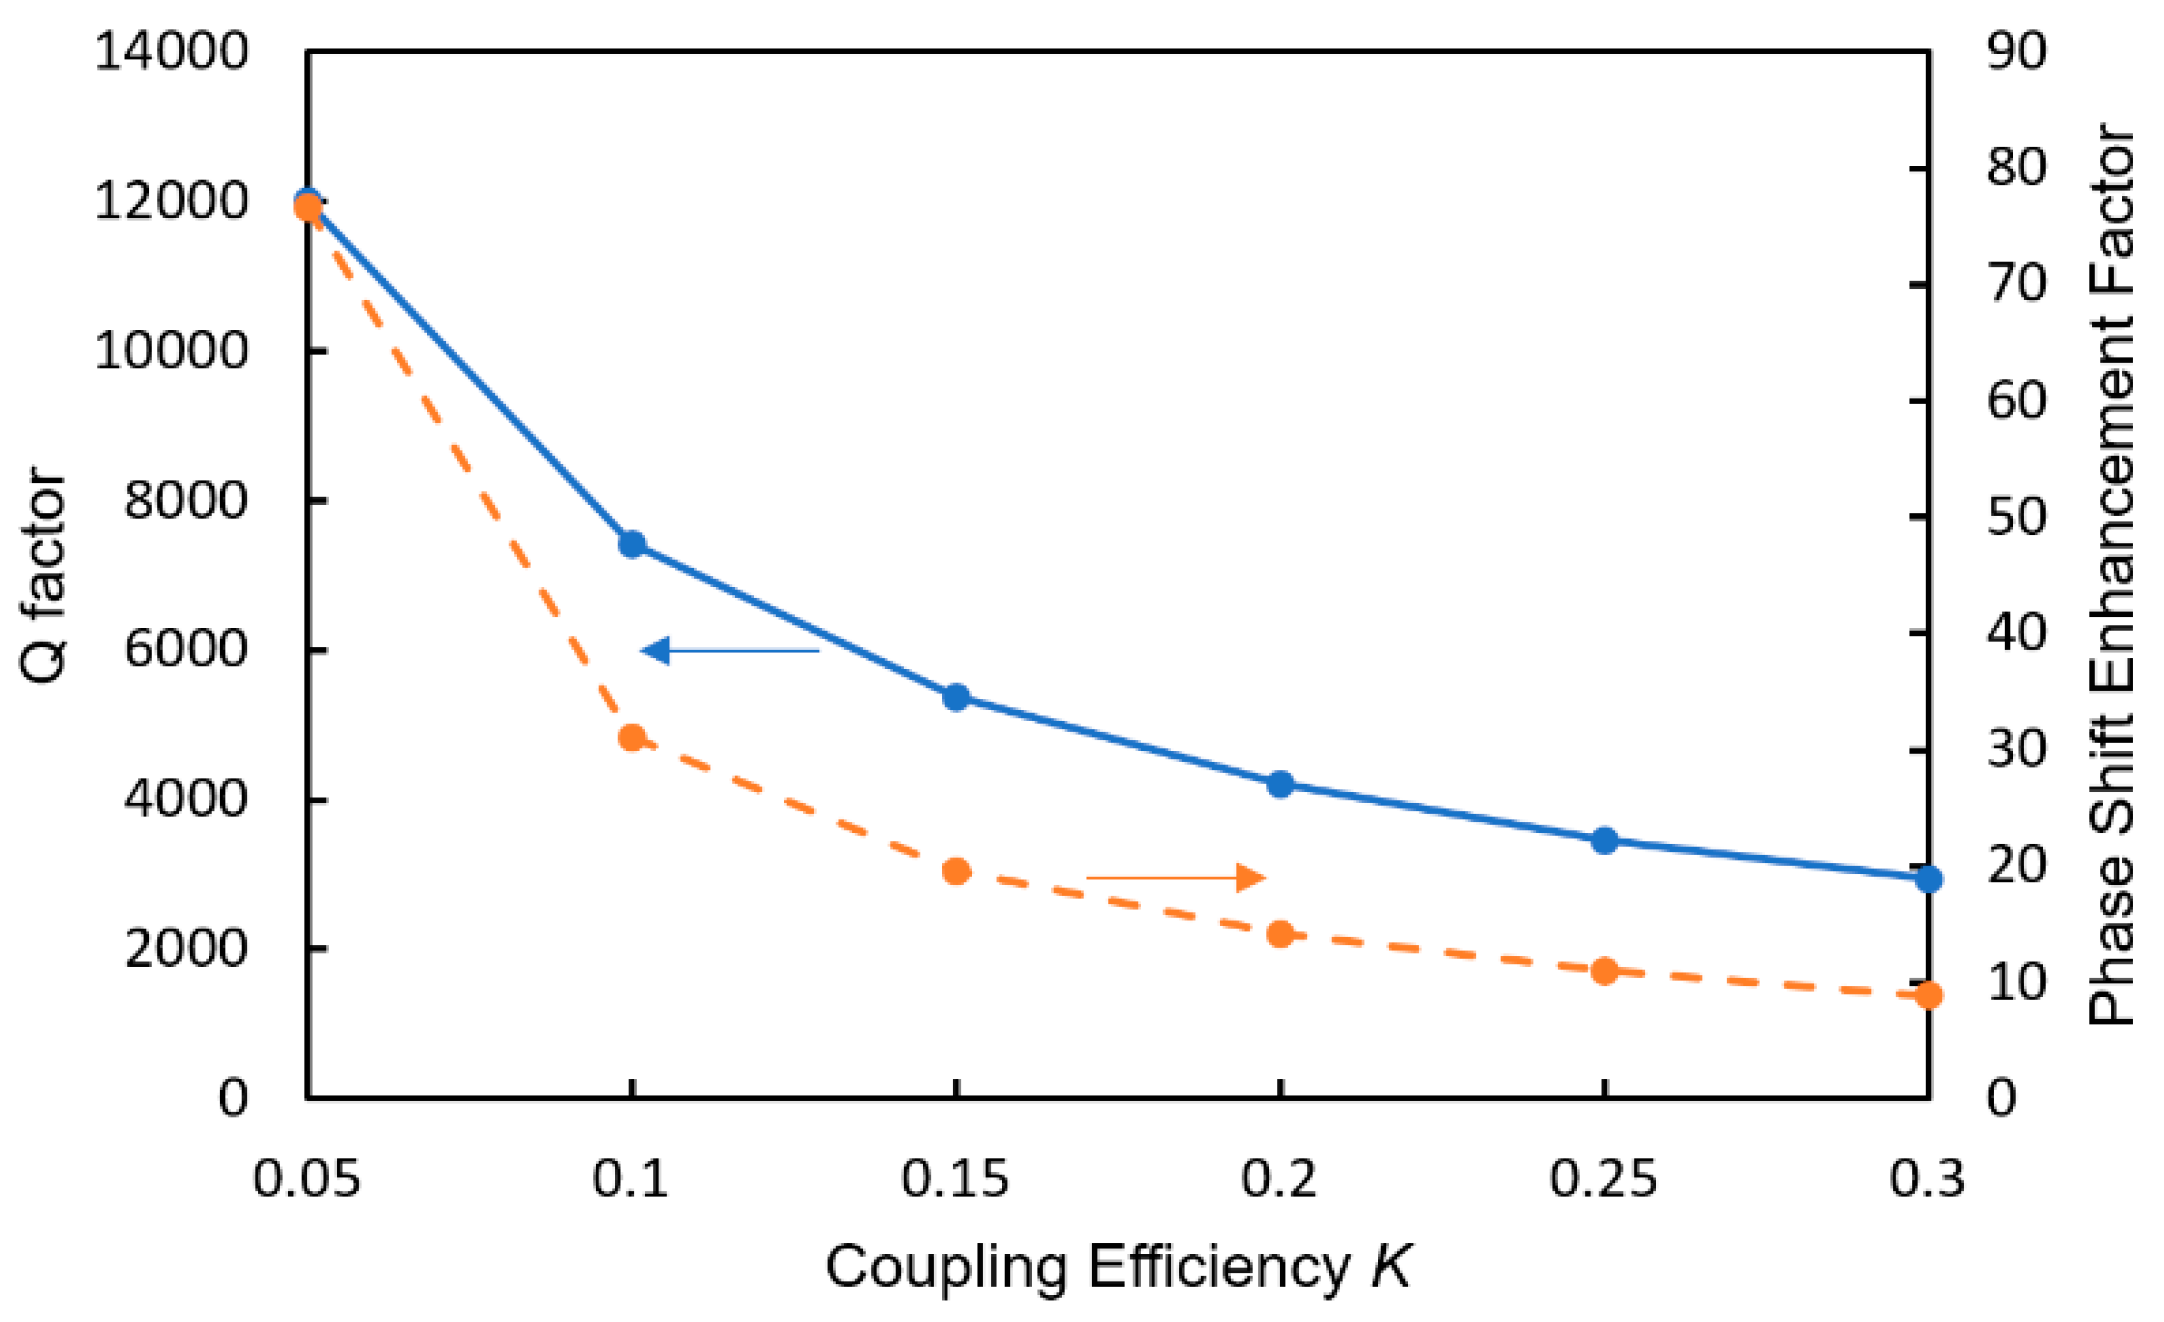
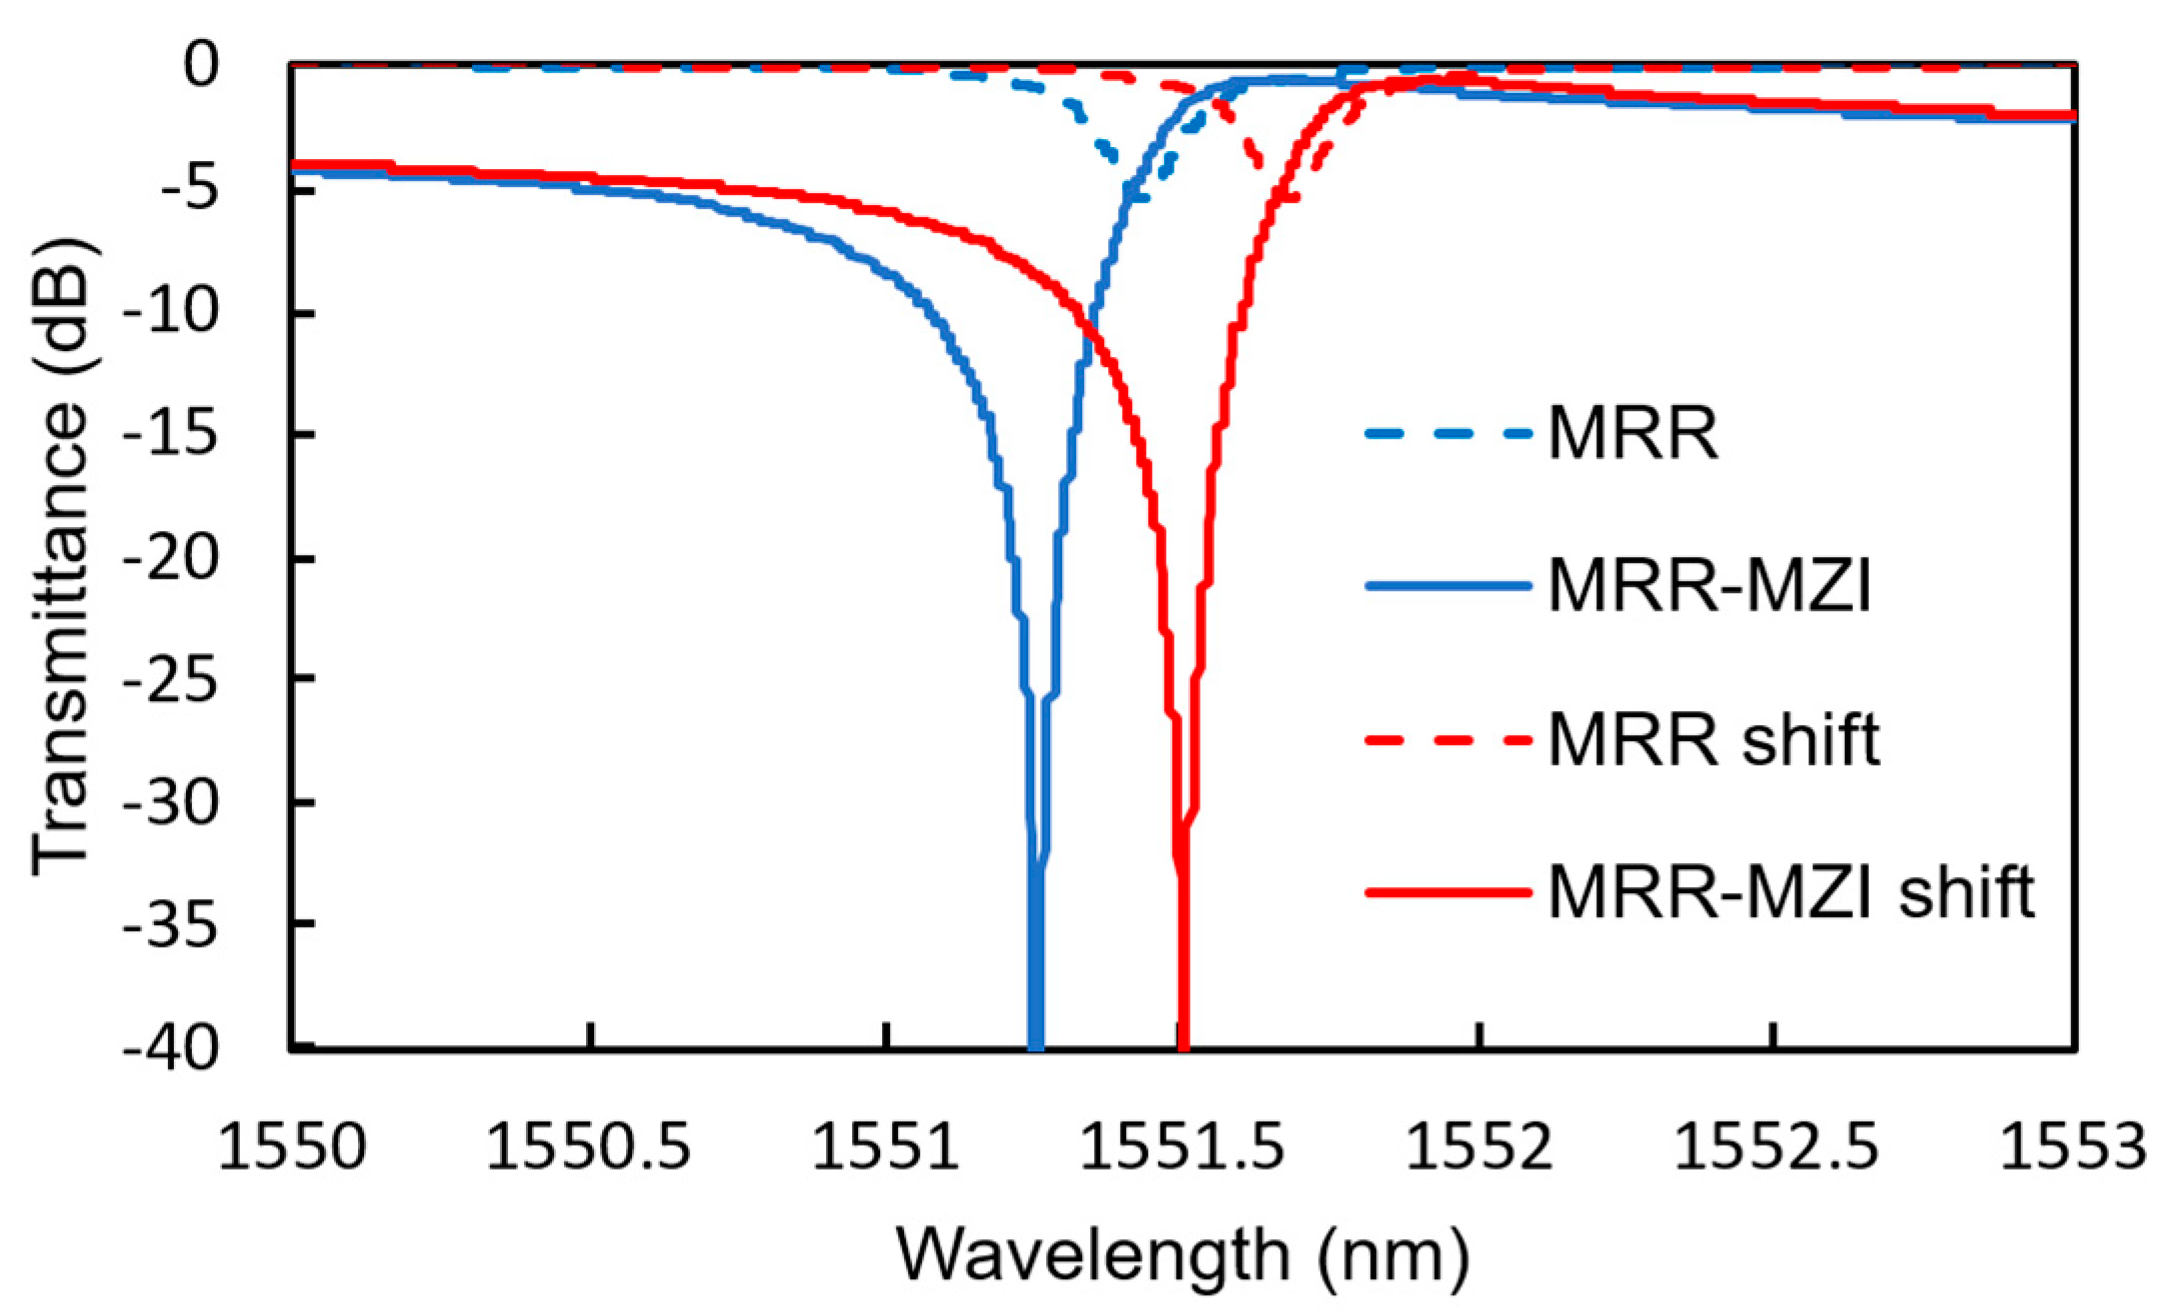
5. Design of MRR-Enhanced Mach–Zehnder Interferometer Sensor

Although we discussed the Si-MRR gas sensor in the previous sections, an MRR-enhanced Mach–Zehnder interferometer (MRR-MZI) [32,33,34] enables us to detect hydrogen with much higher sensitivity. Figure 13 shows a schematic top view of the Si-MRR-MZI sensor. An all-pass-type MRR is coupled with one of the MZI arm waveguides through a directional coupler (DC1). The length of the arm waveguide without the MRR is designed to be greater than that of the other one by 3/2 π rad. The MRR acts as a sensor for hydrogen gas and its structure is assumed to be the same as that discussed in the previous sections. A directional coupler (DC2) with a light power splitting ratio of x:1−x is used as the input coupler to balance the light powers in both arms and obtain the highest extinction ratio. For K = 0.2, x is set to 0.572. For the output coupler, a 1 × 2 multimode interference (MMI) device is used.
The MRR is a phaseshifter of the MZI and its phase shift is enhanced owing to the resonant effect in the MRR [32,33]. The phase shift enhancement factor is strongly dependent on the Q-factor of the MRR, and the Q-factor is determined by the power coupling efficiency K between the MRR and the arm waveguide. Figure 14 shows the dependence of the Q-factor and the phase shift enhancement factor Δφeffφ on K, where φeff and φ are the effective phase shift in the MRR and a single-pass phase shift, respectively.
Figure 15 shows the calculated transmittance spectra of an MRR-MZI and an MRR with K = 0.2 (Q-factor = 4220) before and after Tsen is changed by 4.4 °C, which corresponds to the change in temperature when 4.0 vol% hydrogen gas is detected. The light propagation loss in the waveguide was assumed to be 12 dB/cm. The power splitting ratio of the input MMI coupler is adjusted to obtain the highest extinction ratio. Owing to the interference effect of the MZI, a significantly high extinction ratio is obtained compared with that of the simple MRR, even though the shift in the resonant wavelength of the MRR-MZI is almost the same as that of the simple MRR.
Figure 16 shows the extinction ratio as a function of the increase in temperature for various coupling efficiencies (K). With decreasing K, the sensitivity to the temperature increases. If we assume that the MRR is the same as that previously discussed (K = 0.2, Q-factor = 4220), the temperature of the MRR increases by approximately 2.0 °C for 0.1 vol% hydrogen gas at Tsen = 20 °C, and a change in the extinction ratio larger than 40 dB is obtained if the operation wavelength is set at a suitable value, which is much larger than that of the simple MRR (less than 10 dB). One of the advantages of the MMR-MZI sensor is that the extinction ratio is very sensitive to the concentration of hydrogen. If the detecting wavelength is fixed at an appropriate value, the transmittance changes significantly upon exposure to hydrogen, and a much higher sensitivity can be realized without a spectrum analyzer.

6. Conclusions

We fabricated an optical hydrogen sensor based on a silicon MRR with a WO3/SiO2 layer using a CMOS-compatible process for the MRR and a sol-gel method for the WO3 layer and investigated its sensing characteristics at device temperatures of 5, 20, and 30 °C. At each temperature, a hydrogen concentration of as low as 0.1% was successfully detected with a response time of 10 s. The gas sensitivity increased with decreasing temperature. The dependence of the sensitivity on the device temperature can be attributed to the thickness of the HxWO3 layer formed by WO3 during exposure to hydrogen. In addition, a hydrogen gas sensor based on an Si-MRR-enhanced MZI was proposed and its significantly high sensing ability using improved changes in the transmittance of light was theoretically discussed. Such WO3/Si-MRR-based sensors are promising for simple but highly sensitive hydrogen gas sensing.

Author Contributions

Conceptualization, T.A., S.O., and Y.N.; Methodology, T.A., S.O., and Y.N.; Investigation, S.M., N.Y., T.A., and S.O.; Writing—original draft preparation, T.A. and S.M.; Writing—review and editing, T.A., S.O., and Y.N.; Supervision, T.A.; Funding acquisition, T.A., Y.N., and S.O. All authors have read and agreed to the published version of the manuscript.

Funding

This research was funded by a Grant-in-Aid for Scientific Research B (No. 18H01897) from the Ministry of Education, Culture, Sports, Science and Technology, Japan, and the bilateral Japan–Lithuania joint research of Japan Society for the Promotion of Science (JSPS).

Conflicts of Interest

The authors declare no conflict of interest.

References

  1. Crowl, D.A.; Jo, Y.D. The hazards and risks of hydrogen. J. Loss Prevent. Proc. 2007, 20, 158–164. [Google Scholar] [CrossRef]
  2. Hubert, T.; Boon-Brett, L.; Black, G.; Banach, U. Hydrogen sensors—A review. Sens. Actuators B 2011, 157, 329–352. [Google Scholar] [CrossRef]
  3. Buttner, W.J.; Post, M.B.; Burgess, R.; Rivkin, C. An overview of hydrogen safety sensors and requirements. Int. J. Hydrog. Energy 2011, 36, 2462–2470. [Google Scholar] [CrossRef]
  4. Katsuki, A.; Fukui, K. Improvement of humidity dependence in gas sensor based on SnO2. Sens. Actuators B 2000, 65, 316–318. [Google Scholar]
  5. Rosini, S.; Siebert, E. Electrochemical sensors for detection of hydrogen in air model of non-Nernstian potentiometric response of platinum gas diffusion electrodes. J. Electrochem. Acta. 2005, 50, 2942–2953. [Google Scholar] [CrossRef]
  6. Martin, L.P.; Pham, A.Q.; Glass, R.S. Electrochemical hydrogen sensor for safety monitoring. Solid State Ionics 2004, 175, 527–530. [Google Scholar] [CrossRef] [Green Version]
  7. Nakagawa, H.; Yamamoto, N.; Okazaki, S.; Chinzei, T.; Asakura, S. A room-temperature operated hydrogen leak sensor. Sens. Actuators B 2003, 93, 468–474. [Google Scholar] [CrossRef]
  8. Shukla, S.; Zhang, P.; Cho, H.J.; Seal, S.; Ludwig, L. Room temperature hydrogen response kinetics of nano-micro-integrated doped tin oxide sensor. Sens. Actuators B 2007, 120, 573–583. [Google Scholar] [CrossRef]
  9. Arya, S.K.; Krishman, S.; Silva, H.; Jean, S.; Bhansali, S. Advances in materials for room temperature hydrogen sensors. Analyst 2012, 137, 2743–2756. [Google Scholar] [CrossRef]
  10. Gu, H.; Wang, Z.; Hu, Y. Hydrogen Gas Sensors Based on Semiconductor Oxide Nanostructures. Sensors 2012, 12, 5517–5550. [Google Scholar] [CrossRef] [Green Version]
  11. Wang, Z.; Hu, Y.; Wang, W.; Zhang, X.; Wang, B.; Tian, H.; Wang, Y.; Guan, J.; Gu, H. Fast and highly-sensitive hydrogen sensing of Nb2O5 nanowires at room temperature. Int. J. Hydrog. Energy 2012, 37, 4526–4532. [Google Scholar] [CrossRef]
  12. Tokutake, K.; Okazaki, S. Development of an antenna coil type sensor device for hydrogen leakage detection. Sens. Actuators B 2014, 191, 165–170. [Google Scholar] [CrossRef] [Green Version]
  13. Sil, D.; Hines, J.; Udeoyo, U.; Borguet, E. Palladium nanoparticle-based surface acoustic wave hydrogen sensor. ACS Appl. Mater. Interfaces 2015, 7, 5709–5714. [Google Scholar] [CrossRef] [PubMed]
  14. Zhang, Y.N.; Peng, H.; Qian, X.; Zhang, Y.; An, G.; Zhao, Y. Recent advancements in optical fiber hydrogen sensors. Sens. Actuators B 2017, 244, 393–416. [Google Scholar] [CrossRef] [Green Version]
  15. Watanabe, T.; Okazaki, O.; Nakagawa, H.; Murata, K.; Fukuda, K. A fiber-optic hydrogen gas sensor with low propagation loss. Sens. Actuators B 2010, 145, 781–787. [Google Scholar] [CrossRef]
  16. Masuzawa, S.; Okazaki, S.; Yusuke, M.; Tadahiro, M. Catalyst-type-an optical fiber sensor for hydrogen leakage based on fiber Bragg gratings. Sens. Actuators B 2015, 217, 151–157. [Google Scholar] [CrossRef]
  17. Li, Y.; Zhao, C.; Xu, B.; Wang, D.; Yang, M. Optical cascaded Fabry-Perot interferometer hydrogen sensor based on vernier effect. Opt. Commun. 2018, 414, 166–171. [Google Scholar] [CrossRef]
  18. Yan, M.; Tylczak, J.; Yu, Y.; Panagakos, G.; Ohodnicki, P. Multi-component optical sensing of high temperature gas streams using functional oxide integrated silica based optical fiber sensors. Sens. Actuators B 2018, 255, 357–365. [Google Scholar] [CrossRef]
  19. Mirzaei, A.; Kim, J.H.; Kim, H.W.; Kim, S.S. Gasochromic WO3 Nanostructures for the Detection of Hydrogen Gas: An Overview. Appl. Sci. 2019, 9, 1775. [Google Scholar] [CrossRef] [Green Version]
  20. Yebo, N.A.; Tailaert, D.; Roels, J.; Lahem, D.; Debliquy, M.; Thourhout, D.V.; Baets, R. Silicon-on-Insulator (SOI) Ring Resonator-Based Integrated Optical Hydrogen Sensor. IEEE Photonics Technol. Lett. 2009, 21, 960–962. [Google Scholar] [CrossRef] [Green Version]
  21. Olyaee, S.; Mohebzadeh-Bahabady, A. Designing a novel photonic crystal nano-ring resorator for biosensor application. Opt. Quantum Electron. 2015, 47, 1881–1888. [Google Scholar] [CrossRef]
  22. Eryurek, M.; Karadag, Y.; Tasaltin, N.; Kilibc, N.; Kiraz, A. Optical sensor for hydrogen gas based on a palladium-coated polymer mocroresonator. Sens. Actuators B 2015, 212, 78–83. [Google Scholar] [CrossRef]
  23. Meziane, F.; Raimbault, V.; Hallil, H.; Joly, S.; Conédéra, V.; Lachaud, J.L.; Béchou, L.; Rebière, D.; Dejous, C. Study of a polymer optical microring resonator for hexavalent chromium sensing. Sens. Actuators B 2015, 209, 1049–1056. [Google Scholar] [CrossRef]
  24. Donzella, V.; Sherwaili, A.; Flueckiger, J.; Grist, S.M.; Fard, S.T.; Chrostowski, L. Design and fabrication of SOI micro-ring resonators based on sub-wavelength grating waveguides. Opt. Express. 2015, 23, 4791–4803. [Google Scholar] [CrossRef] [PubMed]
  25. Zhang, P.; Ding, Y.; Wang, Y. Asymmetrical microring resonator based on whispering gallery modes for the detection of glucose concentration. Optik 2018, 171, 642–647. [Google Scholar] [CrossRef]
  26. Liu, Q.; Lim, B.K.L.; Lim, S.Y.; Tang, W.Y.; Gu, Z.; Chung, J.; Park, M.K.; Barkham, T. Label-free real-time and multiplex detection of Mycobacterium tuberculosis based on silicon photonic microring sensors and asymmetric isothermal amplification technique (SPMS-AIA). Sens. Actuators B 2018, 255, 1595–1603. [Google Scholar] [CrossRef]
  27. Fu, D.; Chung, J.; Liu, Q.; Raziq, R.; Kee, J.S.; Park, M.K.; Valiyaveettil, S.; Lee, P. Polymer coated silicon microring device for the detection of sub-ppm volatile organic compounds. Sens. Actuators B 2018, 257, 136–142. [Google Scholar] [CrossRef]
  28. Amrehn, S.; Wu, X.; Wagner, T. Tungsten Oxide Photonic Crystals as Optical Transducer for Gas Sensing. ACS Sens. 2018, 3, 191–199. [Google Scholar] [CrossRef] [Green Version]
  29. Kishikawa, H.; Sato, M.; Goto, N.; Yanagiya, S.; Kaito, T.; Liaw, S.K. An optical ammonia gas sensor with adjustable sensitivity using a silicon microring resonator covered with monolayer graphene. Jpn. J. Appl. Phys. 2019, 58, SDDJ05. [Google Scholar] [CrossRef]
  30. Yamasaku, N.; Matsuura, S.; Nishijima, Y.; Arakawa, T.; Okazaki, S. Response characteristics of silicon microring resonator. IEEJ Trans. Sens. Micromachines 2019, 139, 2–6. [Google Scholar] [CrossRef]
  31. Hussain, Z. Dopant-dependent reflectivity and refractive index of microcrystalline HxWO3 and LixWO3 bronze thin films. Appl. Opt. 2002, 41, 6708–6724. [Google Scholar] [CrossRef] [PubMed]
  32. Kaneshige, H.; Gautam, R.; Ueyama, Y.; Katouf, K.; Arakawa, T.; Kokubun, Y. Low-voltage quantum well microring-enhanced Mach-Zehnder modulator. Opt. Express. 2013, 21, 16888–16900. [Google Scholar] [CrossRef] [PubMed]
  33. Yoshida, S.; Ishihara, S.; Arakawa, T.; Kokubun, Y. Highly sensitive optical biosensor based on silicon-microring-resonator-loaded Mach–Zehnder interferometer. Jpn. J. Appl. Phys. 2017, 56, 04CH08. [Google Scholar] [CrossRef] [Green Version]
  34. Yoshida, S.; Ishihara, S.; Nishijima, Y.; Kokubun, Y.; Arakawa, T. Improved Sensitivity of Microring Resonator-Loaded Mach–Zehnder Interferometer Biosensor. Sens. Mater. 2017, 29, 1241–1246. [Google Scholar]
Figure 1. Schematic view of the proposed Pt-WO3/Si microring resonator (MRR)-based H2 gas sensor.
Sensors 20 00096 g001
Figure 2. Calculated dip depth and width at 0.1 dB from the bottom of the dip for the MRR with LMRR = 69.3 μm and K = 0.2 as a function of the thickness of the upper SiO2 layer.
Sensors 20 00096 g002
Figure 3. Scanning electron microscopy images of fabricated MRR (a) before deposition of Pt-WO3/SiO2 upper cladding layer and (b) after deposition of upper WO3/SiO2 layer [30].
Sensors 20 00096 g003
Figure 4. Atomic force microscopy images of the surface of the WO3 layer over areas of (a) 10 × 10 μm2 and (b) 100 × 100 μm2. Ra denotes average roughness.
Sensors 20 00096 g004
Figure 5. X-ray diffraction pattern of the WO3 layer.
Sensors 20 00096 g005
Figure 6. Transmittance spectrum of fabricated Si-MRR.
Sensors 20 00096 g006
Figure 7. Schematic measurement setup for sensing characteristics of the MRR sensor.
Sensors 20 00096 g007
Figure 8. Measured spectra of the transmitted light for H2 concentration of 0 to 10 vol% at Tsen = 20 °C.
Sensors 20 00096 g008
Figure 9. Resonant wavelength shift of MRR sensor when exposed to hydrogen/air mixed gases with different hydrogen concentrations measured at (a) 20 °C, (b) 5 °C, and (c) 30 °C.
Sensors 20 00096 g009
Figure 10. Wavelength shift as a function of elapsed time upon exposure to 4.0 vol% hydrogen gas at different temperatures.
Sensors 20 00096 g010
Figure 11. Dependence of wavelength shift at an elapsed time of 10 s on hydrogen concentration.
Sensors 20 00096 g011
Figure 12. Relationship between the evaluated thickness of the HxWO3 layer on the surface side and hydrogen concentration of gas to which the sensor is exposed.
Sensors 20 00096 g012
Figure 13. Schematic top view of the silicon-MRR-enhanced Mach–Zehnder interferometer (Si-MRR-MZI) sensor.
Sensors 20 00096 g013
Figure 14. Dependence of the Q-factor and the phase shift enhancement factor Δφeffφ on K.
Sensors 20 00096 g014
Figure 15. Transmittance spectra of the MRR-MZI with K = 0.2 (Q-factor = 4220).
Sensors 20 00096 g015
Figure 16. Extinction ratio as a function of the increase in temperature for various K.
Sensors 20 00096 g016
Table 1. Device parameters of MRR sensor.
SymbolDescriptionValue
LMRRRound-trip length of MRR69.3 μm
LCLength of directional coupler5.4 μm
KPower coupling efficiency of directional coupler0.2
tWO3Thickness of WO3 upper cladding layer700 nm
tSiO2Thickness of SiO2 upper cladding layer700 nm
Table 2. Refractive indices and extinction coefficients of tungsten oxide (WO3) and tungsten bronze (HxWO3).
SymbolDescriptionWO3HxWO3Reference
nRefractive index2.02.4[15]
κExtinction coefficient0.1–0.31.0[31]

