Towards Mixed-Initiative Human–Robot Interaction: Assessment of Discriminative Physiological and Behavioral Features for Performance Prediction


Abstract
1. Introduction
2. Materials and Methods
2.1. Participants
2.2. Firefighter Robot Mission Task
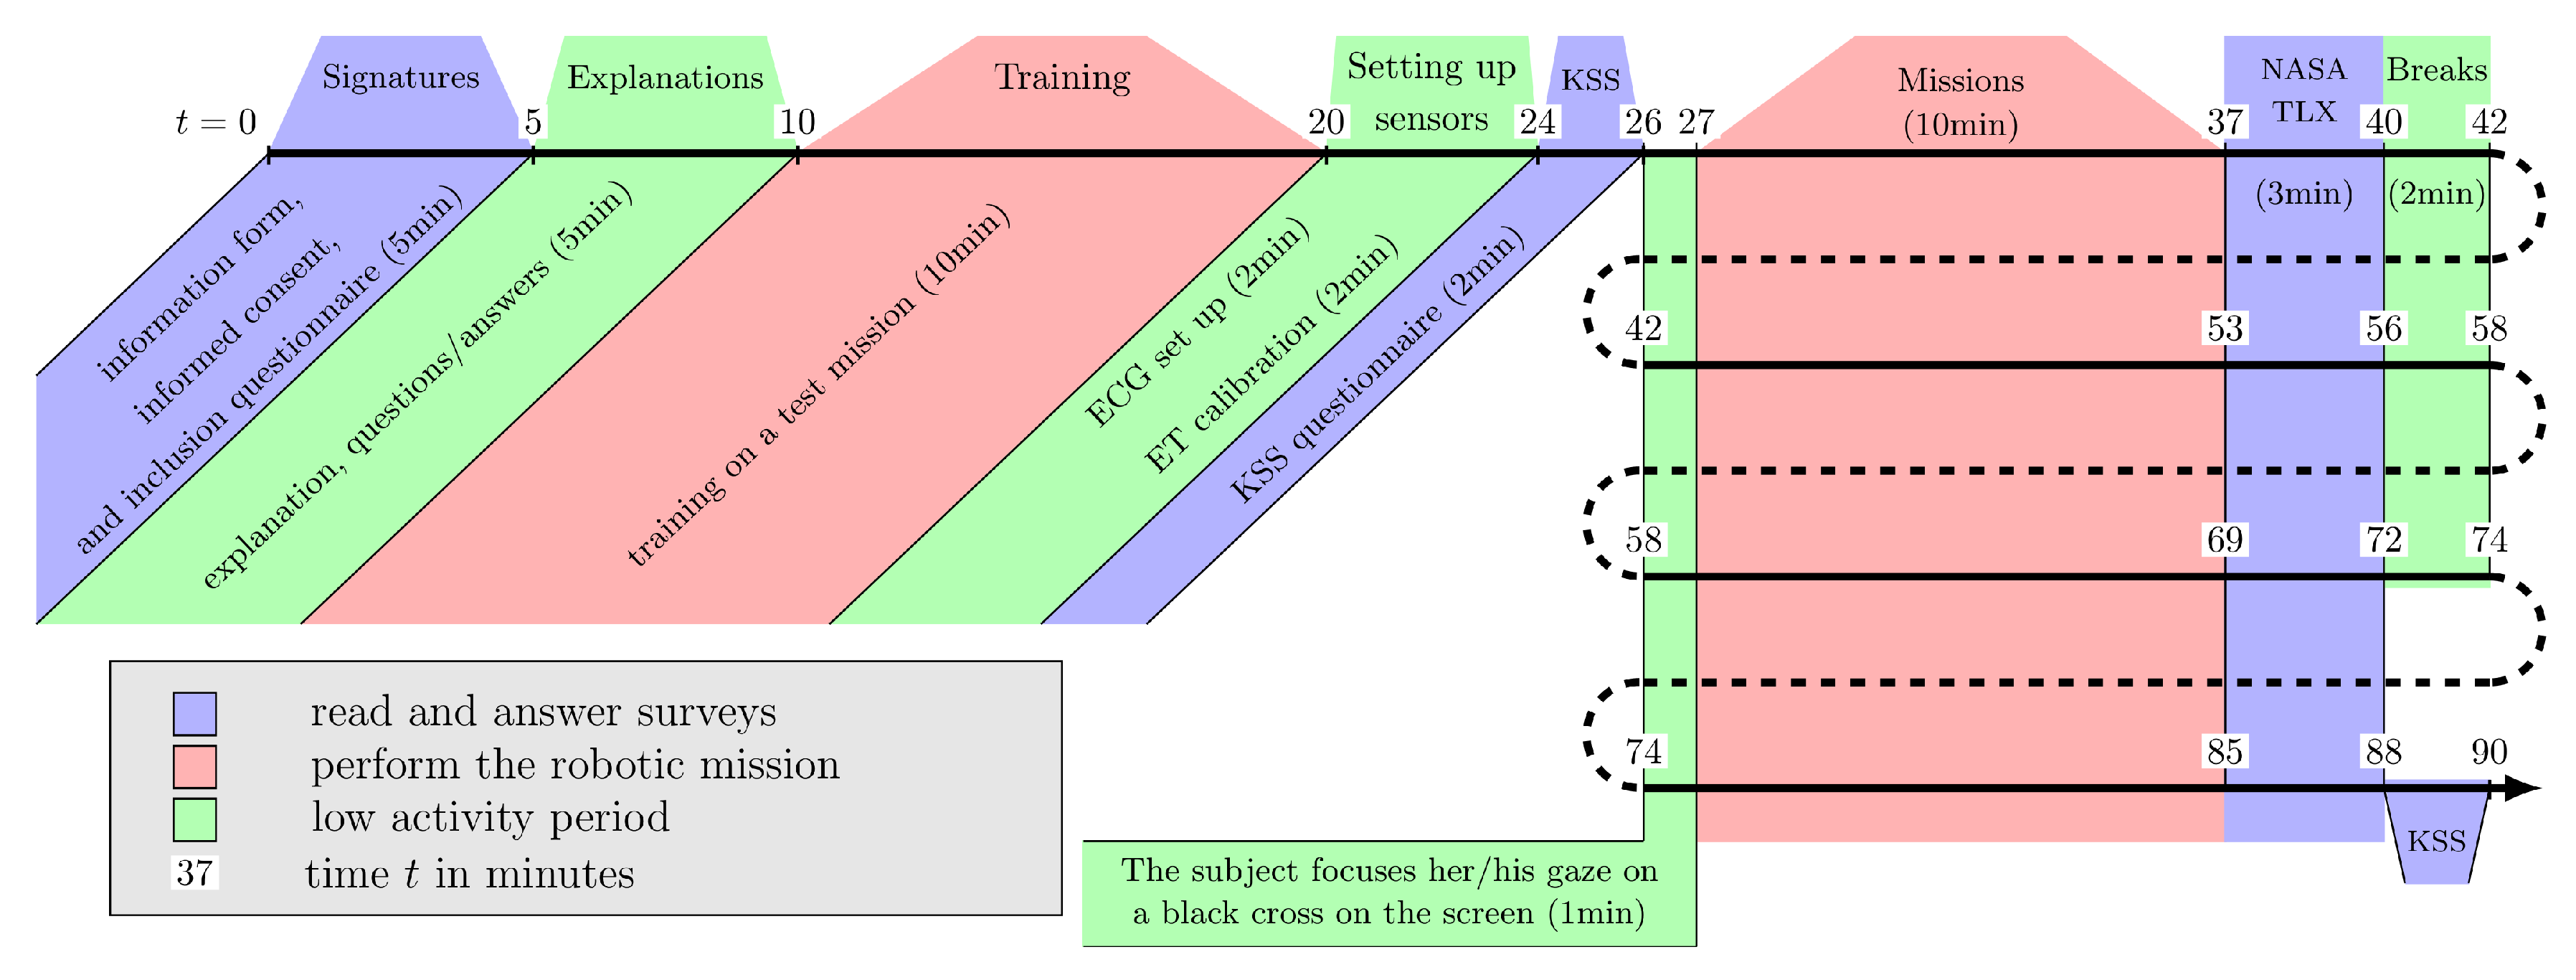
2.3. Experimental Protocol
- Rest period: the participants focused on a black cross in the center of the screen during 1 min. This allows to obtain a cardiac baseline.
- Mission: the mission is launched and its maximum duration is 10 min.
- Questionnaire: when the mission is finished, the participants are asked to fill the NASA-TLX survey [36] to get their subjective feedback concerning the effort made to carry out the mission (see the paragraph “Subjective Feedback” Section 2.5.1).
- Break: a 2 min break is proposed to the participants.
2.4. Data Collection
2.5. Data Analysis
2.5.1. Data Processing
Performance Scores
Subjective Feedback
Behavioral Data
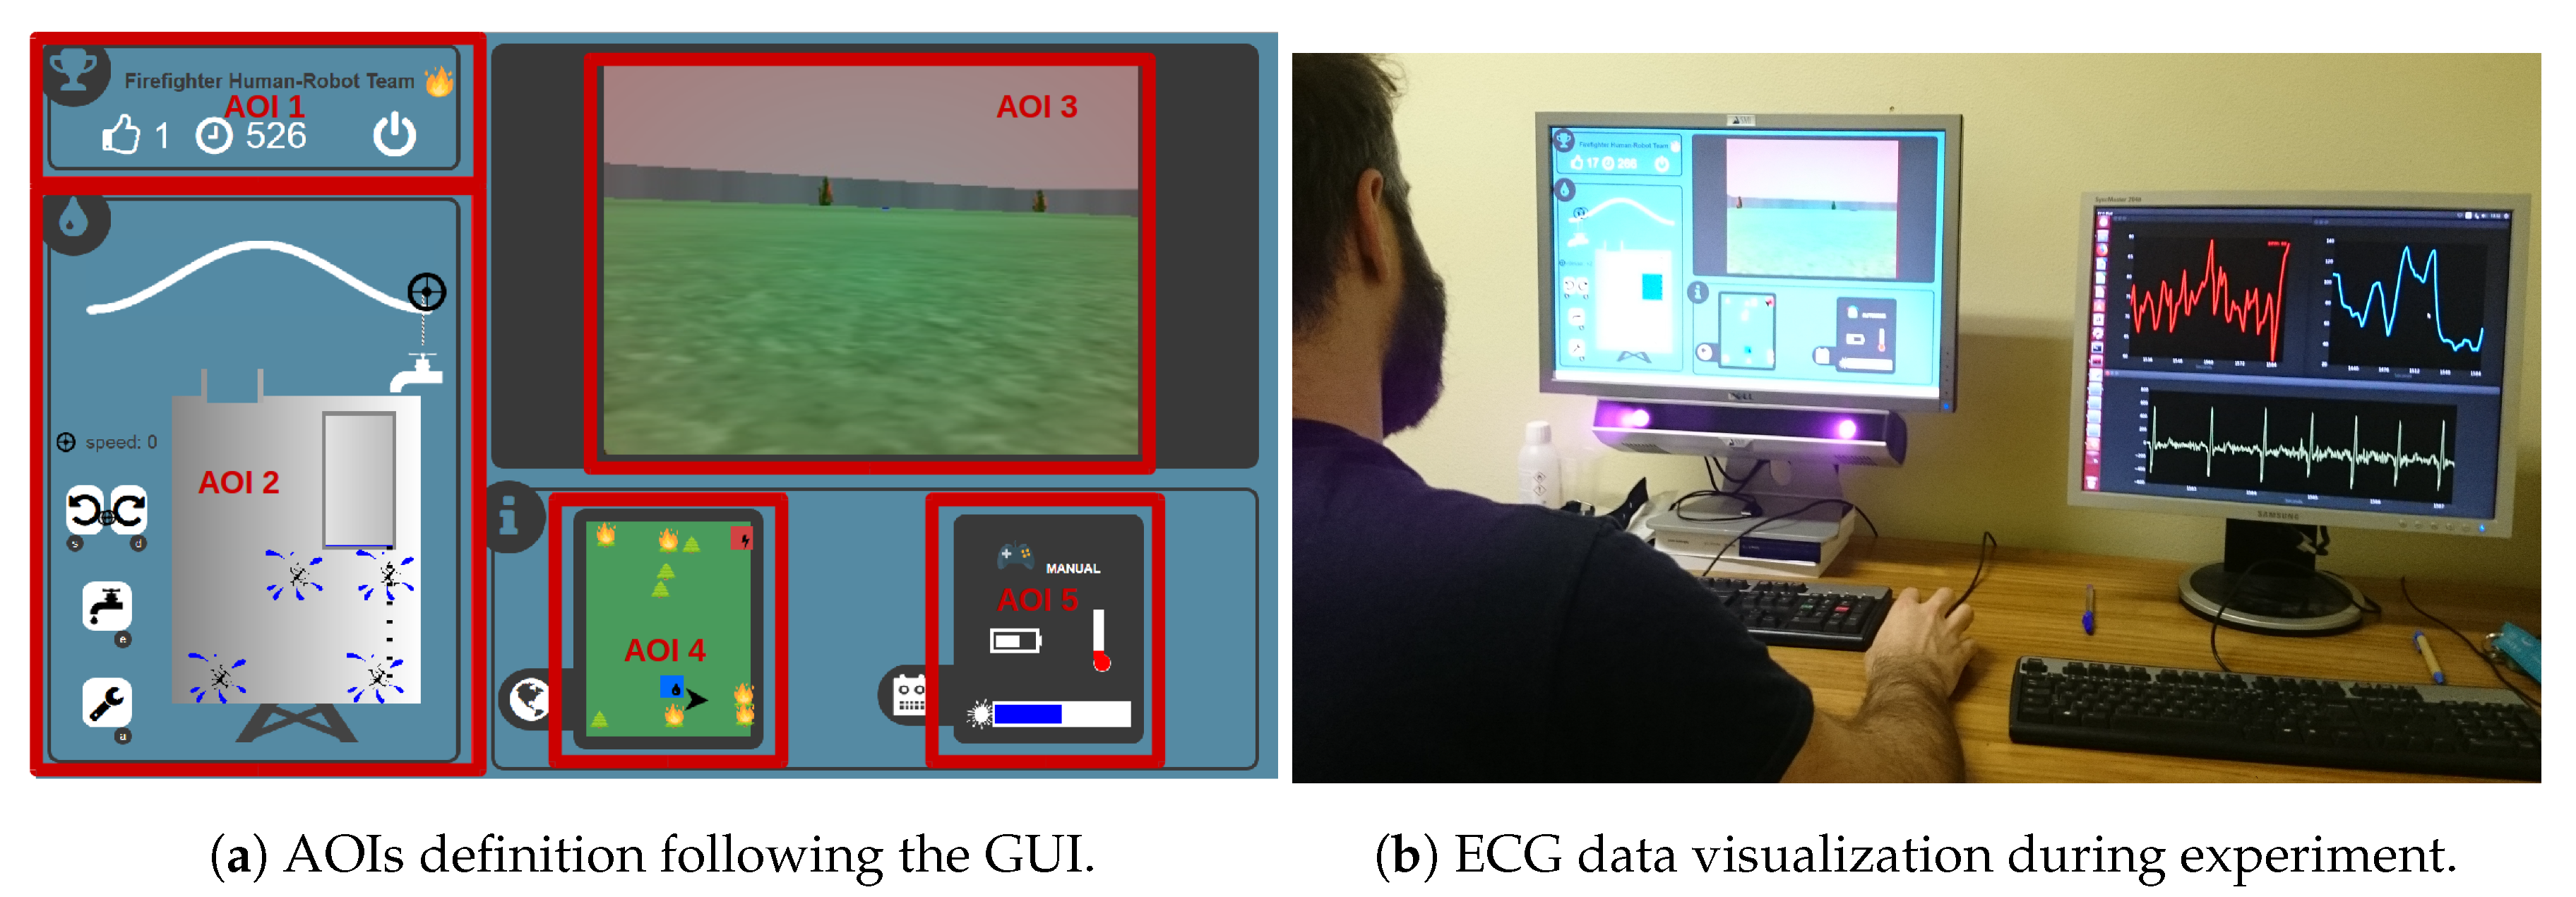
Eye-Tracking
ECG Data
2.5.2. Statistical Analysis
Mission Performance Analysis
Behavioral and Physiological Markers’ Analysis Depending on the Robot Automation Level and the Performance Group
2.5.3. Classification
3. Results
3.1. Subjective Feedback
3.2. Behavioral Markers
3.2.1. Operator’s Contribution to Mission Score Given the Performance Group
3.2.2. Operator’s Actions on the Interface Given the Robot Automation Level and the Performance Group
External Tank Water Level Variation With Respect to the Performance Group
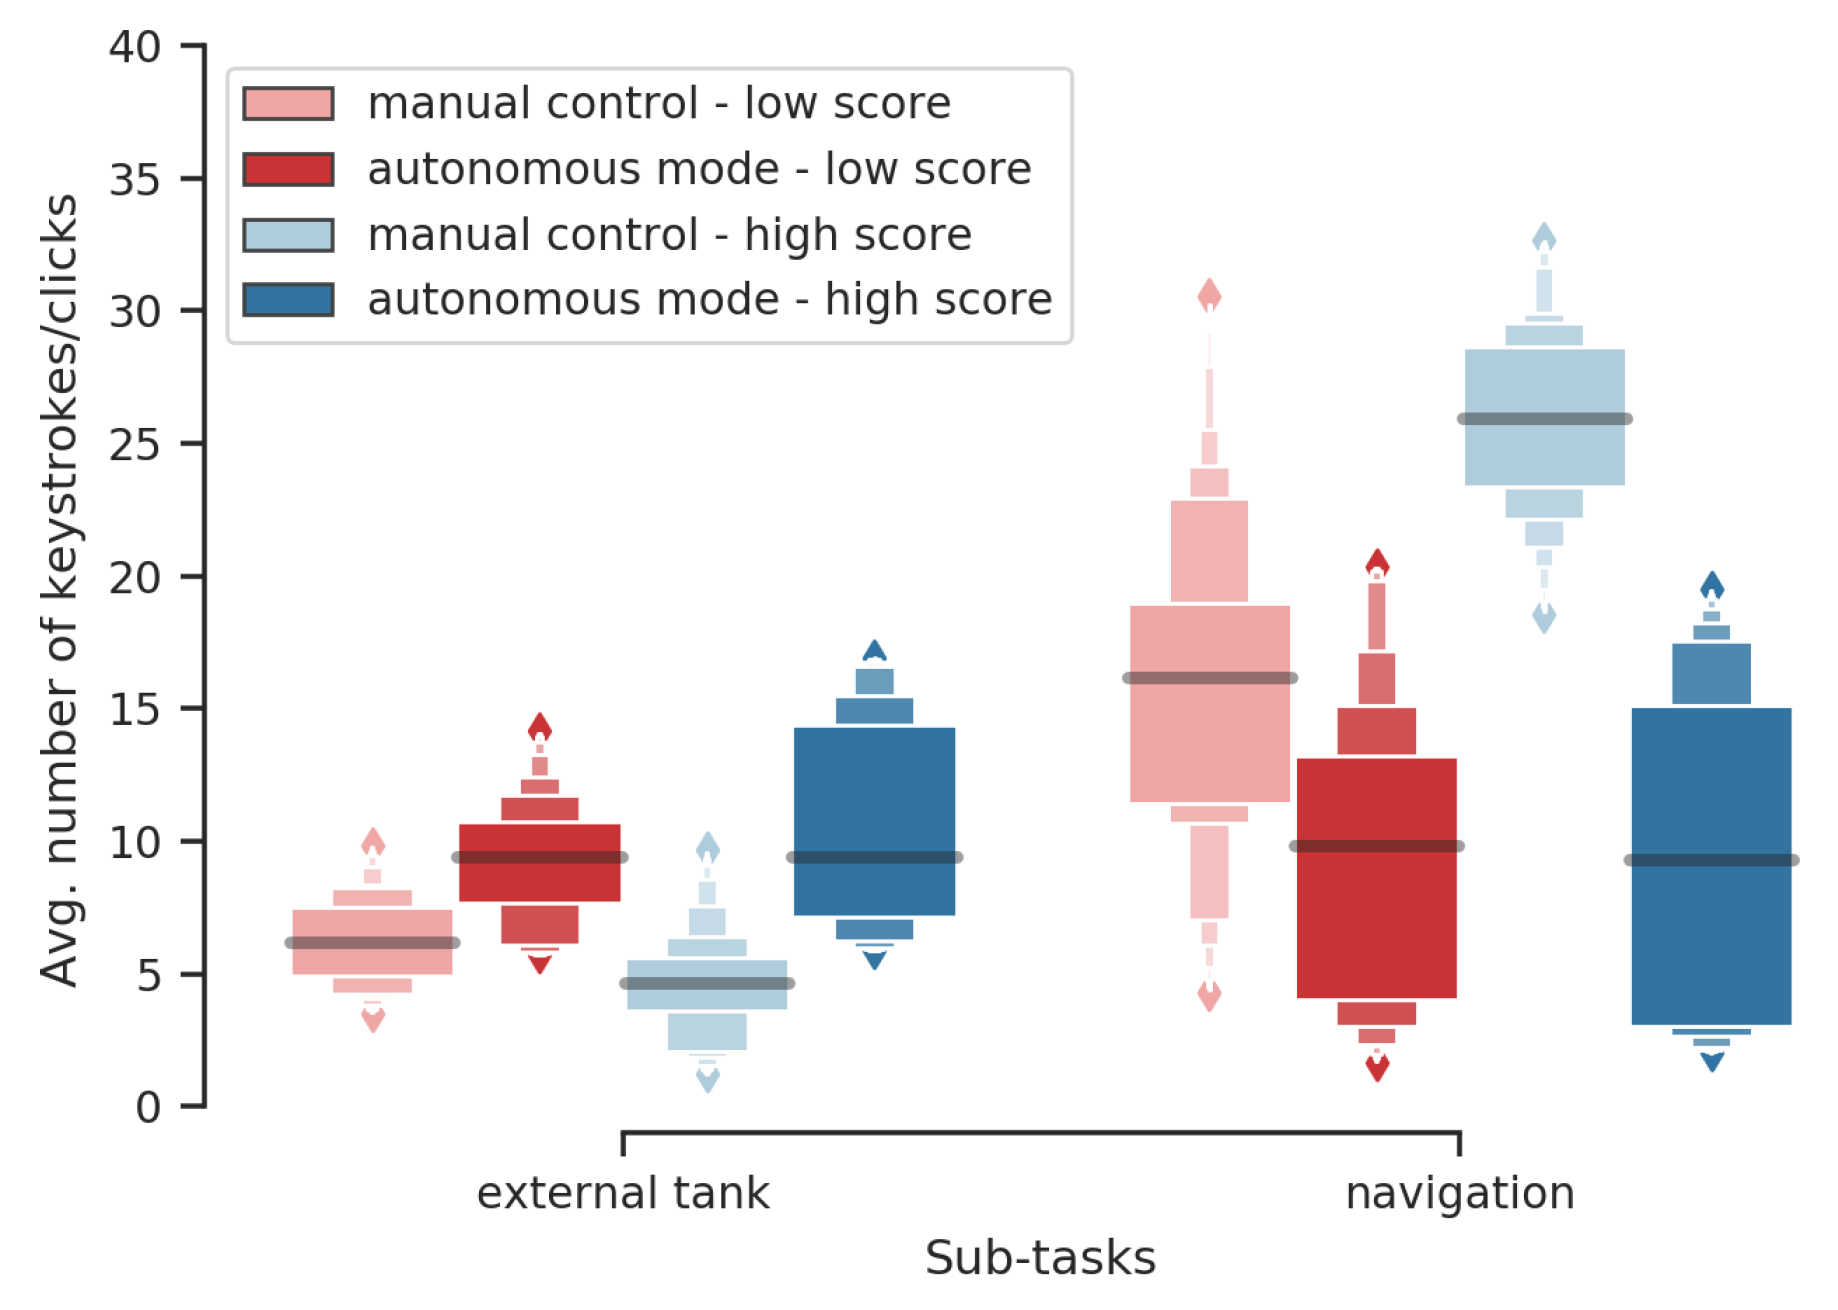
Keystrokes/Clicks Given the Robot Automation Level and Performance Group
- when the robot is in autonomous mode, participants use more actions (keystrokes/clicks) related to the external tank during high score missions than during low score missions ();
- when the robot is in manual control, participants use more the navigation-related keystrokes during high-score missions than during low score missions (); and
- in autonomous mode participants use more the navigation-related keystrokes during low score missions than high score missions (). Note that it represents behavioral errors since the robot does not need to be driven in autonomous mode (high automation level).
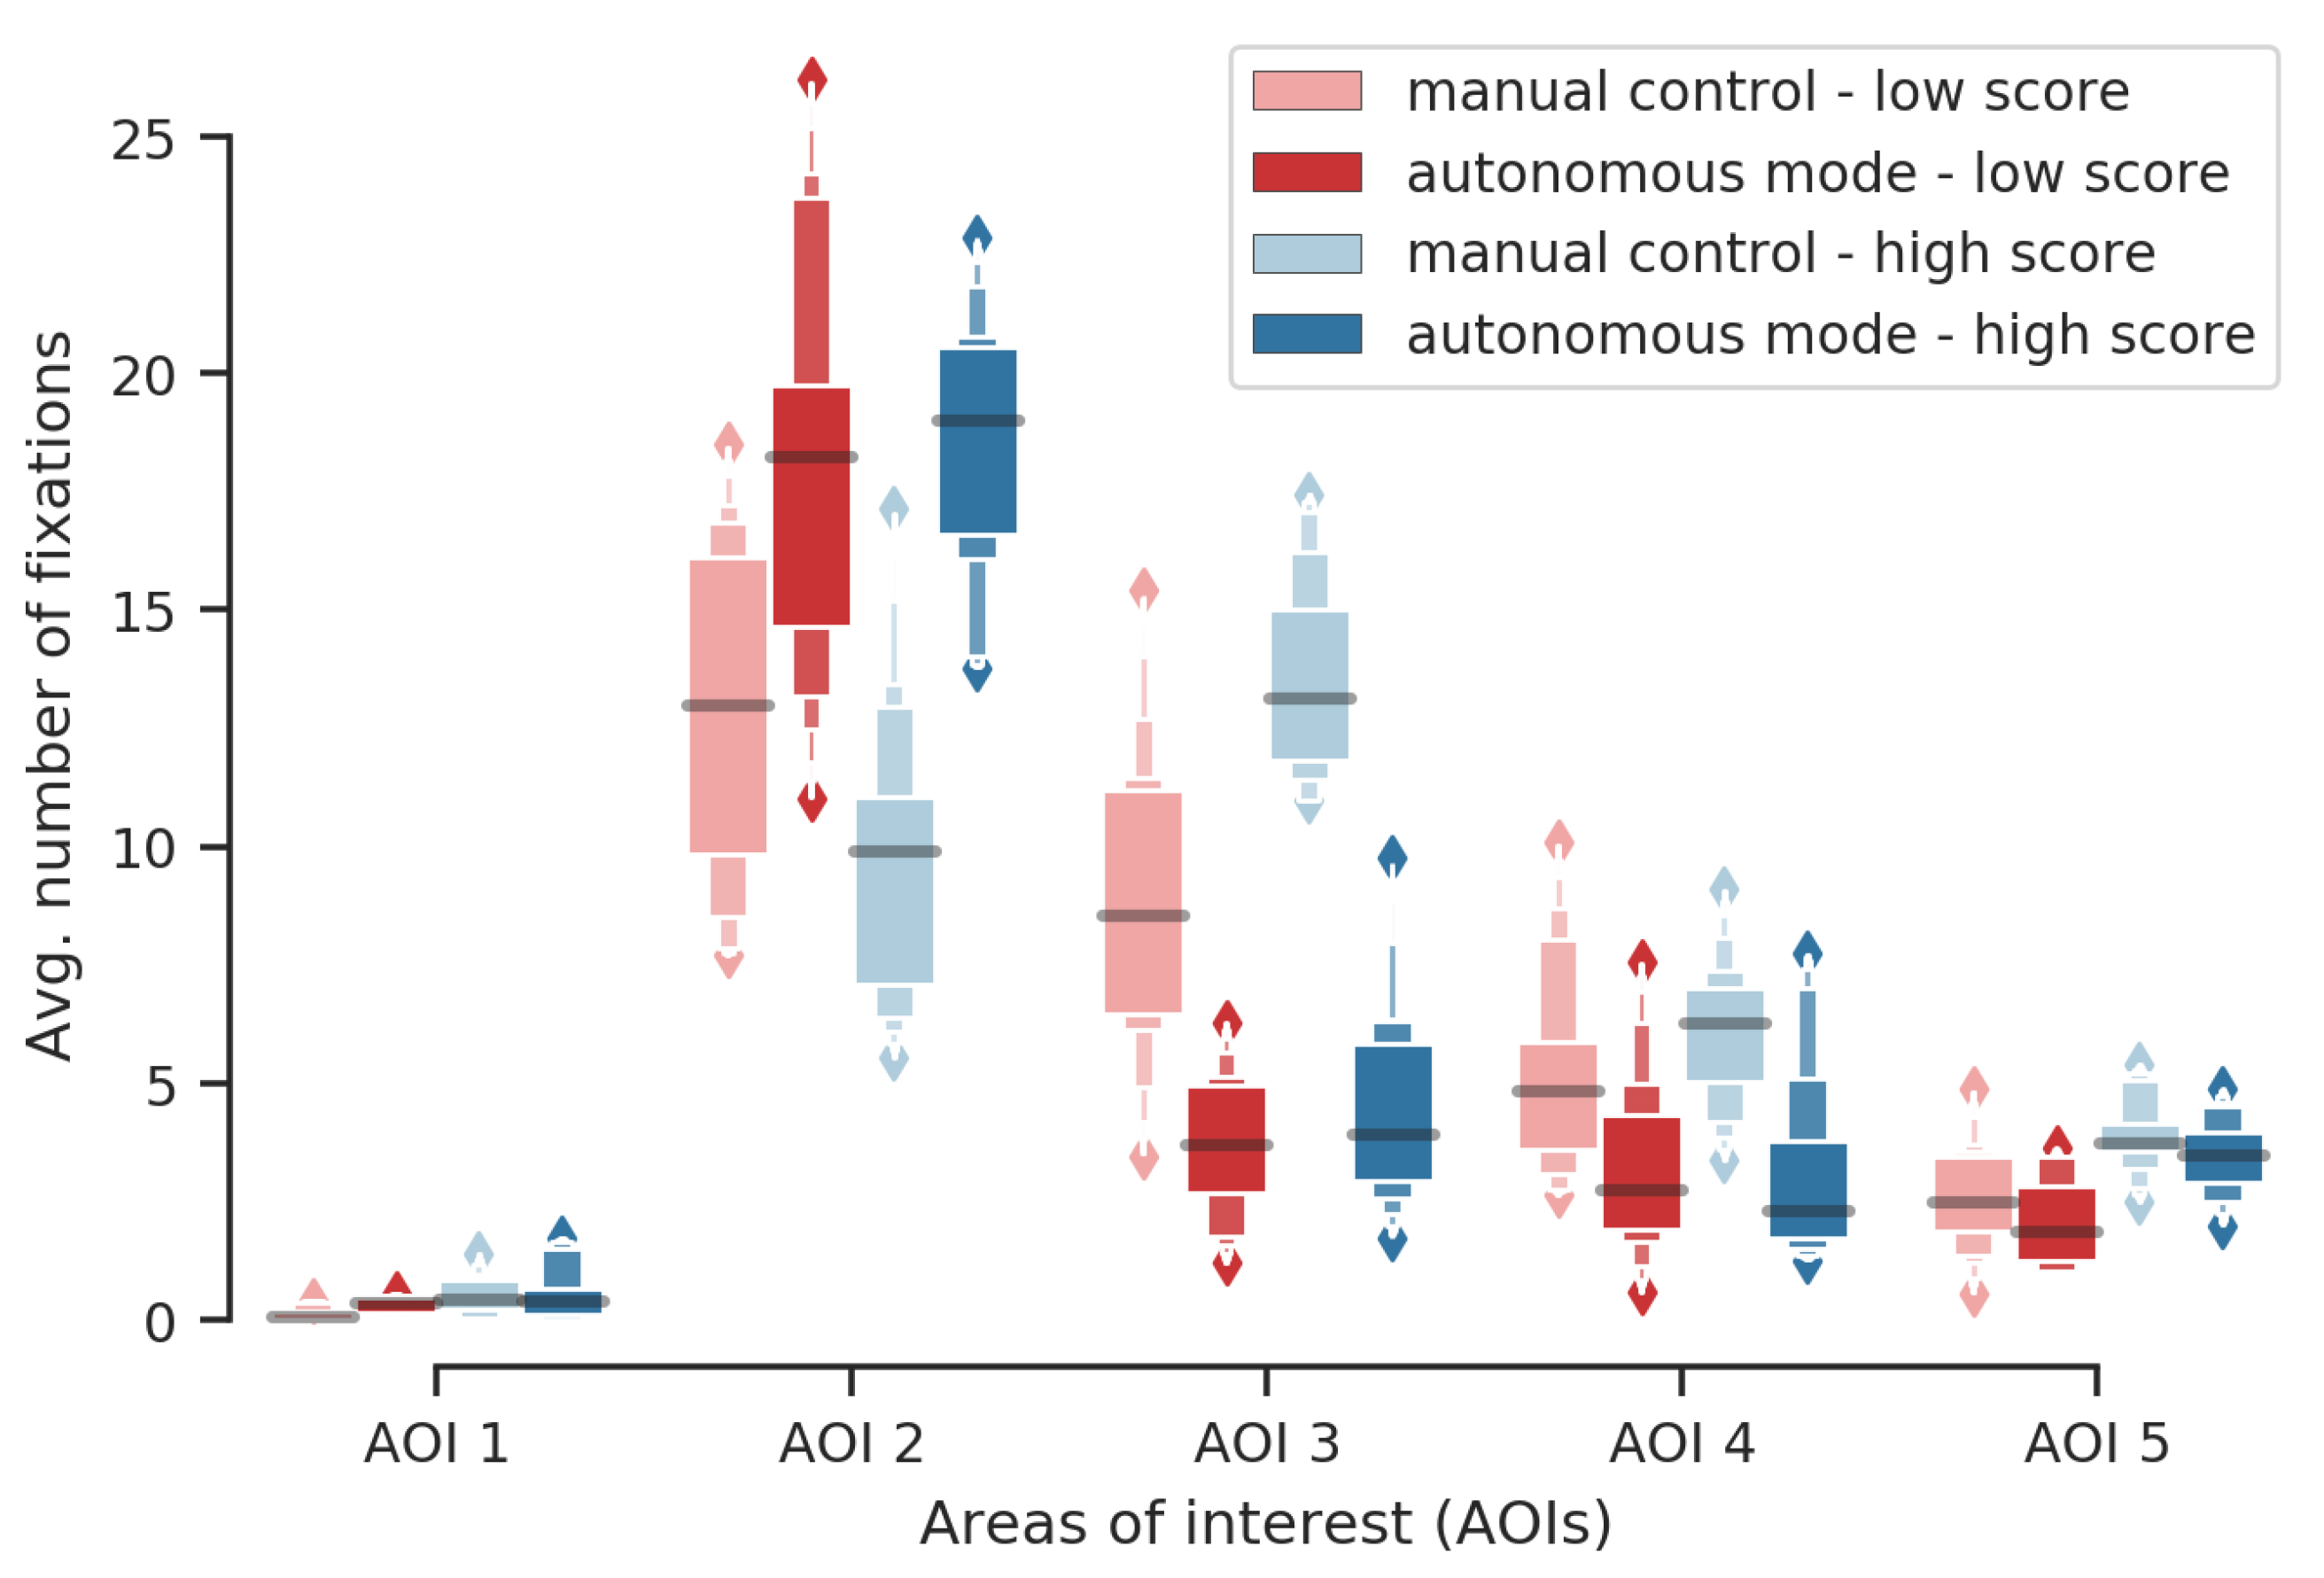
3.3. Eye-Tracking Markers
- participants have more fixated AOI 1 (chronometer and score) during high score missions in both modes (with for autonomous, and for manual) than during low score missions;
- participants have more fixated AOI 3 (robot video stream) during high score missions in both modes (autonomous , manual ) than during low score missions;
- participants have more fixated AOI 4 (robot status) during high score missions in both modes ( for both) than during low score missions.
- participants have more fixated AOI 2 in autonomous mode () during high score missions than during low score missions; and
- participants have more fixated AOI 2 in manual control during low score missions () than during high score missions. Note that it possibly demonstrates that these participants kept paying attention to the external tank sub-task instead of taking the robot’s manual control.
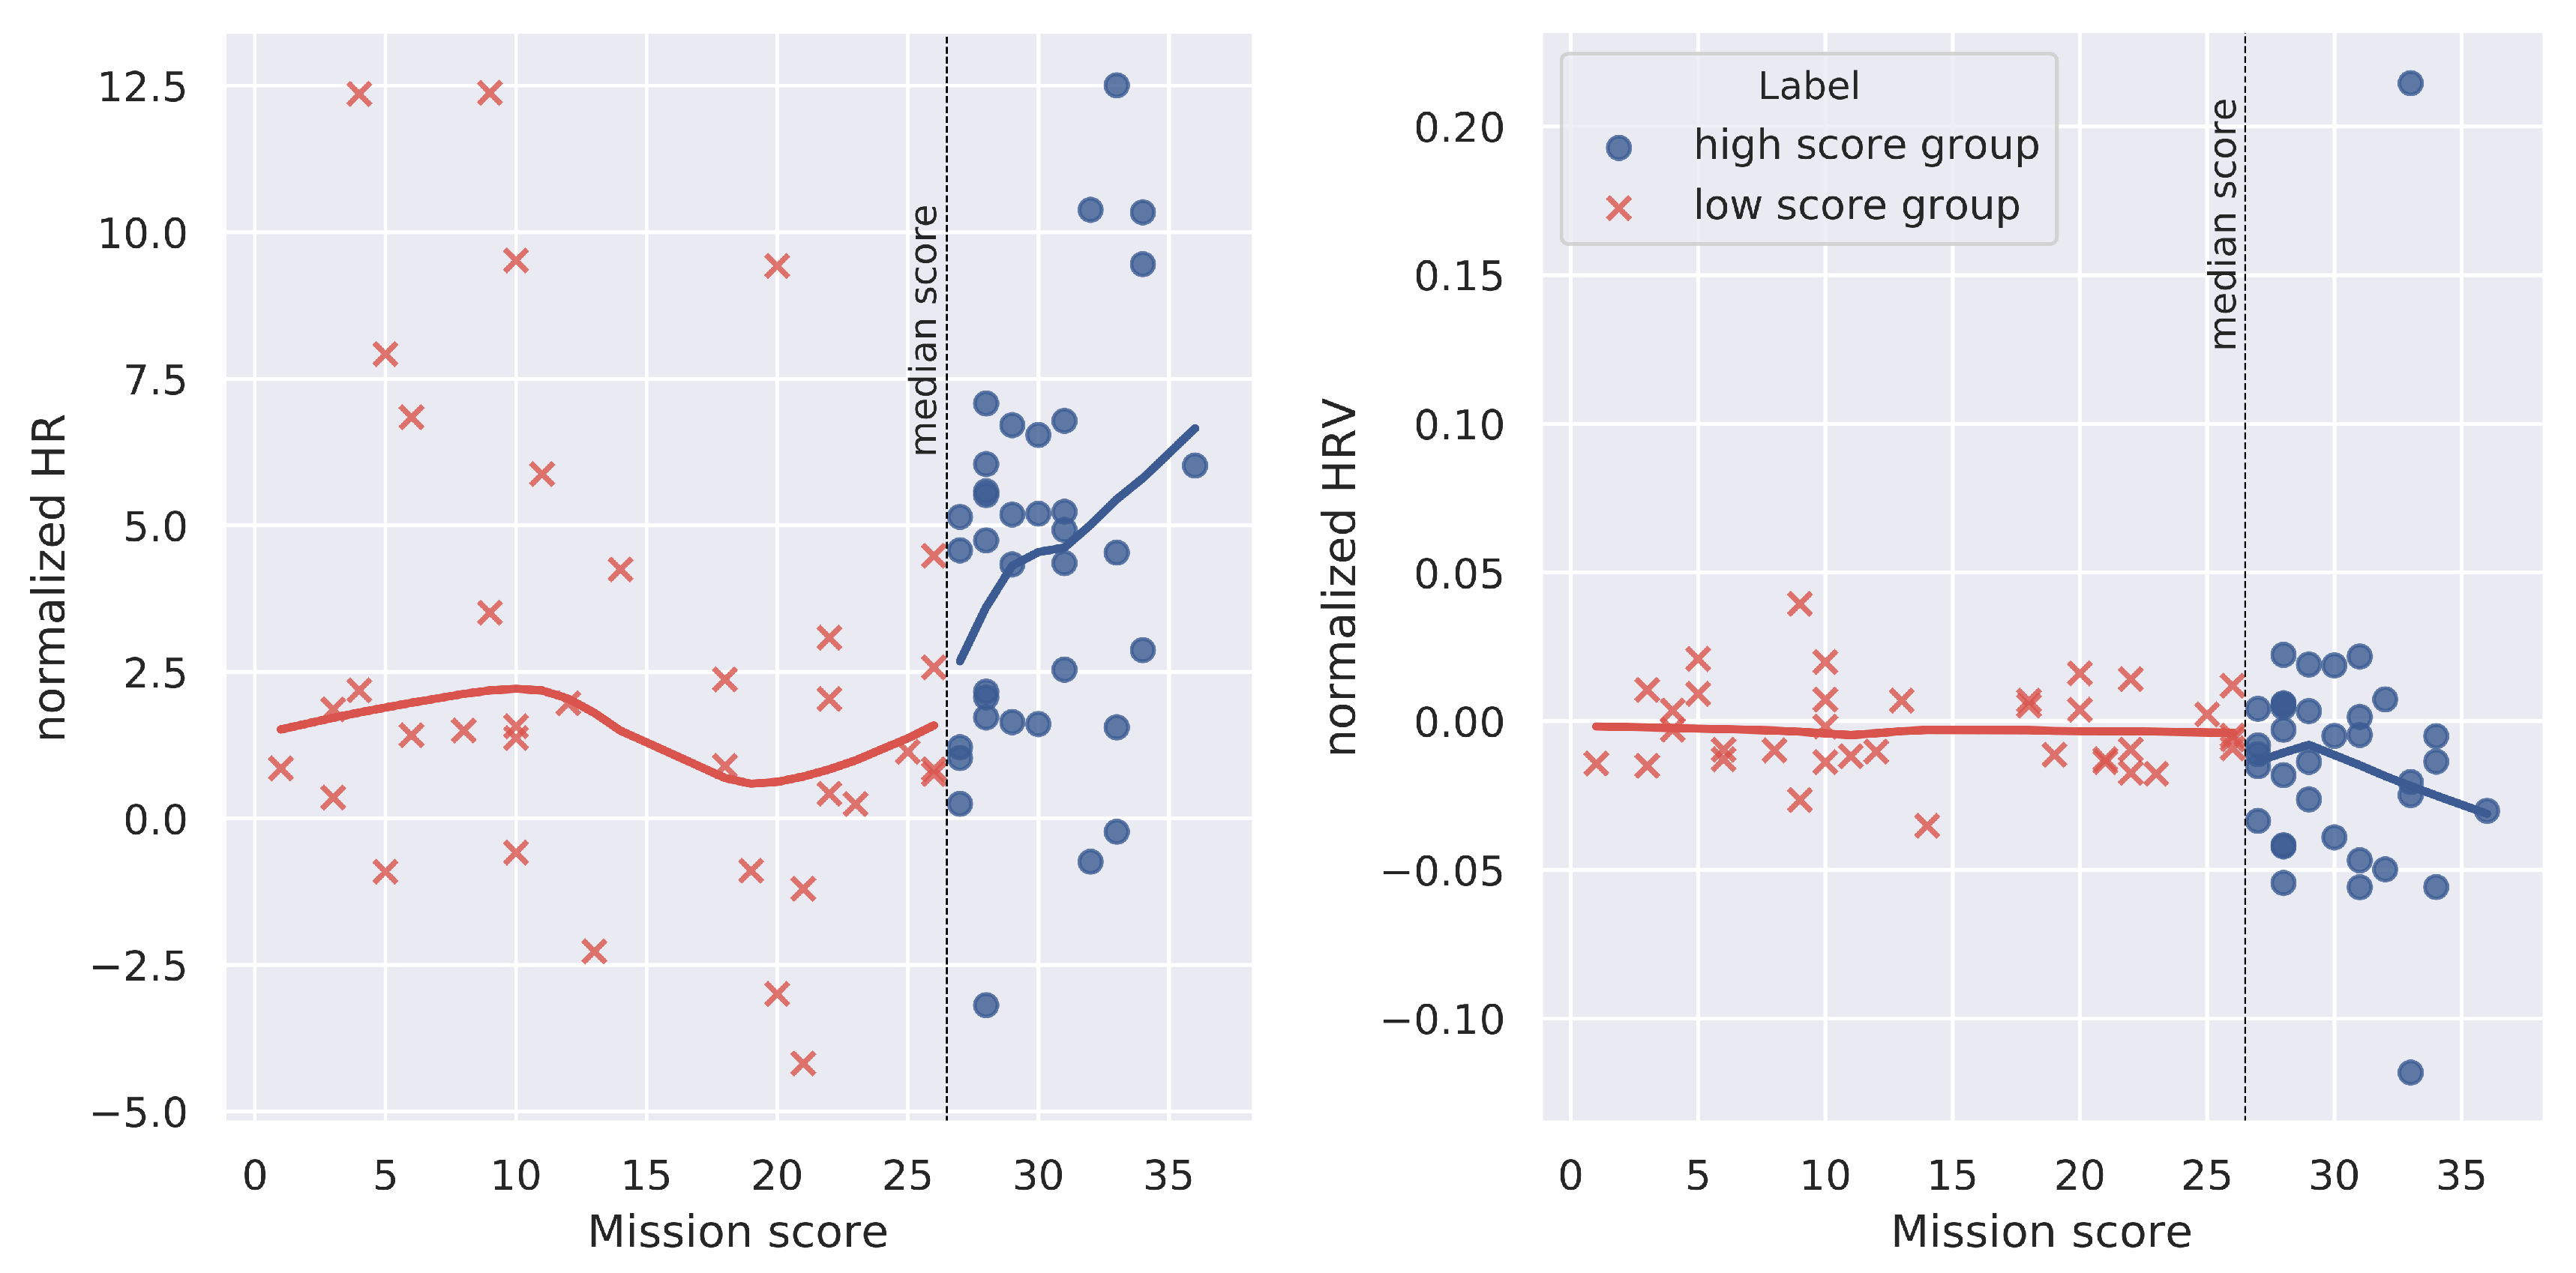
3.4. ECG Markers
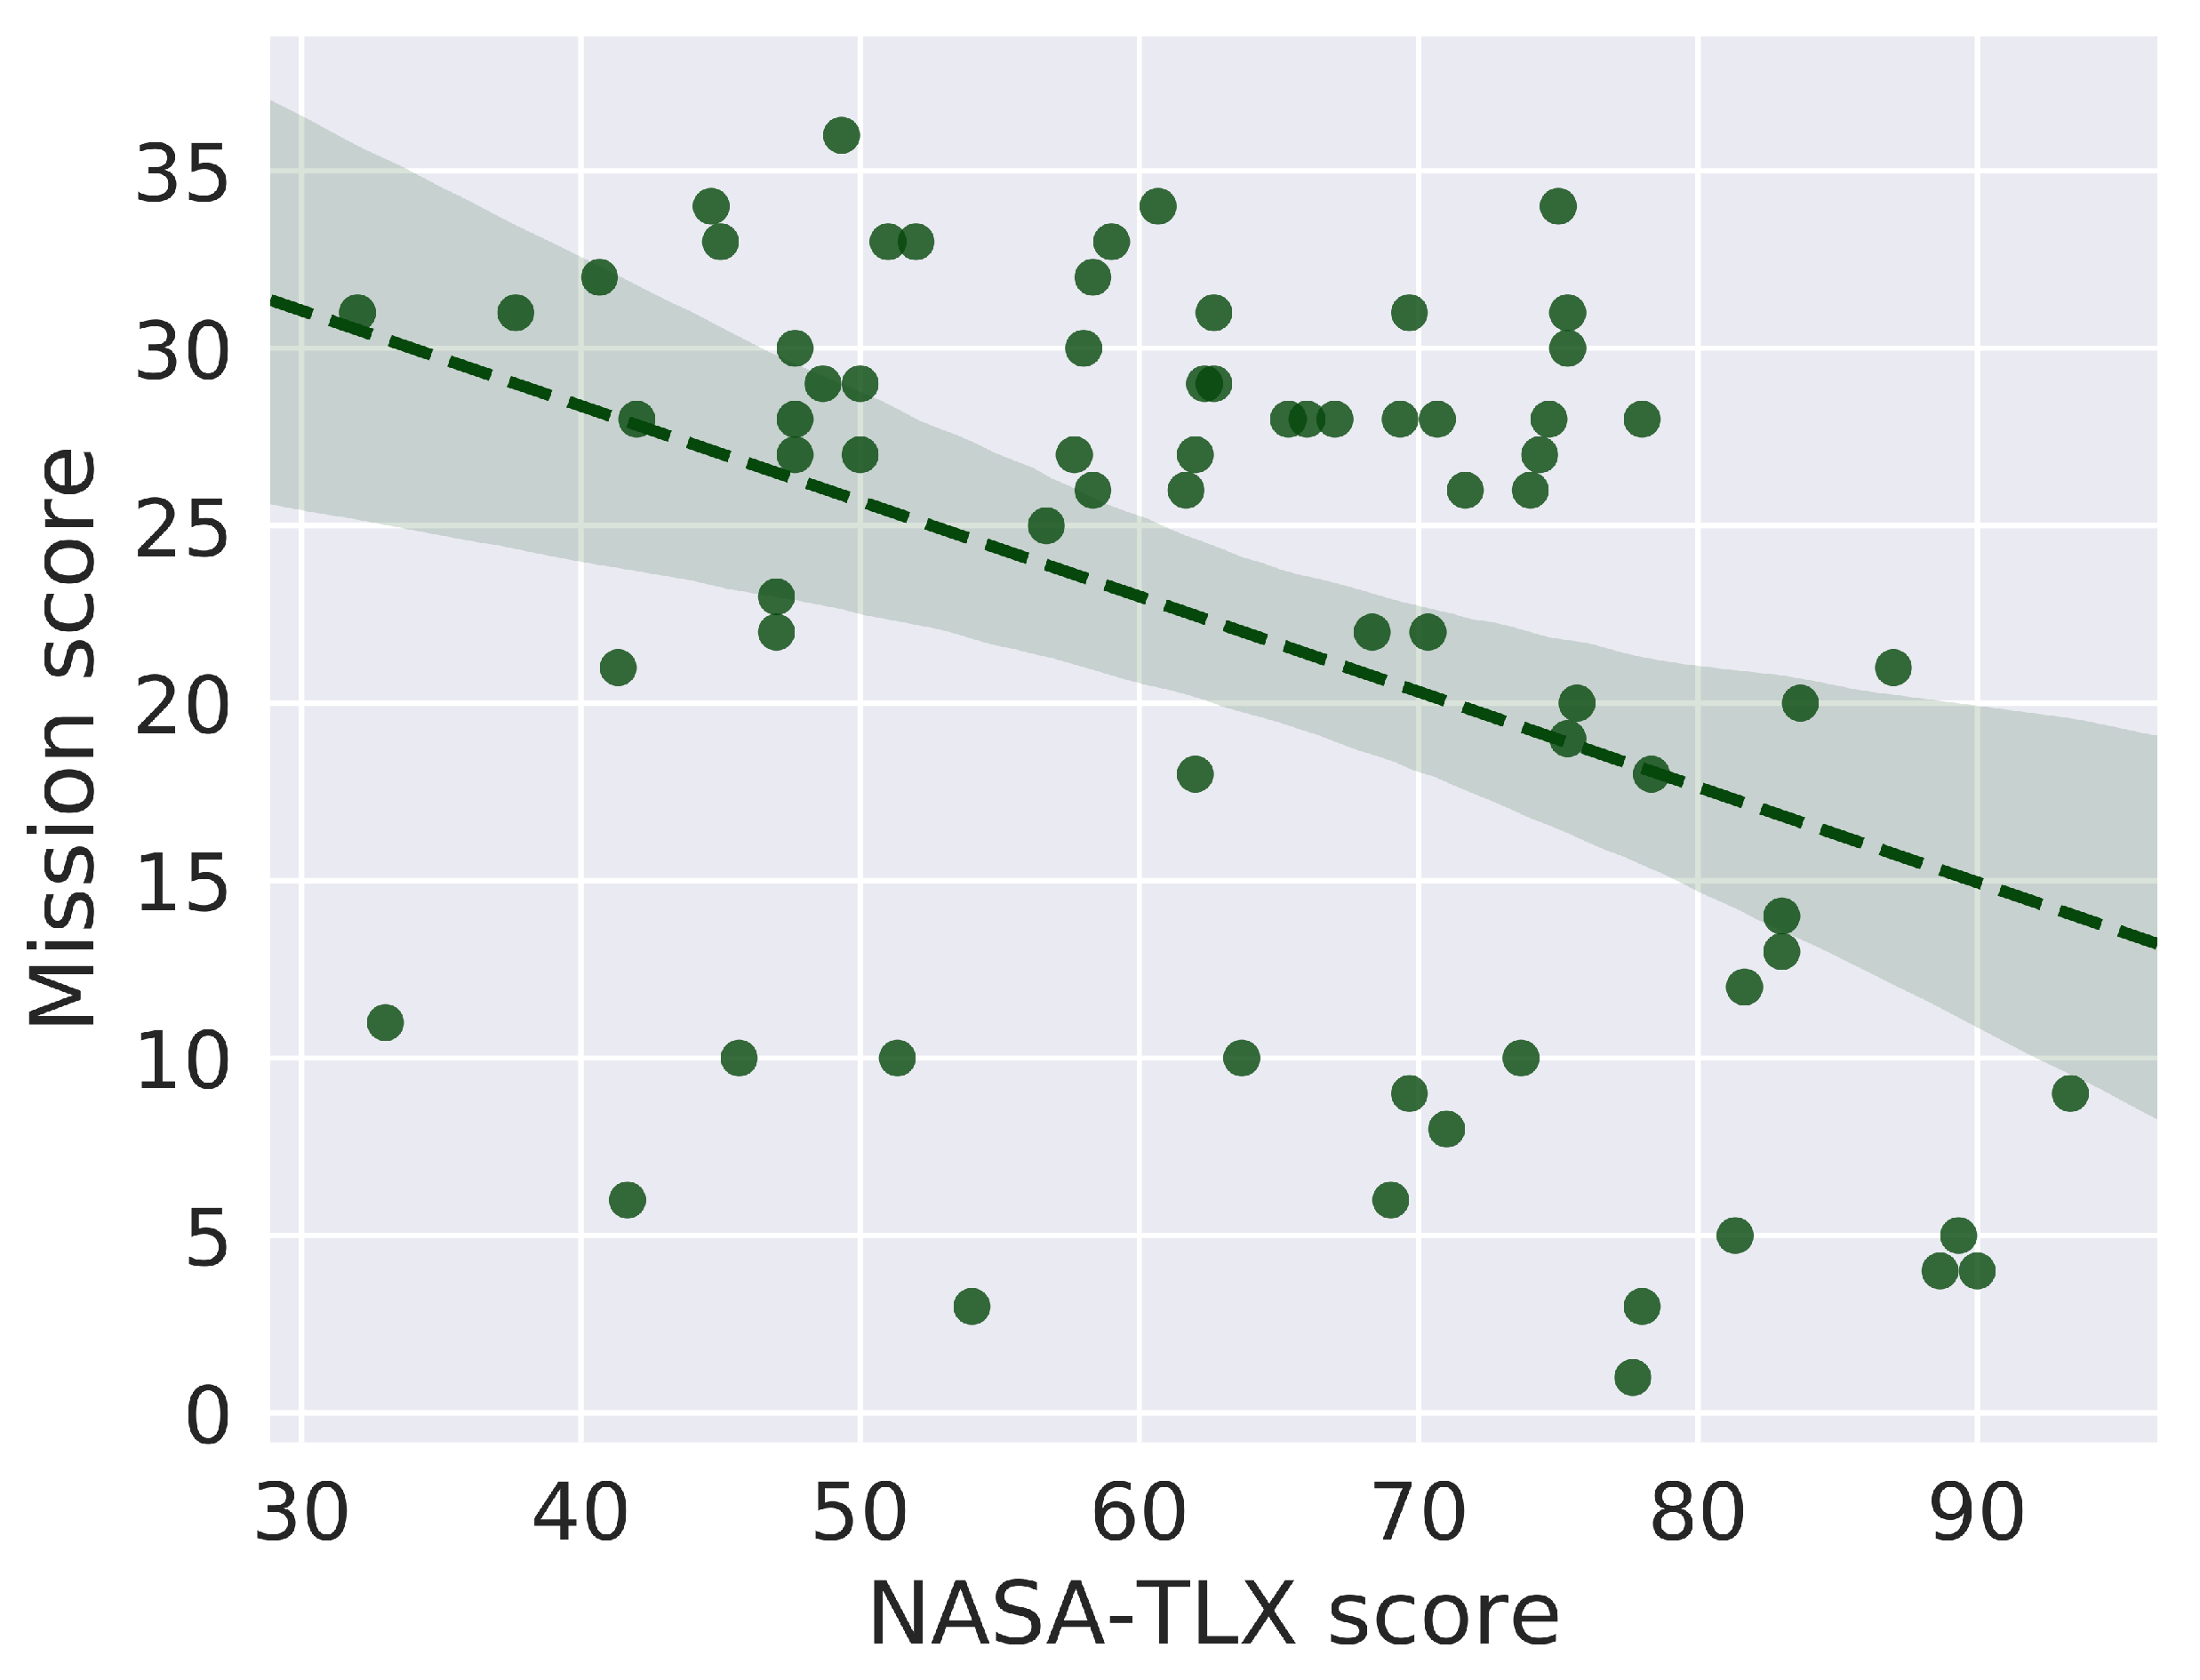
3.4.1. ECG Markers, Mission Performance and NASA-TLX Score
3.4.2. ECG Markers’ Analysis with Respect to Performance Group
3.4.3. ECG Markers’ Analysis Depending on the Performance Group and the Robot Automation Level
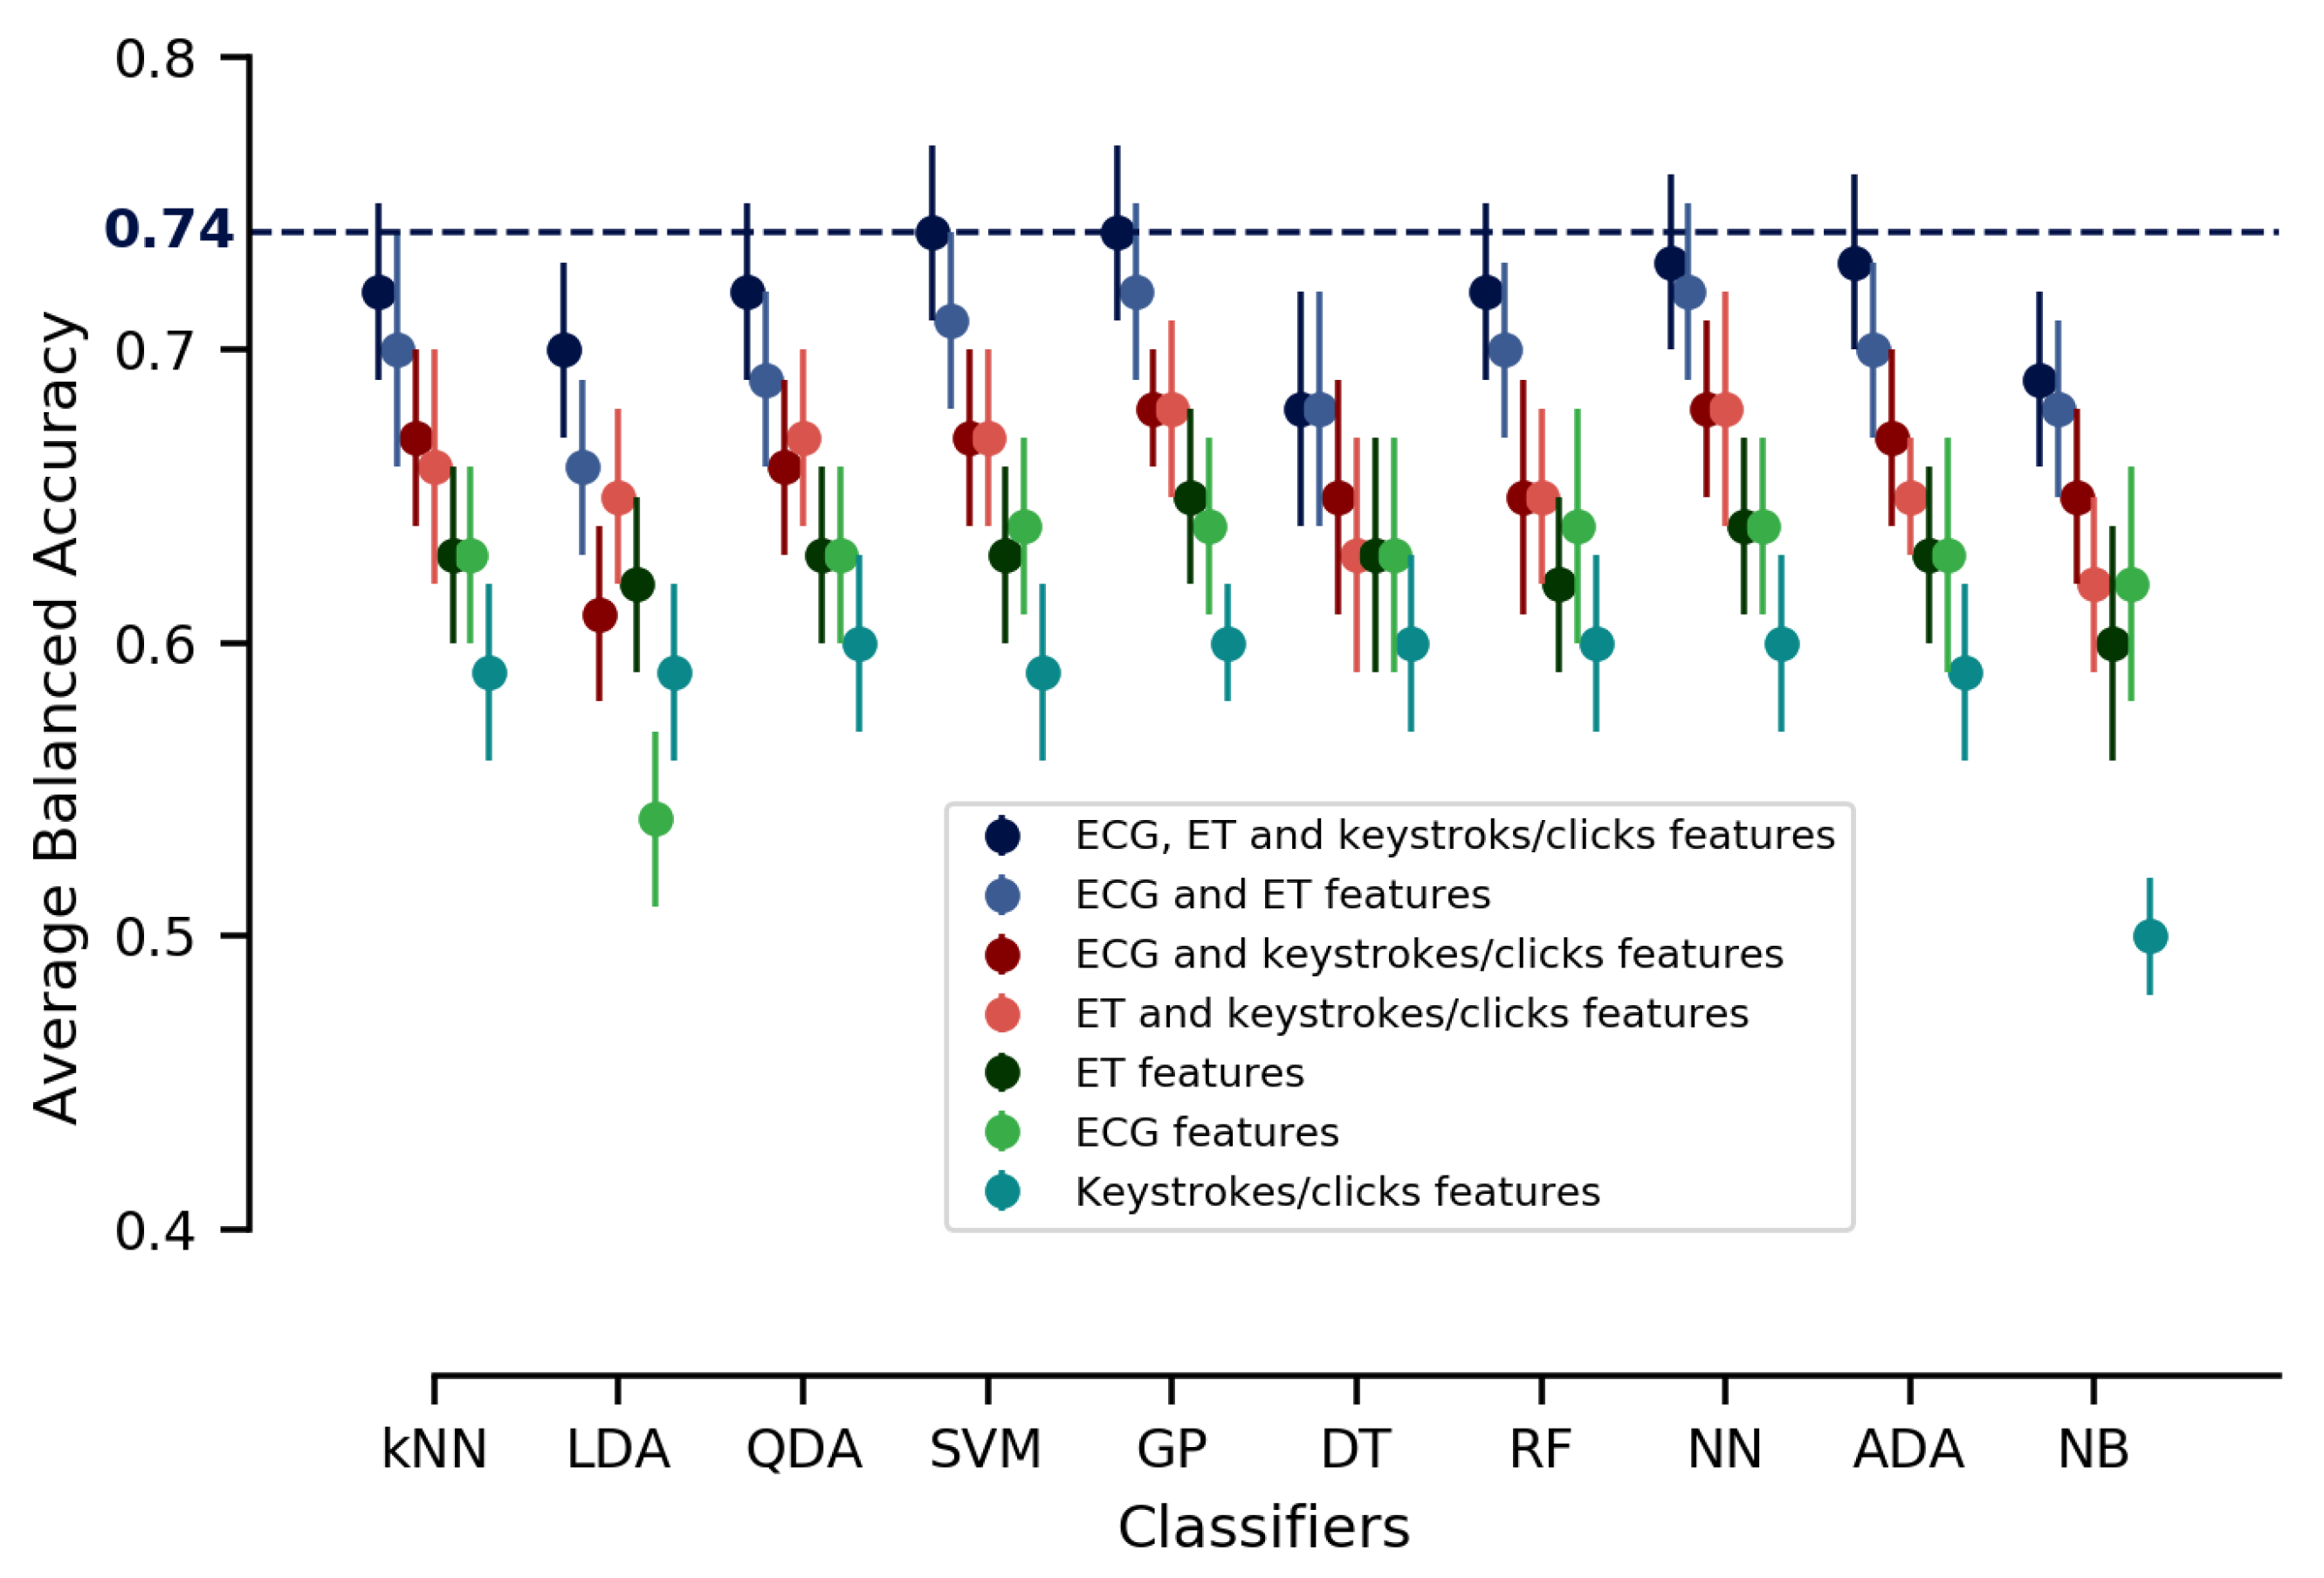
3.5. Classification
4. Discussion
4.1. Conclusion and Limitations
4.2. Practical Implications
4.3. Future Research
Author Contributions
Funding
Acknowledgments
Conflicts of Interest
References
- Finzi, A.; Orlandini, A. A Mixed-Initiative Approach to Human-Robot Interaction in Rescue Scenarios; American Association for Artificial Intelligence: Menlo Park, CA, USA, 2005. [Google Scholar]
- Nagatani, K.; Kiribayashi, S.; Okada, Y.; Otake, K.; Yoshida, K.; Tadokoro, S.; Nishimura, T.; Yoshida, T.; Koyanagi, E.; Fukushima, M.; et al. Emergency response to the nuclear accident at the Fukushima Daiichi Nuclear Power Plants using mobile rescue robots. J. Field Robot. 2013, 30, 44–63. [Google Scholar] [CrossRef]
- Bresina, J.L.; Morris, P.H. Mixed-initiative planning in space mission operations. AI Mag. 2007, 28, 75. [Google Scholar]
- Gateau, T.; Chanel, C.P.C.; Le, M.H.; Dehais, F. Considering human’s non-deterministic behavior and his availability state when designing a collaborative human-robots system. In Proceedings of the 2016 IEEE/RSJ International Conference on Intelligent Robots and Systems (IROS), Daejeon, Korea, 9–14 October 2016; pp. 4391–4397. [Google Scholar]
- Bevacqua, G.; Cacace, J.; Finzi, A.; Lippiello, V. Mixed-Initiative Planning and Execution for Multiple Drones in Search and Rescue Missions. In Proceedings of the Twenty-Fifth International Conference in Automated Planning and Scheduling (ICAPS), Jerusalem, Israel, 7–11 June 2015; pp. 315–323. [Google Scholar]
- Dehais, F.; Duprès, A.; Blum, S.; Drougard, N.; Scannella, S.; Roy, R.N.; Lotte, F. Monitoring Pilot’s Mental Workload Using ERPs and Spectral Power with a Six-Dry-Electrode EEG System in Real Flight Conditions. Sensors 2019, 19, 1324. [Google Scholar] [CrossRef]
- Dehais, F.; Dupres, A.; Di Flumeri, G.; Verdiere, K.; Borghini, G.; Babiloni, F.; Roy, R. Monitoring Pilot’s Cognitive Fatigue with Engagement Features in Simulated and Actual Flight Conditions Using an Hybrid fNIRS-EEG Passive BCI. In Proceedings of the 2018 IEEE International Conference on Systems, Man, and Cybernetics (SMC), Miyazaki, Japan, 7–10 October 2018; pp. 544–549. [Google Scholar]
- Roy, R.N.; Bonnet, S.; Charbonnier, S.; Campagne, A. Mental fatigue and working memory load estimation: interaction and implications for EEG-based passive BCI. In Proceedings of the 2013 35th Annual International Conference of the IEEE Engineering in Medicine and Biology Society (EMBC), Osaka, Japan, 3–7 July 2013; pp. 6607–6610. [Google Scholar]
- Dehais, F.; Rida, I.; Roy, R.N.; Iversen, J.; Mullen, T.; Callan, D. A pBCI to Predict Attentional Error Before it Happens in Real Flight Conditions. In Proceedings of the 2019 IEEE International Conference on Systems, Man and Cybernetics (SMC), Bari, Italy, 6–9 October 2019; pp. 4155–4160. [Google Scholar]
- Dehais, F.; Hodgetts, H.M.; Causse, M.; Behrend, J.; Durantin, G.; Tremblay, S. Momentary lapse of control: A cognitive continuum approach to understanding and mitigating perseveration in human error. Neurosci. Biobehav. Rev. 2019, 100, 252–262. [Google Scholar] [CrossRef]
- Crandall, J.W.; Goodrich, M.A.; Nielsen, C.W.; Olsen, D.R., Jr. Validating human–robot interaction schemes in multitasking environments. IEEE Trans. Syst. Man Cybern. Part A Syst. Hum. 2005, 35, 438–449. [Google Scholar] [CrossRef]
- de Souza, P.E.U.; Chanel, C.P.C.; Dehais, F. MOMDP-based target search mission taking into account the human operator’s cognitive state. In Proceedings of the IEEE 27th International Conference on Tools with Artificial Intelligence (ICTAI), Mare, Italy, 9–11 November 2015; pp. 729–736. [Google Scholar]
- Nikolaidis, S.; Ramakrishnan, R.; Gu, K.; Shah, J. Efficient Model Learning from Joint-Action Demonstrations for Human-Robot Collaborative Tasks. In Proceedings of the ACM/IEEE International Conference on Human-Robot Interaction, Portland, OR, USA, 2–5 March 2015; ACM: New York, NY, USA, 2015; pp. 189–196. [Google Scholar] [CrossRef]
- Jiang, S.; Arkin, R.C. Mixed-Initiative Human-Robot Interaction: Definition, Taxonomy, and Survey. In Proceedings of the 2015 IEEE International Conference on Systems, Man, and Cybernetics (SMC), Hong Kong, China, 9–12 October 2015; pp. 954–961. [Google Scholar]
- de Souza, P.E.U. Towards Mixed-Initiative Human-Robot Interaction: A Cooperative Human-Drone Team Framework. Ph.D. Thesis, Université de Toulouse, Délivré par l’Institut Supérieur de l’Aéronautique et de l’Espace (ISAE-SUPAERO), Toulouse, France, 2017. [Google Scholar]
- Vanderhaegen, F. Dissonance engineering: A new challenge to analyse risky knowledge when using a system. Int. J. Comput. Commun. Control 2014, 9, 776–785. [Google Scholar] [CrossRef]
- Scerbo, M.W. Adaptive Automation; Oxford University Press: Oxford, UK, 2008; pp. 239–252. [Google Scholar]
- de Visser, E.; Parasuraman, R. Adaptive aiding of human-robot teaming: Effects of imperfect automation on performance, trust, and workload. J. Cogn. Eng. Decis. Mak. 2011, 5, 209–231. [Google Scholar] [CrossRef]
- Mower, E.; Feil-Seifer, D.J.; Mataric, M.J.; Narayanan, S. Investigating implicit cues for user state estimation in human-robot interaction using physiological measurements. In Proceedings of the RO-MAN 2007—The 16th IEEE International Symposium on Robot and Human Interactive Communication, Jeju Island, Korea, 26–29 August 2007; pp. 1125–1130. [Google Scholar]
- Gateau, T.; Ayaz, H.; Dehais, F. In silico versus over the clouds: On-the-fly mental state estimation of aircraft pilots, using a functional near infrared spectroscopy based passive-BCI. Front. Hum. Neurosci. 2018, 12, 187. [Google Scholar] [CrossRef]
- Adams, J.A. Multiple robot/single human interaction: Effects on perceived workload. Behav. Inf. Technol. 2009, 28, 183–198. [Google Scholar] [CrossRef]
- Harriott, C.E.; Zhang, T.; Adams, J.A. Evaluating the applicability of current models of workload to peer-based human-robot teams. In Proceedings of the 2011 6th ACM/IEEE International Conference on Human-Robot Interaction (HRI), Ulm, Germany, 15–16 September 2011. [Google Scholar]
- Rodríguez-Fernández, V.; Menéndez, H.D.; Camacho, D. Analysing temporal performance profiles of UAV operators using time series clustering. Expert Syst. Appl. 2017, 70, 103–118. [Google Scholar] [CrossRef]
- Regis, N.; Dehais, F.; Rachelson, E.; Thooris, C.; Pizziol, S.; Mickaël Causse, C.T. Formal Detection of Attentional Tunneling in Human Operator-Automation Interactions. IEEE Trans. Hum. Mach. Syst. 2014, 44, 326–336. [Google Scholar]
- Rani, P.; Liu, C.; Sarkar, N.; Vanman, E. An empirical study of machine learning techniques for affect recognition in human–robot interaction. Pattern Anal. Appl. 2006, 9, 58–69. [Google Scholar] [CrossRef]
- Singh, G.; Bermùdez i Badia, S.; Ventura, R.; Silva, J.L. Physiologically Attentive User Interface for Robot Teleoperation—Real Time Emotional State Estimation and Interface Modification Using Physiology, Facial Expressions and Eye Movements. In Proceedings of the 11th International Joint Conference on Biomedical Engineering Systems and Technologies (BIOSTEC), Funchal, Madeira, Portugal, 19–21 January 2018. [Google Scholar]
- Heard, J.; Harriott, C.E.; Adams, J.A. A Survey of Workload Assessment Algorithms. IEEE Trans. Hum. Mach. Syst. 2018. [Google Scholar] [CrossRef]
- Ahlstrom, U.; Friedman-Berg, F.J. Using eye movement activity as a correlate of cognitive workload. Int. J. Ind. Ergon. 2006, 36, 623–636. [Google Scholar] [CrossRef]
- Chanel, C.P.C.; Wilson, M.D.; Scannella, S. Online ECG-based Features for Cognitive Load Assessment. In Proceedings of the IEEE International Conference on Systems, Man and Cybernetics, Bari, Italy, 6–9 October 2019. [Google Scholar]
- Fallahi, M.; Motamedzade, M.; Heidarimoghadam, R.; Soltanian, A.R.; Miyake, S. Effects of mental workload on physiological and subjective responses during traffic density monitoring: A field study. Appl. Ergon. 2016, 52, 95–103. [Google Scholar] [CrossRef]
- Tjolleng, A.; Jung, K.; Hong, W.; Lee, W.; Lee, B.; You, H.; Son, J.; Park, S. Classification of a Driver’s cognitive workload levels using artificial neural network on ECG signals. Appl. Ergon. 2017, 59, 326–332. [Google Scholar] [CrossRef]
- Valéry, B.; Matton, N.; Scannella, S.; Dehais, F. Global difficulty modulates the prioritization strategy in multitasking situations. Appl. Ergon. 2019, 80, 1–8. [Google Scholar] [CrossRef]
- Drougard, N.; Chanel, C.P.C.; Roy, R.N.; Dehais, F. Mixed-initiative mission planning considering human operator state estimation based on physiological sensors. In Proceedings of the IROS-2017 Workshop on Human-Robot Interaction in Collaborative Manufacturing Environments (HRI-CME), Vancouver, BC, Canada, 24 September 2017. [Google Scholar]
- Charles, J.A.; Chanel, C.P.C.; Chauffaut, C.; Chauvin, P.; Drougard, N. Human-Agent Interaction Model Learning based on Crowdsourcing. In Proceedings of the 6th International Conference on Human-Agent Interaction, Southampton, UK, 15–18 December 2018; pp. 20–28. [Google Scholar]
- Åkerstedt, T.; Gillberg, M. Subjective and objective sleepiness in the active individual. Int. J. Neurosci. 1990, 52, 29–37. [Google Scholar] [CrossRef]
- Hart, S.G.; Staveland, L.E. Development of NASA-TLX (Task Load Index): Results of empirical and theoretical research. In Advances in Psychology; Elsevier: Amsterdam, The Netherlands, 1988; Volume 52, pp. 139–183. [Google Scholar]
- Malik, M.; Bigger, J.T.; Camm, A.J.; Kleiger, R.E.; Malliani, A.; Moss, A.J.; Schwartz, P.J. Heart rate variability: Standards of measurement, physiological interpretation, and clinical use. Eur. Heart J. 1996, 17, 354–381. [Google Scholar] [CrossRef]
- Sörnmo, L.; Laguna, P. Bioelectrical Signal Processing in Cardiac and Neurological Applications; Elsevier Academic Press: Amsterdam, The Netherlands, 2005. [Google Scholar]
- Harrar, S.W.; Bathke, A.C. Nonparametric methods for unbalanced multivariate data and many factor levels. J. Multivar. Anal. 2008, 99, 1635–1664. [Google Scholar] [CrossRef]
- Wickens, C.D.; Dehais, F. Expertise in Aviation; Oxford University Press: Oxford, UK, 2019. [Google Scholar]
- Ko, S.M.; Ji, Y.G. How we can measure the non-driving-task engagement in automated driving: comparing flow experience and workload. Appl. Ergon. 2018, 67, 237–245. [Google Scholar] [CrossRef] [PubMed]
- Durantin, G.; Gagnon, J.F.; Tremblay, S.; Dehais, F. Using near infrared spectroscopy and heart rate variability to detect mental overload. Behav. Brain Res. 2014, 259, 16–23. [Google Scholar] [CrossRef] [PubMed]
- Sarter, N.B.; Woods, D.D. How in the world did we ever get into that mode? Mode error and awareness in supervisory control. Hum. Factors 1995, 37, 5–19. [Google Scholar] [CrossRef]
- Landi, C.T.; Villani, V.; Ferraguti, F.; Sabattini, L.; Secchi, C.; Fantuzzi, C. Relieving operators’ workload: Towards affective robotics in industrial scenarios. Mechatronics 2018, 54, 144–154. [Google Scholar] [CrossRef]
- Huang, H.M.; Messina, E.; Albus, J. Toward a Generic Model for Autonomy Levels for Unmanned Systems (ALFUS); Technical Report; National Inst of Standards and Technology: Gaithersburg, MD, USA, 2003.
- Tang, F.; Ito, E. Human-assisted navigation through sliding autonomy. In Proceedings of the 2017 2nd International Conference on Robotics and Automation Engineering (ICRAE), Shanghai, China, 29–31 December 2017; pp. 26–30. [Google Scholar]
- Tang, F.; Mohammed, M.; Longazo, J. Experiments of human-robot teaming under sliding autonomy. In Proceedings of the 2016 IEEE International Conference on Advanced Intelligent Mechatronics (AIM), Banff, AB, Canada, 12–15 July 2016; pp. 113–118. [Google Scholar]
- Wright, J.; Chen, J.; Barnes, M. Human-automation interaction for multiple robot control: The effect of varying automation assistance and individual differences on operator performance. Ergonomics 2018, 61, 1033–1045. [Google Scholar] [CrossRef]
- Parasuraman, R.; Wickens, C.D. Humans: Still Vital After All These Years of Automation. Hum. Factors 2008, 50, 511–520. [Google Scholar] [CrossRef]
- Dehais, F.; Causse, M.; Vachon, F.; Tremblay, S. Cognitive conflict in human–automation interactions: A psychophysiological study. Appl. Ergon. 2012, 43, 588–595. [Google Scholar] [CrossRef]
- Dehais, F.; Peysakhovich, V.; Scannella, S.; Fongue, J.; Gateau, T. Automation surprise in aviation: Real-time solutions. In Proceedings of the 33rd Annual ACM Conference on Human Factors in Computing Systems, Seoul, Korea, 18–23 April 2015; pp. 2525–2534. [Google Scholar]
- Lyons, J.B. Being transparent about transparency: A model for human-robot interaction. In Proceedings of the 2013 AAAI Spring Symposium Series, Palo Alto, CA, USA, 25–27 March 2013. [Google Scholar]


| Different Combinations of Input Features | |||||||
|---|---|---|---|---|---|---|---|
| Classifiers | ECG, ET and Keys/Clicks | ECG and ET | ECG and Keys/Clicks | ET and Keys/Clicks | ET | ECG | Keys/Clicks |
| kNN | |||||||
| LDA | |||||||
| QDA | |||||||
| SVM | |||||||
| GP | |||||||
| DT | |||||||
| RF | |||||||
| NN | |||||||
| ADA | |||||||
| NB | |||||||
© 2020 by the authors. Licensee MDPI, Basel, Switzerland. This article is an open access article distributed under the terms and conditions of the Creative Commons Attribution (CC BY) license (http://creativecommons.org/licenses/by/4.0/).
Share and Cite
Chanel, C.P.C.; Roy, R.N.; Dehais, F.; Drougard, N. Towards Mixed-Initiative Human–Robot Interaction: Assessment of Discriminative Physiological and Behavioral Features for Performance Prediction. Sensors 2020, 20, 296. https://doi.org/10.3390/s20010296
Chanel CPC, Roy RN, Dehais F, Drougard N. Towards Mixed-Initiative Human–Robot Interaction: Assessment of Discriminative Physiological and Behavioral Features for Performance Prediction. Sensors. 2020; 20(1):296. https://doi.org/10.3390/s20010296
Chicago/Turabian StyleChanel, Caroline P. C., Raphaëlle N. Roy, Frédéric Dehais, and Nicolas Drougard. 2020. "Towards Mixed-Initiative Human–Robot Interaction: Assessment of Discriminative Physiological and Behavioral Features for Performance Prediction" Sensors 20, no. 1: 296. https://doi.org/10.3390/s20010296
APA StyleChanel, C. P. C., Roy, R. N., Dehais, F., & Drougard, N. (2020). Towards Mixed-Initiative Human–Robot Interaction: Assessment of Discriminative Physiological and Behavioral Features for Performance Prediction. Sensors, 20(1), 296. https://doi.org/10.3390/s20010296