Adaptive Binarization of QR Code Images for Fast Automatic Sorting in Warehouse Systems

Abstract
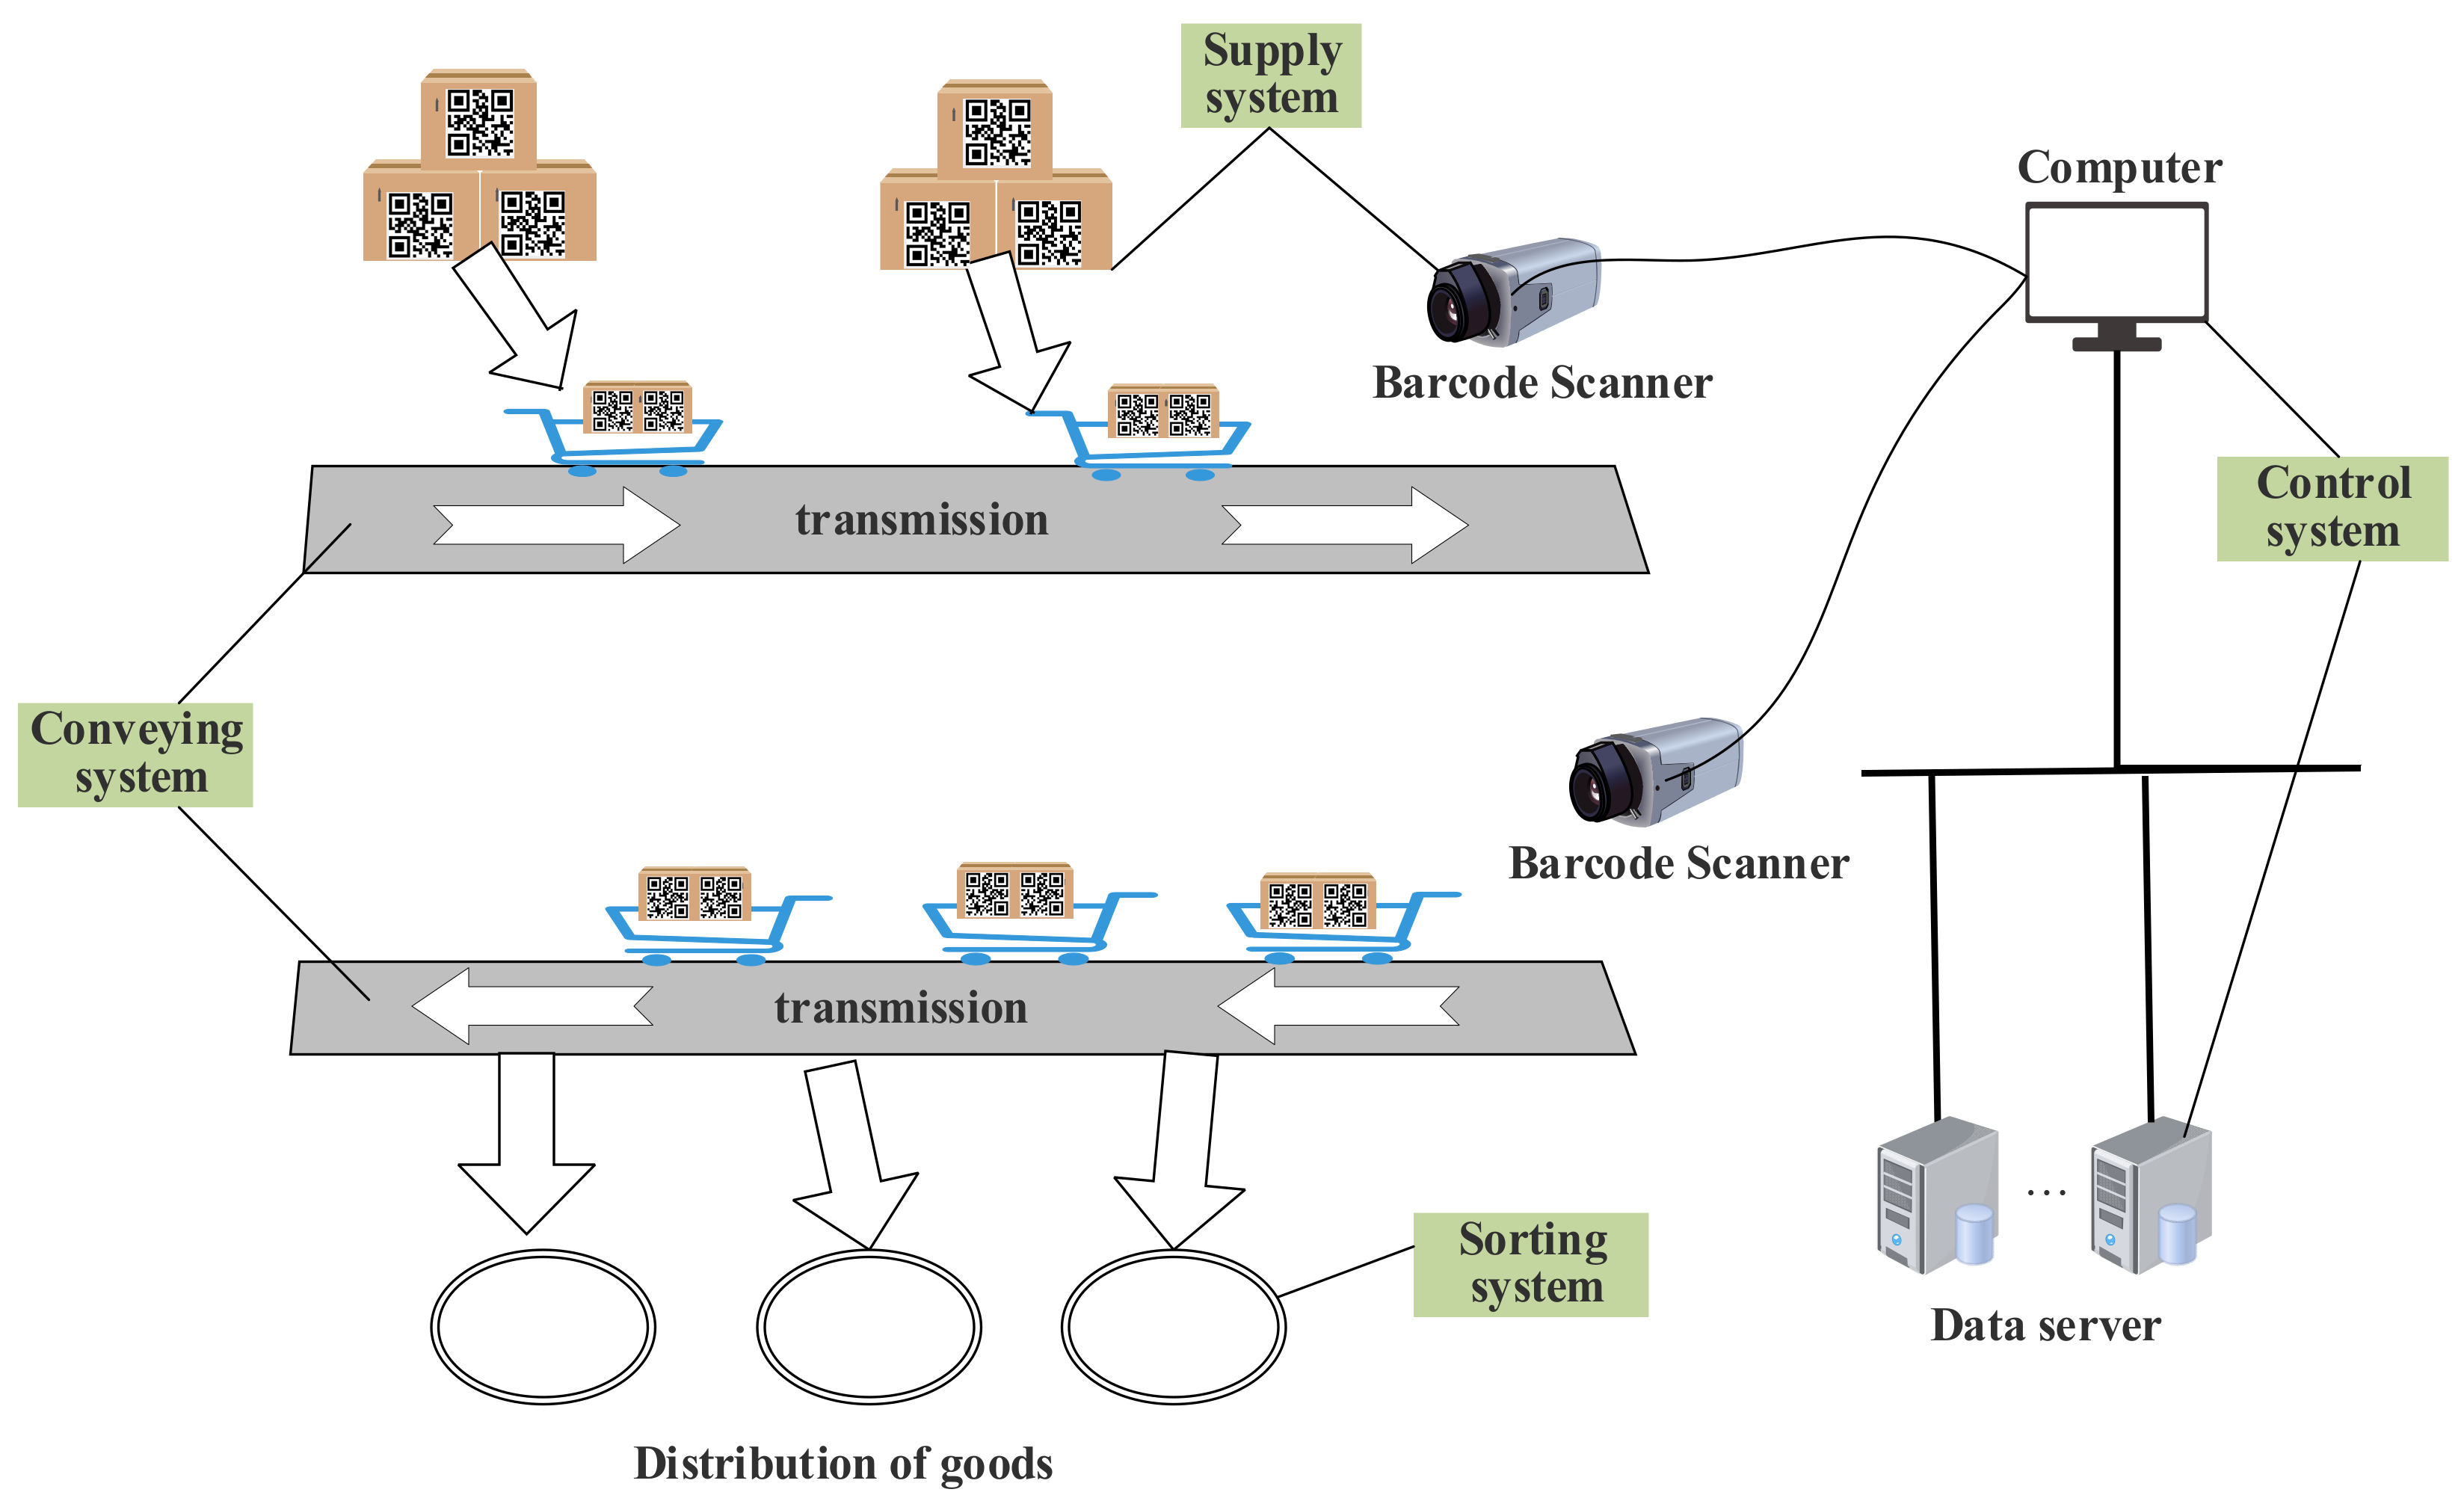
1. Introduction
2. Related Work
3. Proposed Method
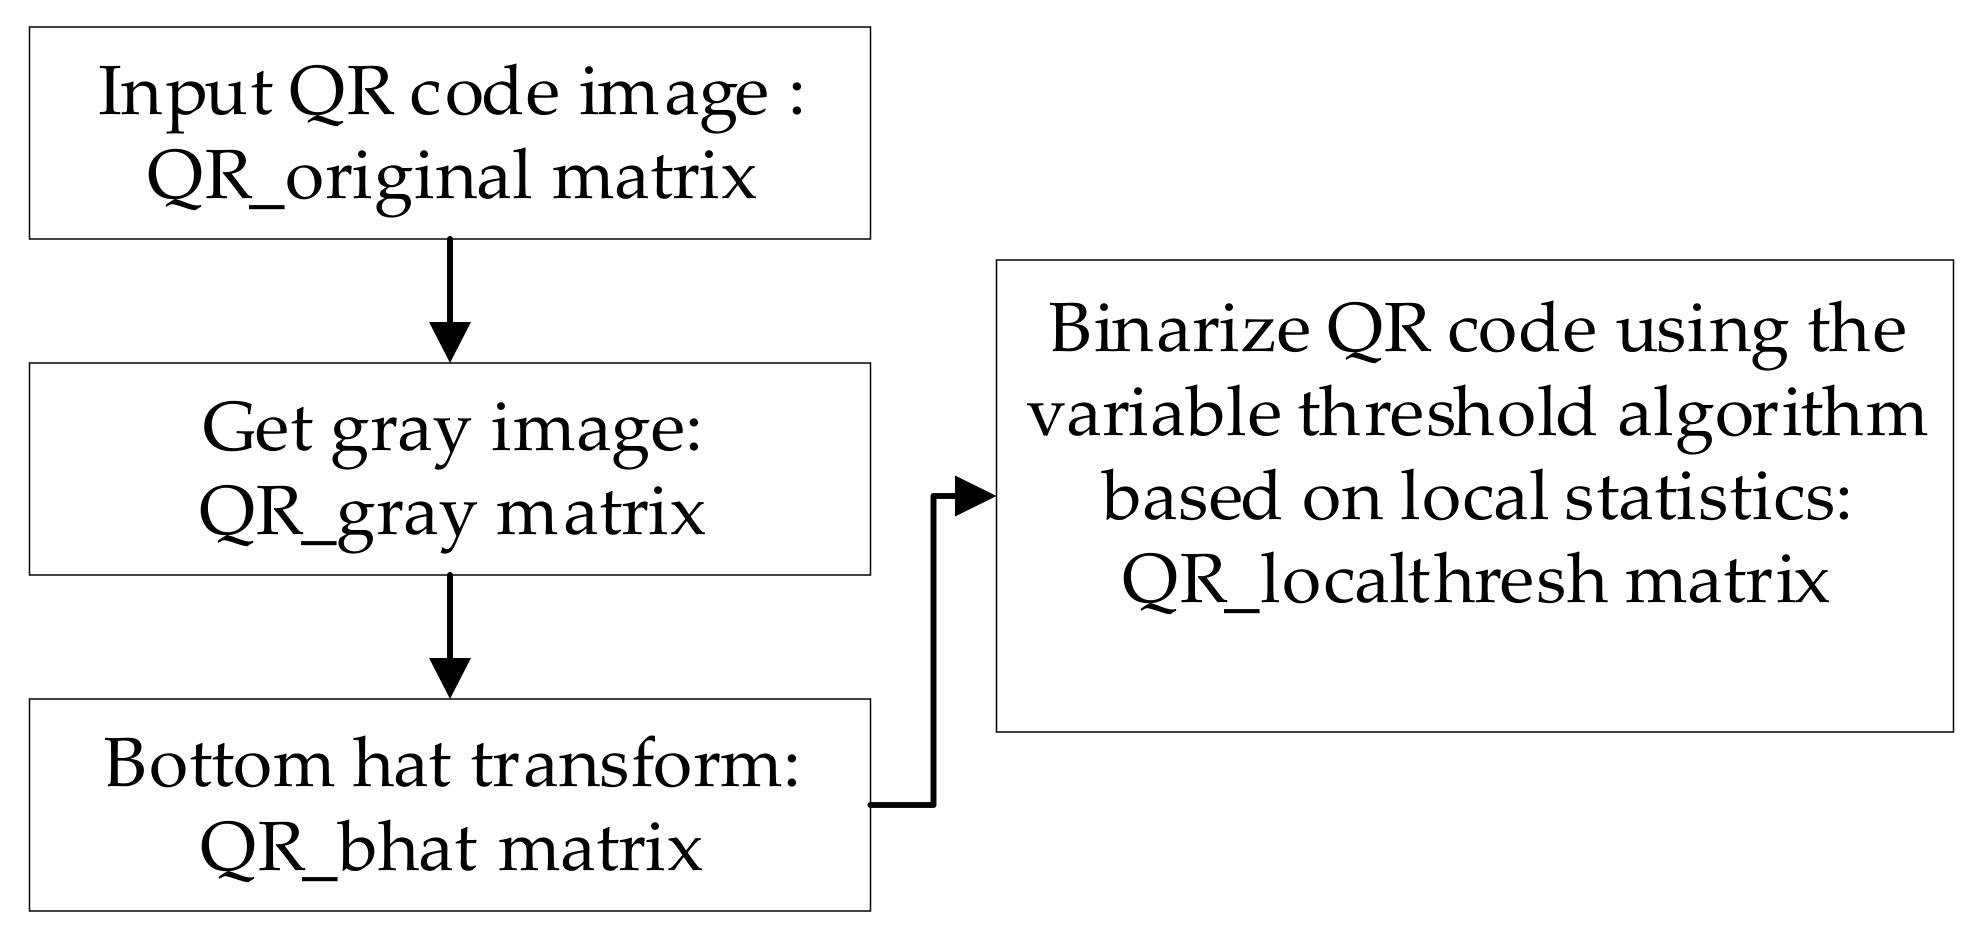
3.1. Preprocessing of QR Codes
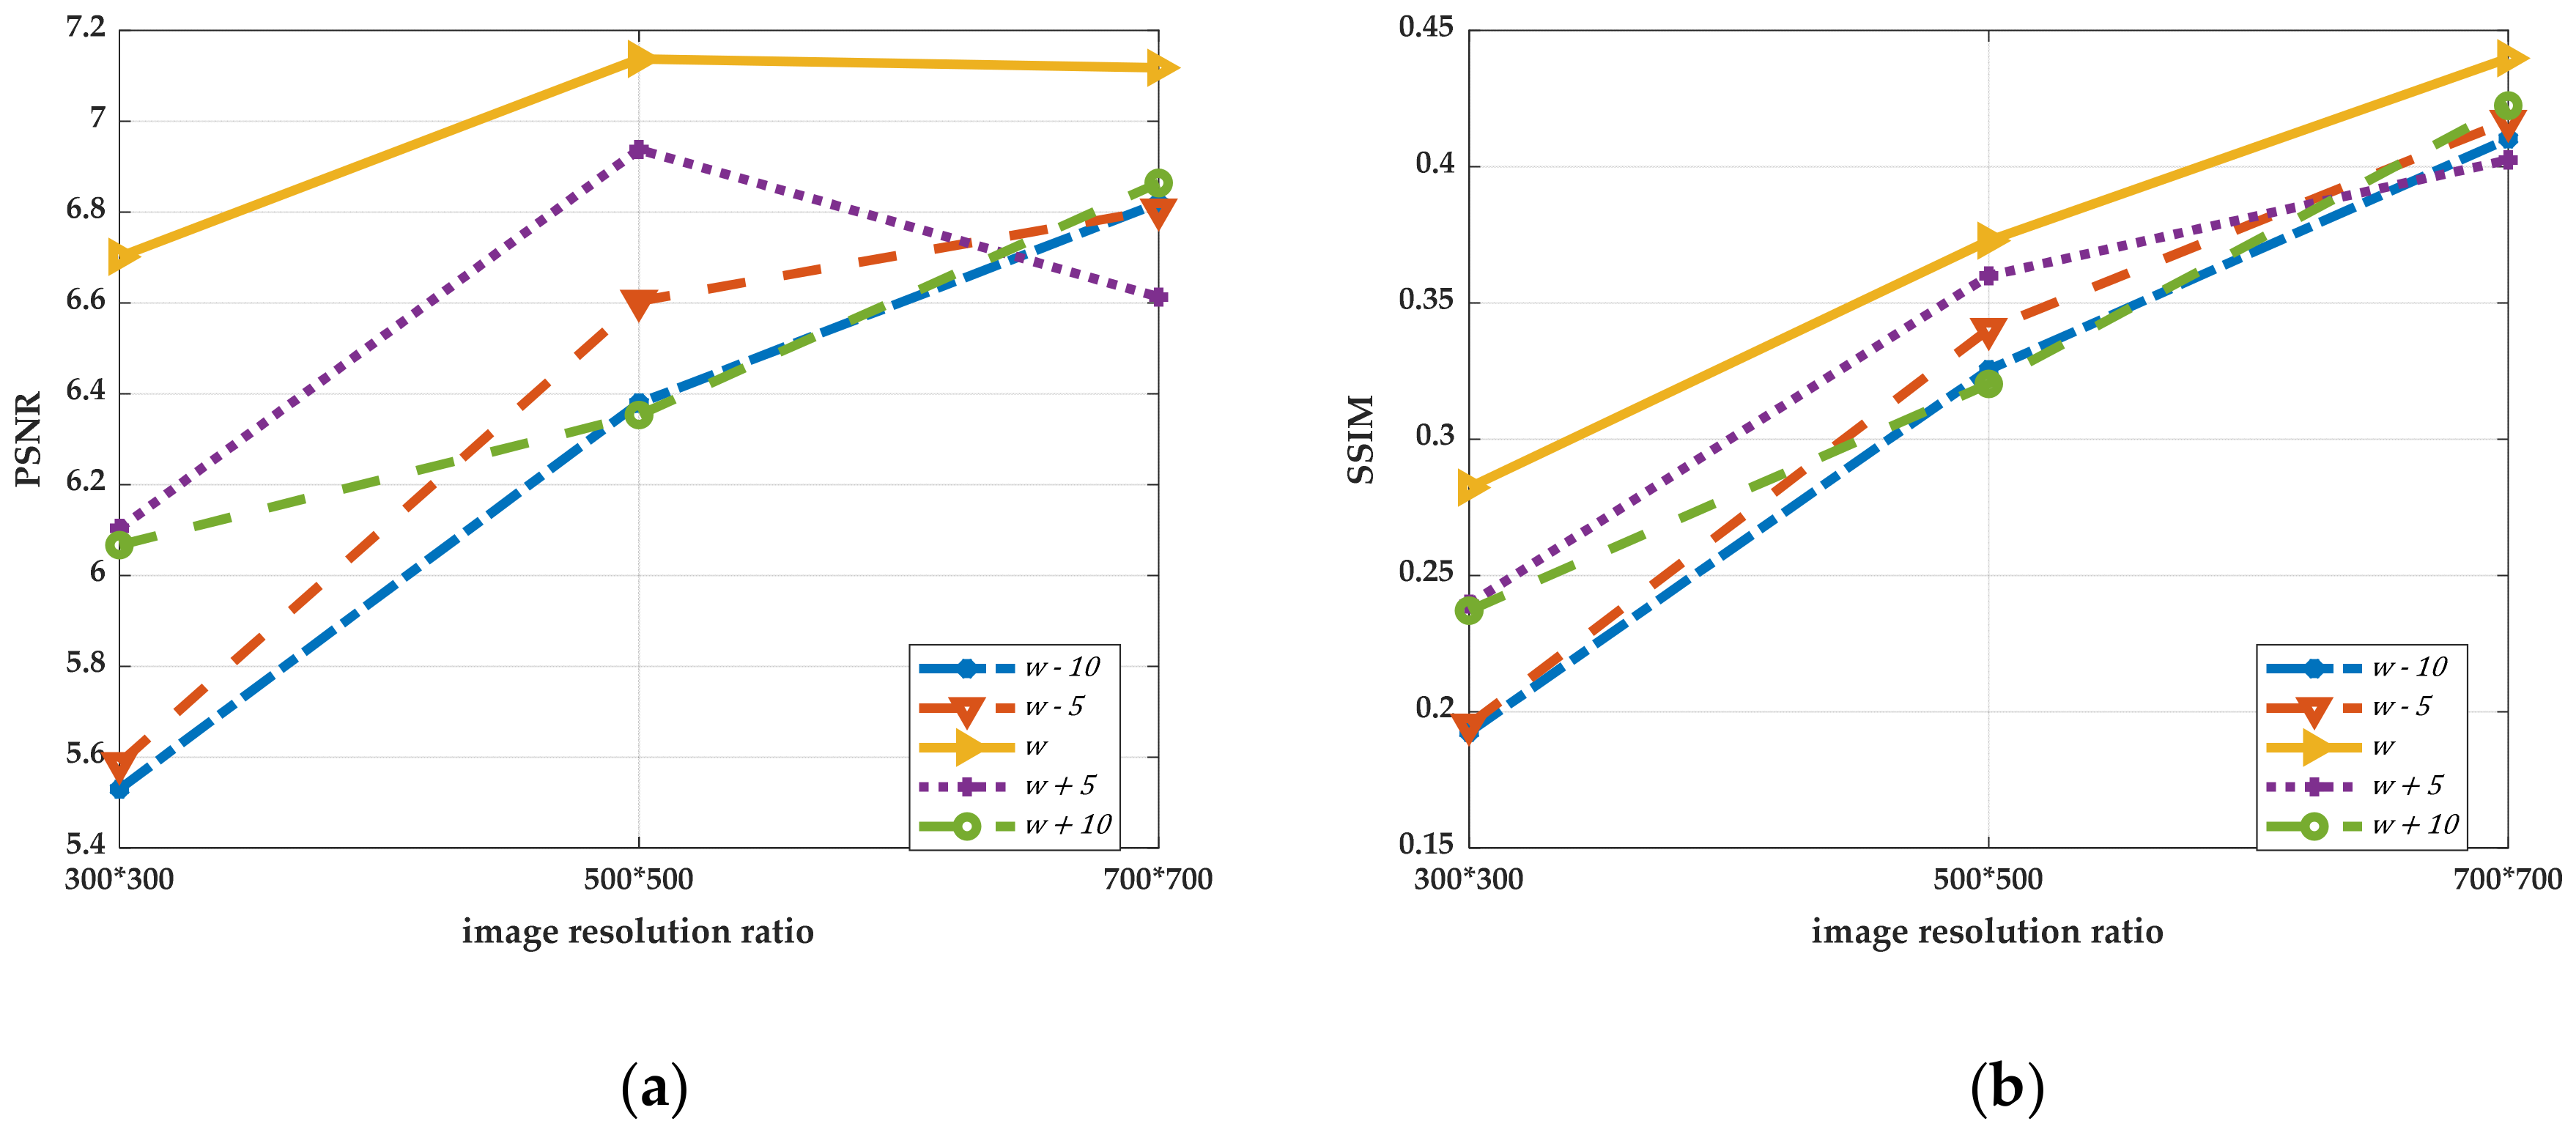
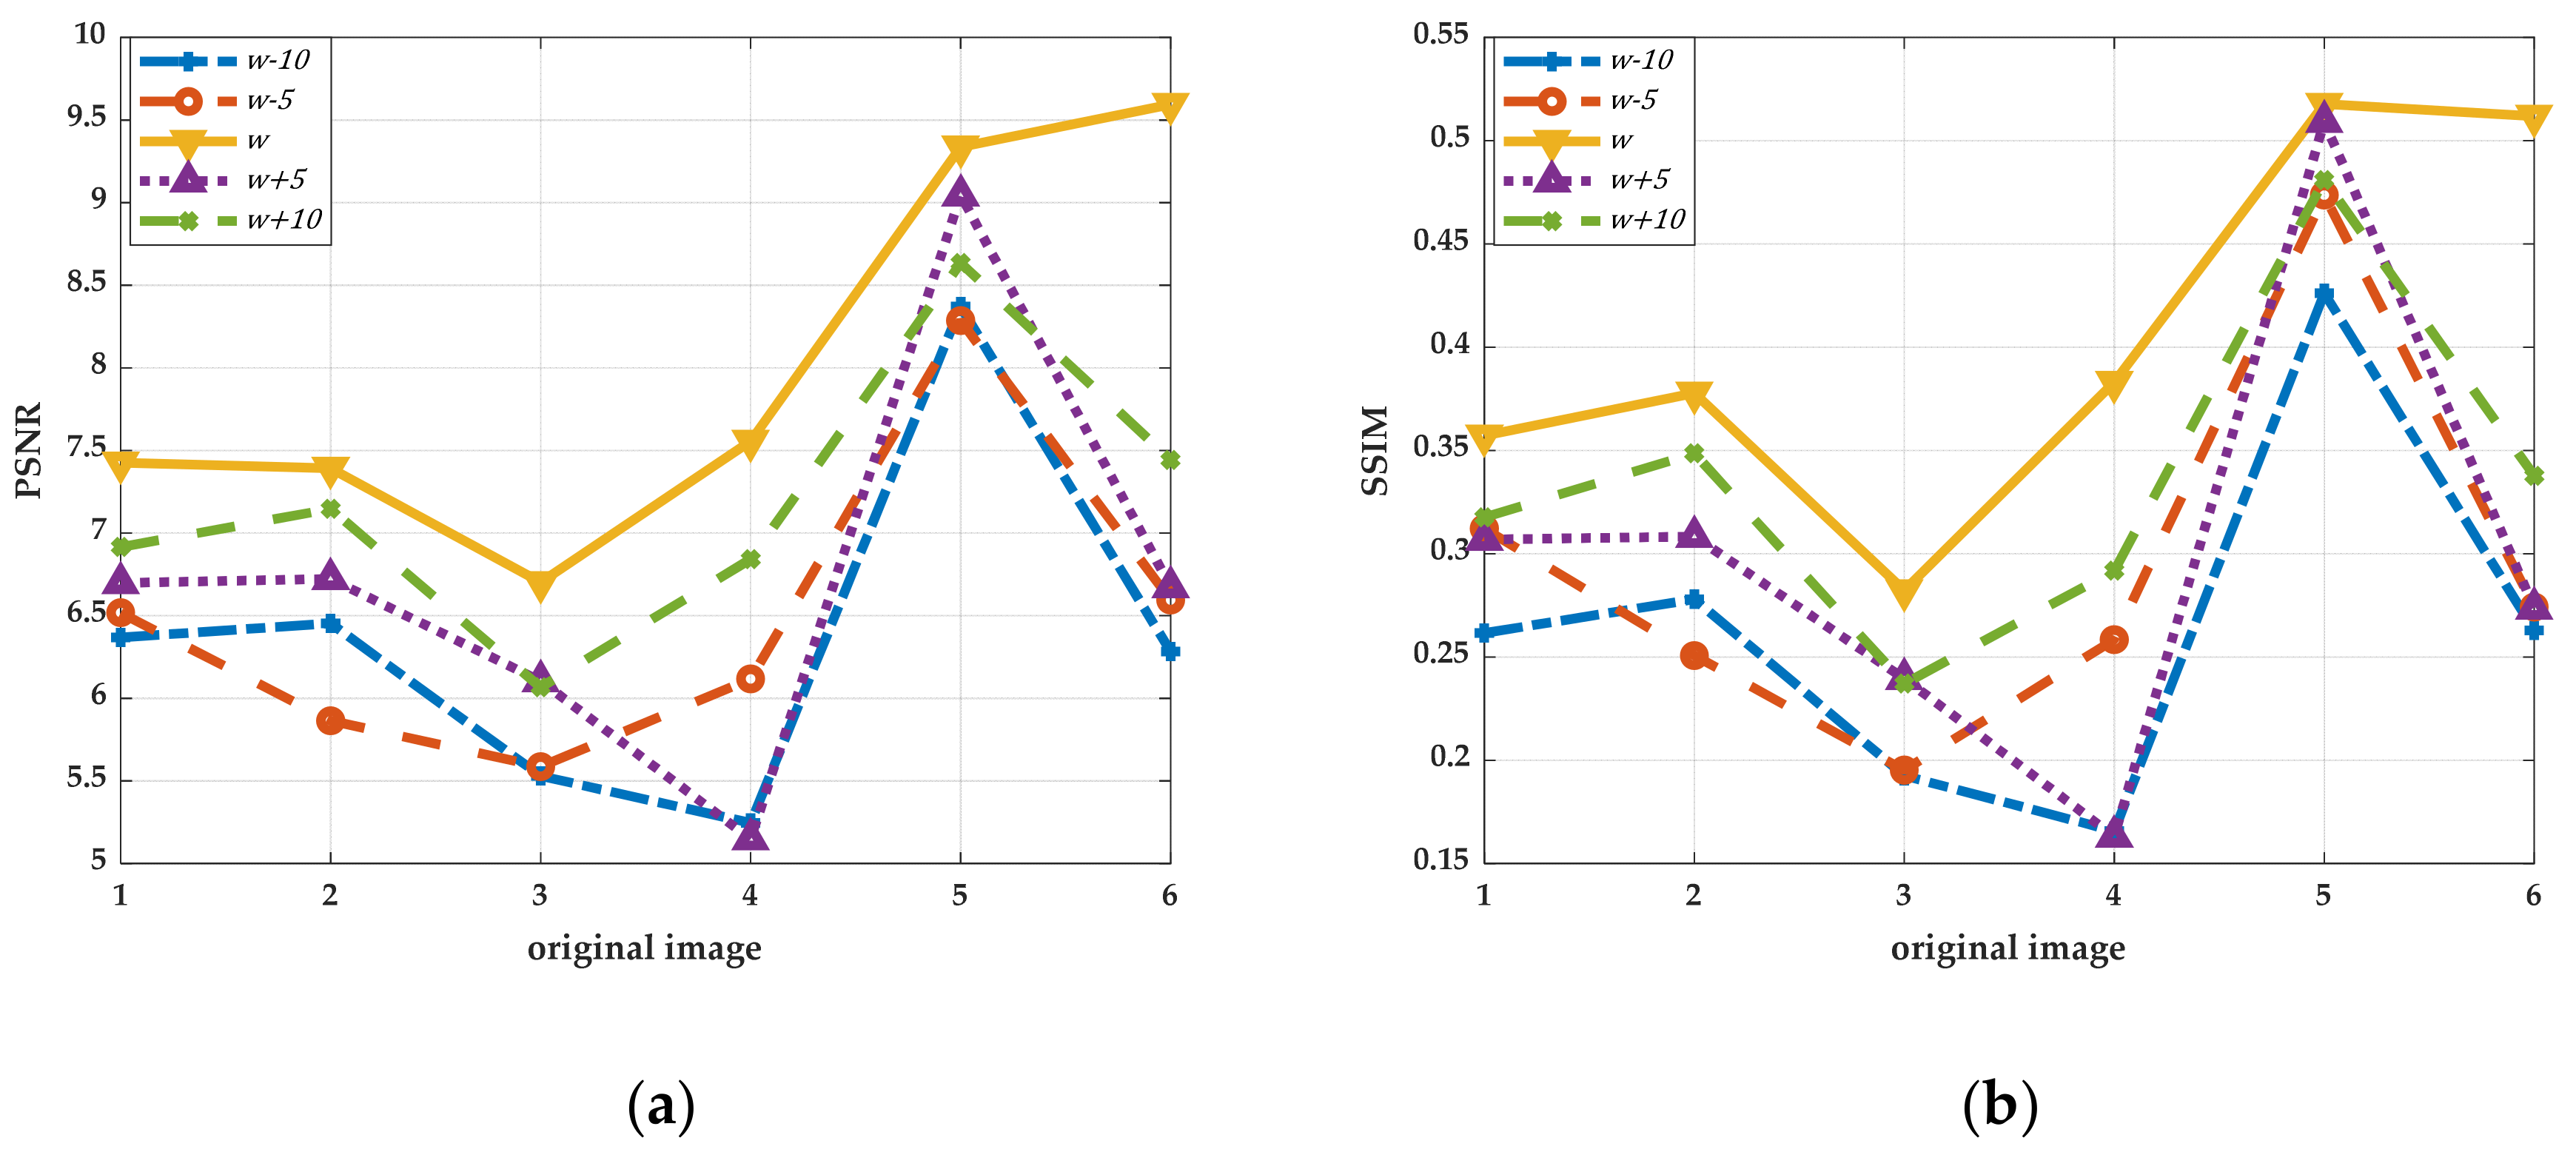
3.2. Adaptive Selection of Block Window
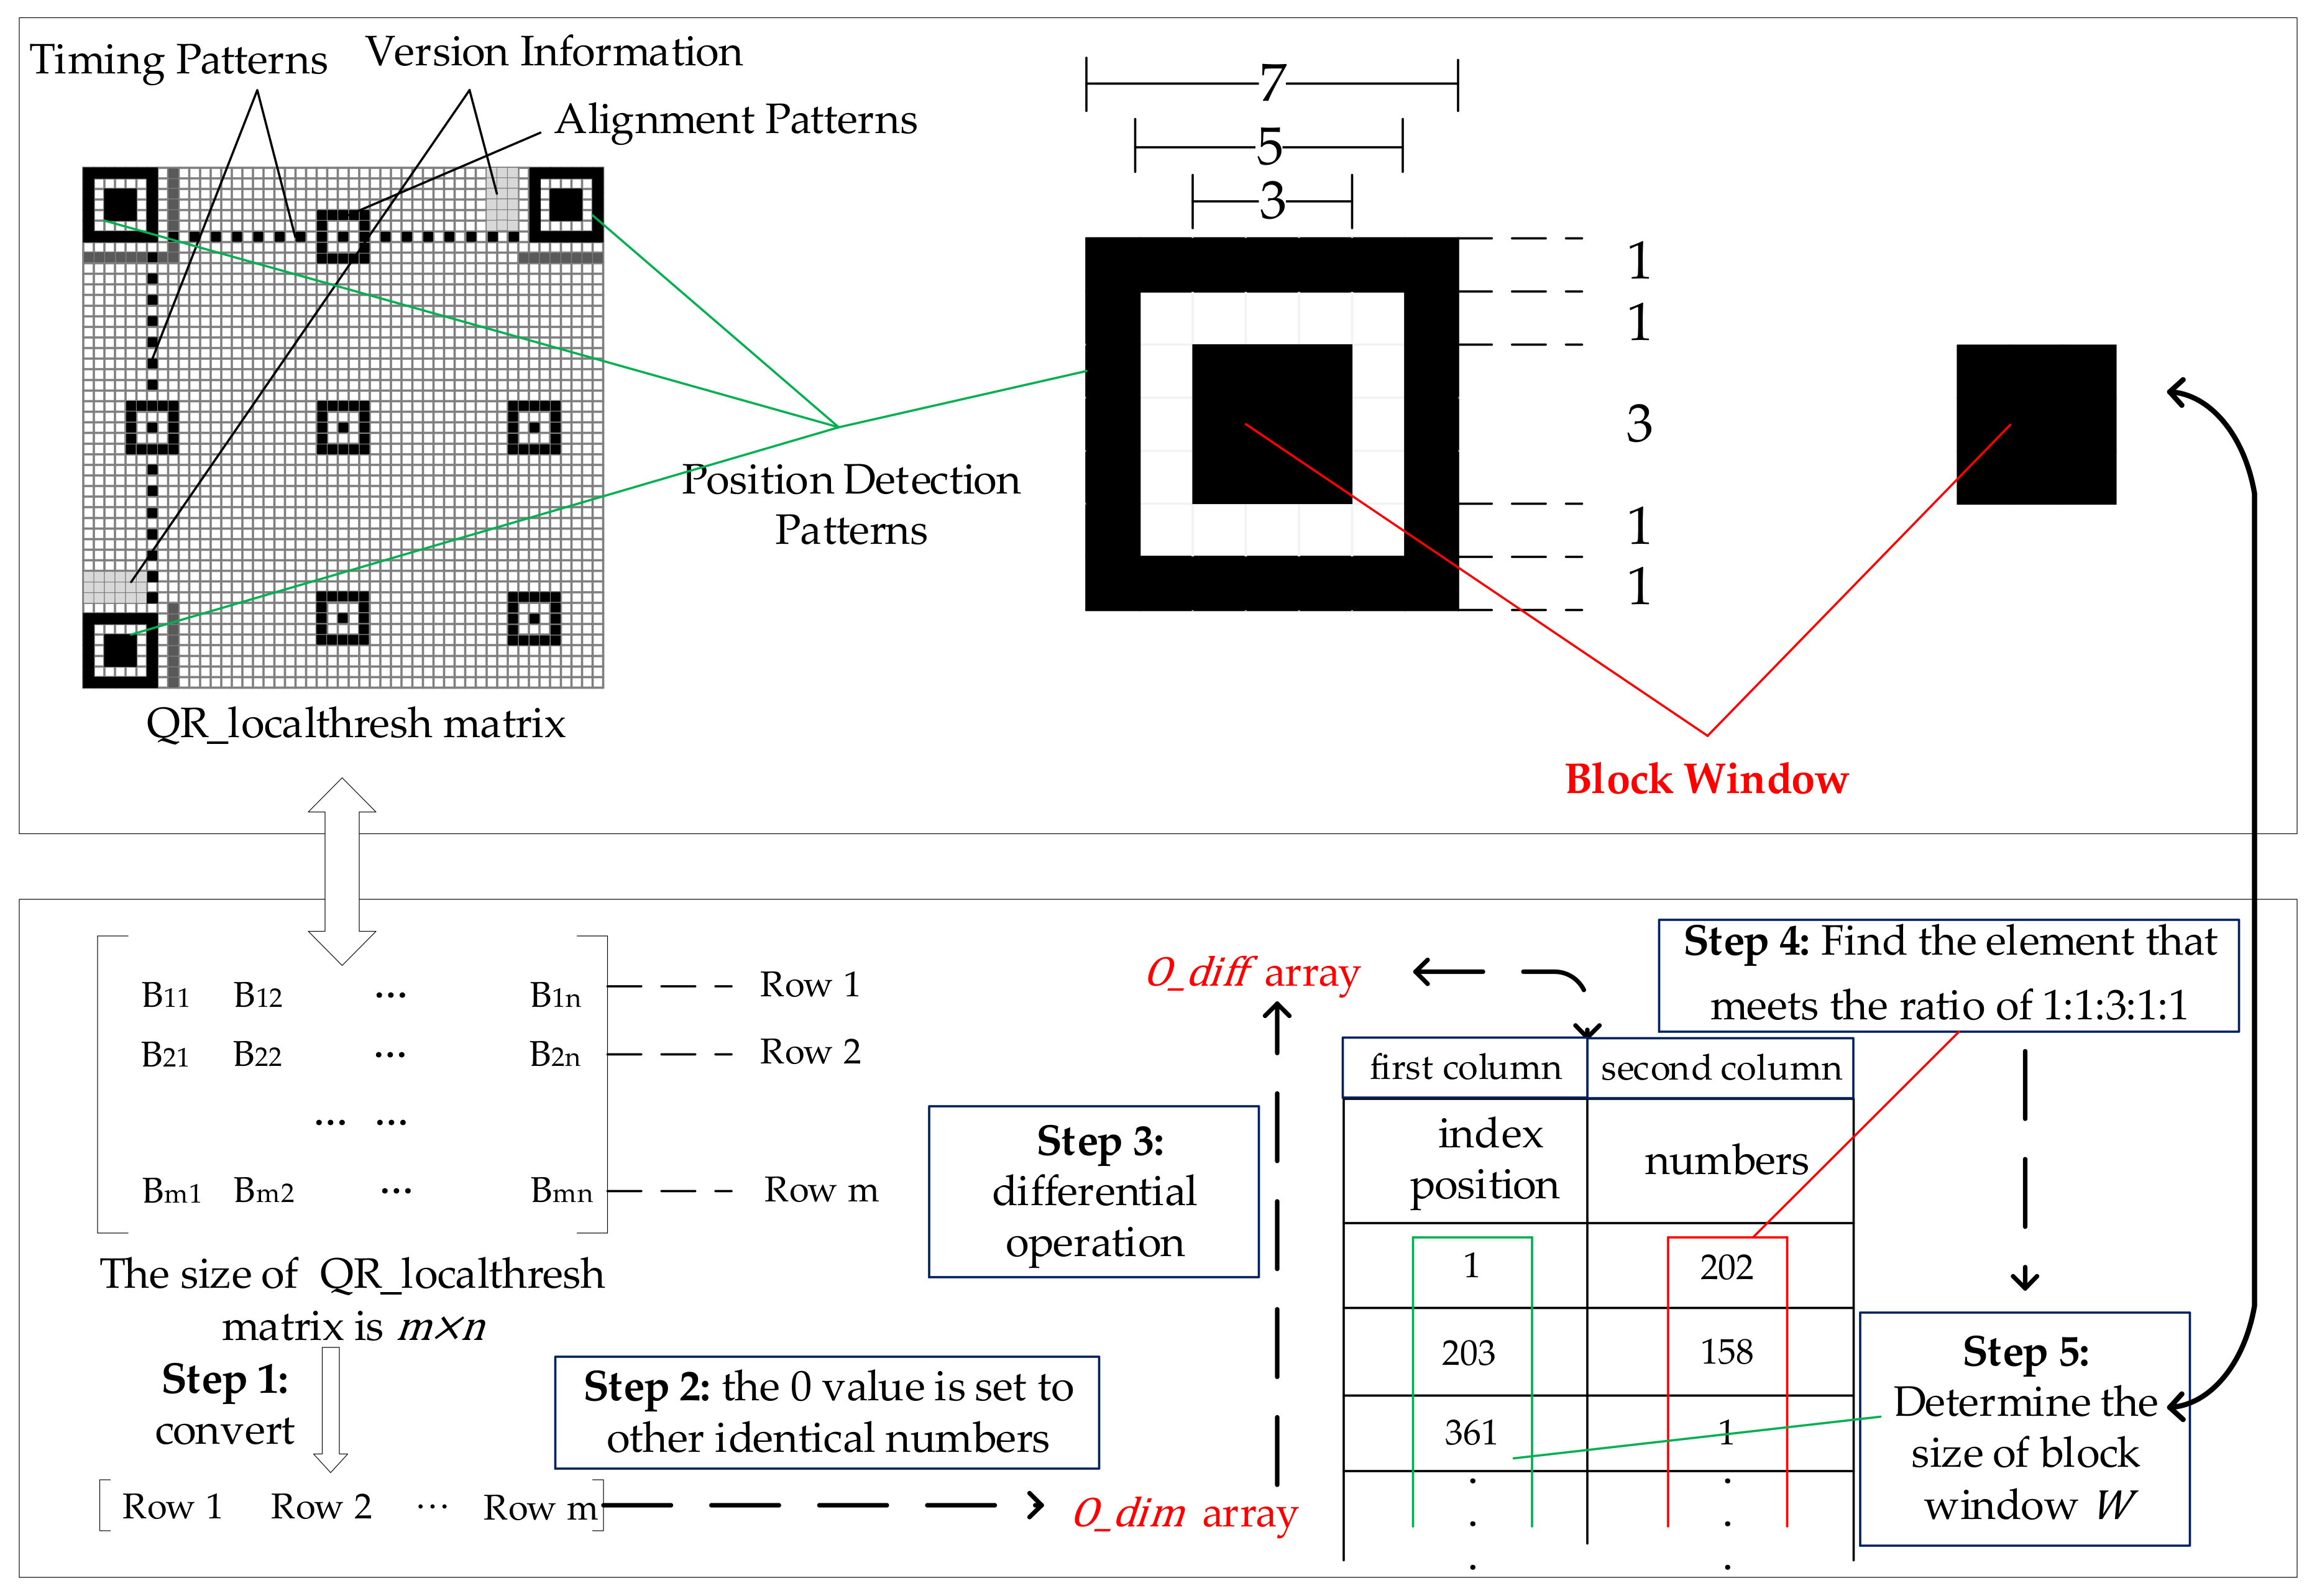
3.2.1. Selection Process of Adaptive Block Window
- (1)
- During the above process, it is necessary to convert the matrix of the preprocessed QR code image to a one-dimensional array, in the order of rows, and the value equal to zero in is set to other identical numbers to facilitate the subsequent differential operation.
- (2)
- Perform a differential operation on the and record the obtained array with two columns as , where the second column data of represents the number of consecutive identical elements in the . The first column of data matches the starting position in the , which is defined as the index position.
- (3)
- Find the element that meets the ratio of based on the last column data of , then calculate the size of the dark module in the middle of the position detection pattern by the index position corresponding to the element in the first column data. Namely, the index position difference corresponding to the proportional value 3 is equal to the side length of the dark module. Accordingly, the algorithm selects the size of the block window to be adaptively.
3.2.2. Analysis of the Feasibility Principle of Adaptive Block Window
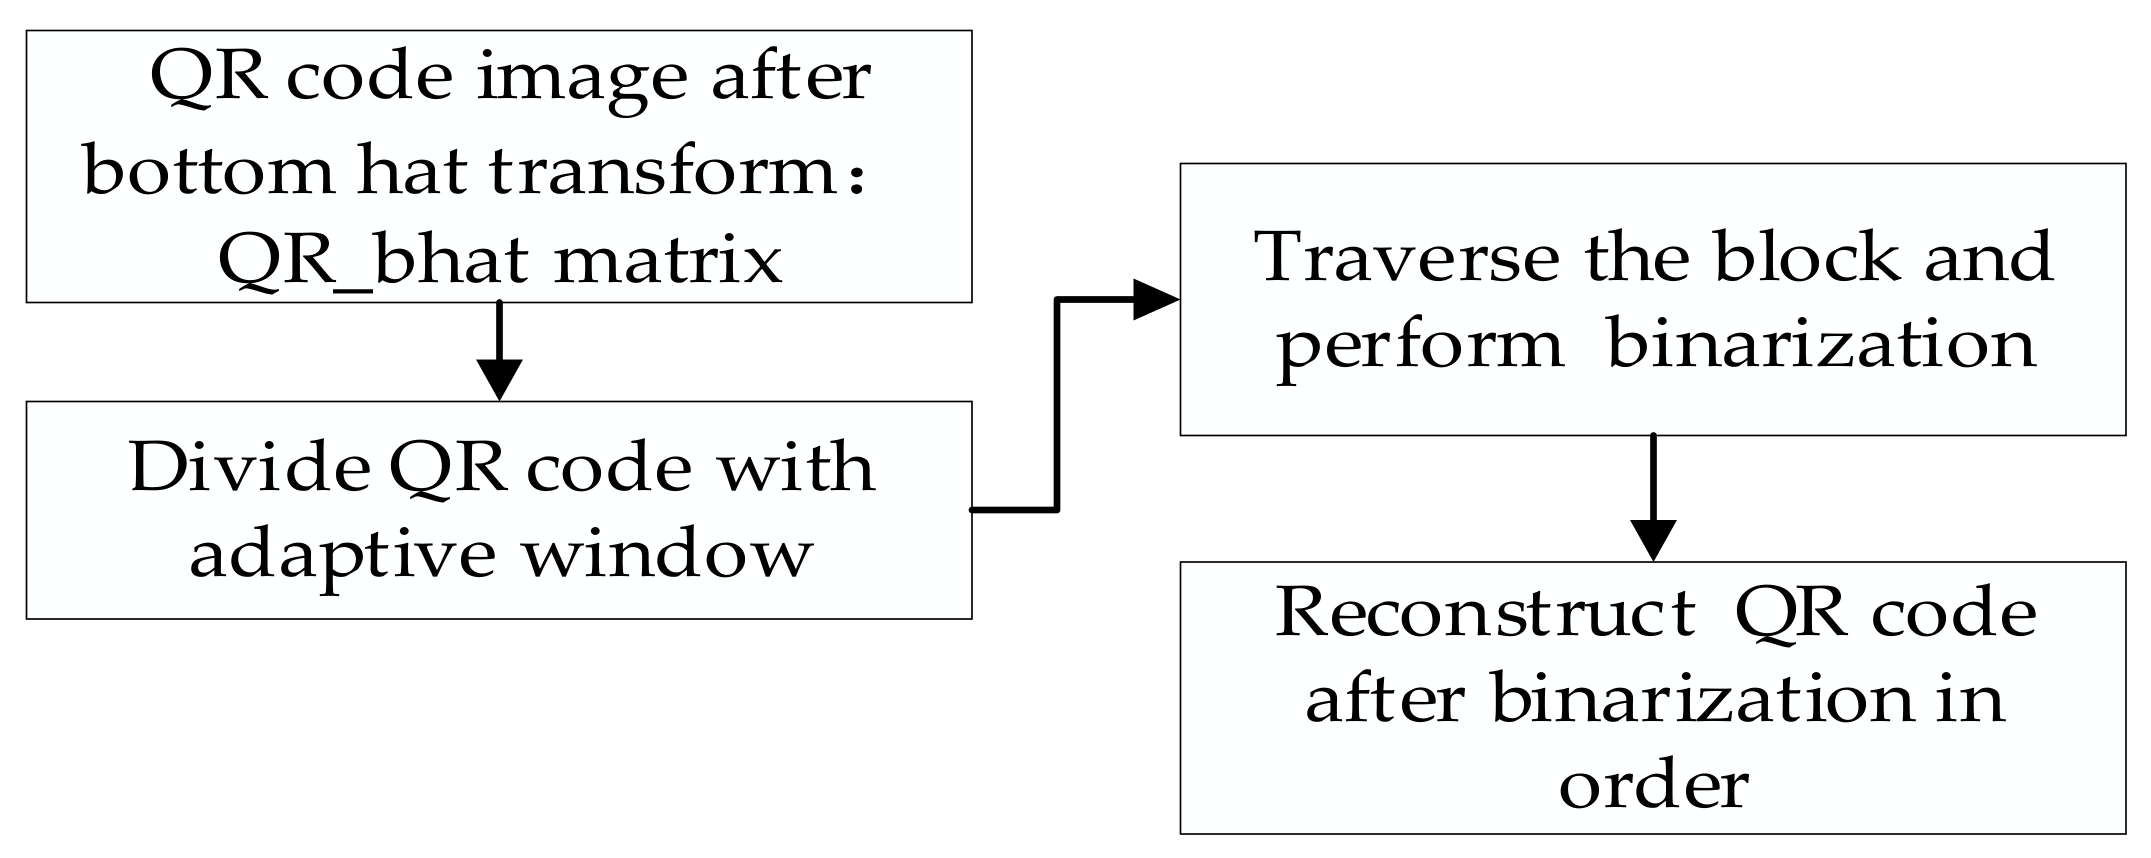
3.3. Binarization of QR Codes
- (1)
- The principle of using window to split the QR code image after the bottom hat transform is as follows. The QR code image after the bottom hat transform is divided into blocks from left to right. When the total length of all the blocks exceeds the image width, the QR code is at most divided into the image height. Likewise, for the QR code image after the bottom hat transform is divided into blocks from top to bottom. When the total length of all the blocks exceeds the image height, the QR code is at most divided into the image width.
- (2)
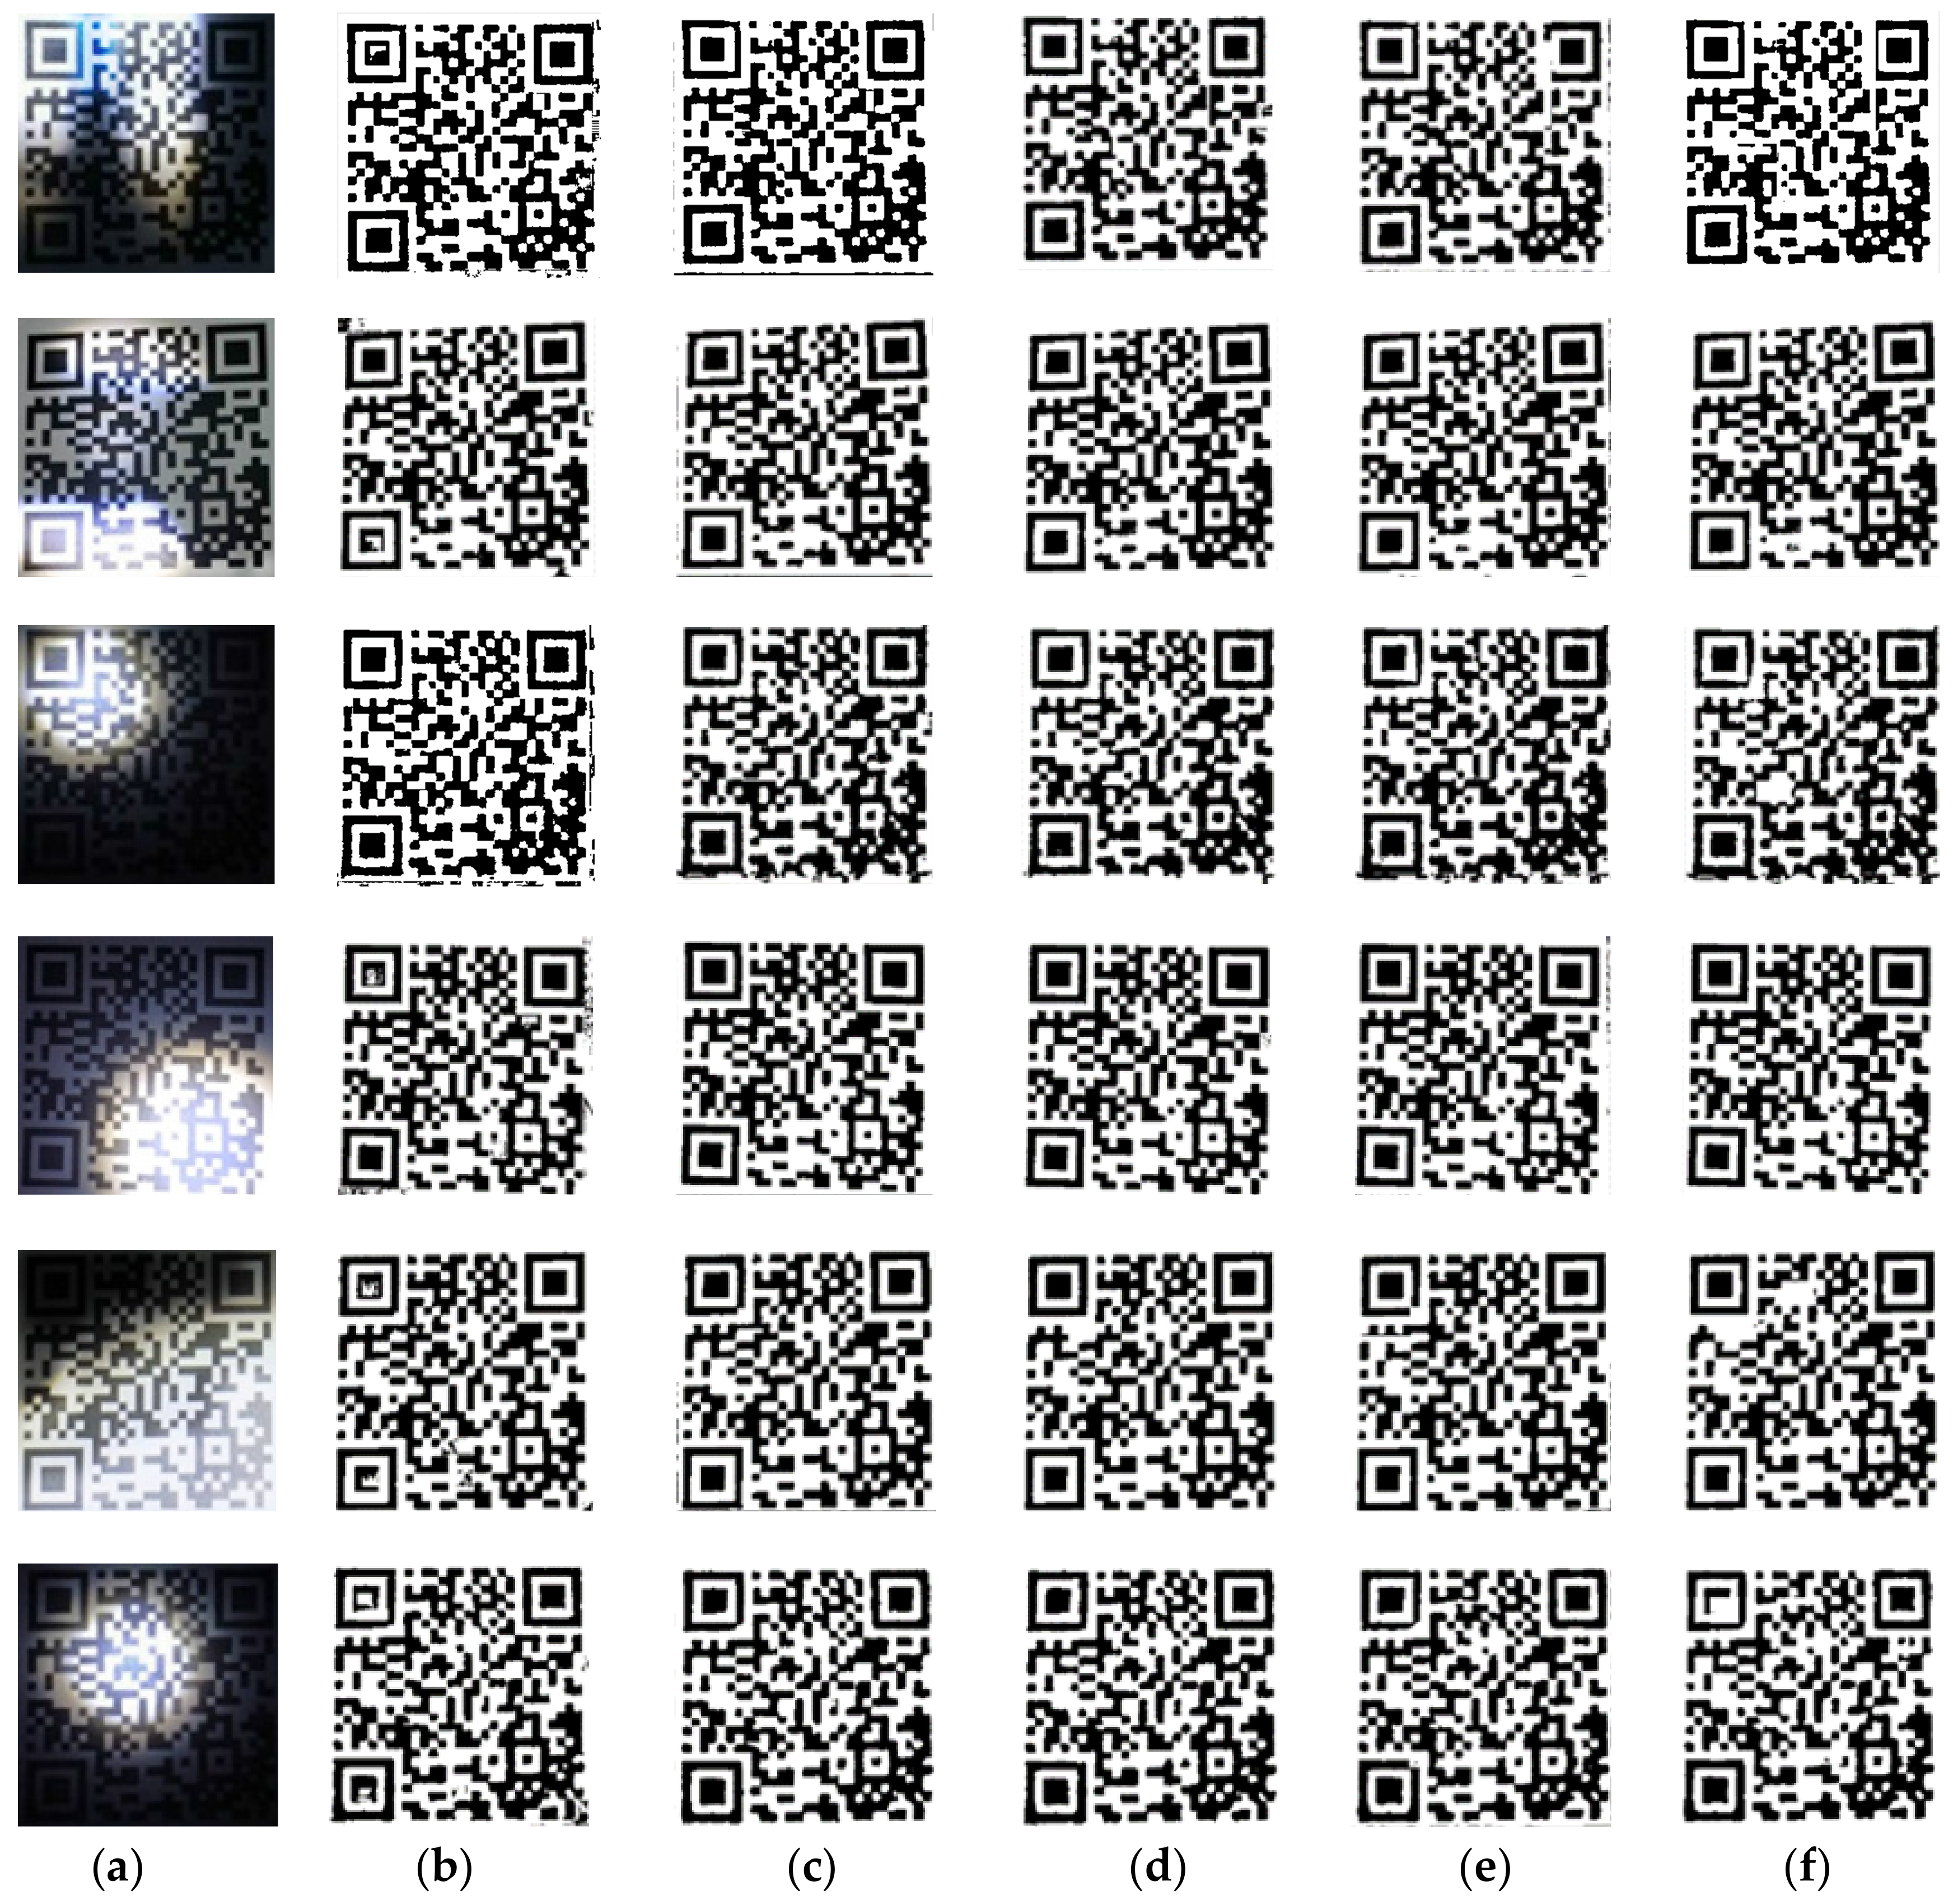
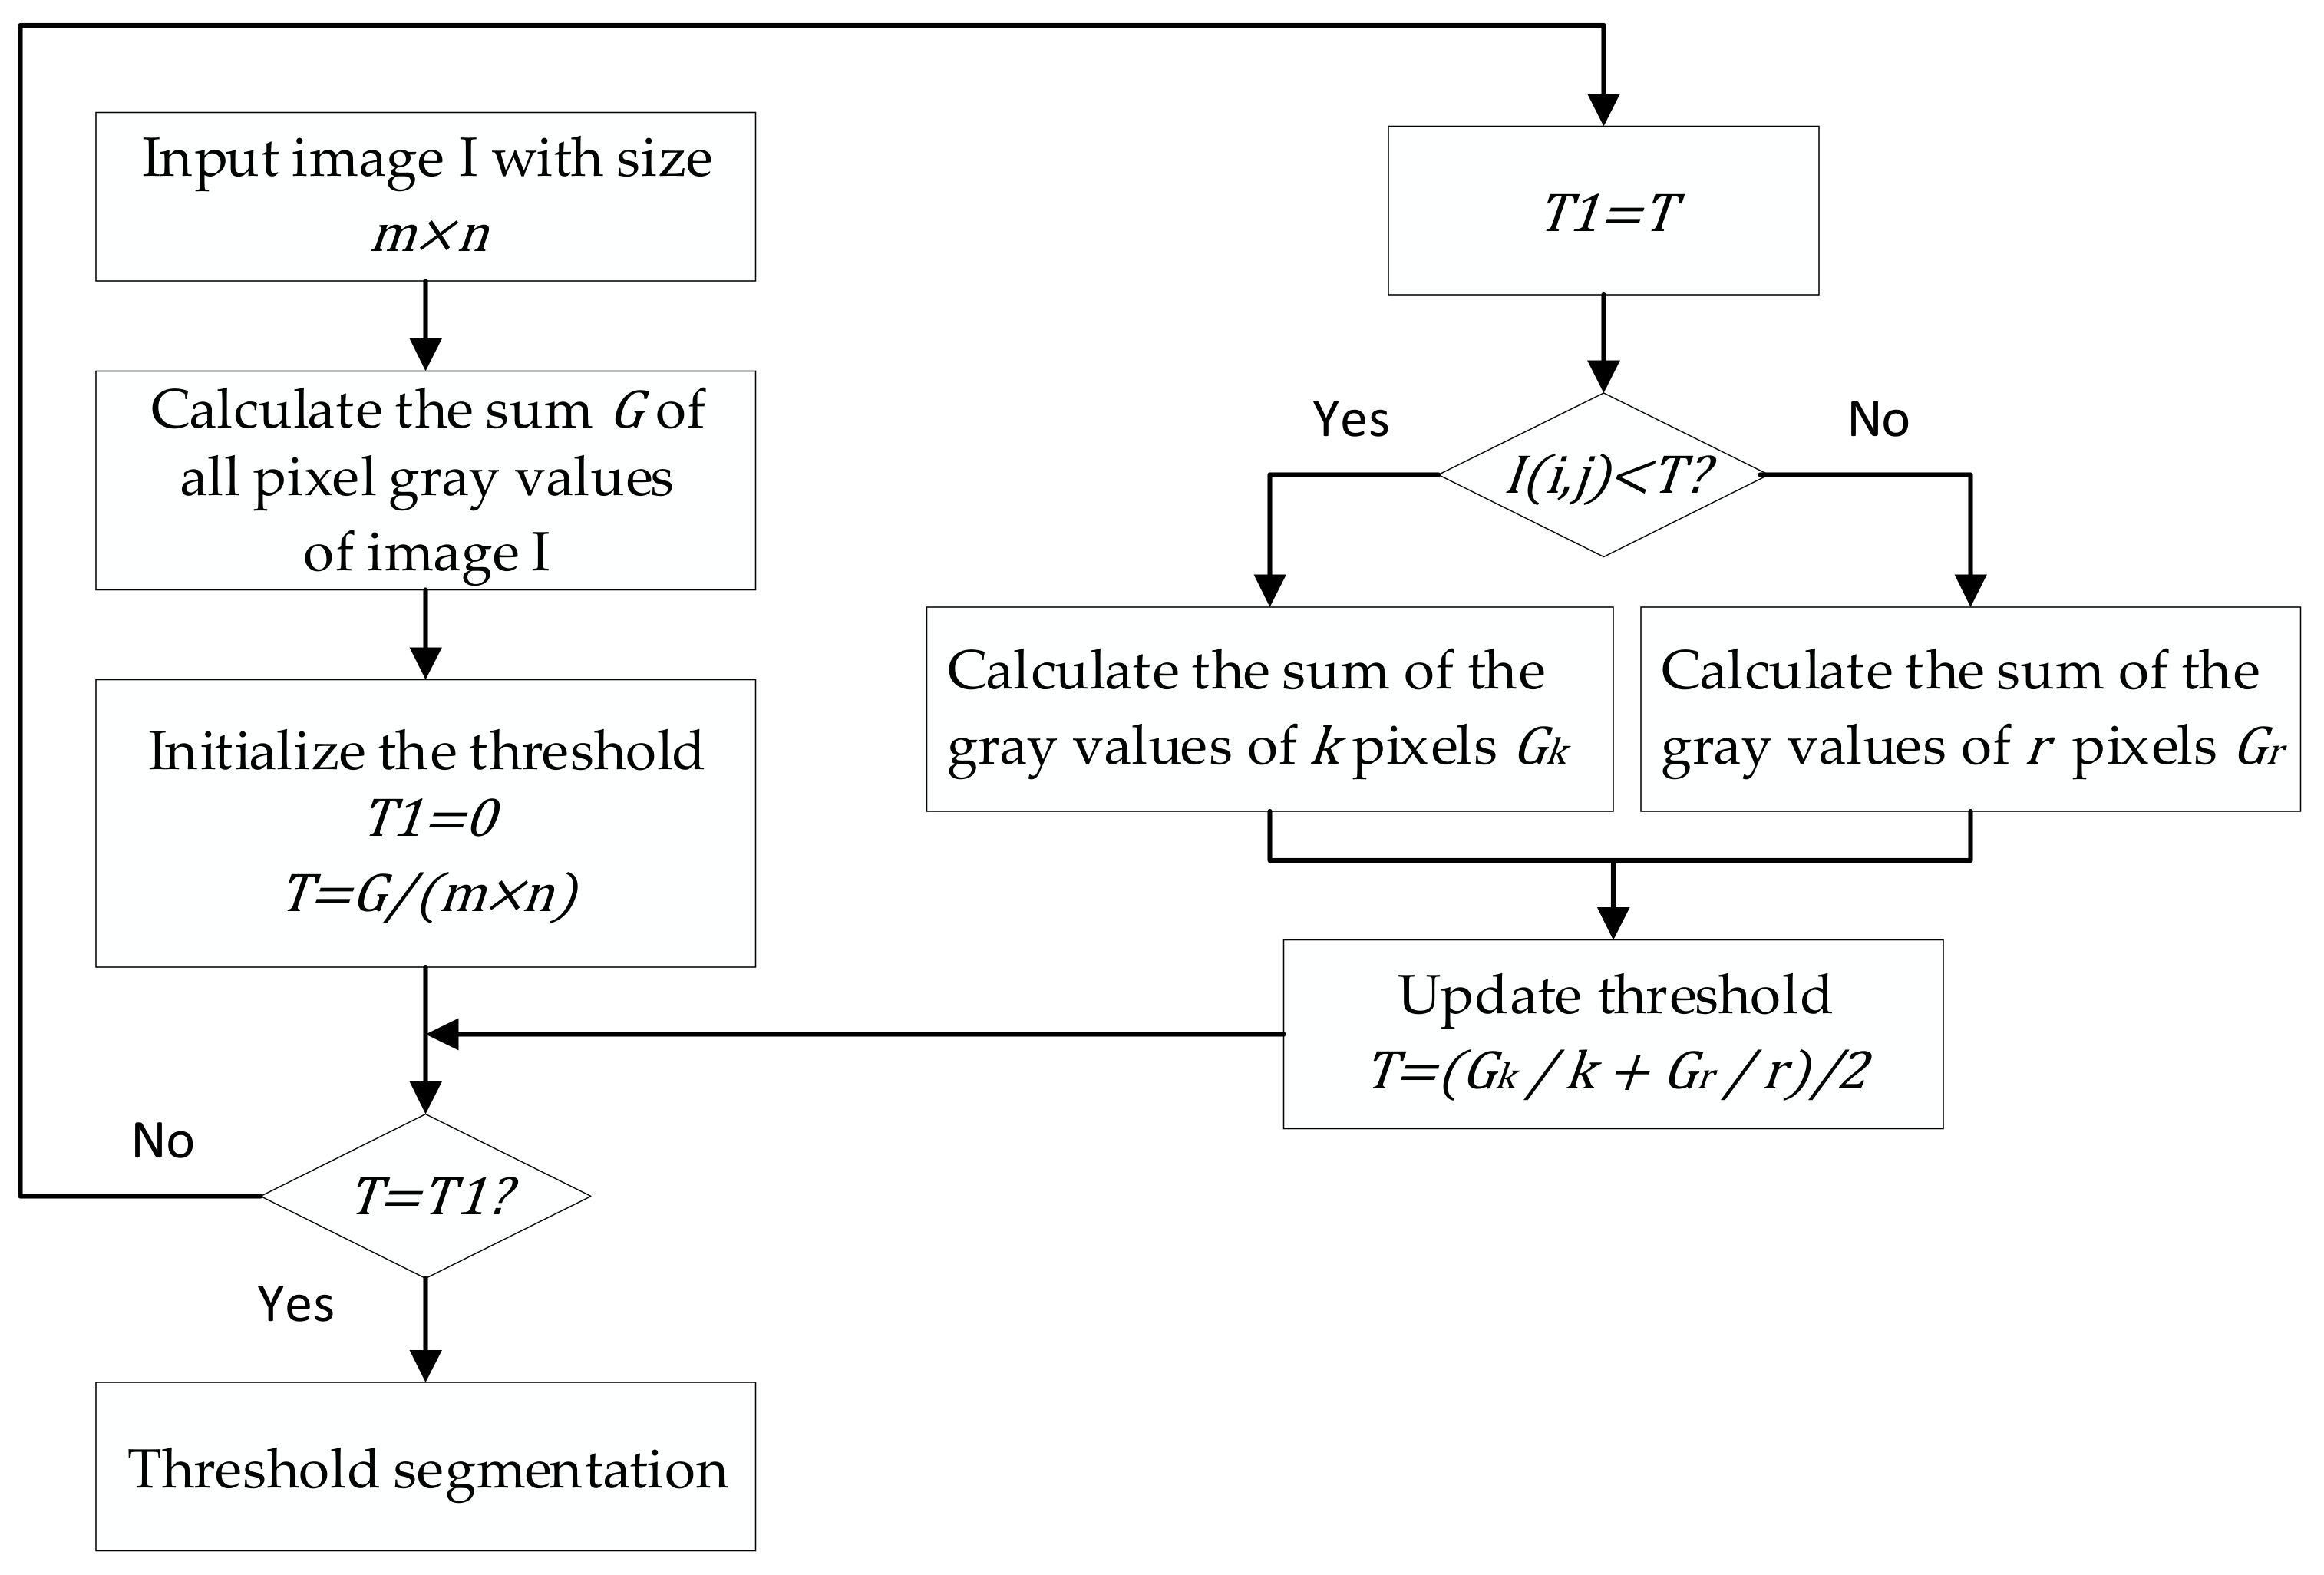
- All the blocks are traversed, and each block is binarized by the Otsu’s method. However, it was found in the experiment that the image information at the first block location sometimes disappears. Through analysis, we found that the first block image contains an indefinite foreground and background after enhancing the contrast of the uneven illumination of the QR code. Therefore, the Otsu’s algorithm cannot obtain a better binarization effect after processing the image. The defect can be eliminated when the cyclic threshold algorithm processes the first block. The schematic diagram is shown in Figure 9.
- (3)
- All binarized QR code blocks are combined sequentially to reconstruct a whole QR code image.
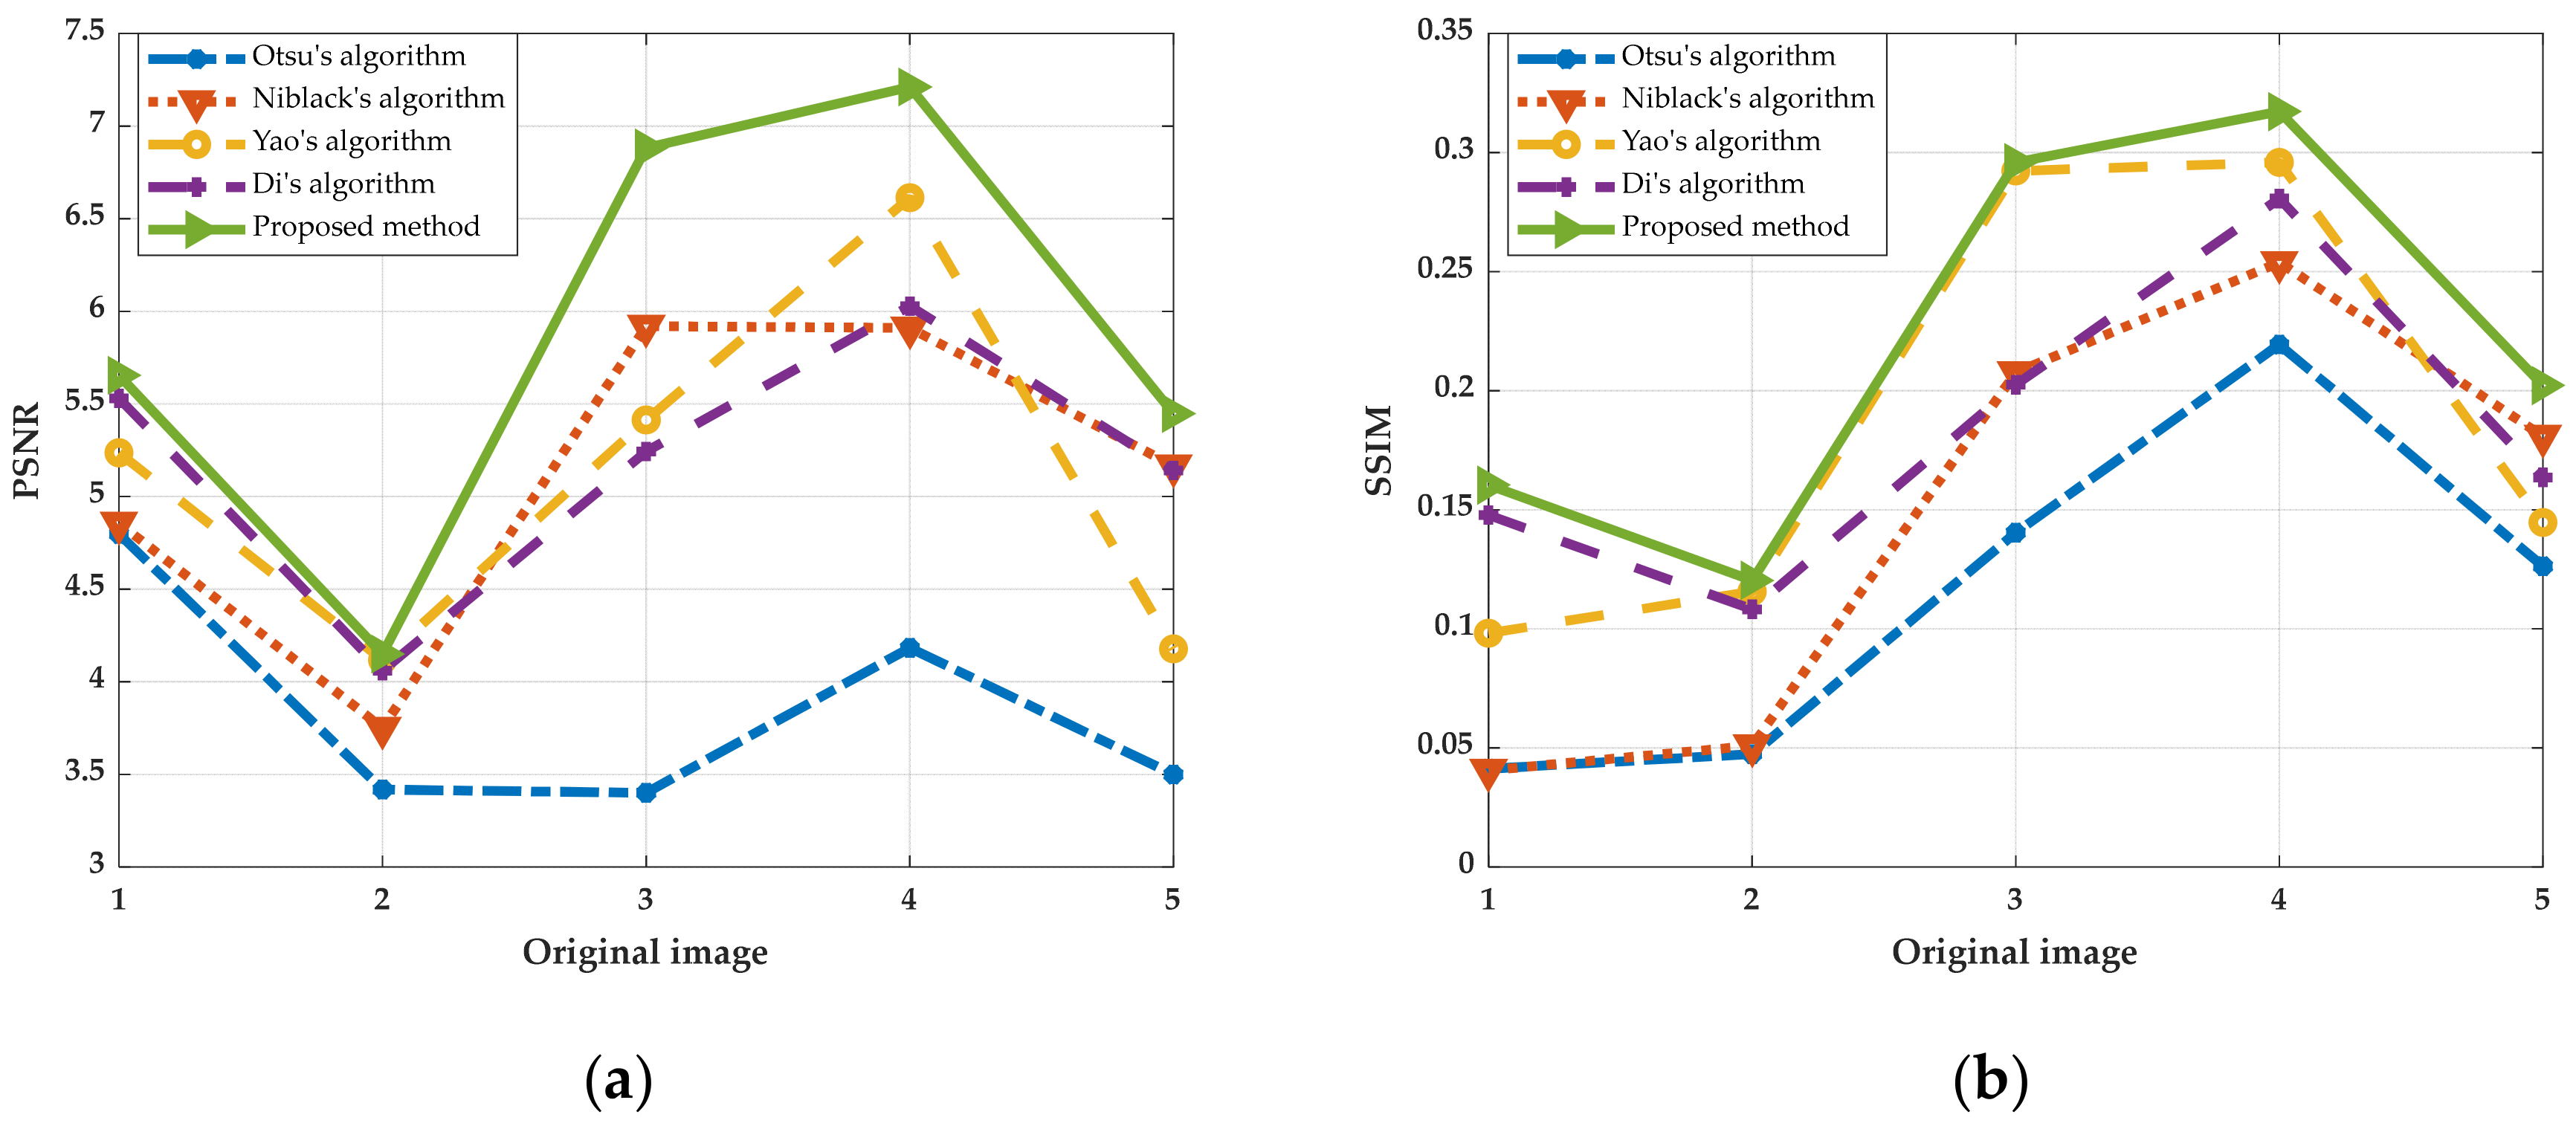
4. Experiments
- (1)
- (2)
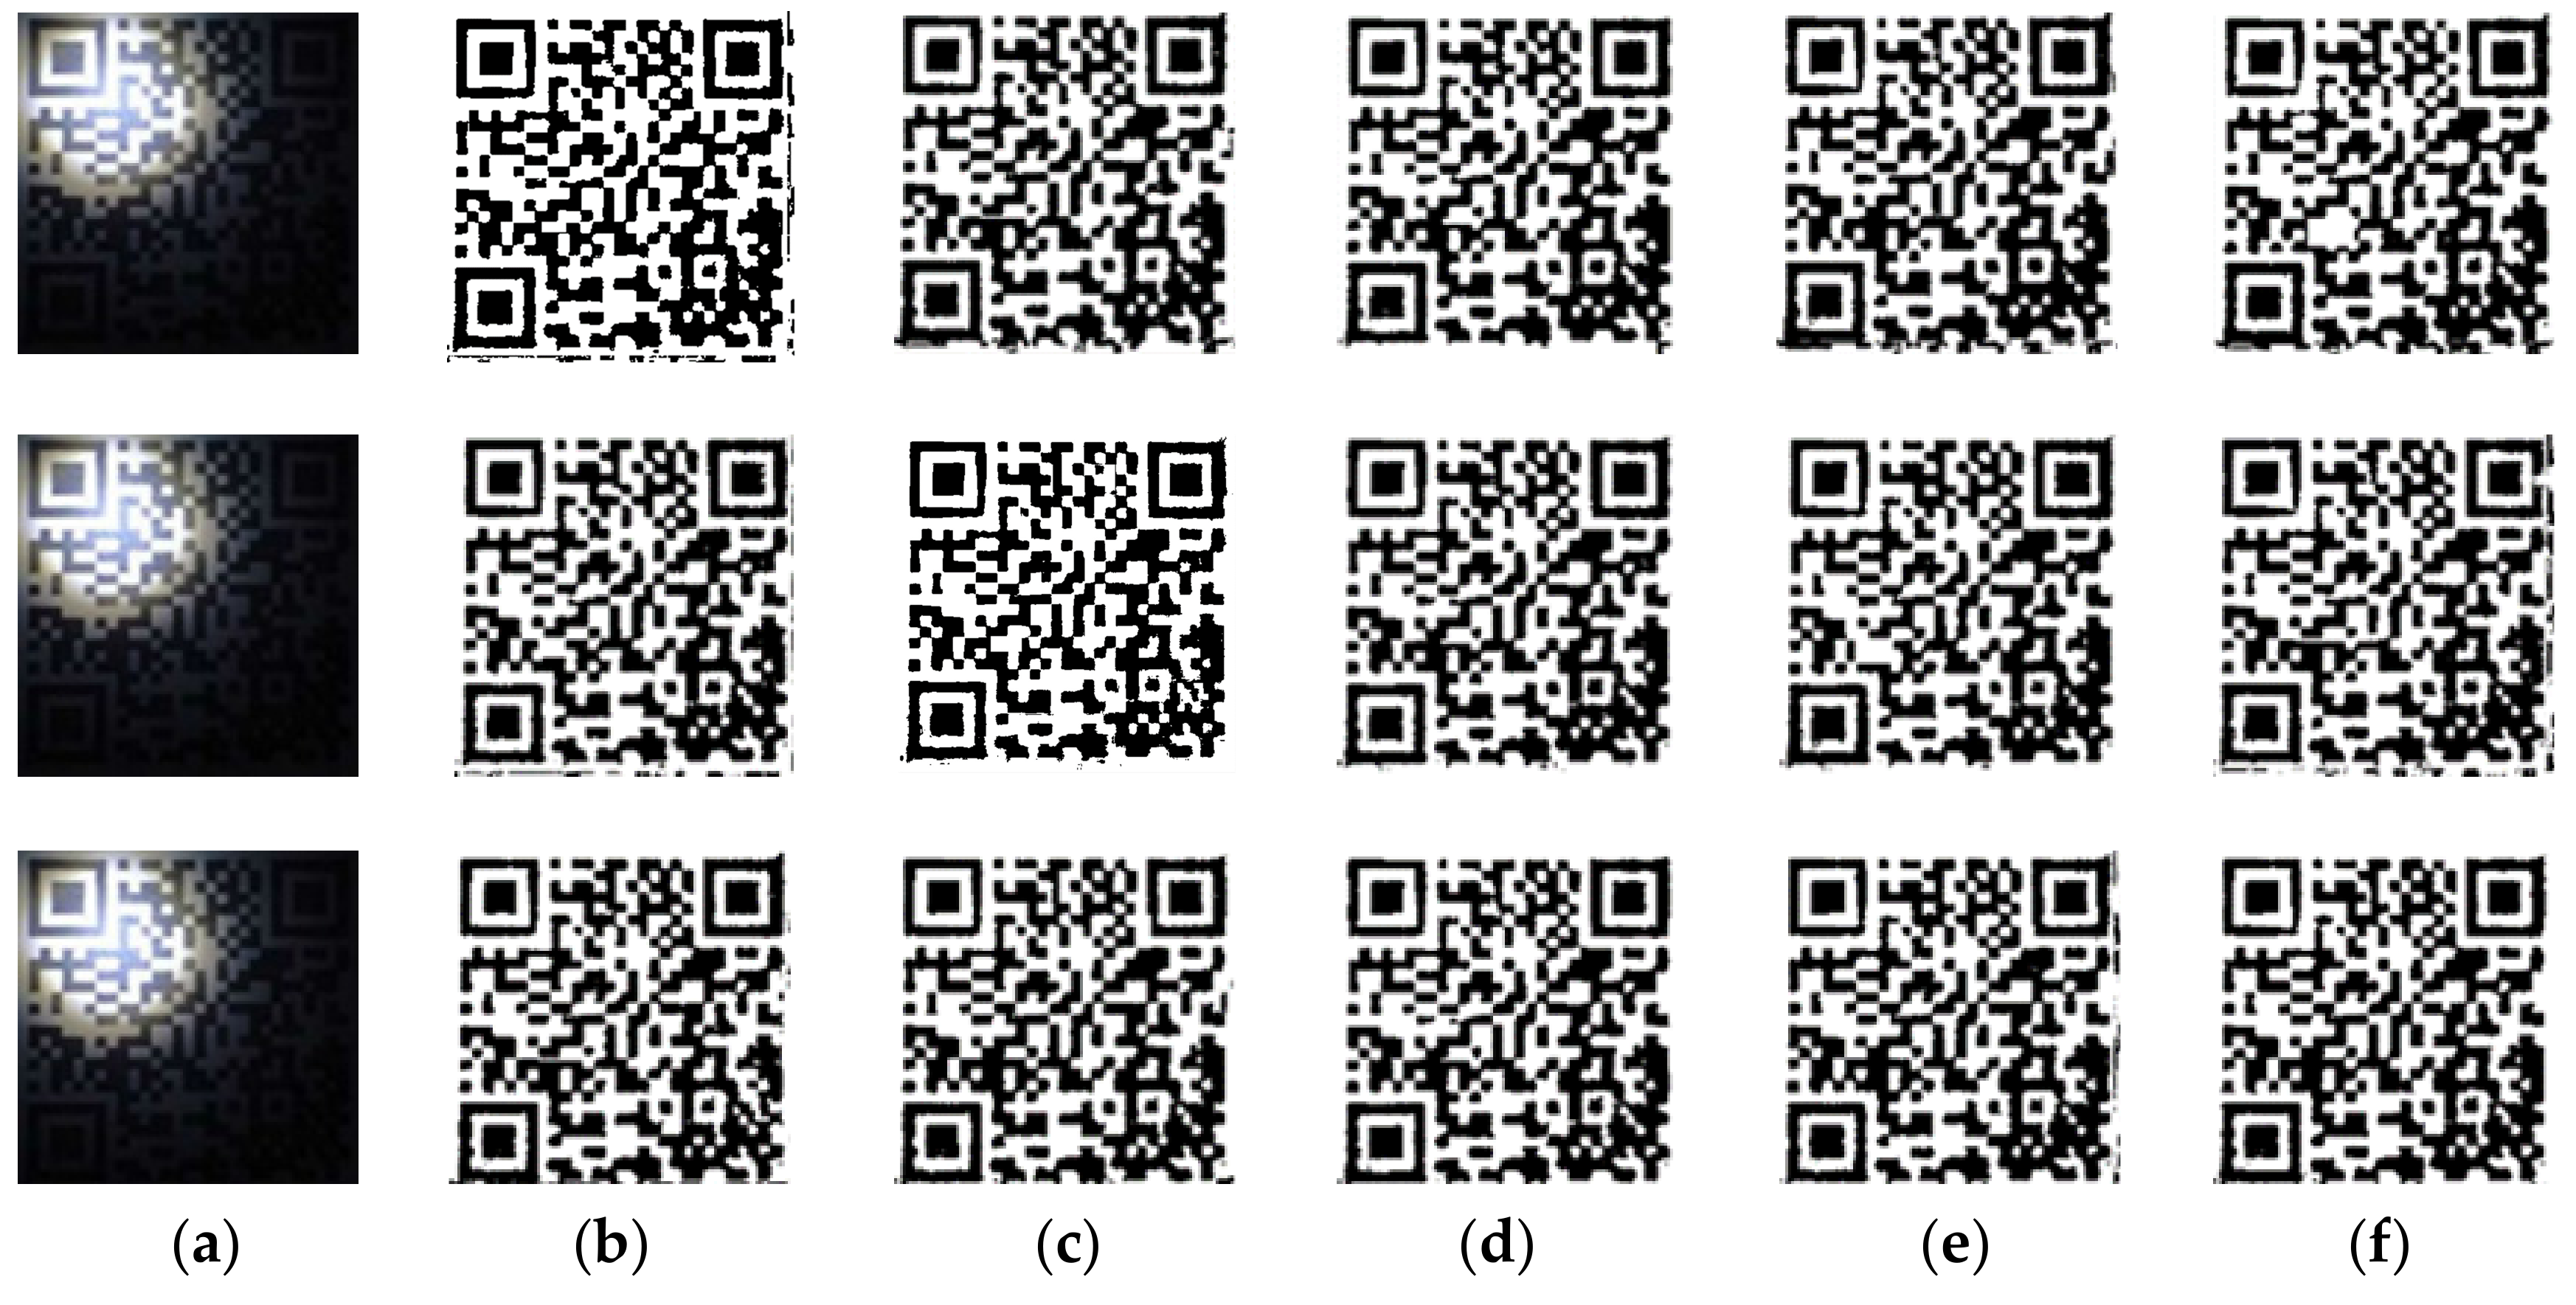
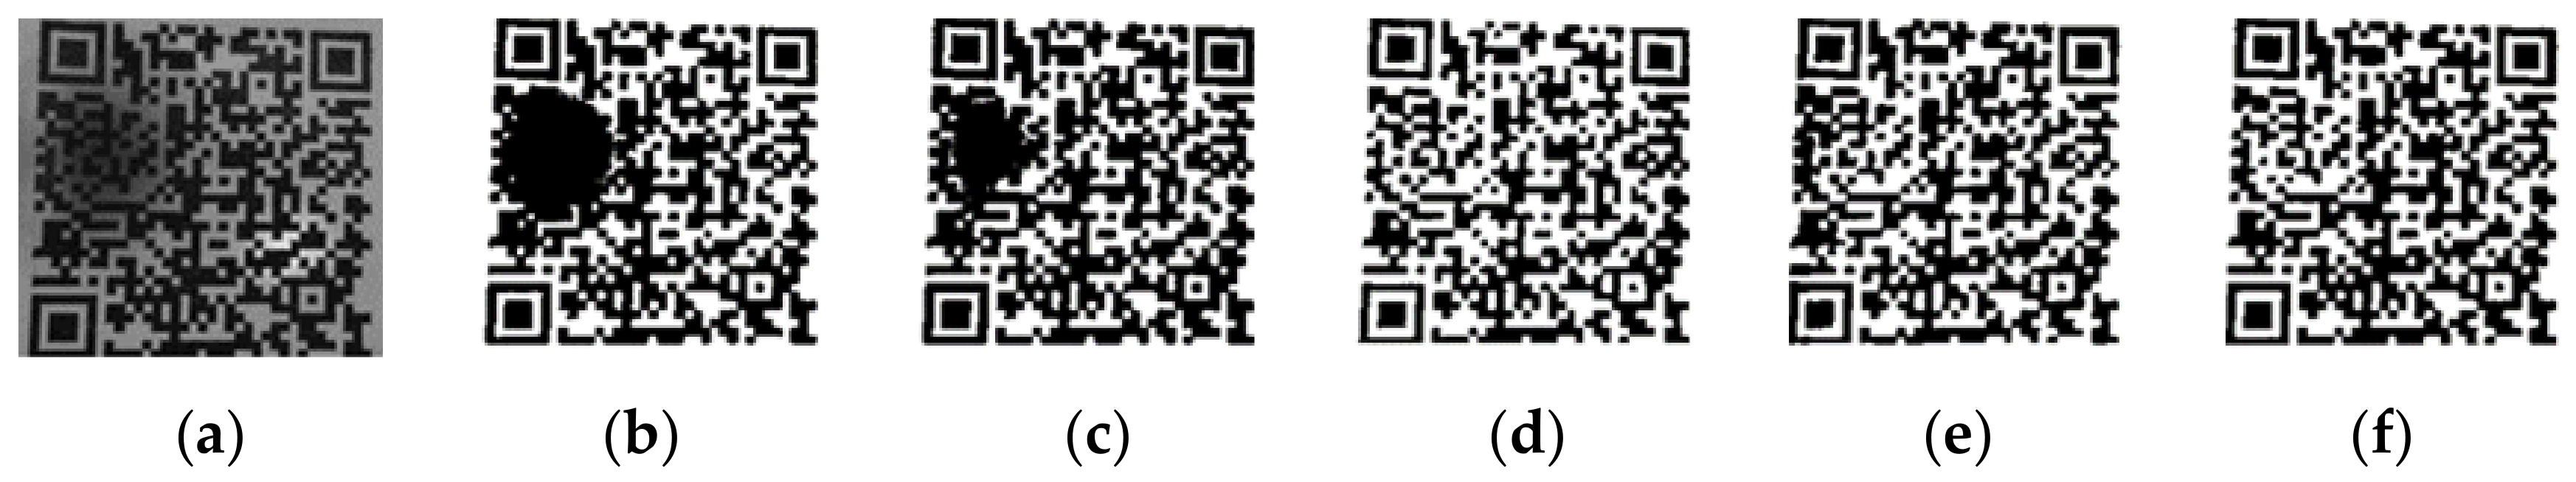
- The effect of different algorithms in dealing with the uneven illumination of the QR code in Yao’s paper [9] is shown in Figure 11. The result of this uneven lighting phenomenon is due to the collection of light which is dark, or the limited acquisition by the device so that the overall gray value of the image is low.
- (3)
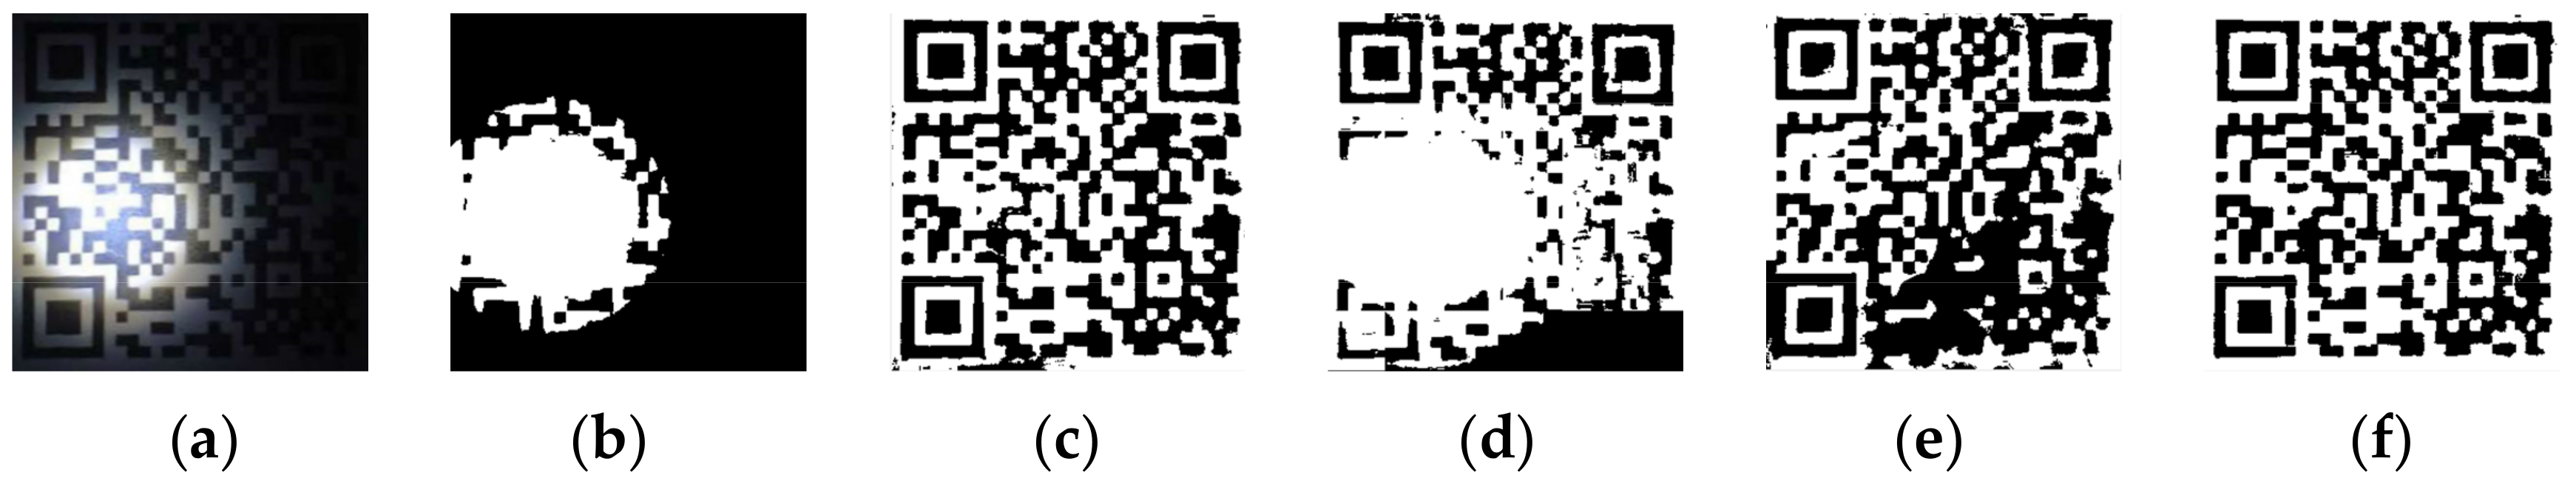
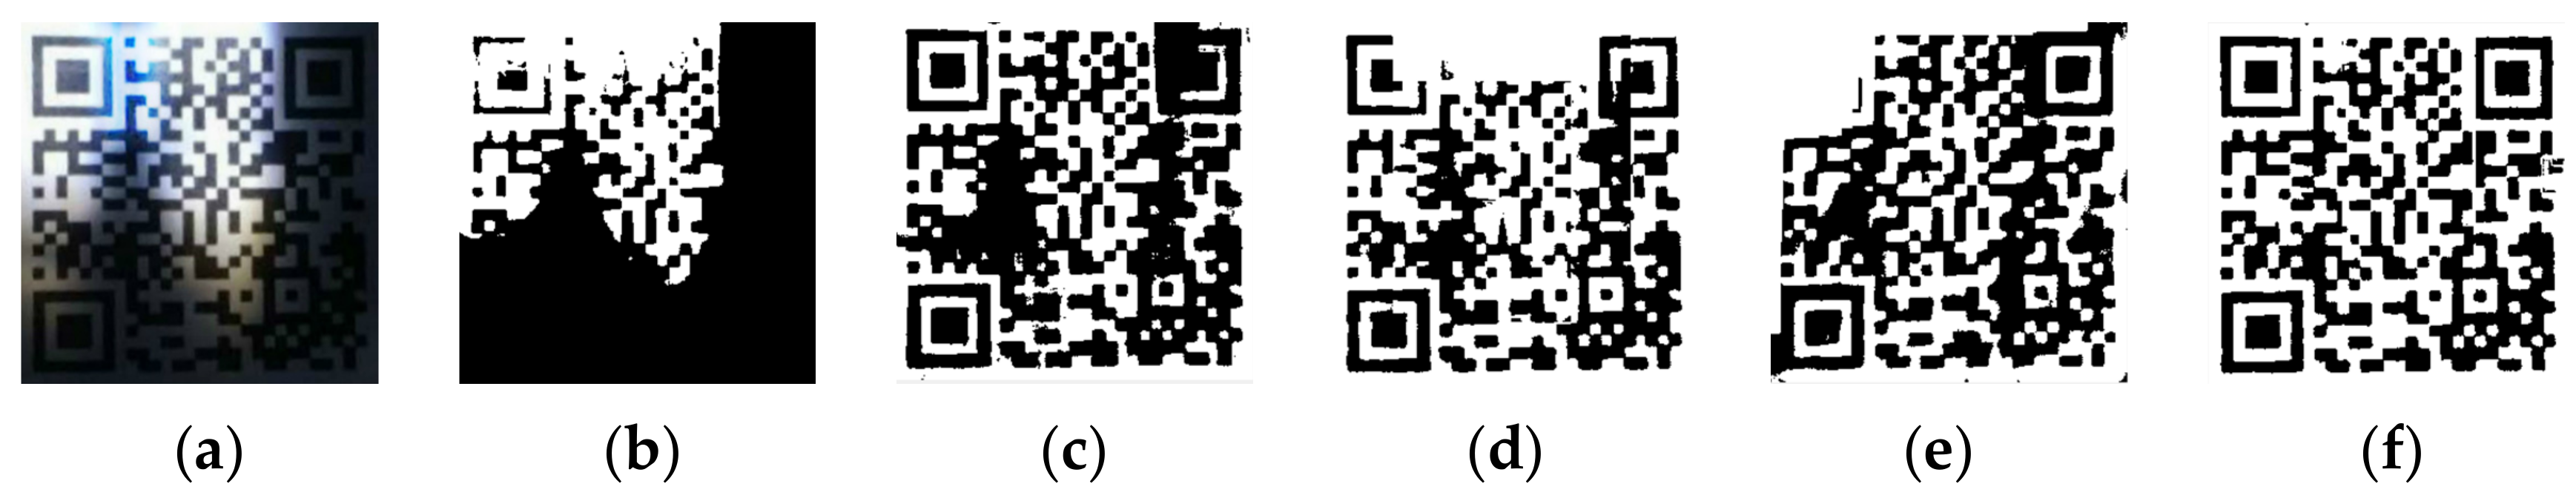
- The effect of different algorithms in dealing with uneven QR codes with strong light spots is shown in Figure 12. The local light intensity is too loud when the image is collected, and the acquisition device has a focus on this area, which has led to this kind of phenomenon of uneven illumination.
- (4)
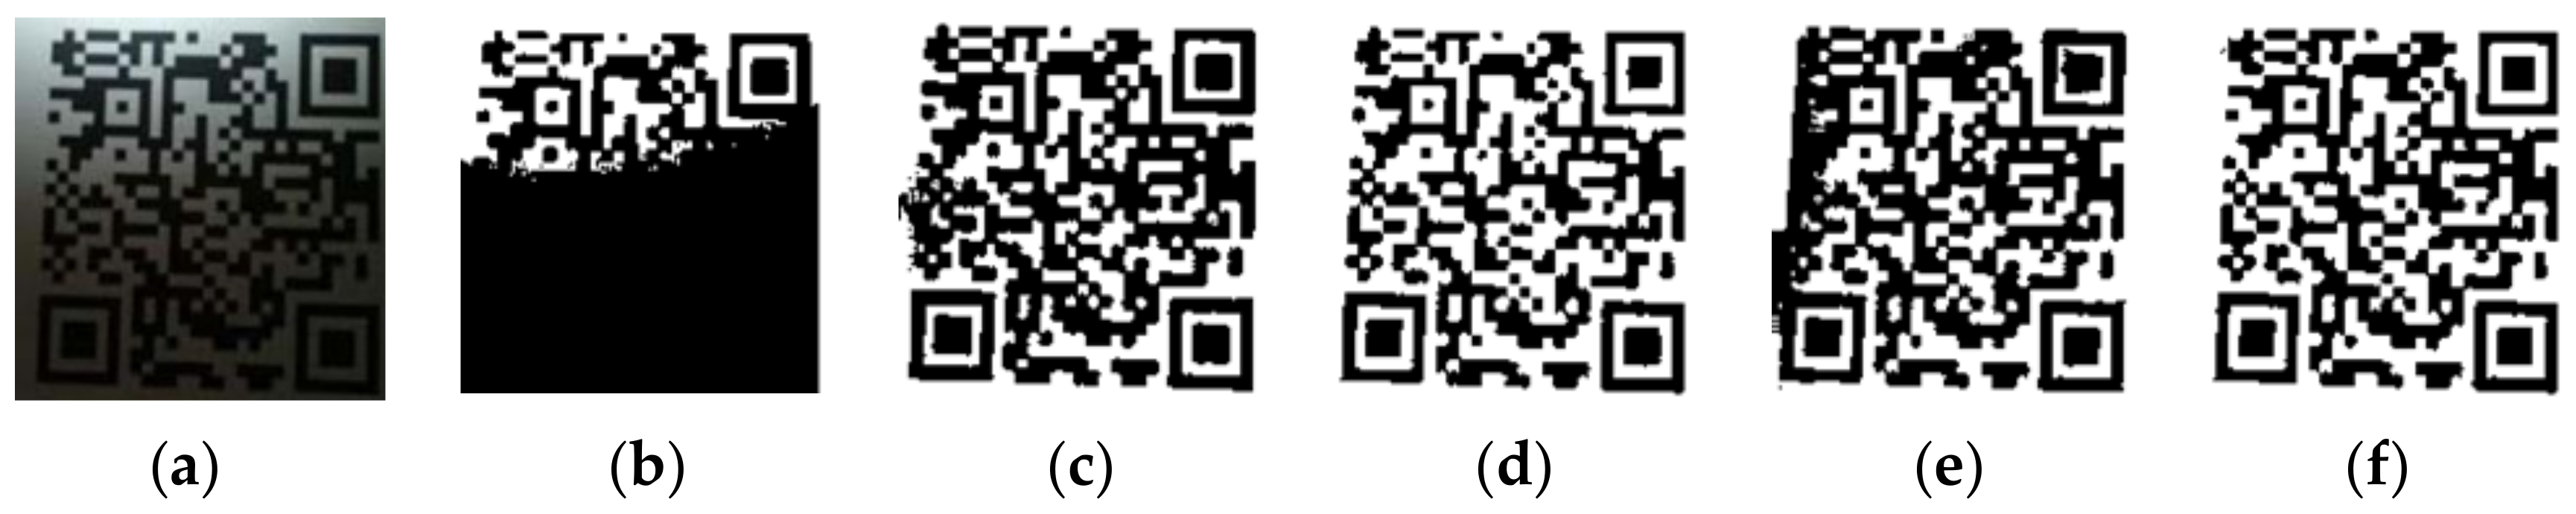
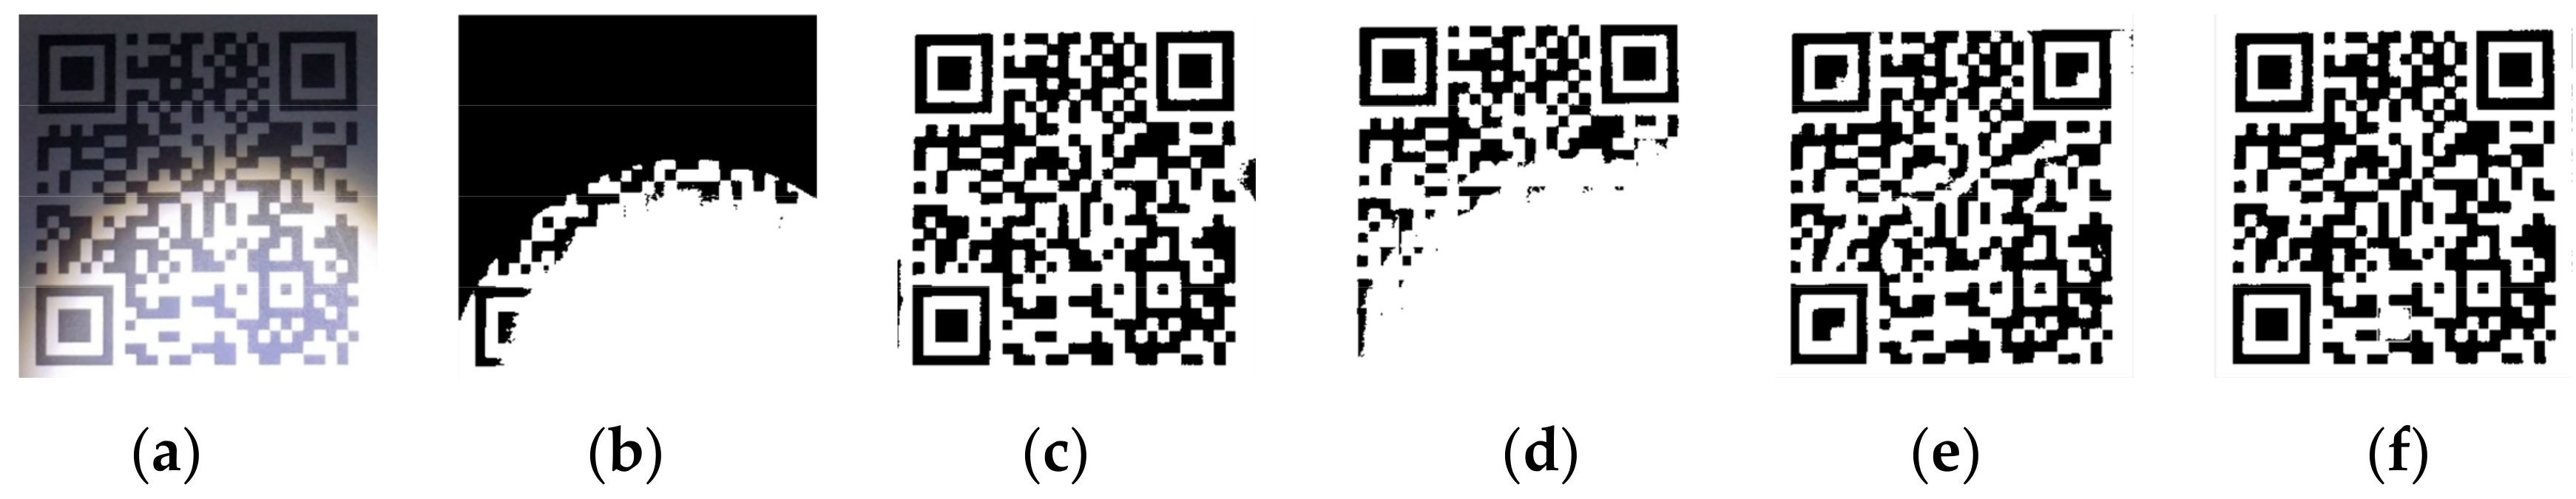
- The effect of different algorithms to deal with the uneven illumination of the QR code with higher overall contrast is shown in Figure 13. The cause of uneven illumination is that the image is obscured, which results in partial shadows on the image.
- (5)
- The effect of different algorithms to deal with the uneven illumination of the QR code with lower local contrast is shown in Figure 14. This phenomenon occurs when the local illumination is too intense.
5. Conclusions
Author Contributions
Funding
Acknowledgments
Conflicts of Interest
References
- Yao, L.; Sheng, Q.Z.; Dustdar, S. Web-based management of the internet of things. IEEE Internet Comput. 2015, 19, 60–67. [Google Scholar] [CrossRef]
- Li, D.X.; He, W.; Li, S. Internet of things in industries: A survey. IEEE Trans. Ind. Inform. 2014, 10, 2233–2243. [Google Scholar]
- Raja, S.; Rajkumar, T.D.; Raj, V.P. Internet of things: Challenges, issues and applications. J. Circuits Syst. Comput. 2018, 27, 1830007. [Google Scholar] [CrossRef]
- Miorandi, D.; Sicari, S.; De Pellegrini, F.; Chlamtac, I. Internet of things: Vision, applications and research challenges. Ad hoc Netw. 2012, 10, 1497–1516. [Google Scholar] [CrossRef]
- McCullouch, B.G.; Lueprasert, K. 2D bar-code applications in construction. J. Constr. Eng. Manag. 1994, 120, 739–752. [Google Scholar] [CrossRef]
- Soon, T.J. QR code. Synth. J. 2008, 2008, 59–78. [Google Scholar]
- Park, J.H.; Park, J.H.; Lee, B.H. RFID application system for postal logistics. In Proceedings of the PICMET′07—2007 Portland International Conference on Management of Engineering & Technology, Portland, OR, USA, 5–9 August 2007; pp. 2345–2352. [Google Scholar]
- Di, Y.J.; Shi, J.P.; Mao, G.Y. A QR code identification technology in package auto-sorting system. Mod. Phys. Lett. B 2017, 31, 19–21, 1740035. [Google Scholar] [CrossRef]
- Yao, S.; Li, P.; He, L.; Li, Y. Uneven Illumination Two-Dimensional Code Image Recognition Algorithm Research. In Proceedings of the 2018 2nd IEEE Advanced Information Management, Communicates, Electronic and Automation Control Conference (IMCEC), Xi’an, China, 23 March 2018; pp. 2043–2046. [Google Scholar]
- Duan, Z.; Zhang, Y.; Li, S. Binarization of Nonuniform Illumination Barcode. In Proceedings of the International Conference on Machine Vision and Applications, Singapore, 23–25 April 2018; pp. 18–21. [Google Scholar]
- Wu, Y.; Yu, S.; Yang, M. Quick Response Code Binary Research Based on Basic Image Processing. Sens. Mater. 2019, 31, 859–871. [Google Scholar] [CrossRef]
- Yang, L.; Feng, Q. The Improvement of Bernsen Binarization Algorithm for QR Code Image. Proceeding of the 2018 5th IEEE International Conference on Cloud Computing and Intelligence Systems (CCIS), Nanjing, China, 23–25 November 2018; pp. 931–934. [Google Scholar]
- Kim, H.; Lee, J.; Ahn, E.; Cho, S.; Shin, M.; Sim, S.H. Concrete crack identification using a UAV incorporating hybrid image processing. Sensors 2017, 17, 2052. [Google Scholar] [CrossRef]
- Weszka, J.S. A survey of threshold selection techniques. Comput. Graph. Image Process. 1978, 7, 259–265. [Google Scholar] [CrossRef]
- Otsu, N. A threshold selection method from gray-level histograms. IEEE Trans. Syst. Man Cybern. 1979, 9, 62–66. [Google Scholar] [CrossRef]
- Niblack, W. An Introduction to Digital Image Processing; Strandberg Publishing Company: Birkeroed, Denmark, 1985. [Google Scholar]
- Hadjadj, Z.; Meziane, A.; Cherfa, Y.; Cheriet, M.; Setitra, I. ISauvola: Improved Sauvola’s algorithm for document image binarization. In Proceedings of the International Conference on Image Analysis and Recognition, Póvoa de Varzim, Portugal, 13–15 July 2016; pp. 737–745. [Google Scholar]
- Mustafa, W.A.; Yazid, H.; Jaafar, M. An improved sauvola approach on document images binarization. J. Telecommun. Electron. Comput. Eng. 2018, 10, 43–50. [Google Scholar]
- Saddami, K.; Munadi, K.; Away, Y.; Arnia, F.J.H. Effective and fast binarization method for combined degradation on ancient documents. Heliyon 2019, 5, e02613. [Google Scholar] [CrossRef] [PubMed]
- Lu, D.; Huang, X.; Sui, L. Binarization of degraded document images based on contrast enhancement. Int. J. Doc. Anal. Recognit. 2018, 21, 123–135. [Google Scholar] [CrossRef]
- Adhikari, G.; Mukherjee, R.; Dasgupta, T. A Local Adaptive Region-Wise Histogram Correction and Thresholding Technique for Very Poorly Illuminated Images. In Proceedings of the 2018 International Conference on Wireless Communications, Signal Processing and Networking (WiSPNET), Chennai, India, 22–24 March 2018; pp. 1–5. [Google Scholar]
- Bhabatosh, C. Digital image processing and analysis, 2nd ed.; PHI Learning Pvt. Ltd: Kolkata, India, 2011. [Google Scholar]
- Gonzalez, R.C.; Woods, R.E. Digital Image Processing, 4th ed.; Pearson Education Ltd: New York, NY, USA, 2018. [Google Scholar]
- Tong, Y.; Zhang, Q.; QI, Y. Image quality assessing by combining PSNR with SSIM. J. Image Graph. 2006, 12, 1758–1763. [Google Scholar]
- Wang, Z.; Simoncelli, E.P.; Bovik, A.C. Multiscale structural similarity for image quality assessment. In Proceedings of the Thrity-Seventh Asilomar Conference on Signals, Systems & Computers, Pacific Grove, CA, USA, 9–12 November 2003; pp. 1398–1402. [Google Scholar]


| Hardware | Parameters |
|---|---|
| Computer | CPU: Intel (R) Core i7-8700 3.2GHz OS: Window10 Education Edition Display: HP V220 Resolution: dpi |
| Mobile phone | Model: Xiaomi 6 Rear camera pixel: 12 million |
| Laser printer | Model: HP M226dw Printed resolution: dpi |
| Software | Version | Language |
|---|---|---|
| MATLAB | R2018a | Simplified Chinese |
| ZXing AndroidSDK | Zxing-3.1.0.jar | |
| Vesion7.0.4 | Simplified Chinese |
| Materials | Parameters |
|---|---|
| Captured images | Type: QR code Format: jpg Bits: 24 |
| Printed paper, Toner | 80g/m2 A4 Paper, NT-C0388CT |
| Type | Image Quality | Otsu’s Algorithm | Niblack’s Algorithm | Yao’s Algorithm | Di’s Algorithm | Proposed Method |
|---|---|---|---|---|---|---|
| (1) | 4.7978 | 4.8562 | 5.2366 | 5.5307 | 5.6547 | |
| 0.0413 | 0.0406 | 0.0982 | 0.1478 | 0.1604 | ||
| (2) | 3.4180 | 3.7501 | 4.1174 | 4.0594 | 4.1494 | |
| 0.0474 | 0.0509 | 0.1157 | 0.1082 | 0.1204 | ||
| (3) | 3.4005 | 5.9200 | 5.4138 | 5.2435 | 6.8823 | |
| 0.1404 | 0.2076 | 0.2923 | 0.2025 | 0.2959 | ||
| (4) | 4.1827 | 5.9107 | 6.6141 | 6.0277 | 7.2117 | |
| 0.2194 | 0.2539 | 0.2959 | 0.2807 | 0.3172 | ||
| (5) | 3.4994 | 5.1656 | 4.1776 | 5.1406 | 5.4483 | |
| 0.1263 | 0.1809 | 0.1447 | 0.1636 | 0.2022 |
| Algorithm | Average Operation Time/s | Recognition Rate | |
|---|---|---|---|
| Zxing | |||
| None | —— | 35% | 48.75% |
| Otsu’s algorithm | 0.0013 | 32.5% | 32.5% |
| Niblack’s algorithm | 1.6063 | 38.75% | 86.25% |
| Yao’s algorithm | 0.0046 | 37.5% | 42.5% |
| Di’s algorithm | 0.3516 | 53.75% | 71.25% |
| Proposed method | 0.0428 | 88.75% | 92.5% |
© 2019 by the authors. Licensee MDPI, Basel, Switzerland. This article is an open access article distributed under the terms and conditions of the Creative Commons Attribution (CC BY) license (http://creativecommons.org/licenses/by/4.0/).
Share and Cite
Chen, R.; Yu, Y.; Xu, X.; Wang, L.; Zhao, H.; Tan, H.-Z. Adaptive Binarization of QR Code Images for Fast Automatic Sorting in Warehouse Systems. Sensors 2019, 19, 5466. https://doi.org/10.3390/s19245466
Chen R, Yu Y, Xu X, Wang L, Zhao H, Tan H-Z. Adaptive Binarization of QR Code Images for Fast Automatic Sorting in Warehouse Systems. Sensors. 2019; 19(24):5466. https://doi.org/10.3390/s19245466
Chicago/Turabian StyleChen, Rongjun, Yongxing Yu, Xiansheng Xu, Leijun Wang, Huimin Zhao, and Hong-Zhou Tan. 2019. "Adaptive Binarization of QR Code Images for Fast Automatic Sorting in Warehouse Systems" Sensors 19, no. 24: 5466. https://doi.org/10.3390/s19245466
APA StyleChen, R., Yu, Y., Xu, X., Wang, L., Zhao, H., & Tan, H.-Z. (2019). Adaptive Binarization of QR Code Images for Fast Automatic Sorting in Warehouse Systems. Sensors, 19(24), 5466. https://doi.org/10.3390/s19245466