In the following section we present our findings on reducing illumination and viewpoint variance on a challenging, real-world data set. We present (a) benchmark results for models trained on
RGB data
Section 3.1, (b) model results using the
CIELab colour space, (c) model performance with early fusion of both colour spaces, (d) a evaluation of viewpoint (spatial) invariance between the three trained models describing a level of generalisation between unobserved views that alter the spatial appearance (shape, texture and colour of the class), and finally (e) a comparison to the Deep Fruits system [
8] which similarly attempted to maximise illumination invariance but through multi-spectra fusion. Although we take it further and test our proposed solution on unseen views, Deep Fruits was found to be the closest baseline.
scores and the mean average precision metric used in the ImageNet challenge [
33] are used in this paper to evaluate the experiments. The
score is the harmonic average of precision
P and recall
R where precision is the number of true positives
divided by the sum of true and false positives
, and recall is the number of true positives
divided by the sum of true positives
and false negatives
. The equation to compute the
score using precision and recall is presented in Equation (
4). An object is considered correctly detected in our results when the predicted bounding boxes have a intersection over union (IoU) of at least 0.5 (50%) with the ground truth annotation. However we also provide results using a value of 0.4 (40%) to enable more accurate comparison to the DeepFruits experiments. The justification provided for using the smaller intersection over union threshold in [
8] is that objects in the data set are smaller than in the ImageNet challenge therefore require less overlap. We use values of 0.5 for non maximum suppression.
4.1. Data Acquisition
Sa et al. [
8] note that variation in outdoor agricultural environments affects vision systems greatly and many of the introduced factors such as sunlight and weather are detriment to the performance of machine vision systems. Current computer vision systems are either developed in controlled indoor conditions that avoid real-world constraints or use external equipment to minimise illumination variance in their data sets (see adaptation of data set from [
38] by [
8]). In this paper we present a longitudinal data set recorded in a real working agricultural environments containing RGB, stereo infrared images and point clouds as well as providing camera parameters, localisation and meta data describing capture conditions such as humidity and temperature. This data set was created in order to capture the variance present in natural outdoor conditions.
We captured 6189 images over 2 months, August and September 2018, and manually annotated 150 of them.
Table 2 shows the number of images across each view that we used in the model training and validations (testing) stages. Note the data set used is small, as currently no large fruit data sets exist to the authors knowledge. All the Strawberries were labelled into two classes, Ripe and Unripe. The production site where the data was captured was at the University of Lincoln research farm at Riseholme campus. Two poly tunnels with table top strawberry rows were constructed, one row was tagged with visual markers [
39] to indicate the points along the row where data should be collected, and the subsequent data collection process occurred singularly on this tagged row three times a day three times a week to capture various light intensities, weather conditions and plant growth stages. The species of strawberry was
Amesti, captured at the flowering and fruiting stages of the plant.
The images were captured at
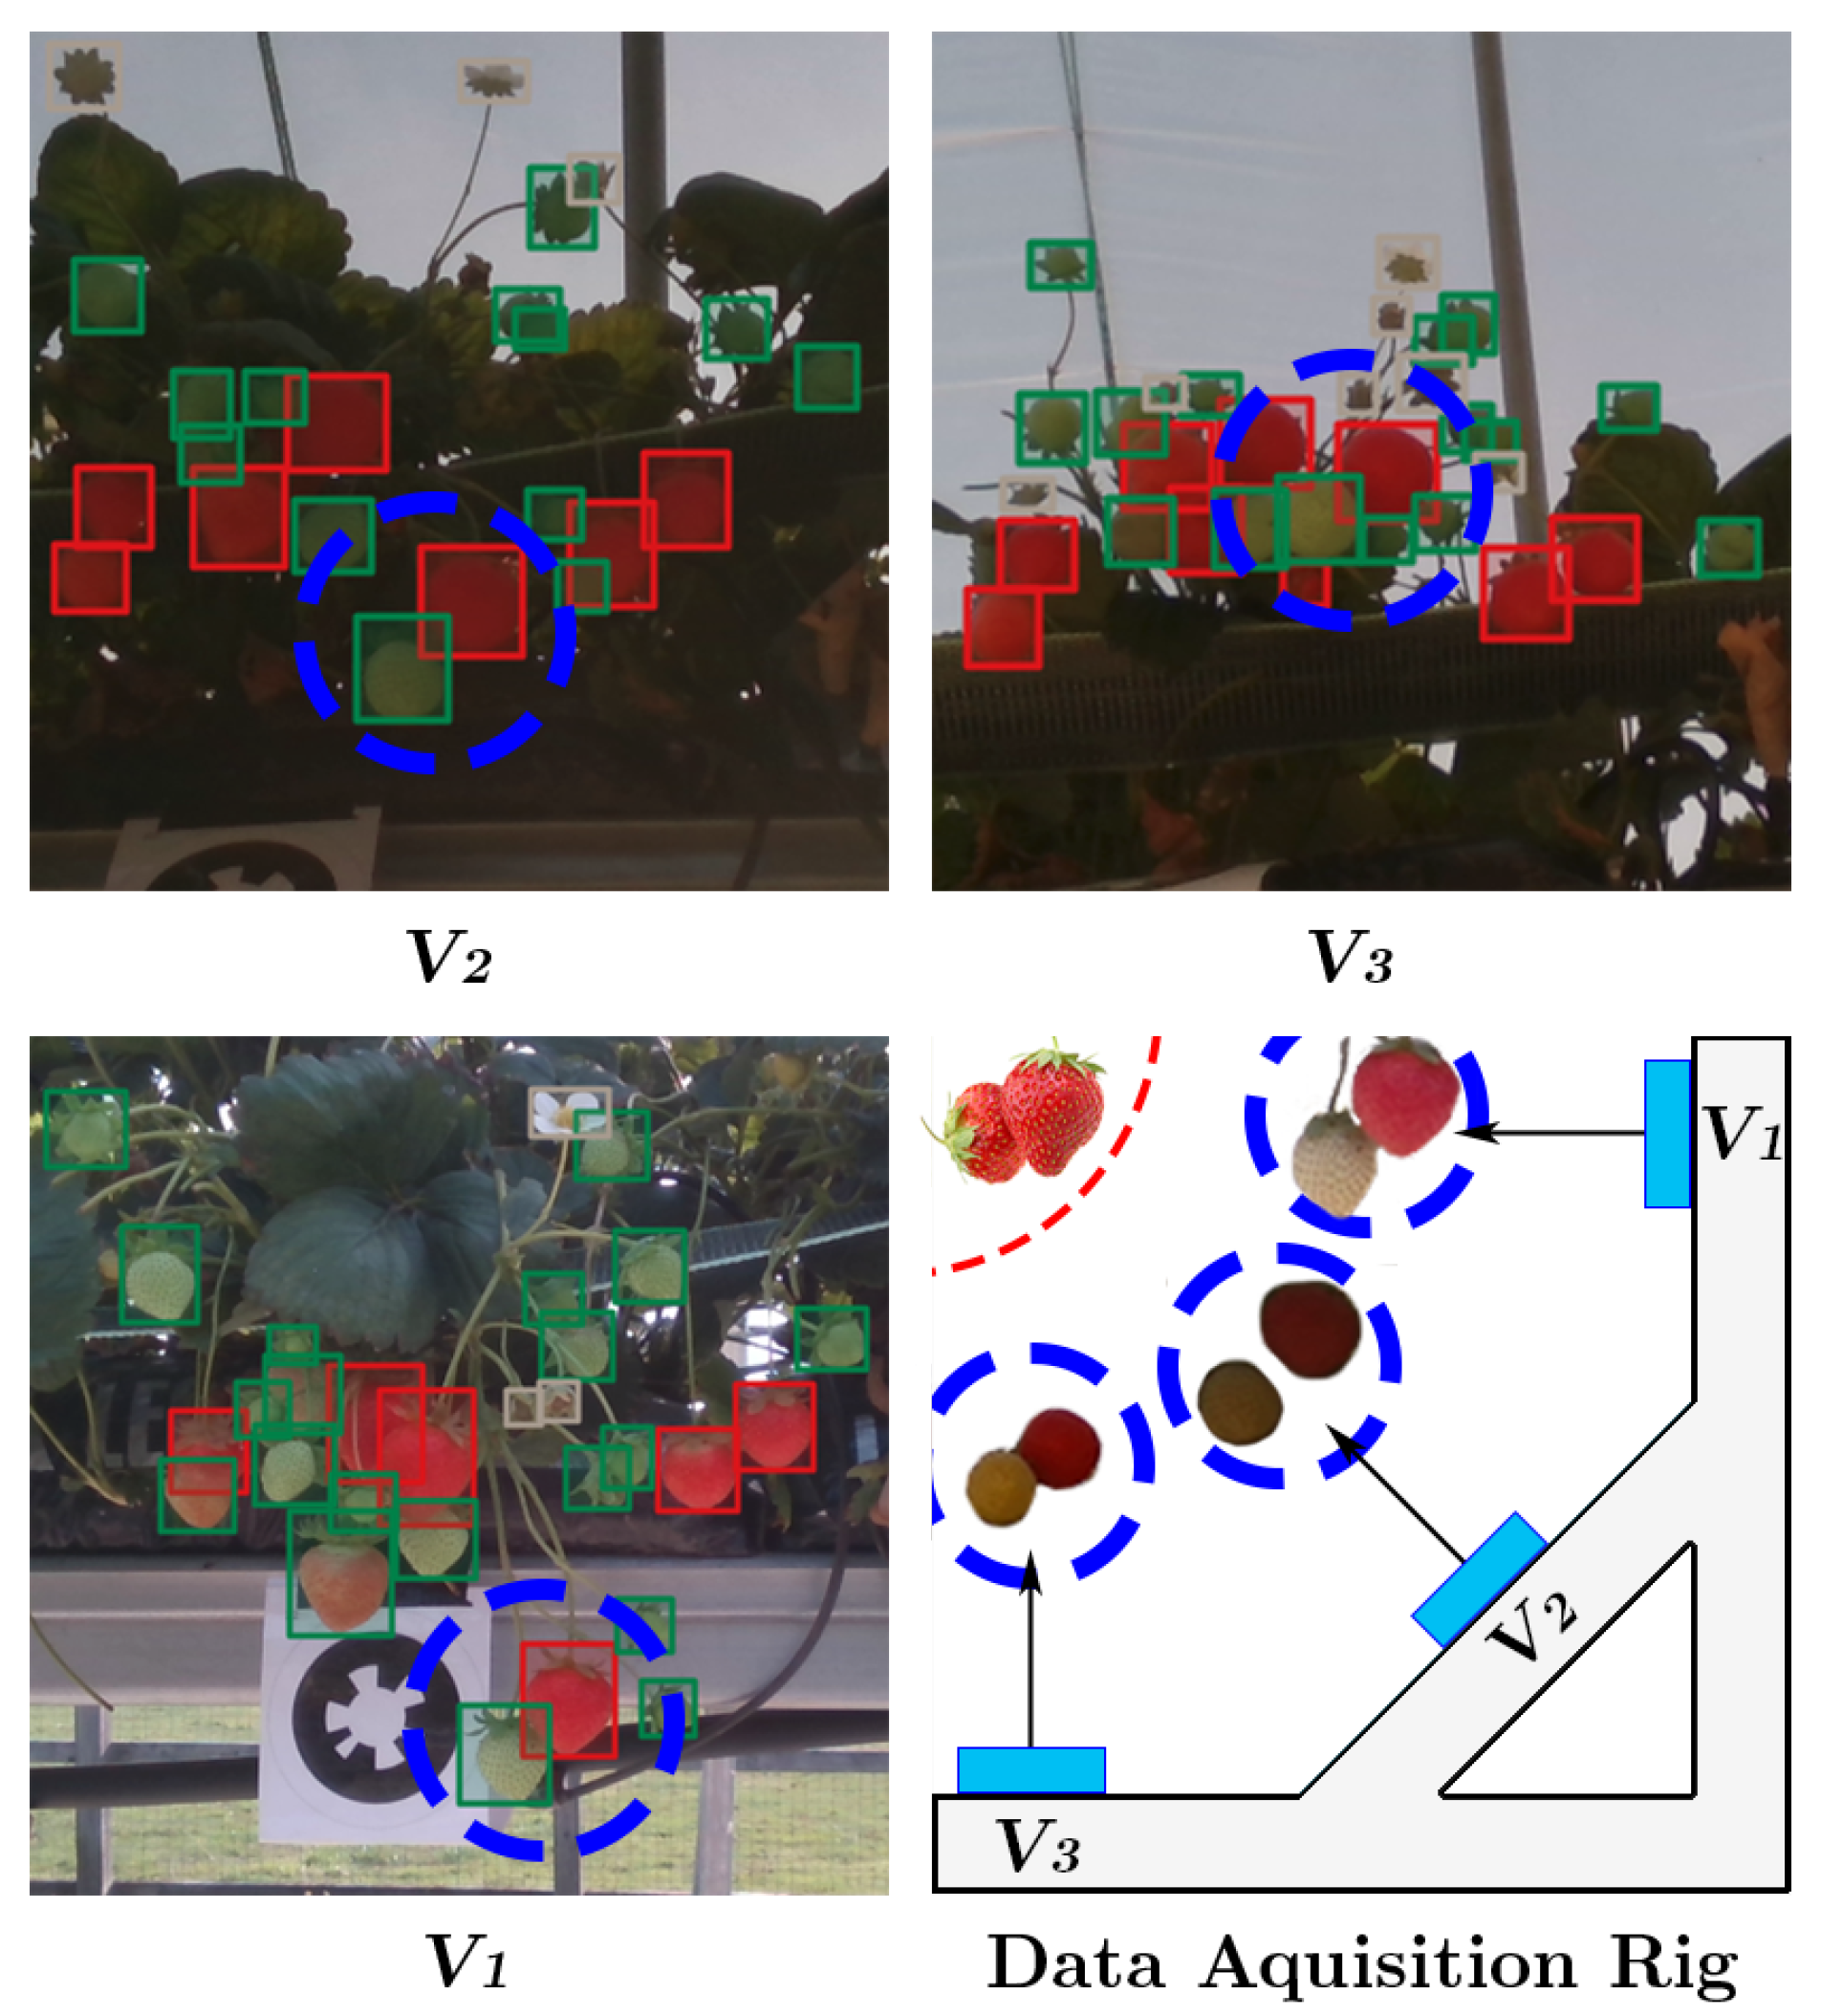
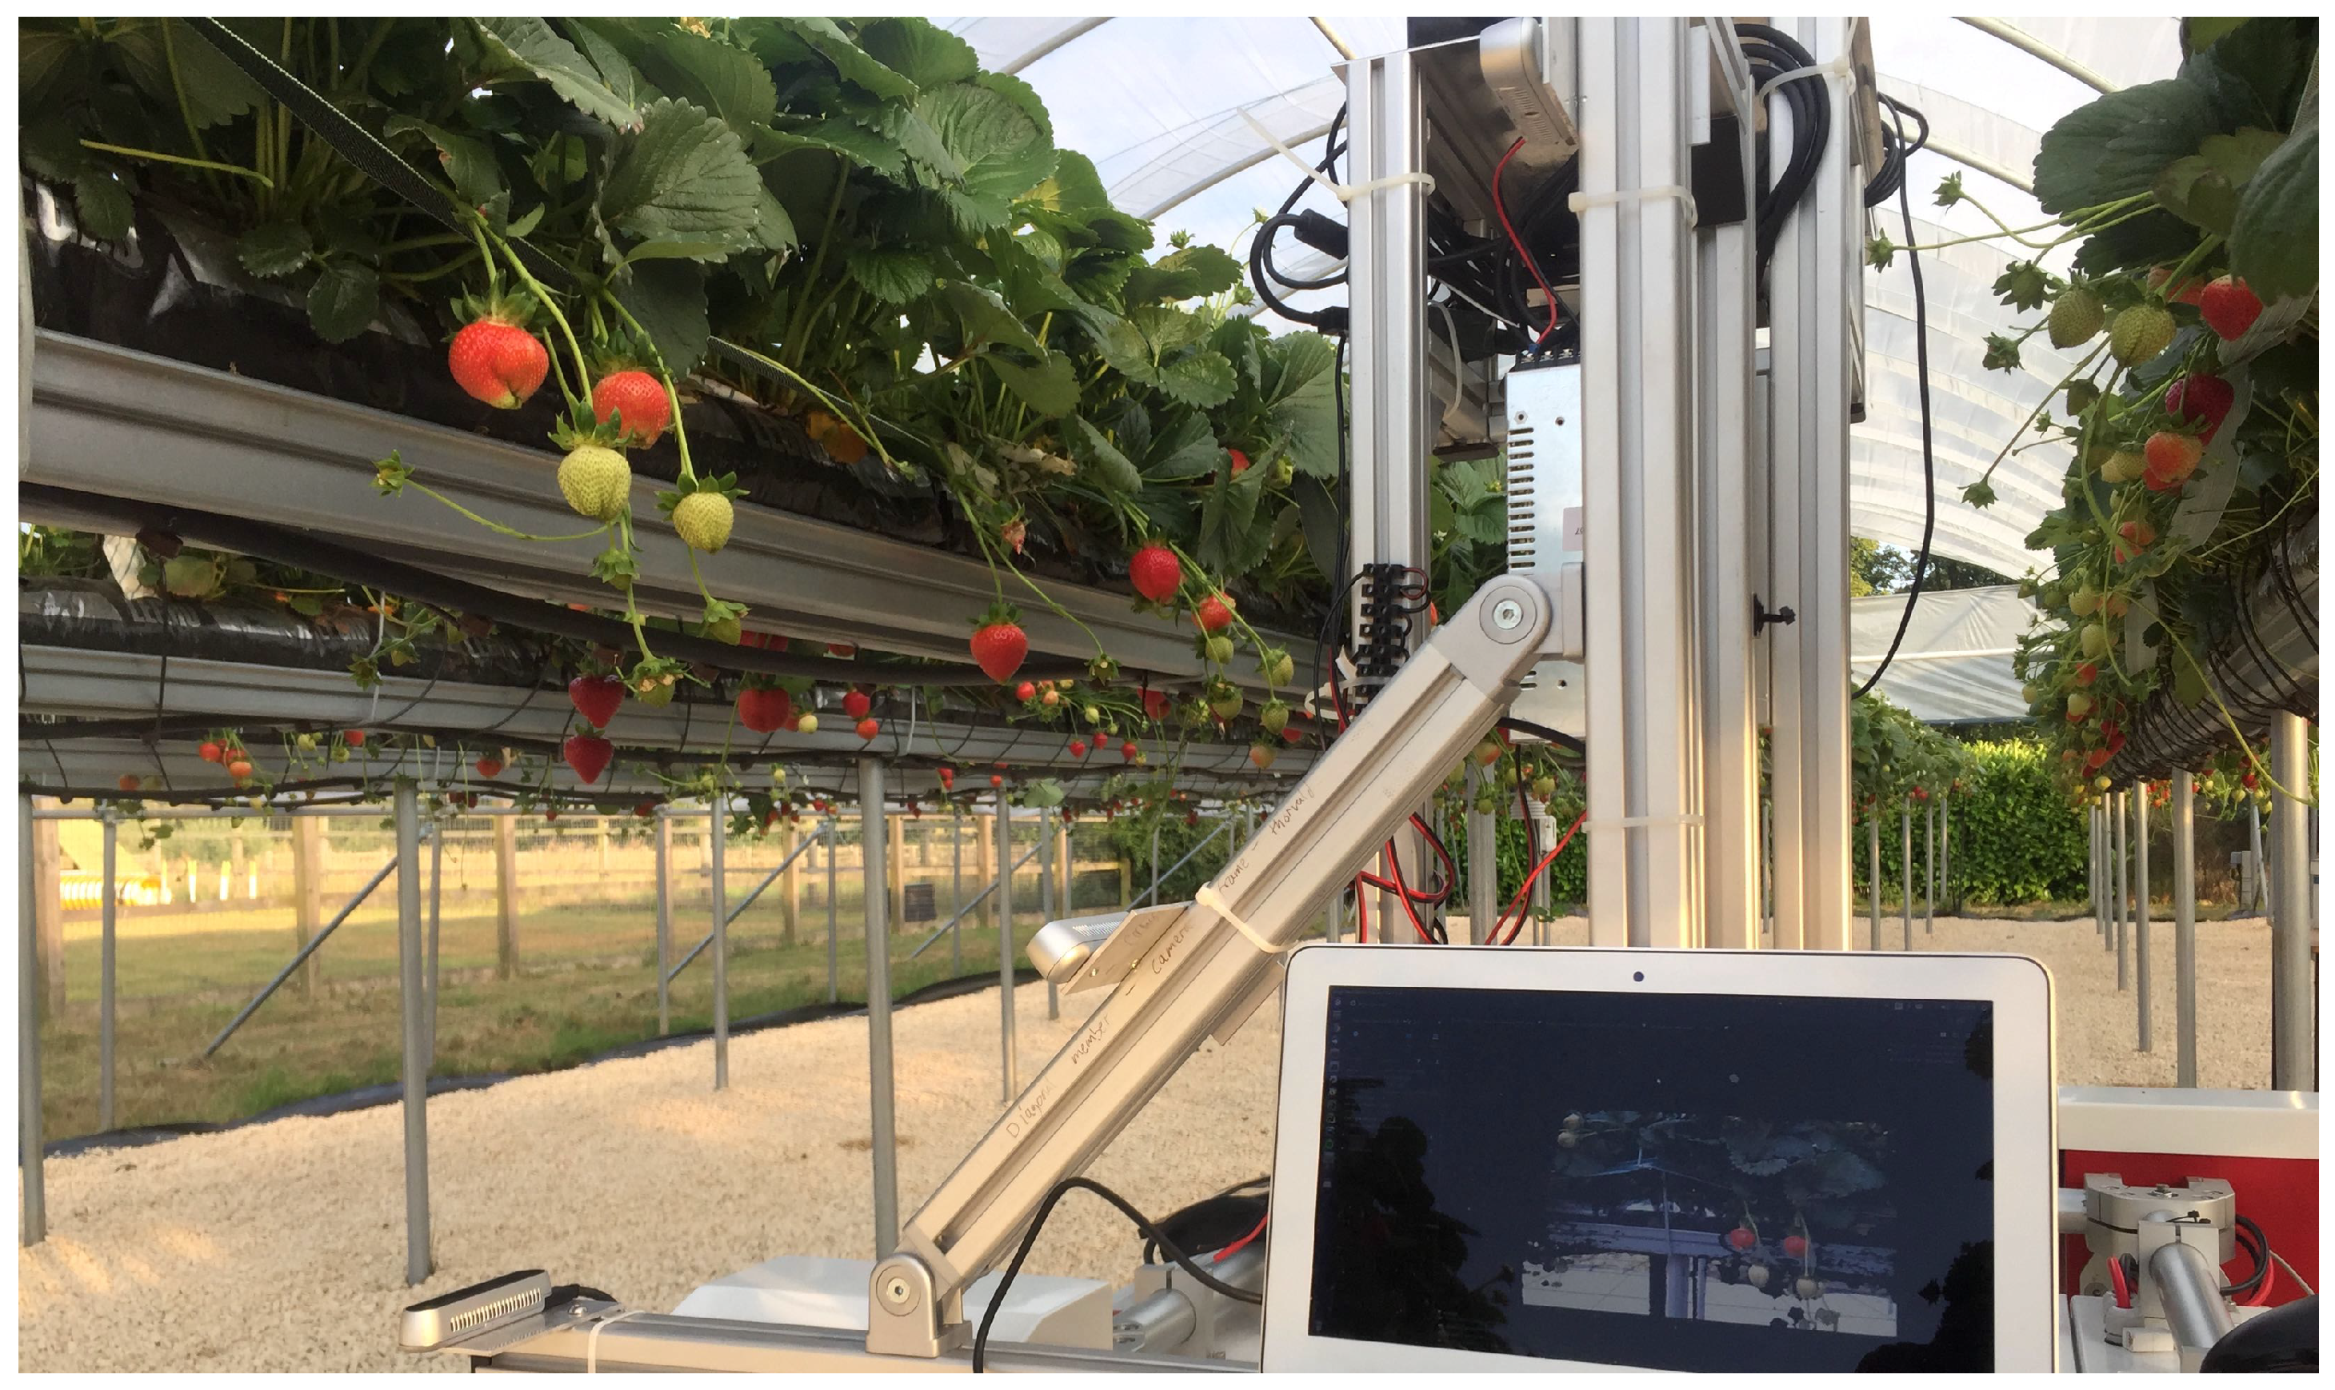
resolution and the network was trained without resizing them. The data acquisition rig is visualised in
Figure 2 and shown in
Figure 5, three cameras were mounted 45 degrees apart to capture as much spatial information from the strawberry crops as possible. The top, middle and bottom cameras will each be referred to as
,
and
respectively from here on in. Capturing at these three distinct points ensured the information captured by each camera would have a good spread of dissimilar semantic information about each class. For example
and
would contain visually very different information for each class, whereas
would share a greater instance information about each class with viewpoints
and
; Shown in
Figure 2. This enabled us to compare the impact viewpoint variance had on model performance. Each class could be trained on a training set that contained information from each viewpoint
, however we exclusively set the experiments up so only
would be used in the model training stage. We did this to simulate the real-world effect of illumination, shape and texture changes introduced by unpredictable viewpoint variations caused by indeterministic environmental effects such as weather and human interaction.
During data collection the acquisition rig was mounted on a modular robotic platform Thorvald [
40] and moved incrementally to each visual marker to ensure consistency between data collection cycles.
The data set presented should be considered a complex data set in the sense it contains classes with heavy occlusion and highly varied illumination. The images were captured over a period of 24 days with a intra-day variance of 11 hours. It contains two classes: Ripe Strawberry and Unripe Strawberry with uneven distribution as shown in
Table 3. The difficulty of the data set is reflected in the quantitative assessment later in this paper. The data set will be made publicly available, in order to support key advances in this research area.
4.2. RGB and Early Fusion Comparison
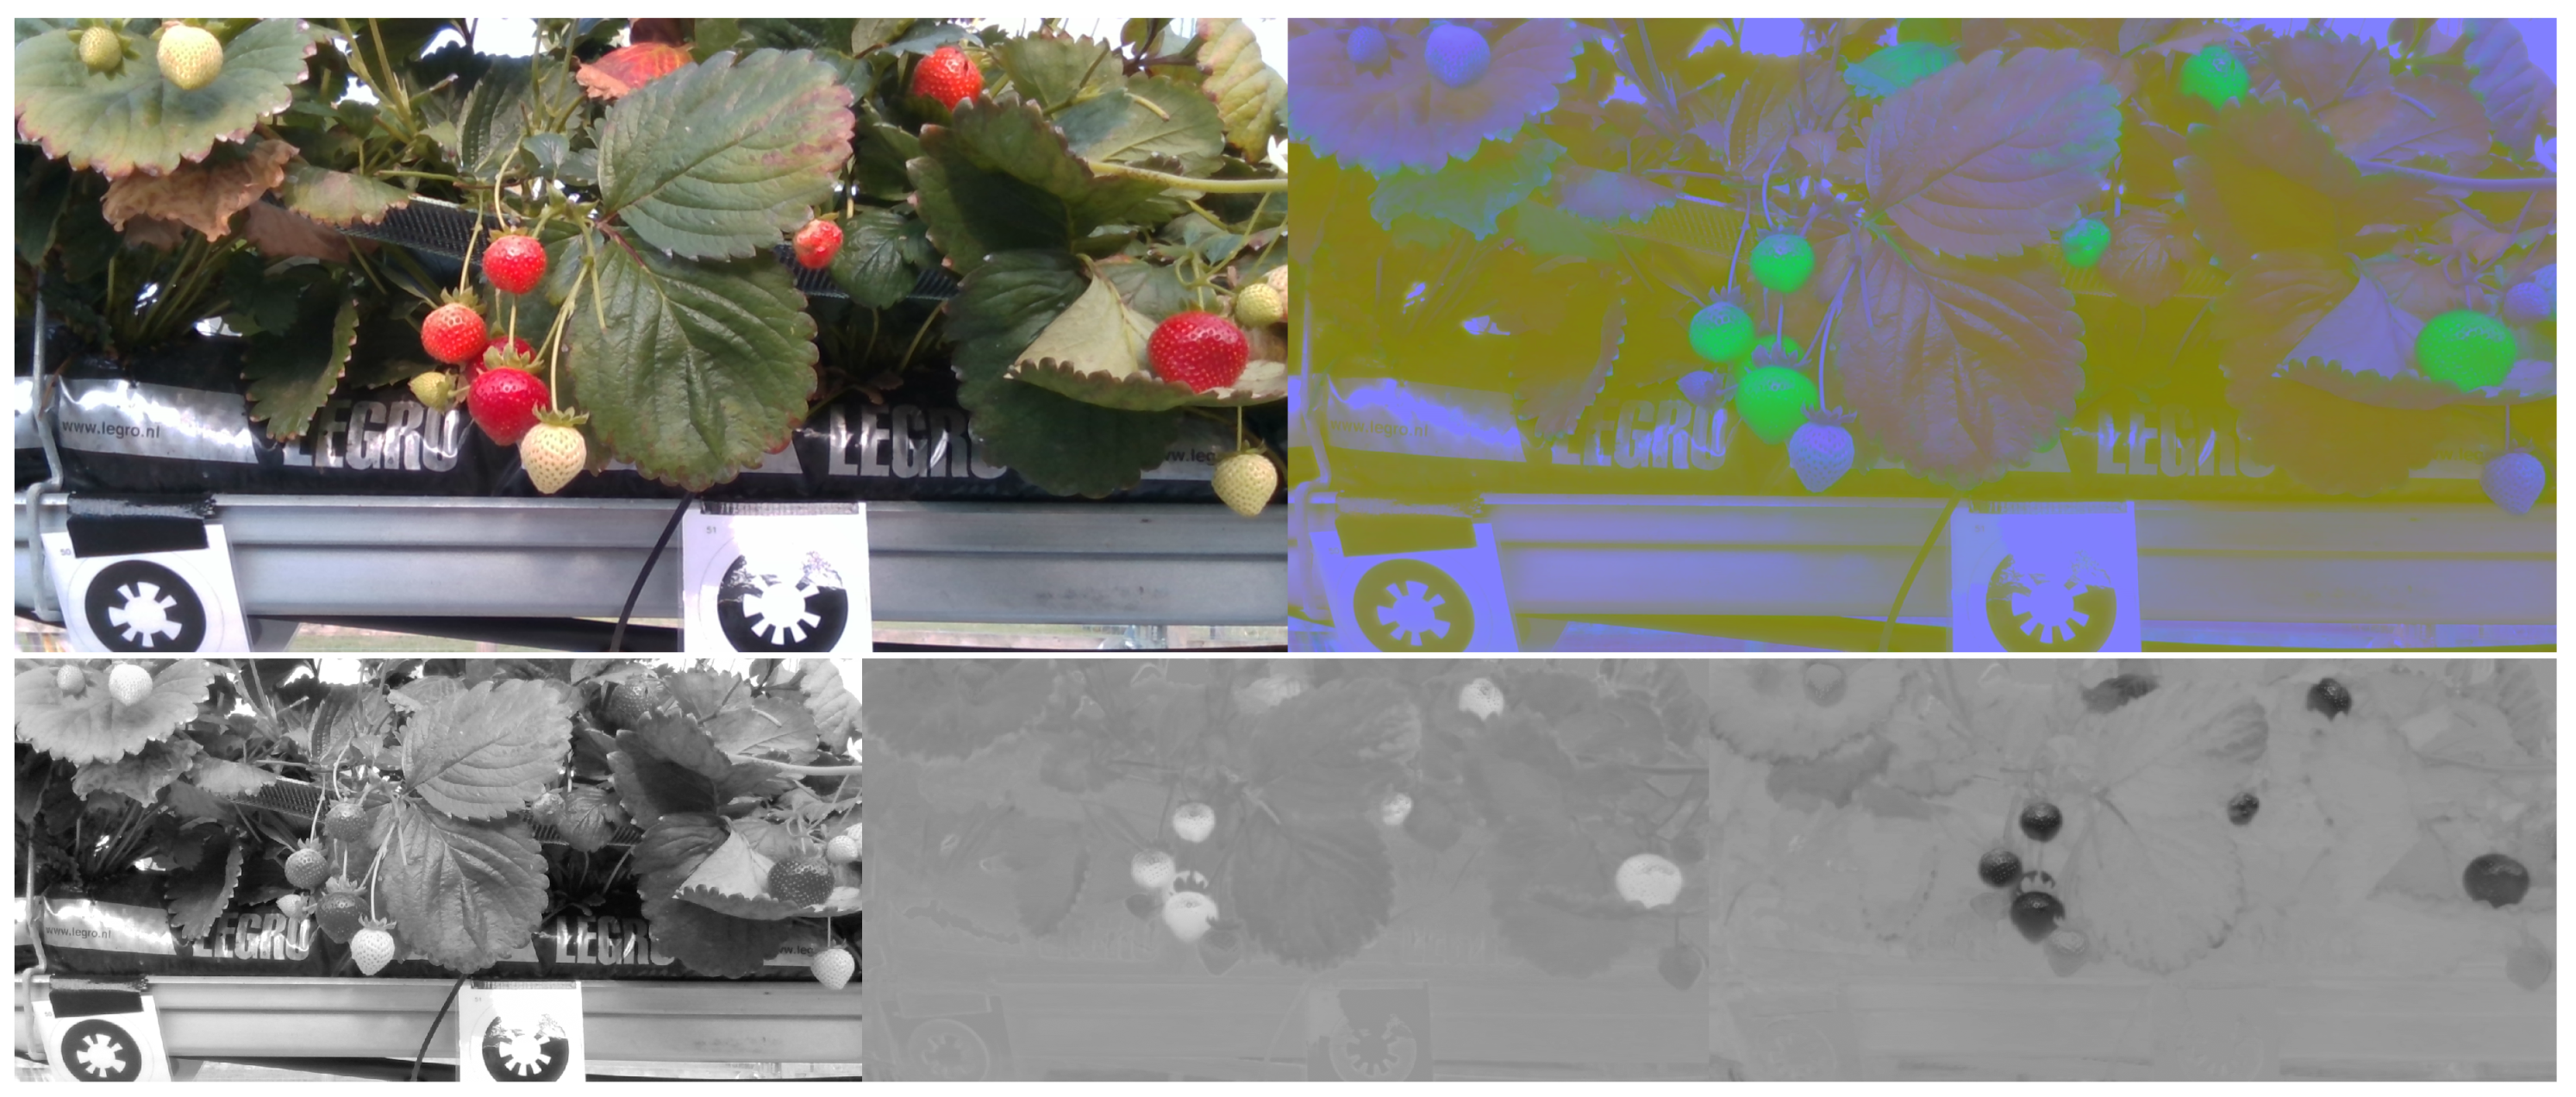
In order to determine the effect of perceptually uniform colour spaces on viewpoint invariance we conducted three different experiments. The original motivation of this approach is that error due to variation in luminance of each class described in
Section 4.1 would be minimised. To test this the
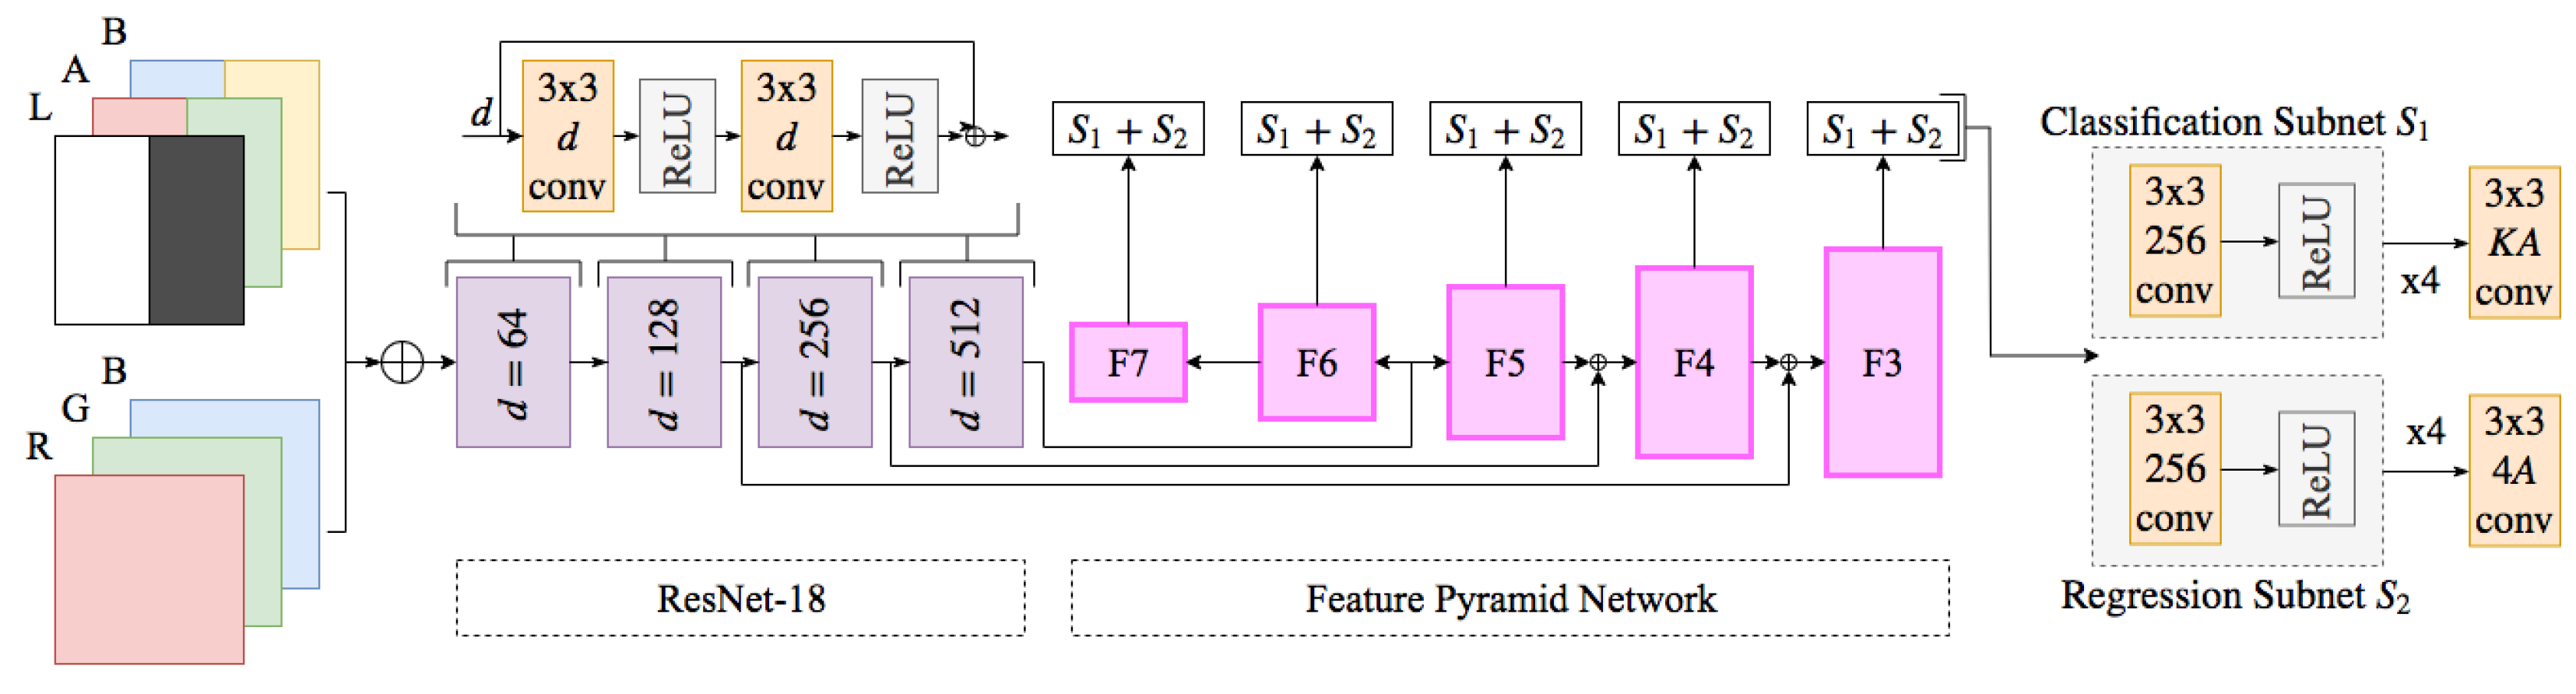
CIELab colour space was used in order to capture the colour feature components present in the image more uniformly and thus fortify the features learnt in the network. We utilise an early fusion method, introduced in [
8]. A late fusion method that combined two separate models was also proposed but we determined that doubling the number of parameters present in the network, computation time and GPU utilisation was an insufficient method to deal with luminance for reaching greater viewpoint performance.
As shown in
Table 4 in terms of
the early fusion approach outperforms both
RGB and
CIELab by 2.4% and 8.2% respectively on
. On the unseen viewpoints the
score is lower as was expected since no images from either of these orientations was included in the training data set. The early fusion
score for
is 4.3% less than the result on the singular view
, the small difference in scores compared to the 6.4% and 8.8% drop for
RGB and
CIELab show that this approach can better generalise to unseen views of the each of the classes.
It can be seen in both
Table 4 and
Figure 6 that
RGB and
CIELab are both consistently outperformed by the early fusion method, while the fusion of these two features shows a great improvement over a singular approach alone. It’s also evident from this table that the lesser opponent class “Unripe Strawberry” has higher performance in
RGB space however is still beaten by early fusion when on unseen views. The early fusion approach demonstrates greater invariance to luminance and achieves excellent results on previously unseen views described in
Figure 2.
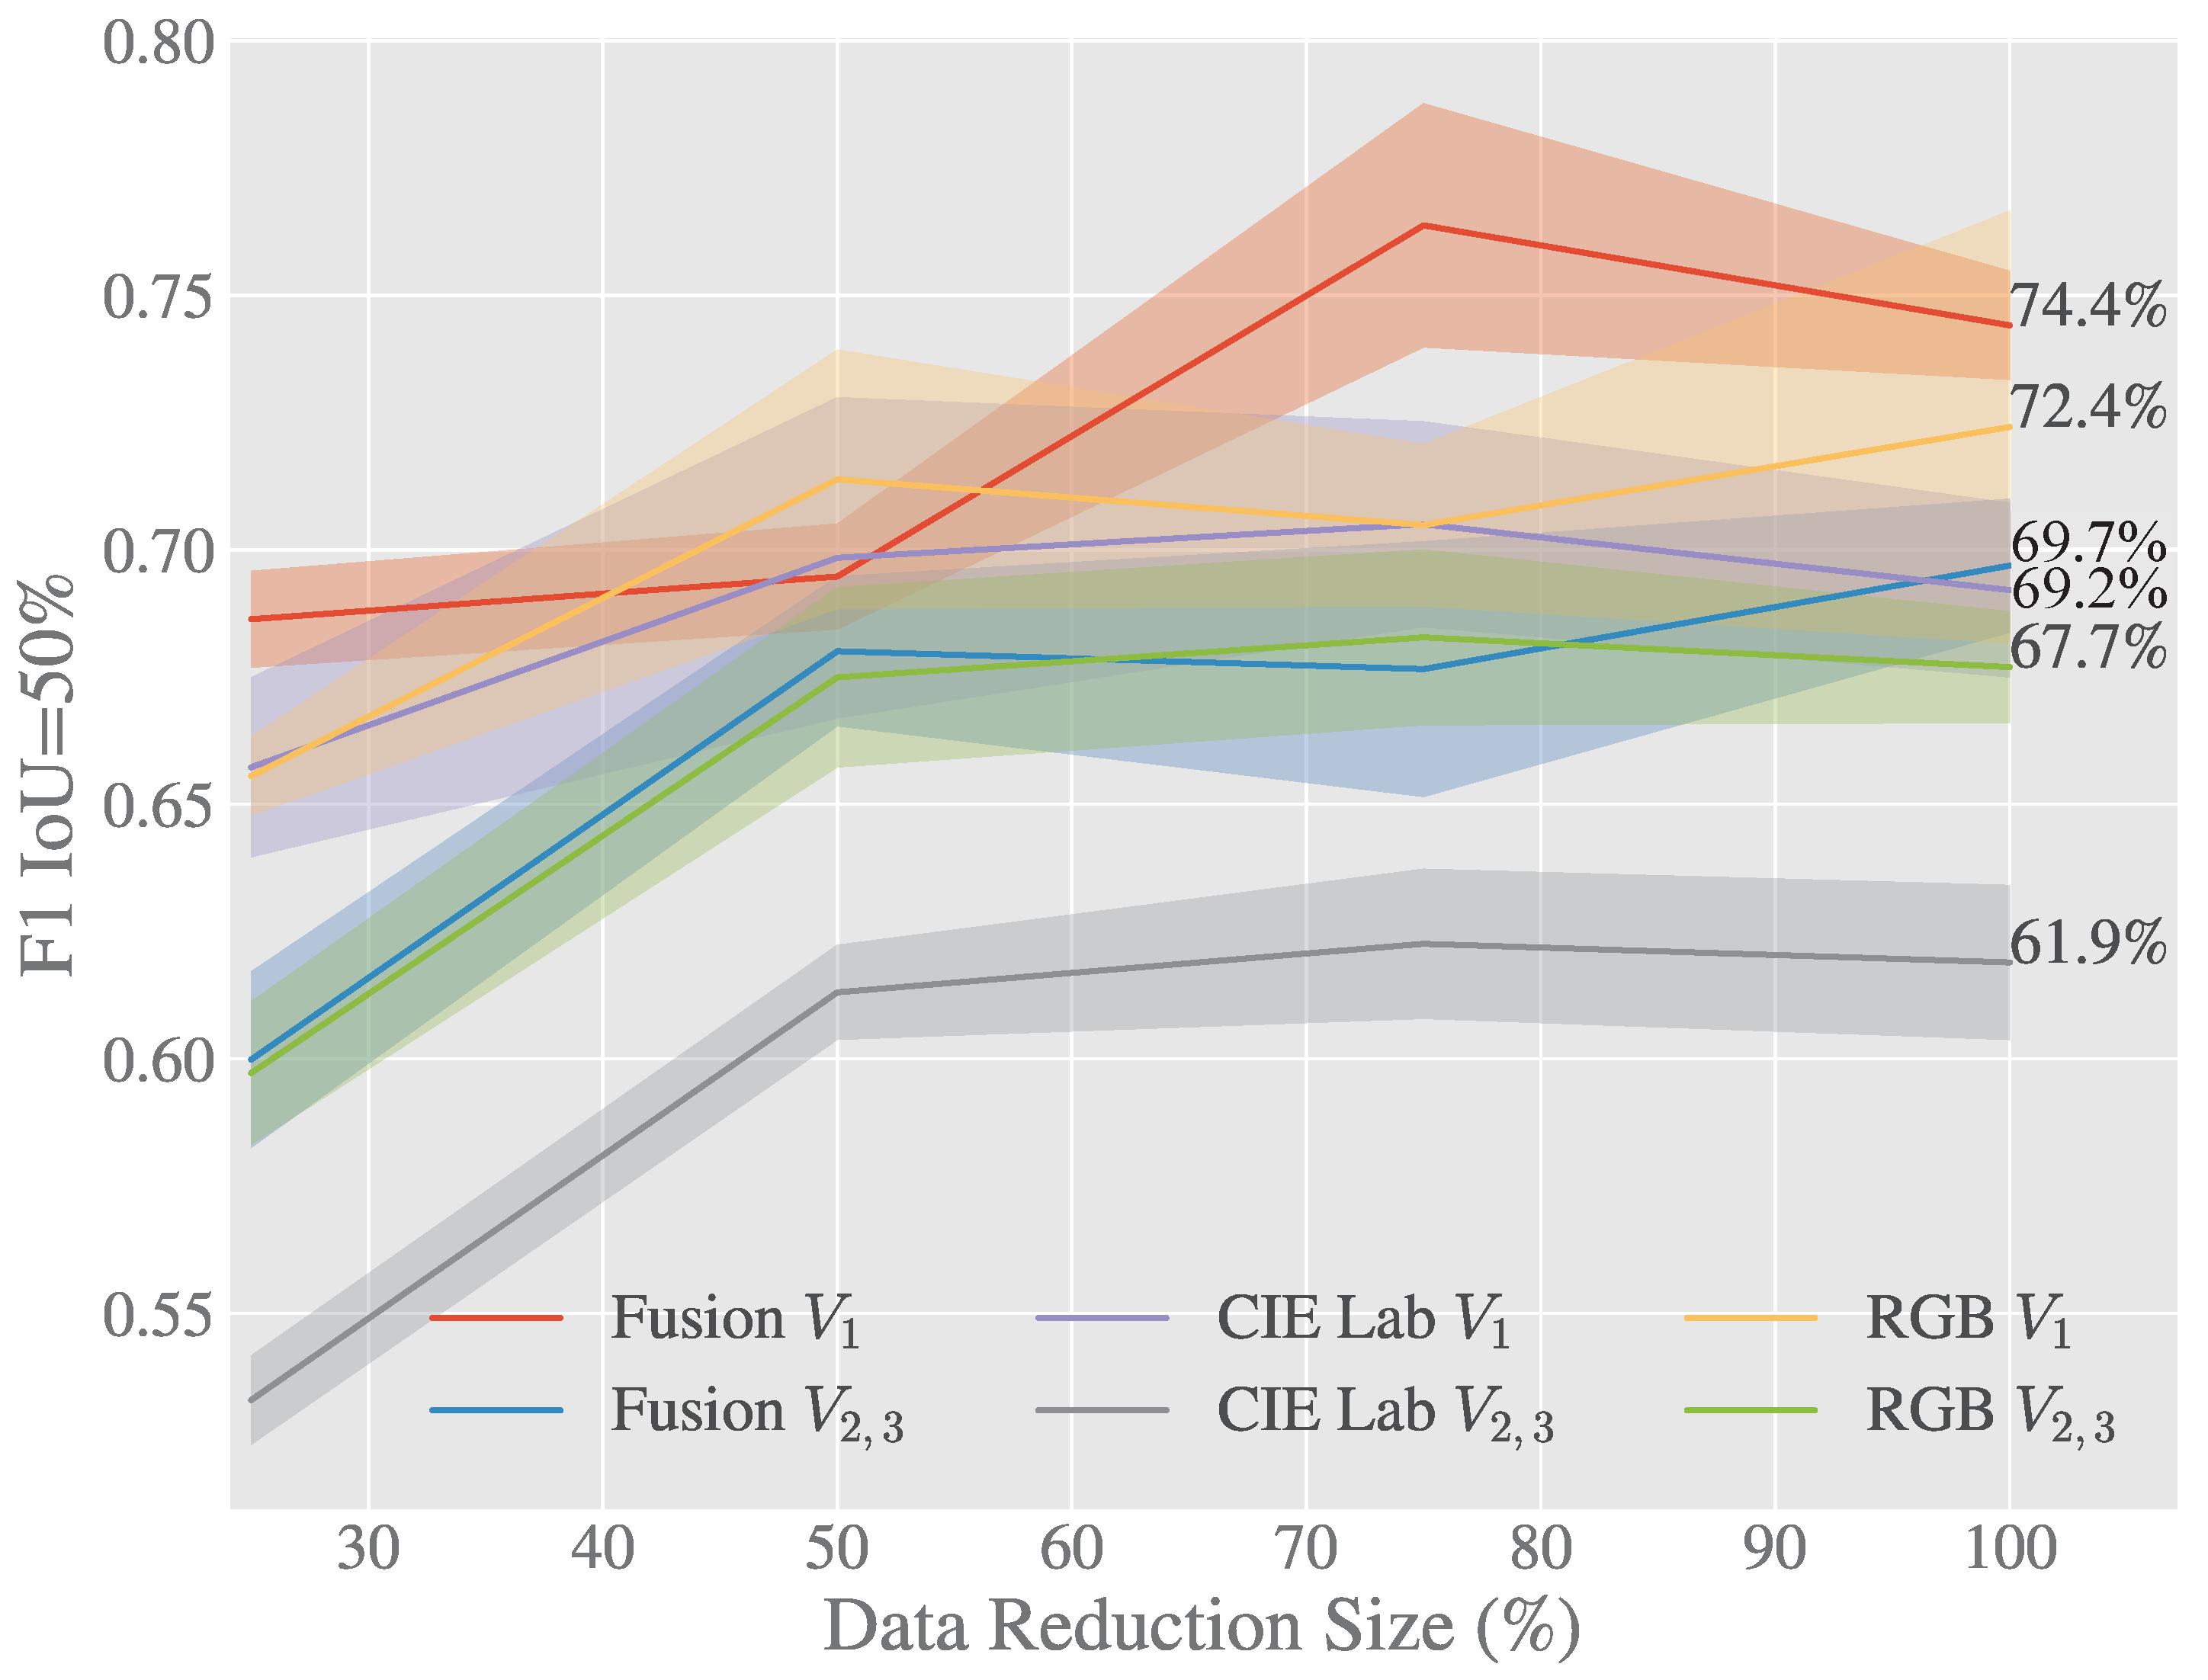
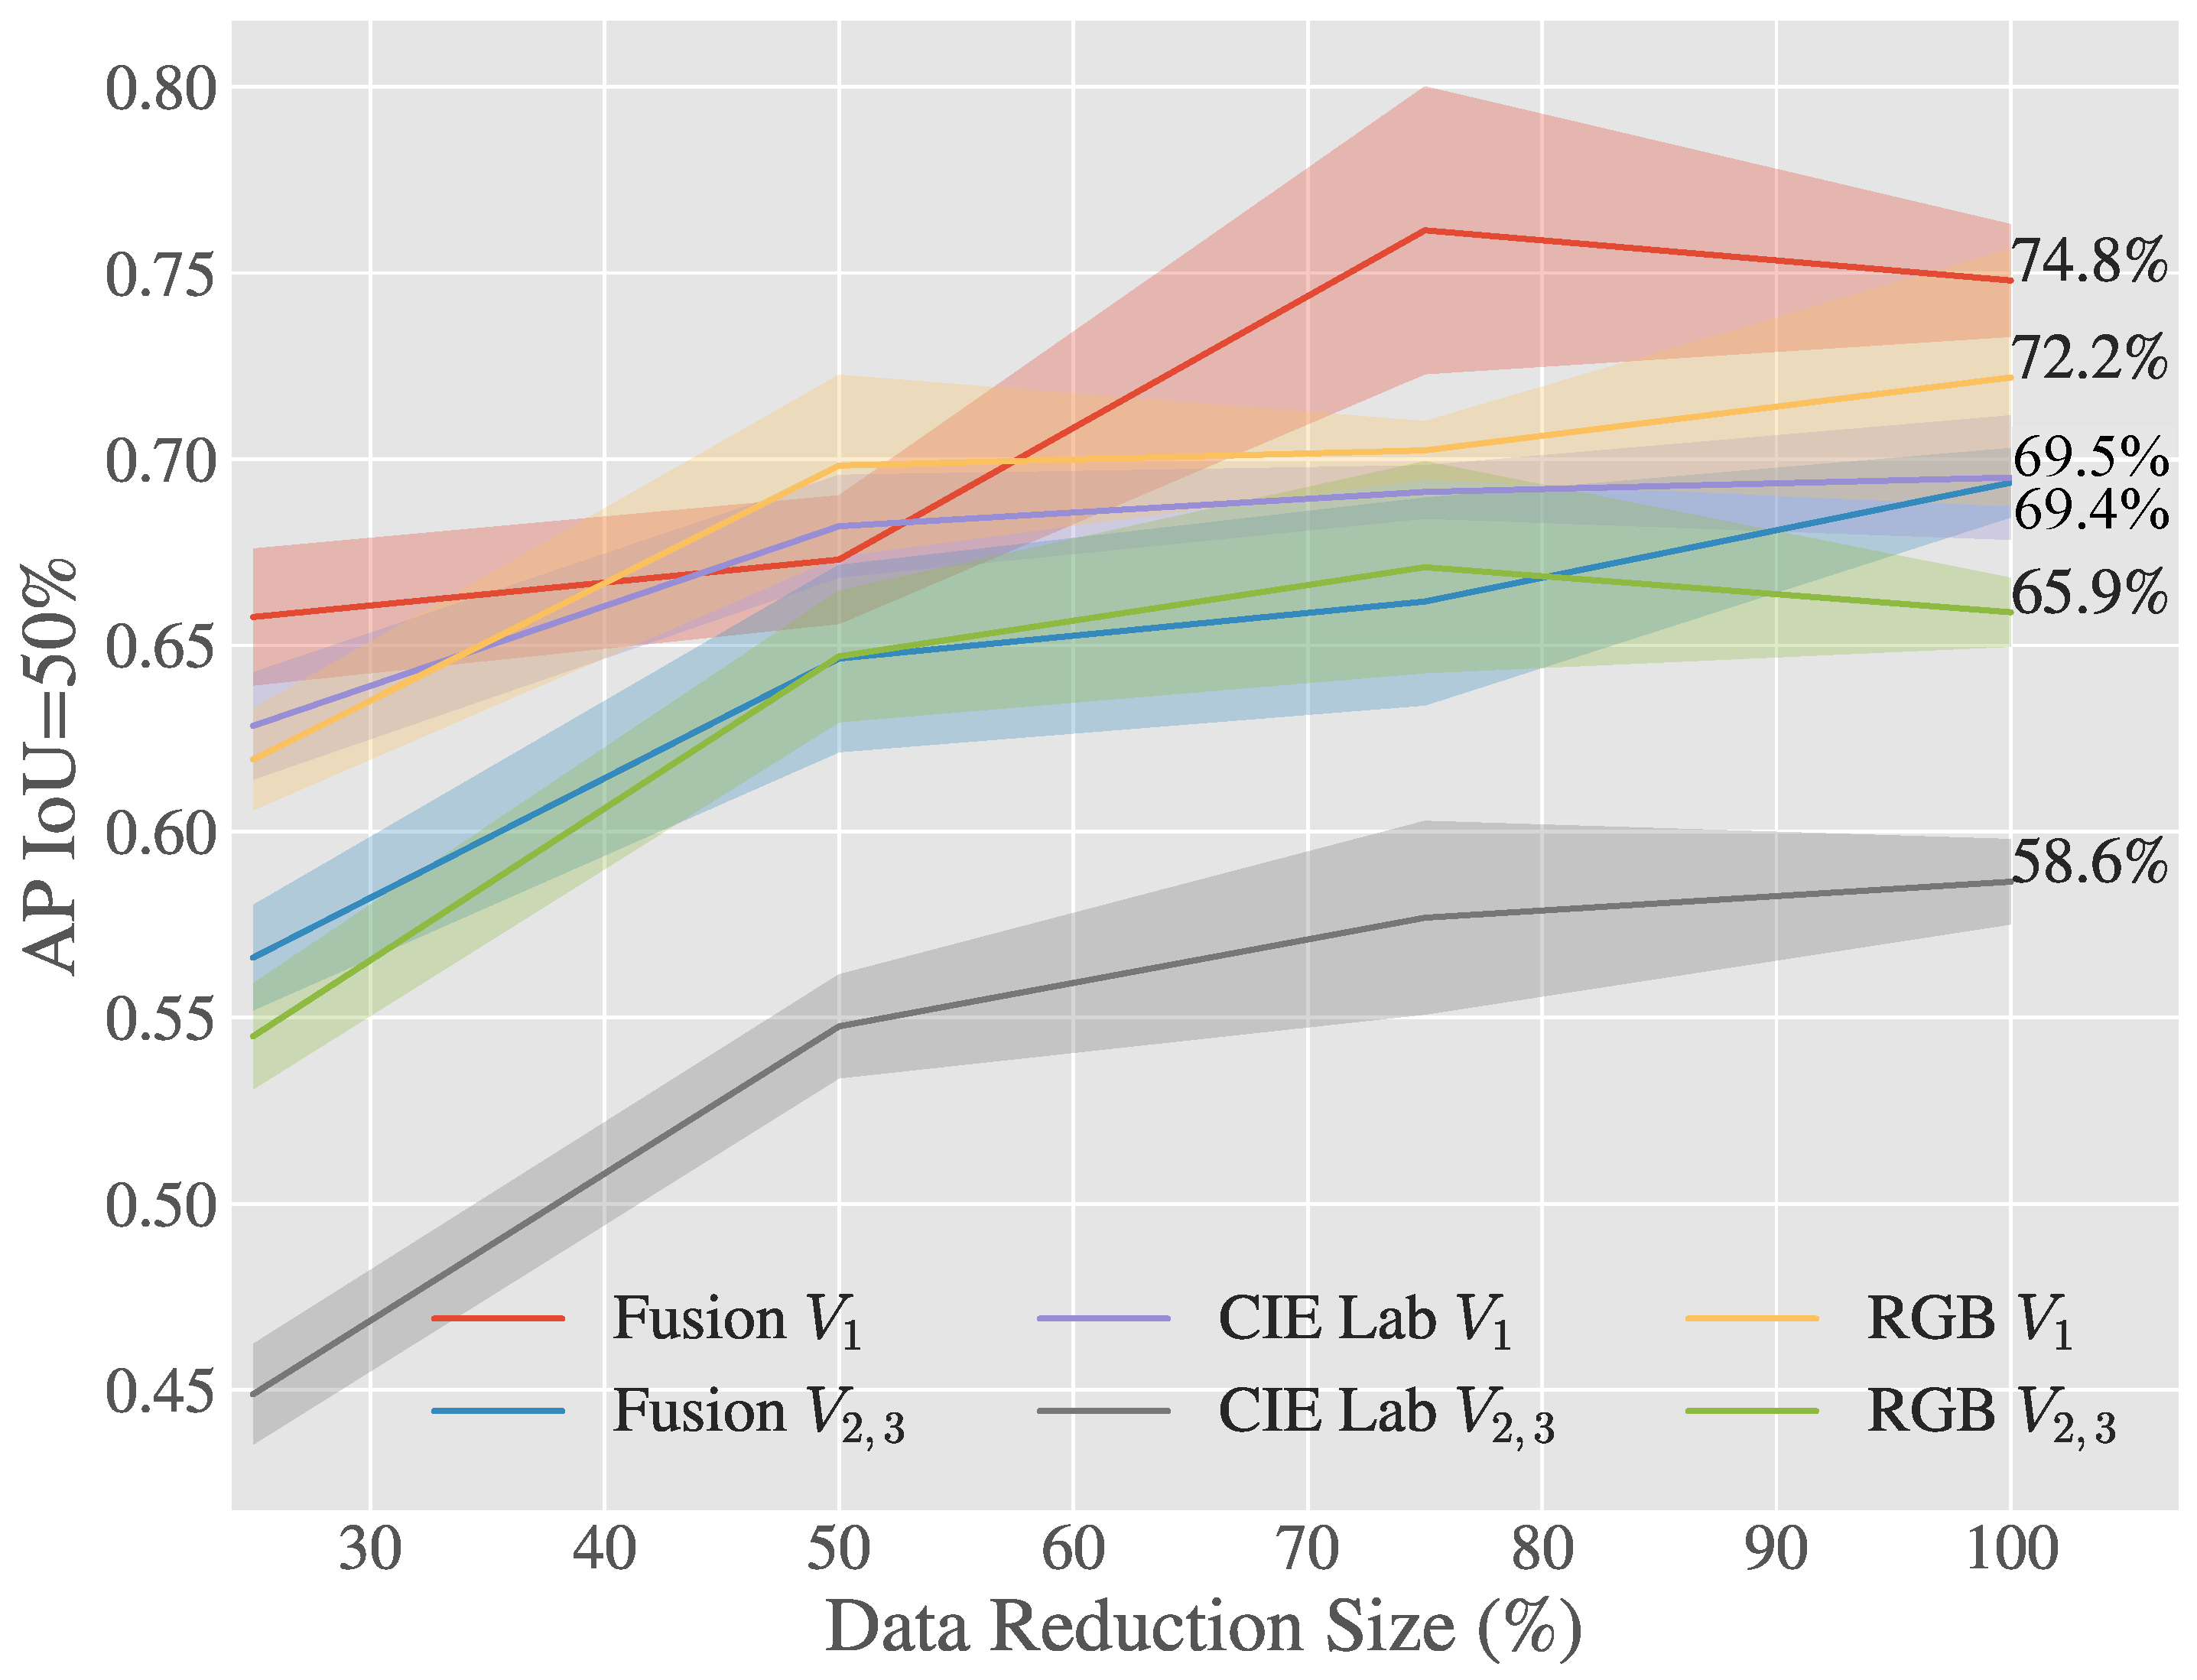
Figure 6 and
Figure 7 show how the Early Fusion approach responds to reduced data sizes. The original data size of 120 images described in
Table 2 is a small data set and in the experiments shown in these figures it was reduced by a factor of 25%, 50% and 75%. Its observed from the gradient of the line that the methods evaluated may perform better when more data is available. It can be seen that for a heavily reduced data set the methods have much lower performance than they do with full data access. Data augmentation could be further used to boost the performance of early fusion by altering the luminance values within the fused data to uniformly alter colour features in the original
RGB data.
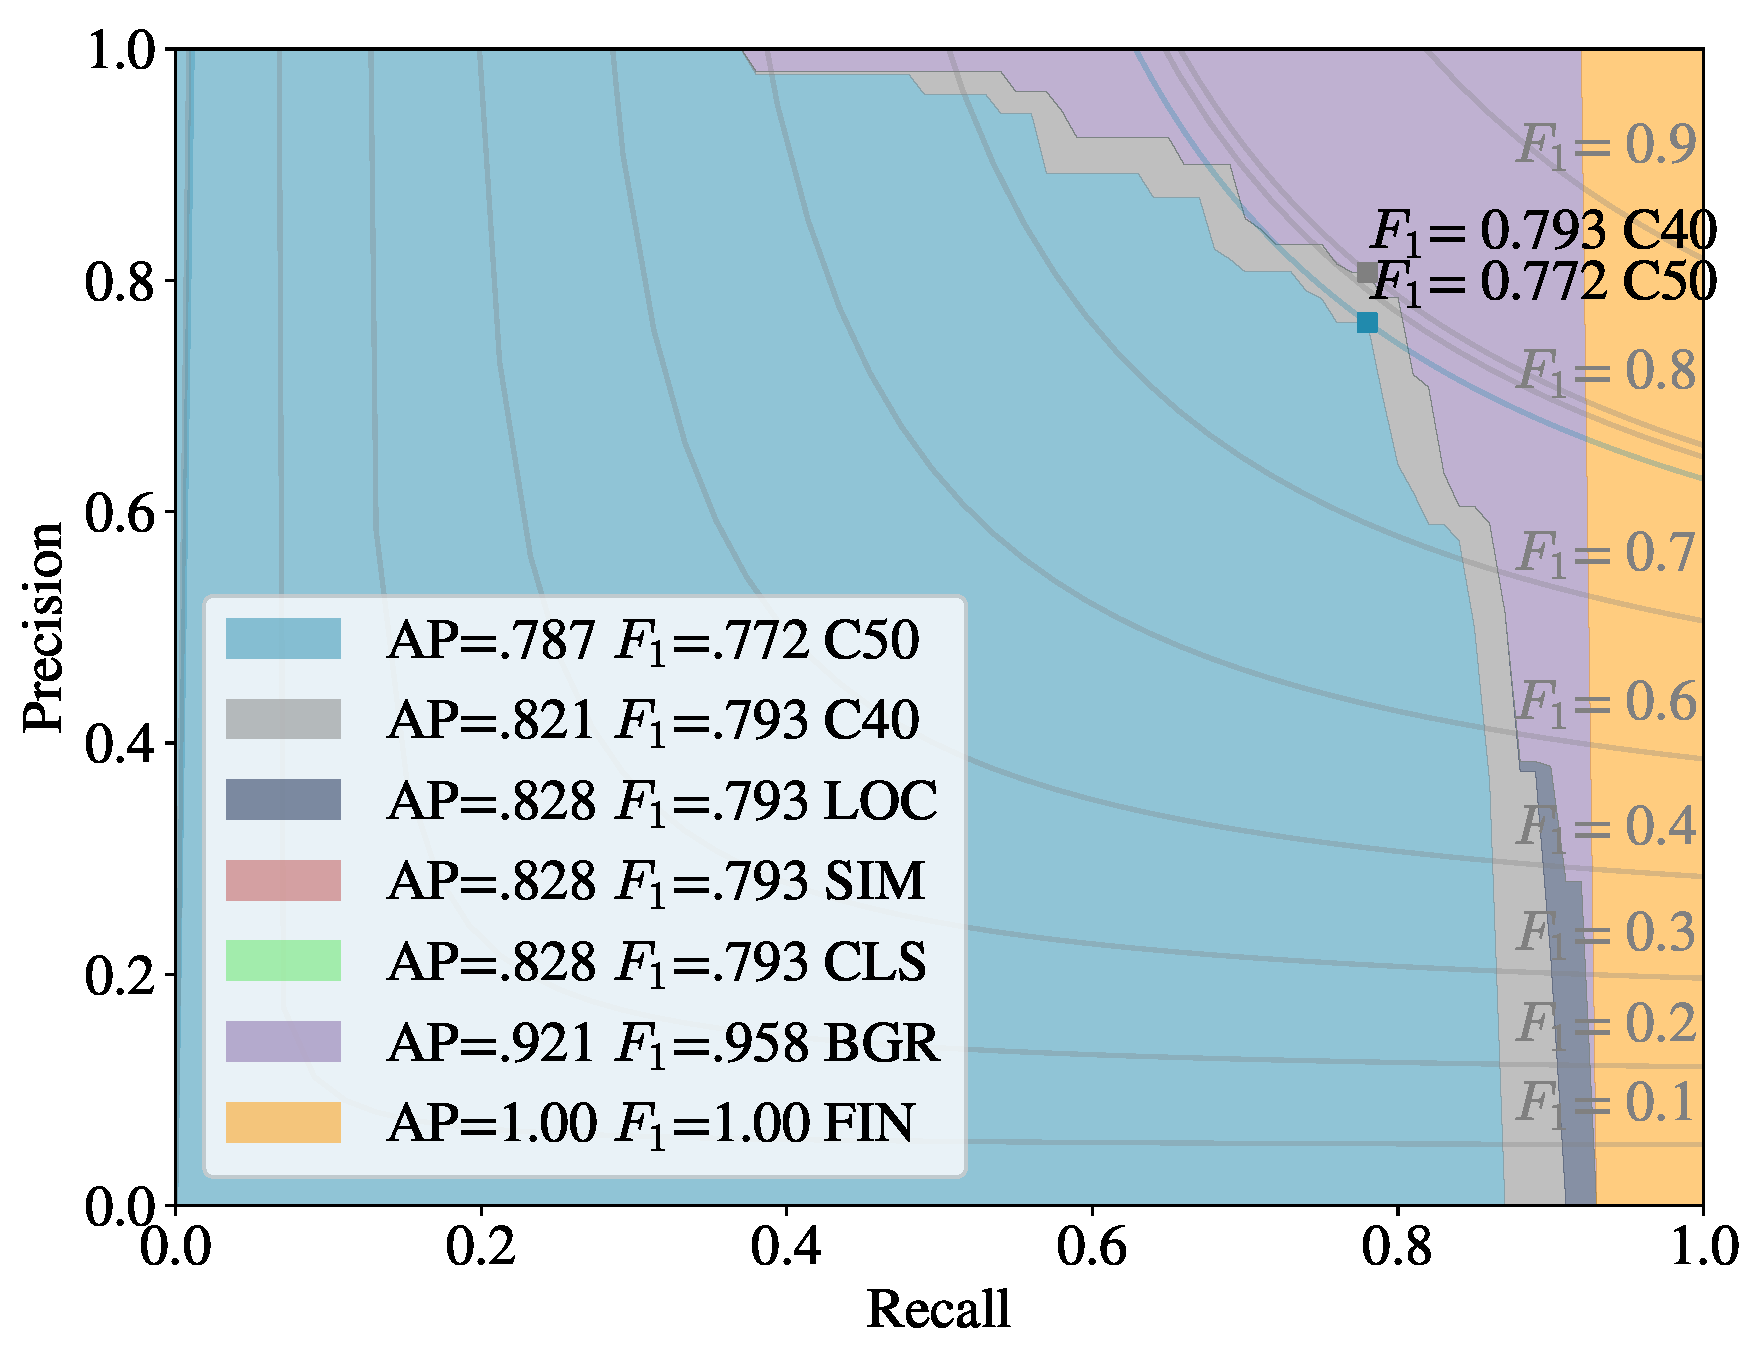
Figure 8 shows a false positive analysis of the early fusion network on the DeepFruits data set, you can clearly see in this graph most of the models inaccuracy comes from misclassification (BGR on
Figure 8), data augmentation is one approach that could help minimise this issue. In
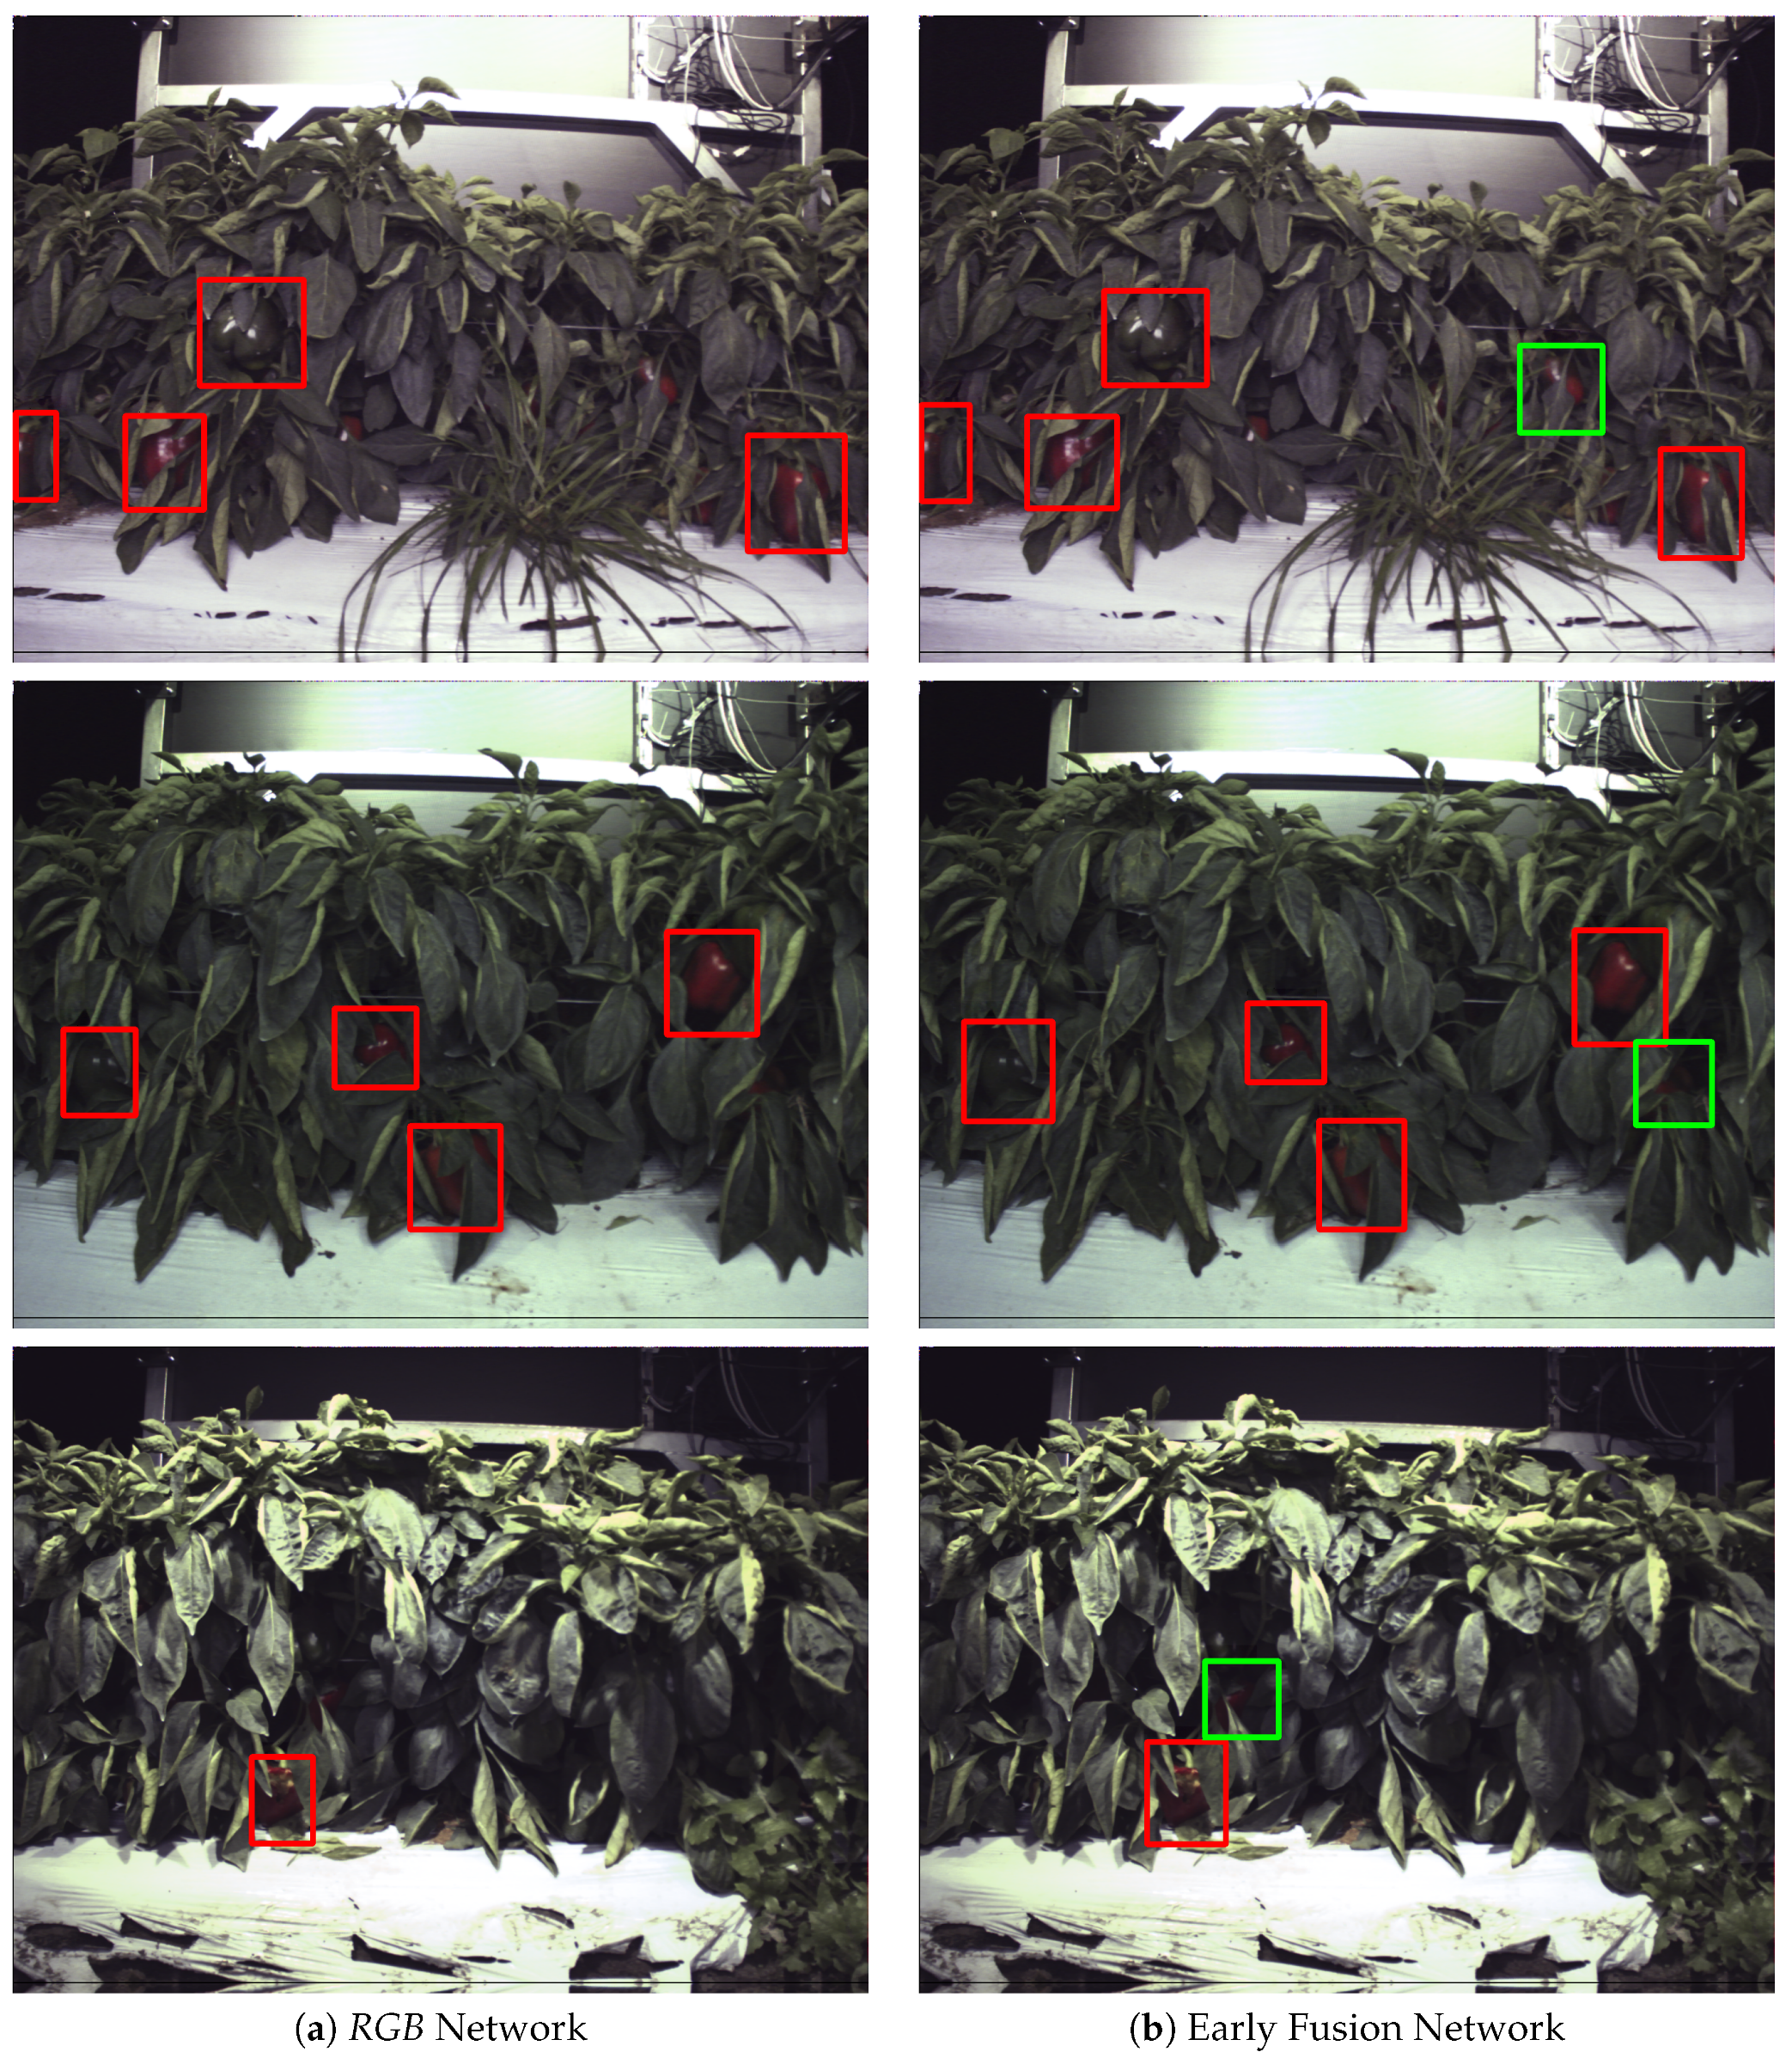
Figure 9 we provide the output of our early fusion approach compared to
RGB alone, highlighting the cases where it surpasses baseline performance. The results shown are from a network trained on
data and evaluated on the most dissimilar view
to stress the detectors performance across high variation of shape and luminance.
4.3. State-of-the-Art Comparison
The Sa et al. [
8] paper noted the crucial component of autonomous fruit harvesters to be an accurate vision system, to which they attributed illuminance variation, occlusion and colour similarity between crop and background class to be the three major constraints limiting current approaches. They proposed a system based on the two stage detector Faster R-CNN that utilised early and late fusion of
RGB and near Infrared imagery. Early fusion was a singular model with four input channels (
RGB +
IR) and late fusion trained two separate models (
RGB,
IR) and combined the detected objects in the final stage. Sa et al. [
8] found late fusion to be the best approach achieving an
score of 0.838 for Sweet Peppers, however they also noted this approach requires double the number of network parameters, computational cost, power, GPU utilisation, training time and inference time. Ultimately concluding the small decrease in accuracy of the early fusion approach from 0.838 to 0.799 as a worthy trade-off.
We compare our approach using a one stage detector RetinaNet to theirs in the following section. We directly compare the performance of three of our networks trained on RGB,
CIELab and Early Fusion inputs to their Late and Early fusion approach. We compare the effectiveness of our perceptually uniform features
CIELab to that of IR to remove luminance variance within the data set, described in
Table 5. The evaluation metrics used are in correspondence with the original paper (IoU at 0.4) and only classification scores greater than 0.9 are considered. The images contained in the sweet pepper data set were not as high resolution as with our Strawberry data set described in
Table 2 but instead were
which we sampled to be divisible by 32 at
pixels.
In this experiment we would expect lower performance values due to the fact we’re using a one stage detector over the two stage detector used in the original paper, as well as working with a data set less colour centric than ours. It is less colour centric due to the single class sweet pepper sharing very similar colour features with the background class. However we show the effectiveness of our approach at achieving what the addition of IR tried to achieve in DeepFruits, fortifying the prior viewpoint experiment results and luminance removal even when classes share much of their colour features that CIELab is based upon.
Moreover the early fusion approach attempted in the deep fruits paper failed at surpassing the score of standard RGB and their approach using late fusion (which did outperform the RGB baseline) was dependant on simultaneous collection of IR data as well as training two separate networks, ultimately only showing a 2.2% increase.
We observe similar results in
Table 6, our early fusion approach closely follows the
RGB scores and matches the performance obtained by Sa et al. [
8] (0.799). Our average precision scores outperform the standard
RGB results by 2.8% and 6.2% for AP50 and AP40 respectively, suggesting the network more accurately classifies than it detects. Although we show statistically similar results to DeepFruits, our approach is considerably faster (
) at 0.06 s per image compared to 0.393 s and only needs
RGB data instead of the
RGB + Near Infrared data their approach requires. Interestingly the early fusion approach maintains similar precision increases over the experiments as in
Table 4 and
Figure 7. In
Figure 10 we compare our early fusion approach to standard
RGB on networks trained from the data provided by Sa et al. [
8] originally captured in [
38]. The results provided are representative of the results presented in
Table 6.
Across experimental conditions we see consistent improvement in viewpoint invariance using early fusion of
RGB and CIE Lab. Utilising the RetinaNet architecture as a base allowed us to remove class imbalance through the Focal Loss function and improve detection for objects at multiple scales through the implemented Feature Pyramid Network. We achieve near real time performance as seen in
Table 7, where we present speeds similar to what is stated as near real-time in relevant literature [
20]. Our early fusion approach adds to the architecture by providing results less sensitive to colour specificity of trained classes, and can be seen as a more generalised approach to solving this problem than introducing multiple spectra as in [
8].


