Corrosion Monitoring of Reinforced Steel Embedded in Cement Mortar under Wet-And-Dry Cycles by Electrochemical Impedance Spectroscopy


Abstract
1. Introduction
2. Materials and Methods
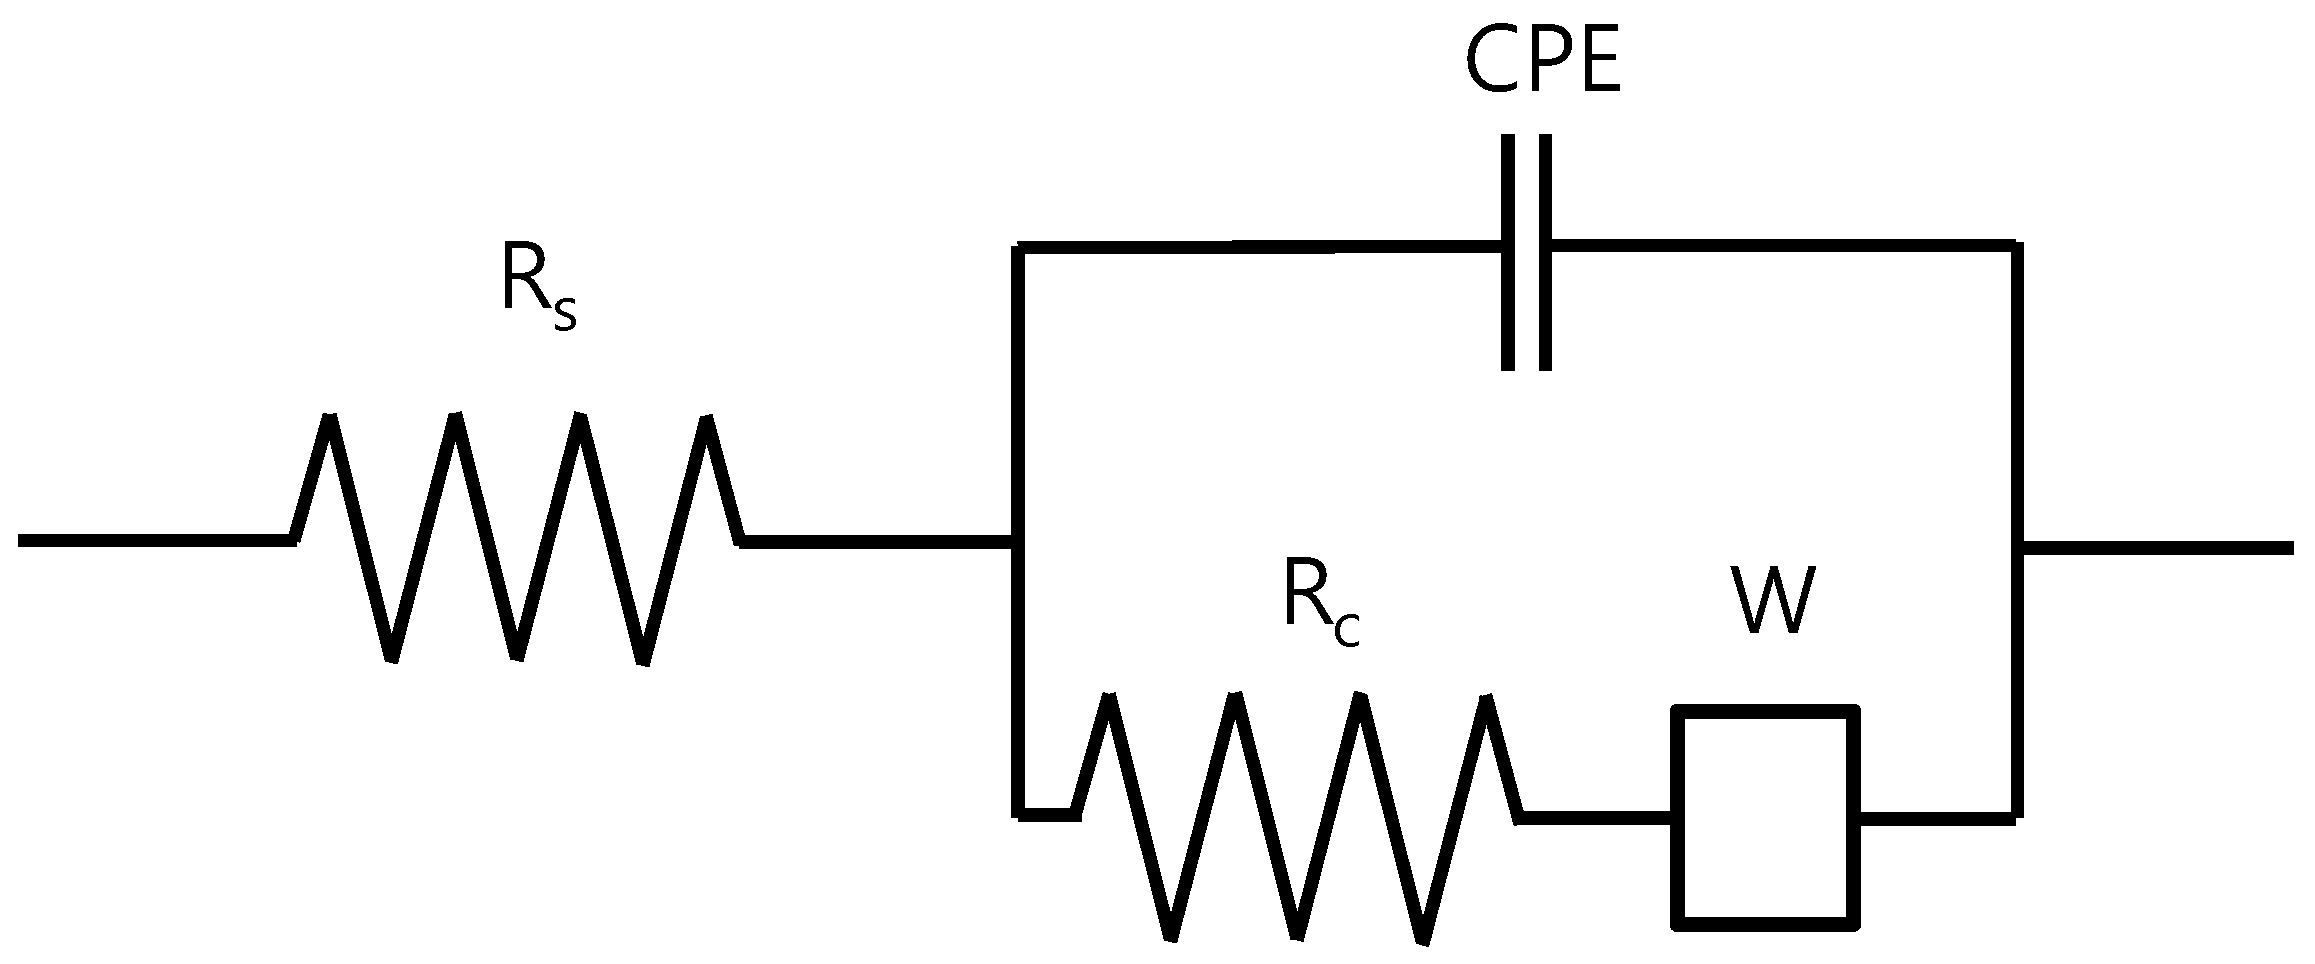
2.1. EIS Model of Reinforced Steel in Concrete
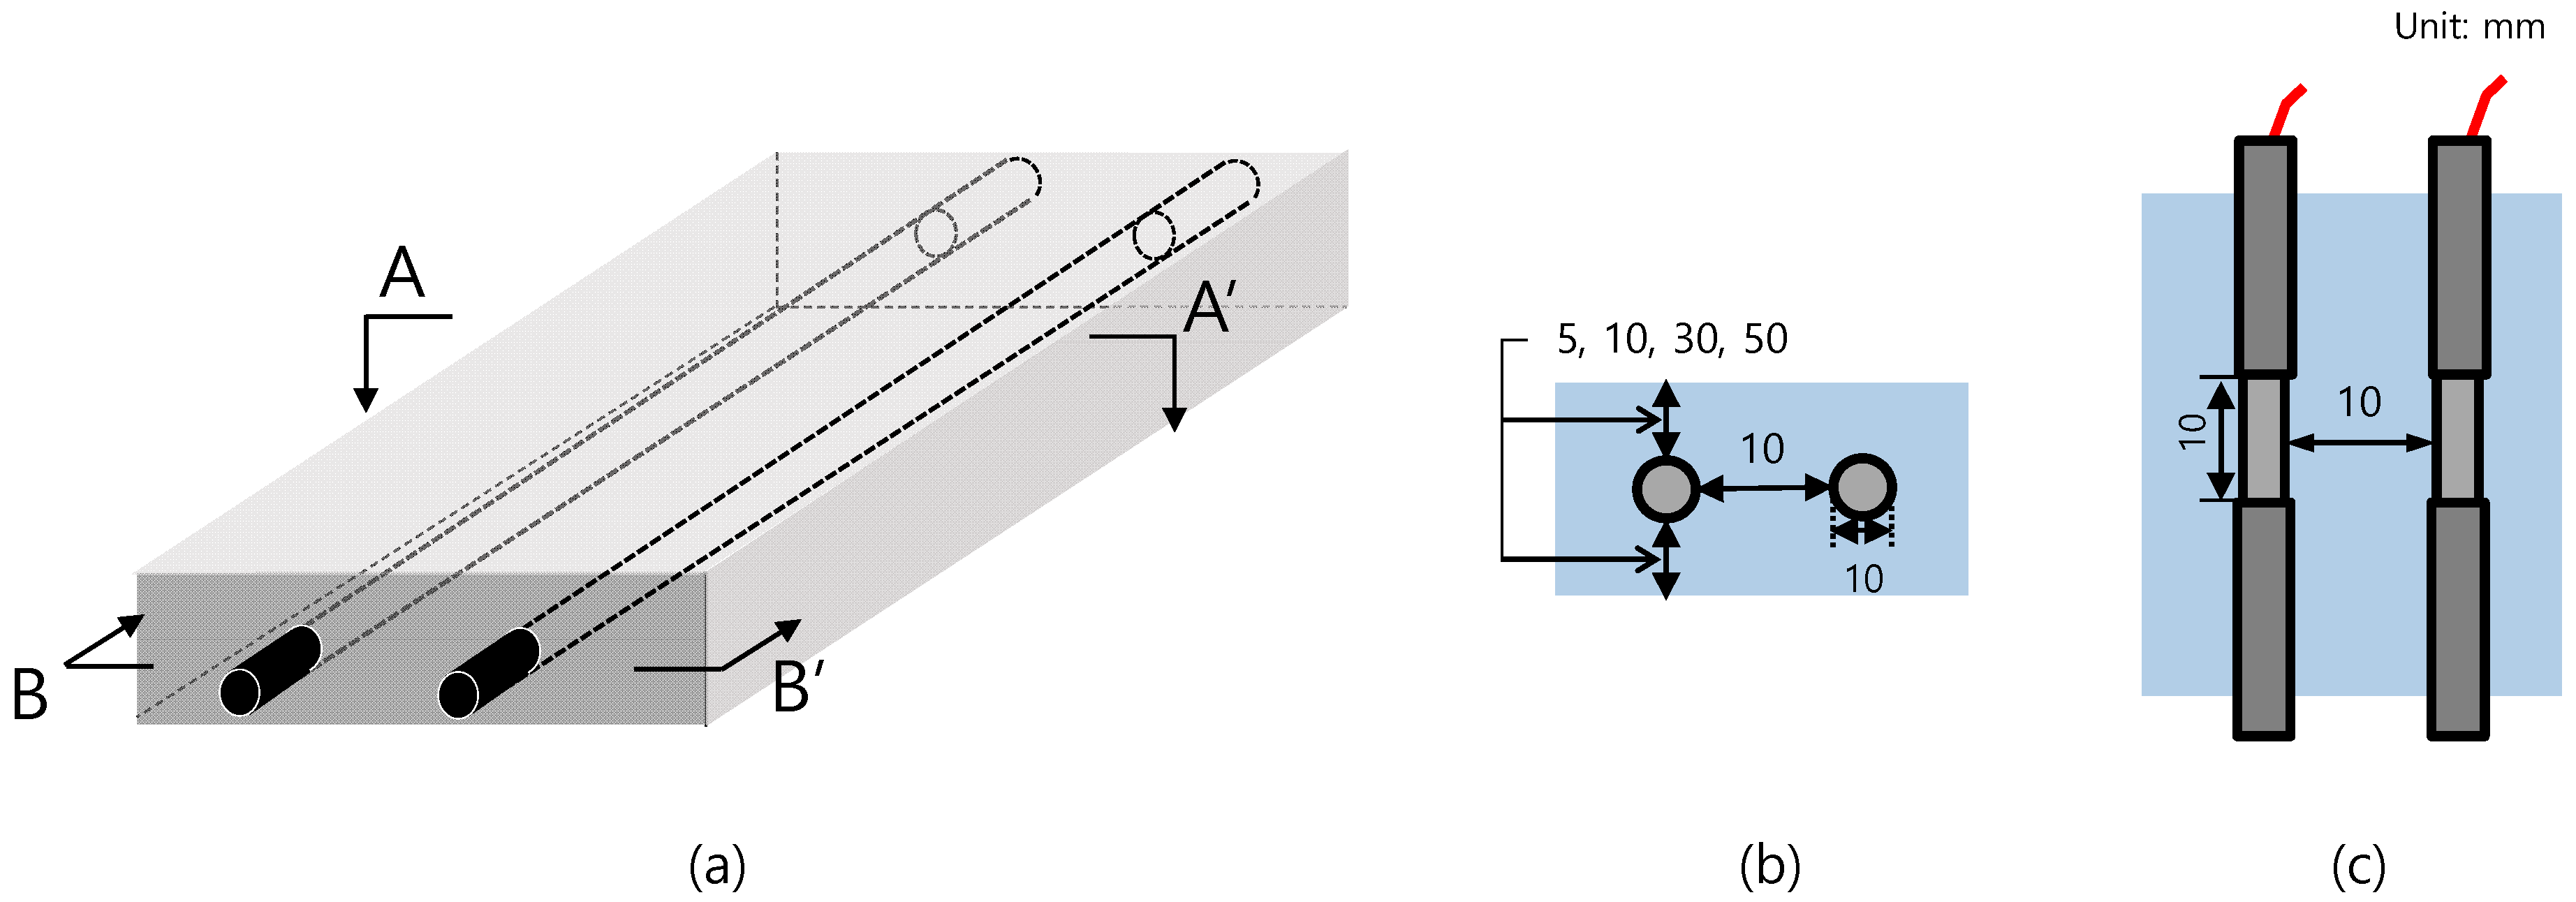
2.2. Preparation of Specimens
2.3. Wet–Dry Cycle
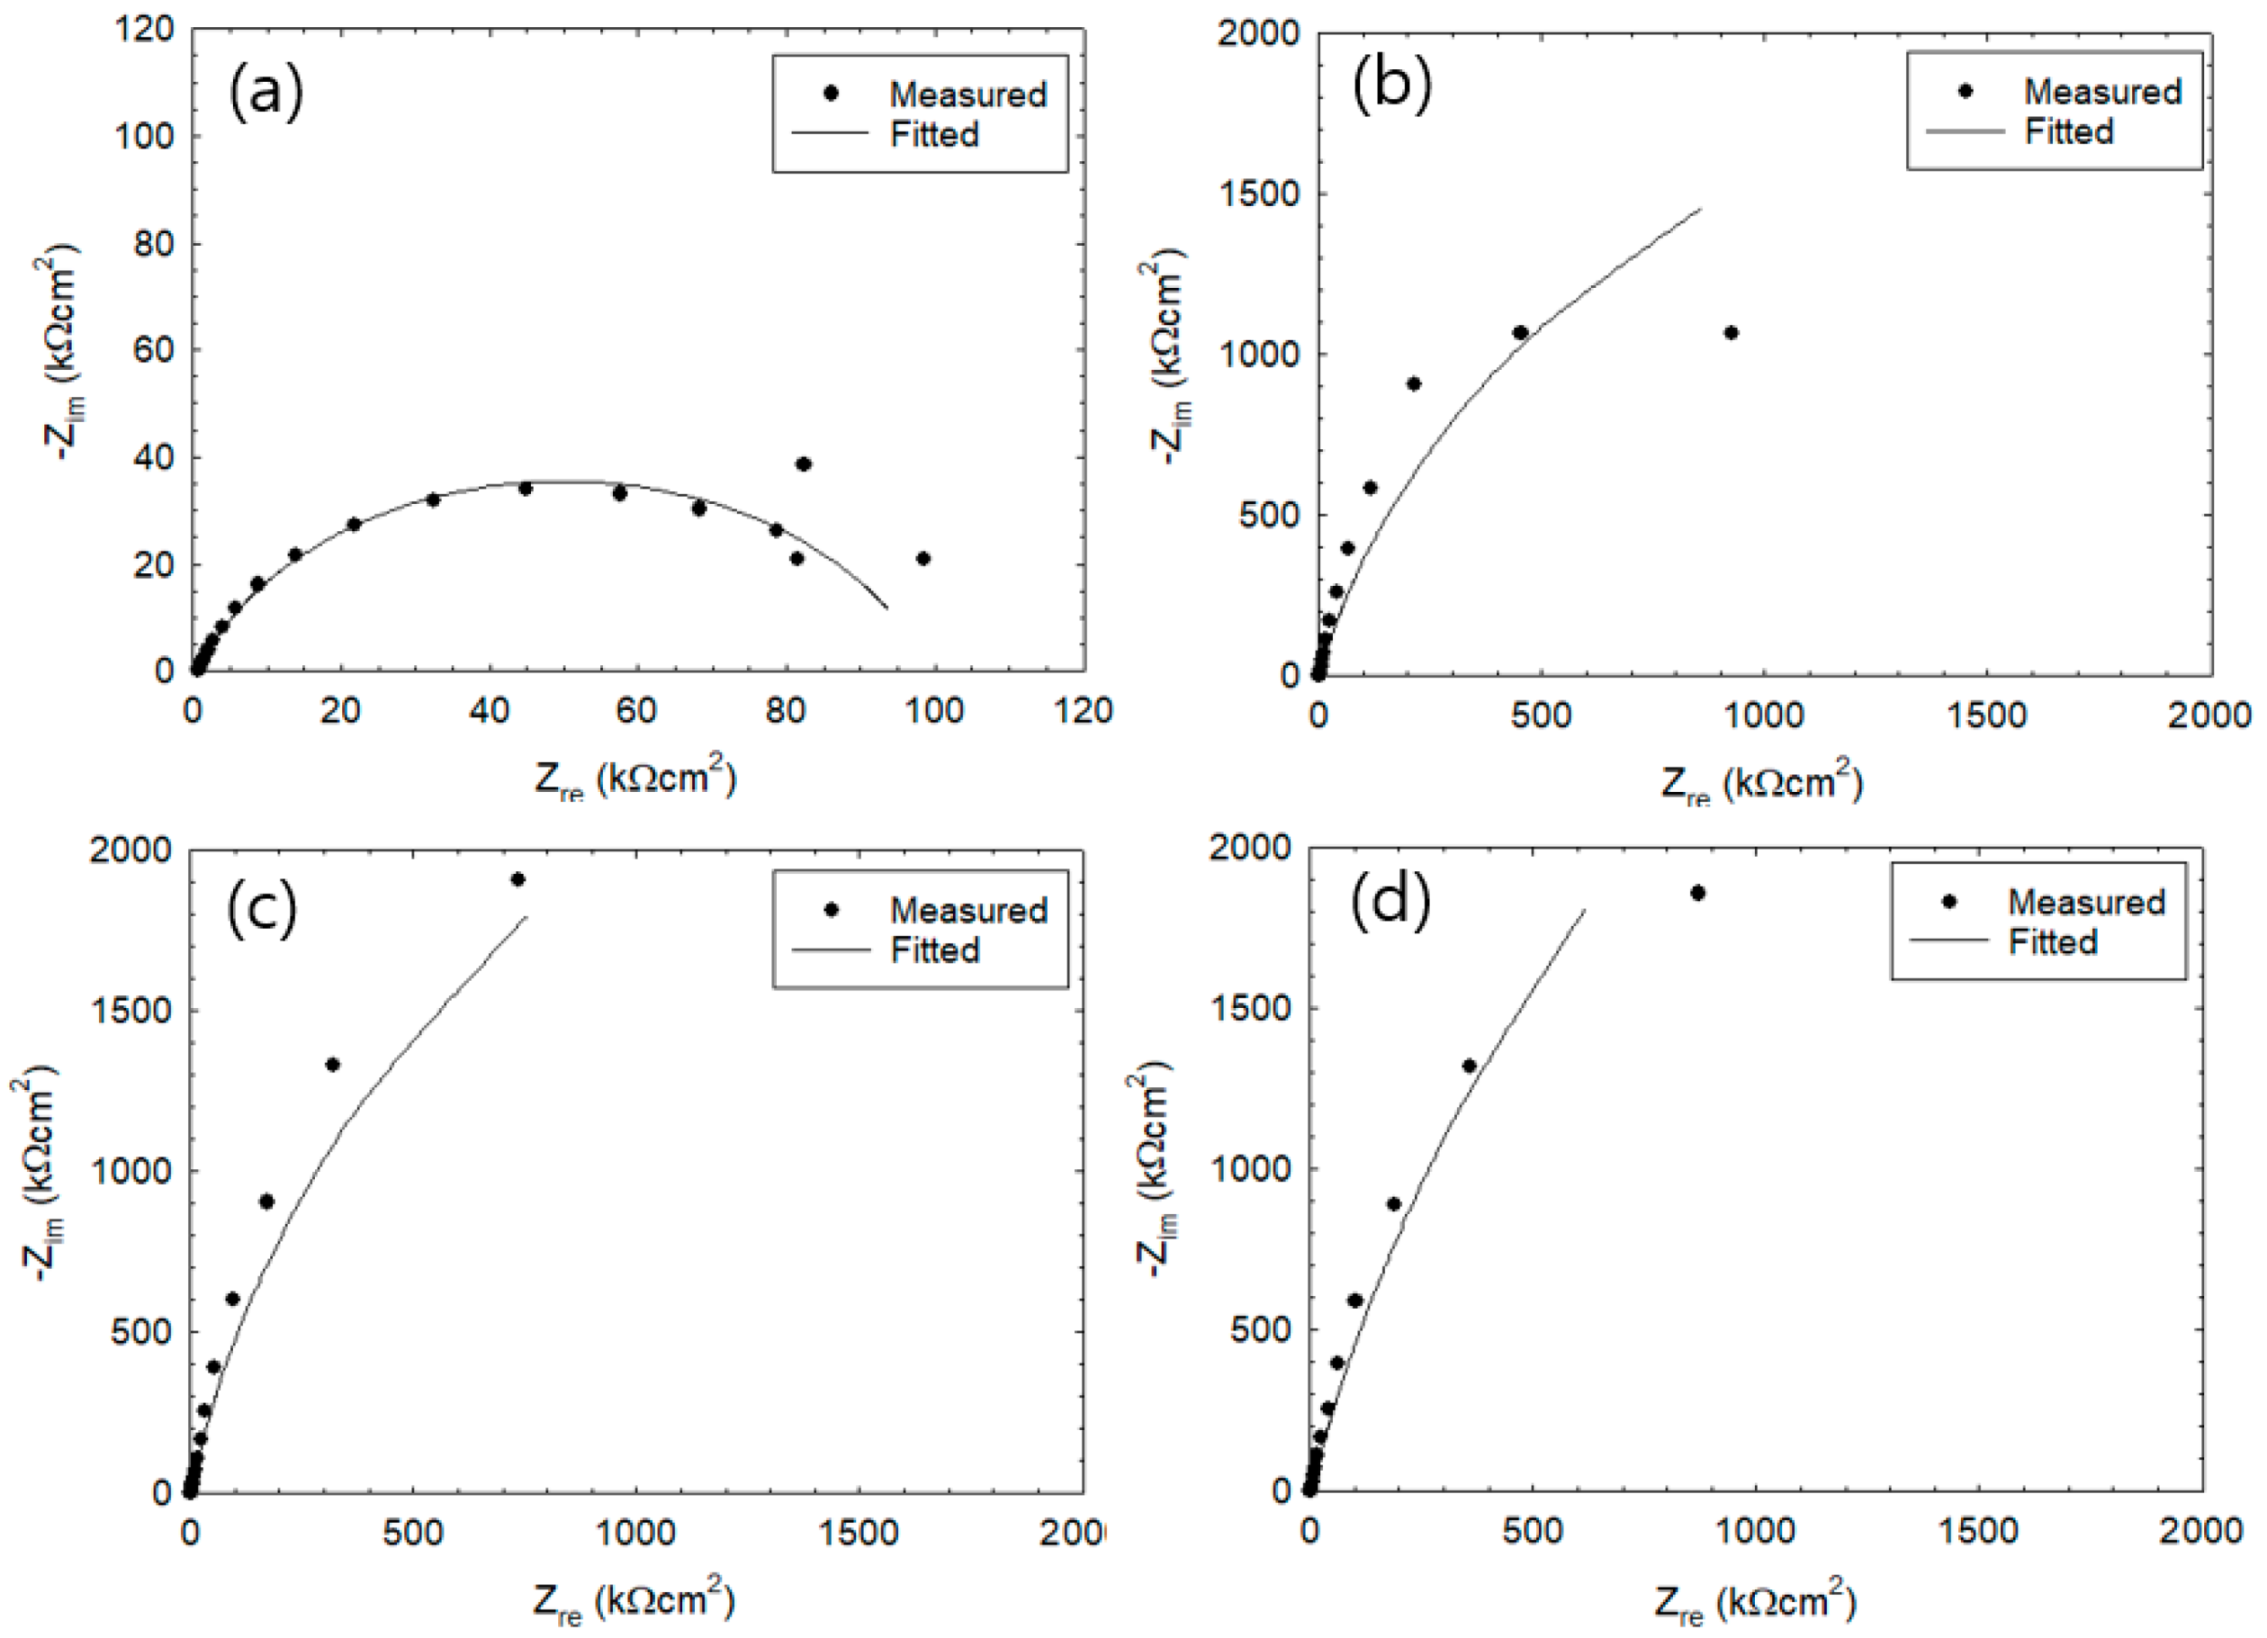
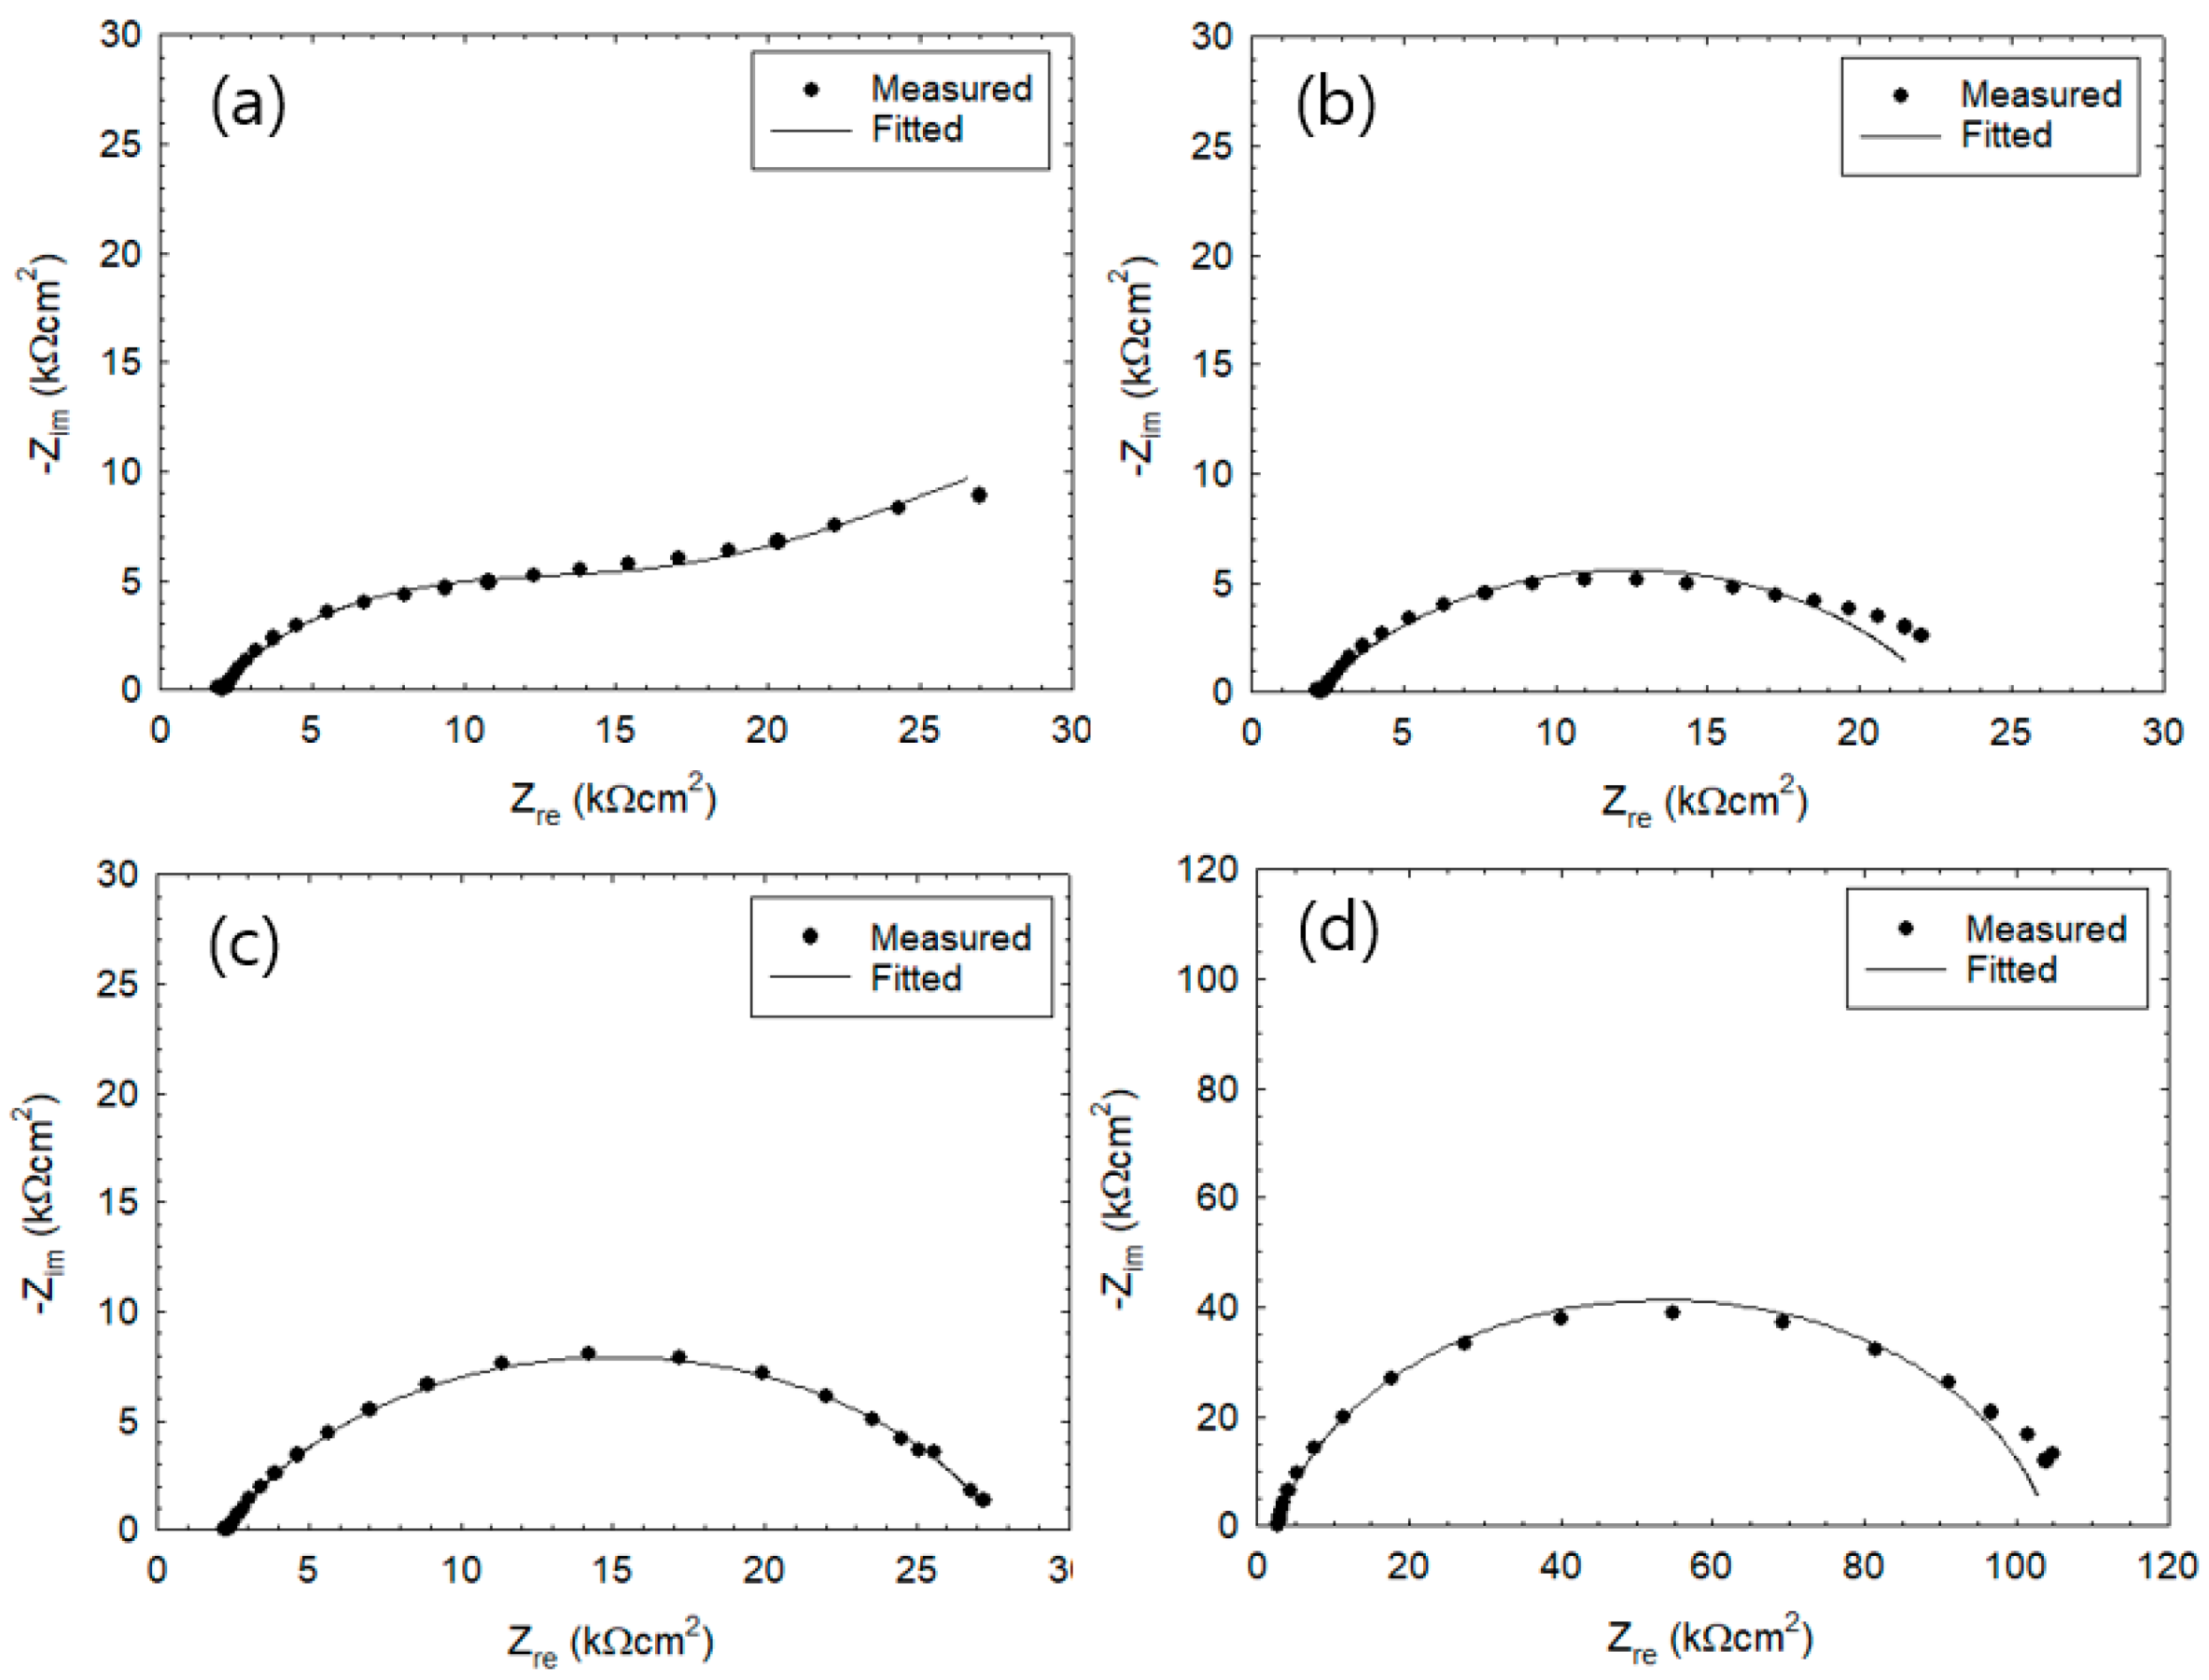
3. Results
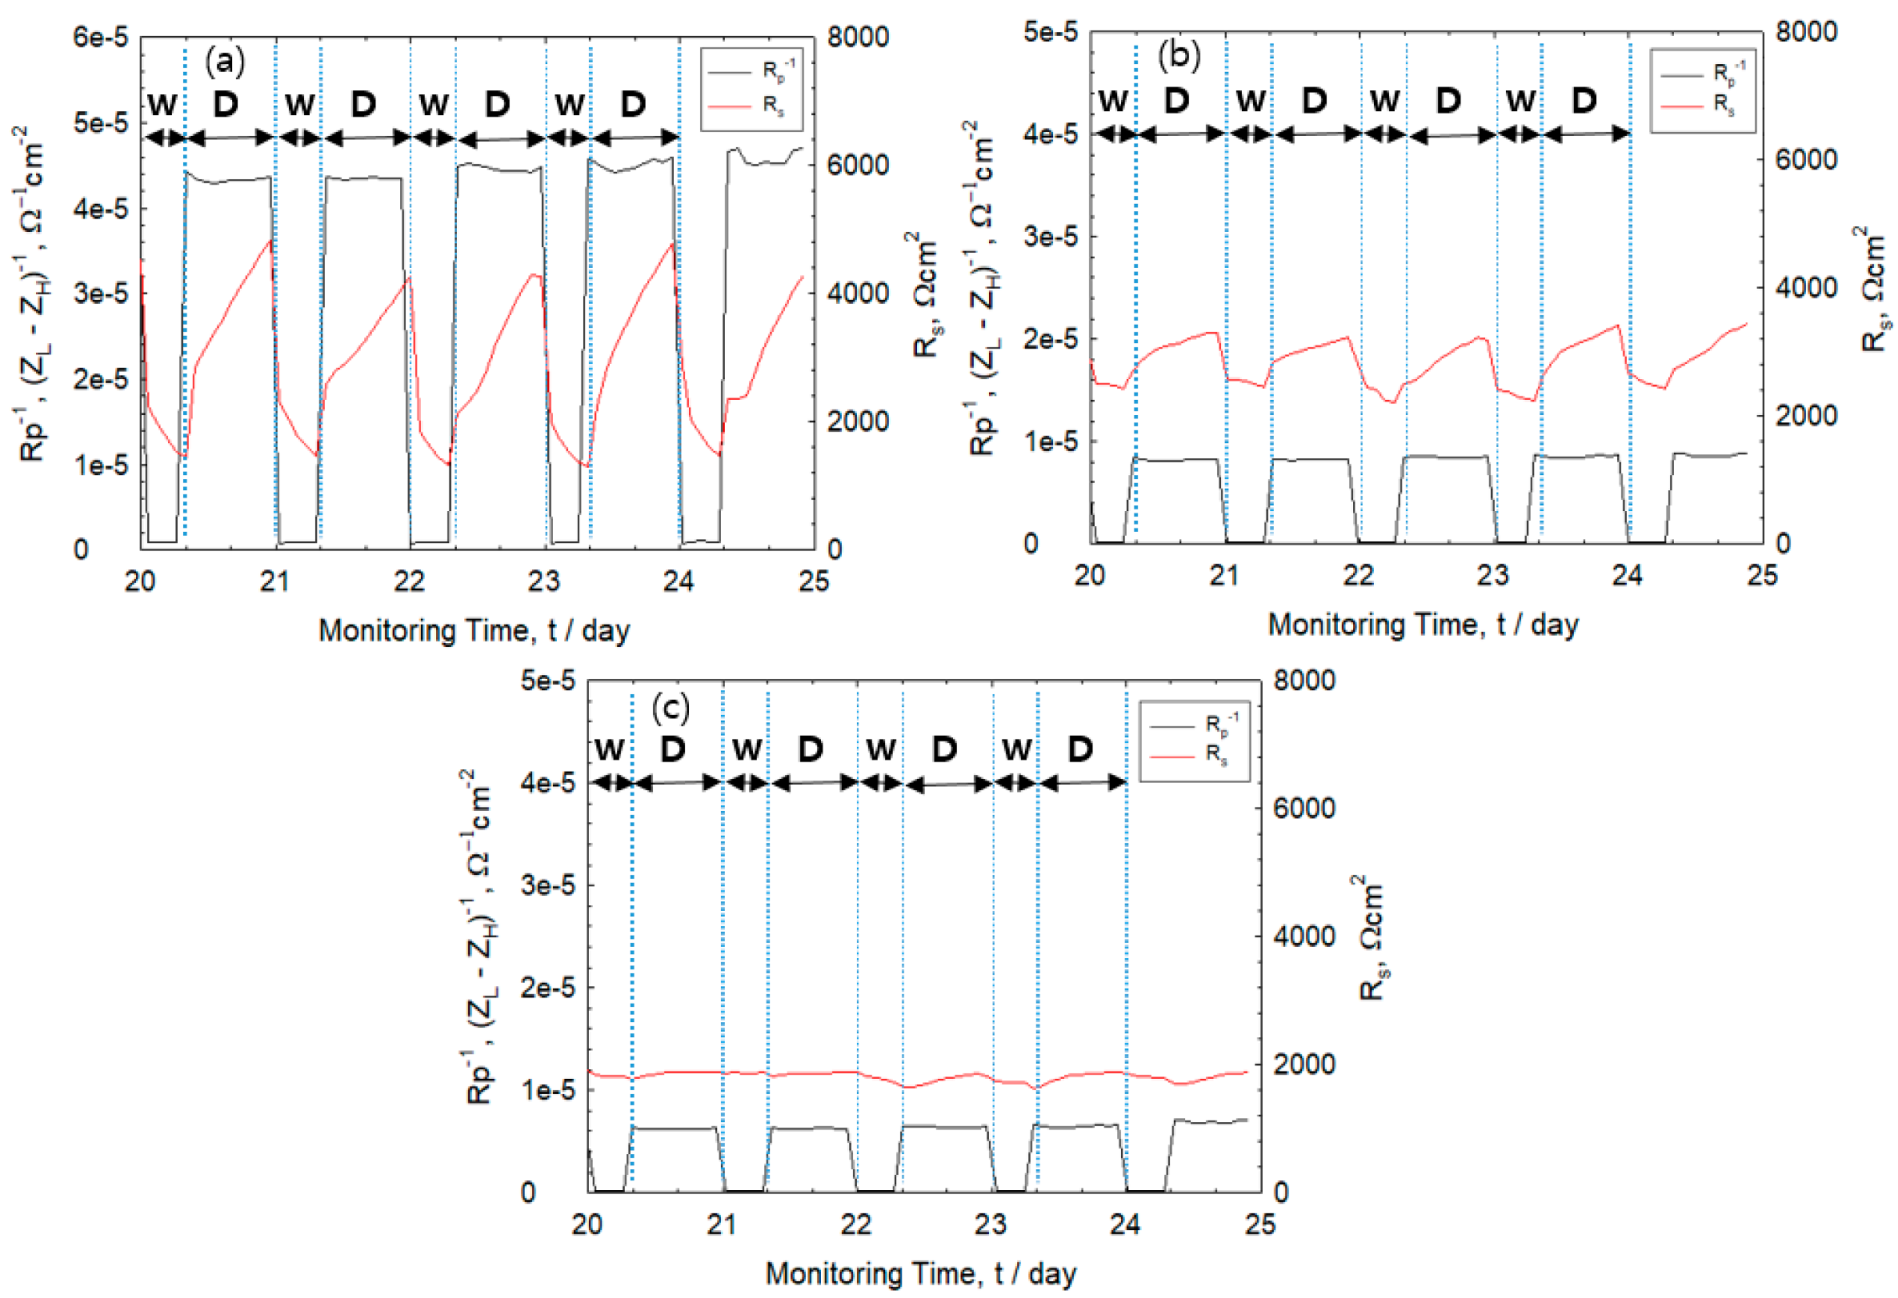
3.1. Corrosion Behavior of Wet–Dry Cycle
3.2. Measurement of Rp Via the Two-Frequency Method
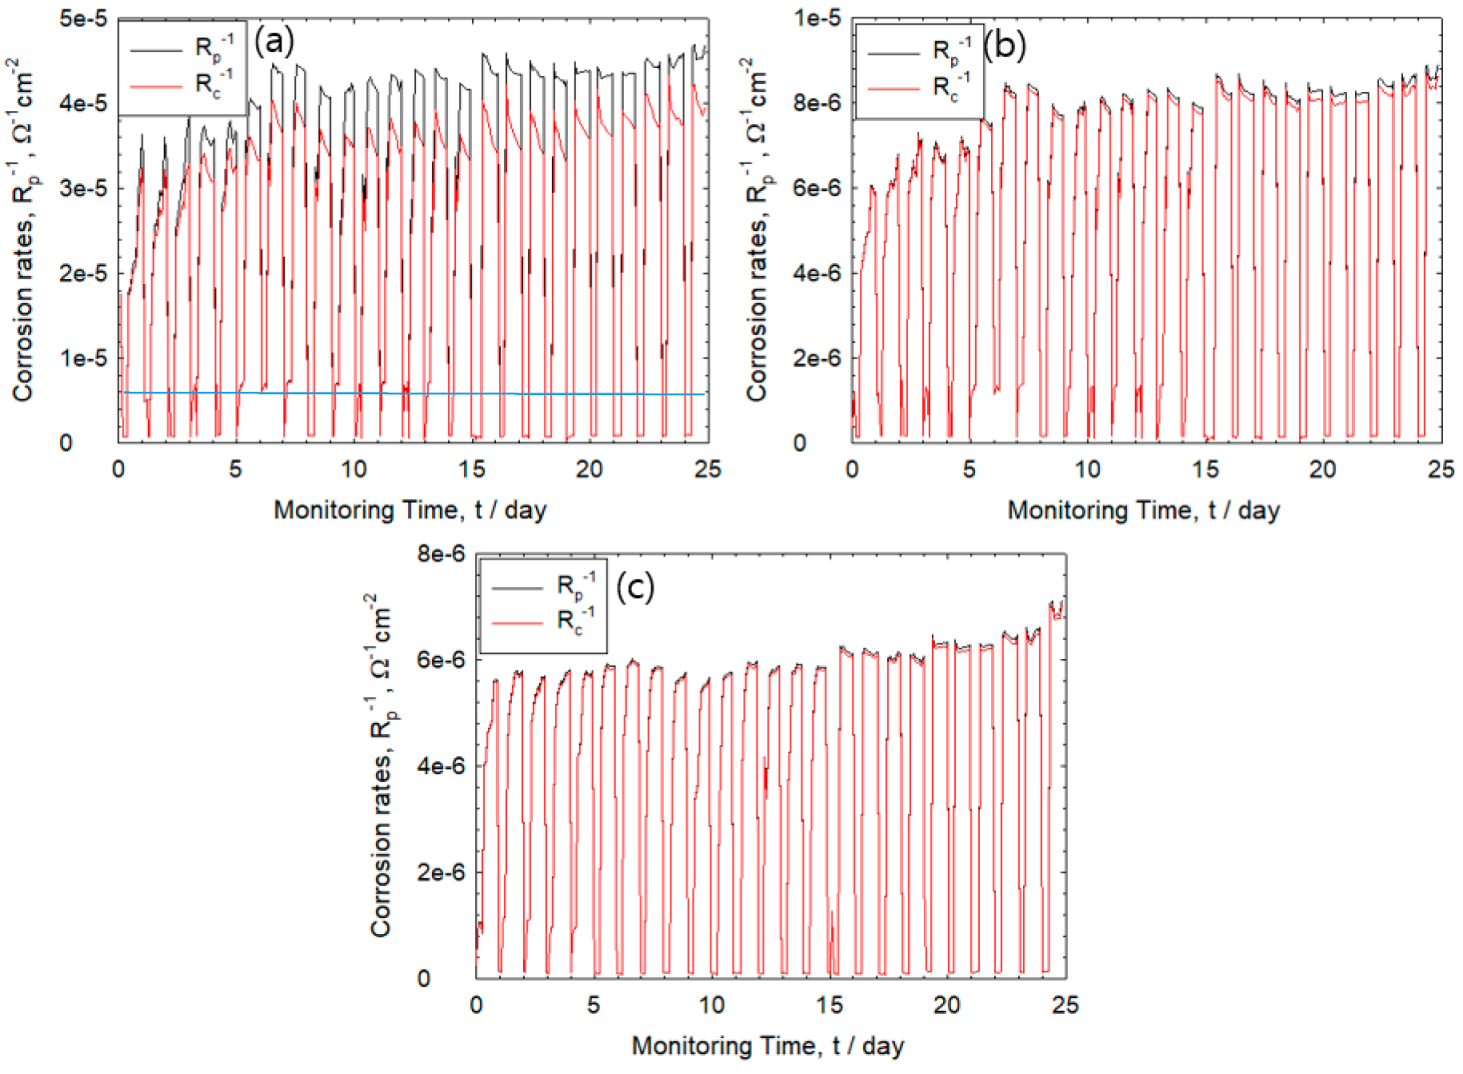
3.3. Monitoring of Corrosion Rate
3.4. Effect of IR Drop on Corrosion Rate
3.5. Effect of Corrosion Product on IR Drop
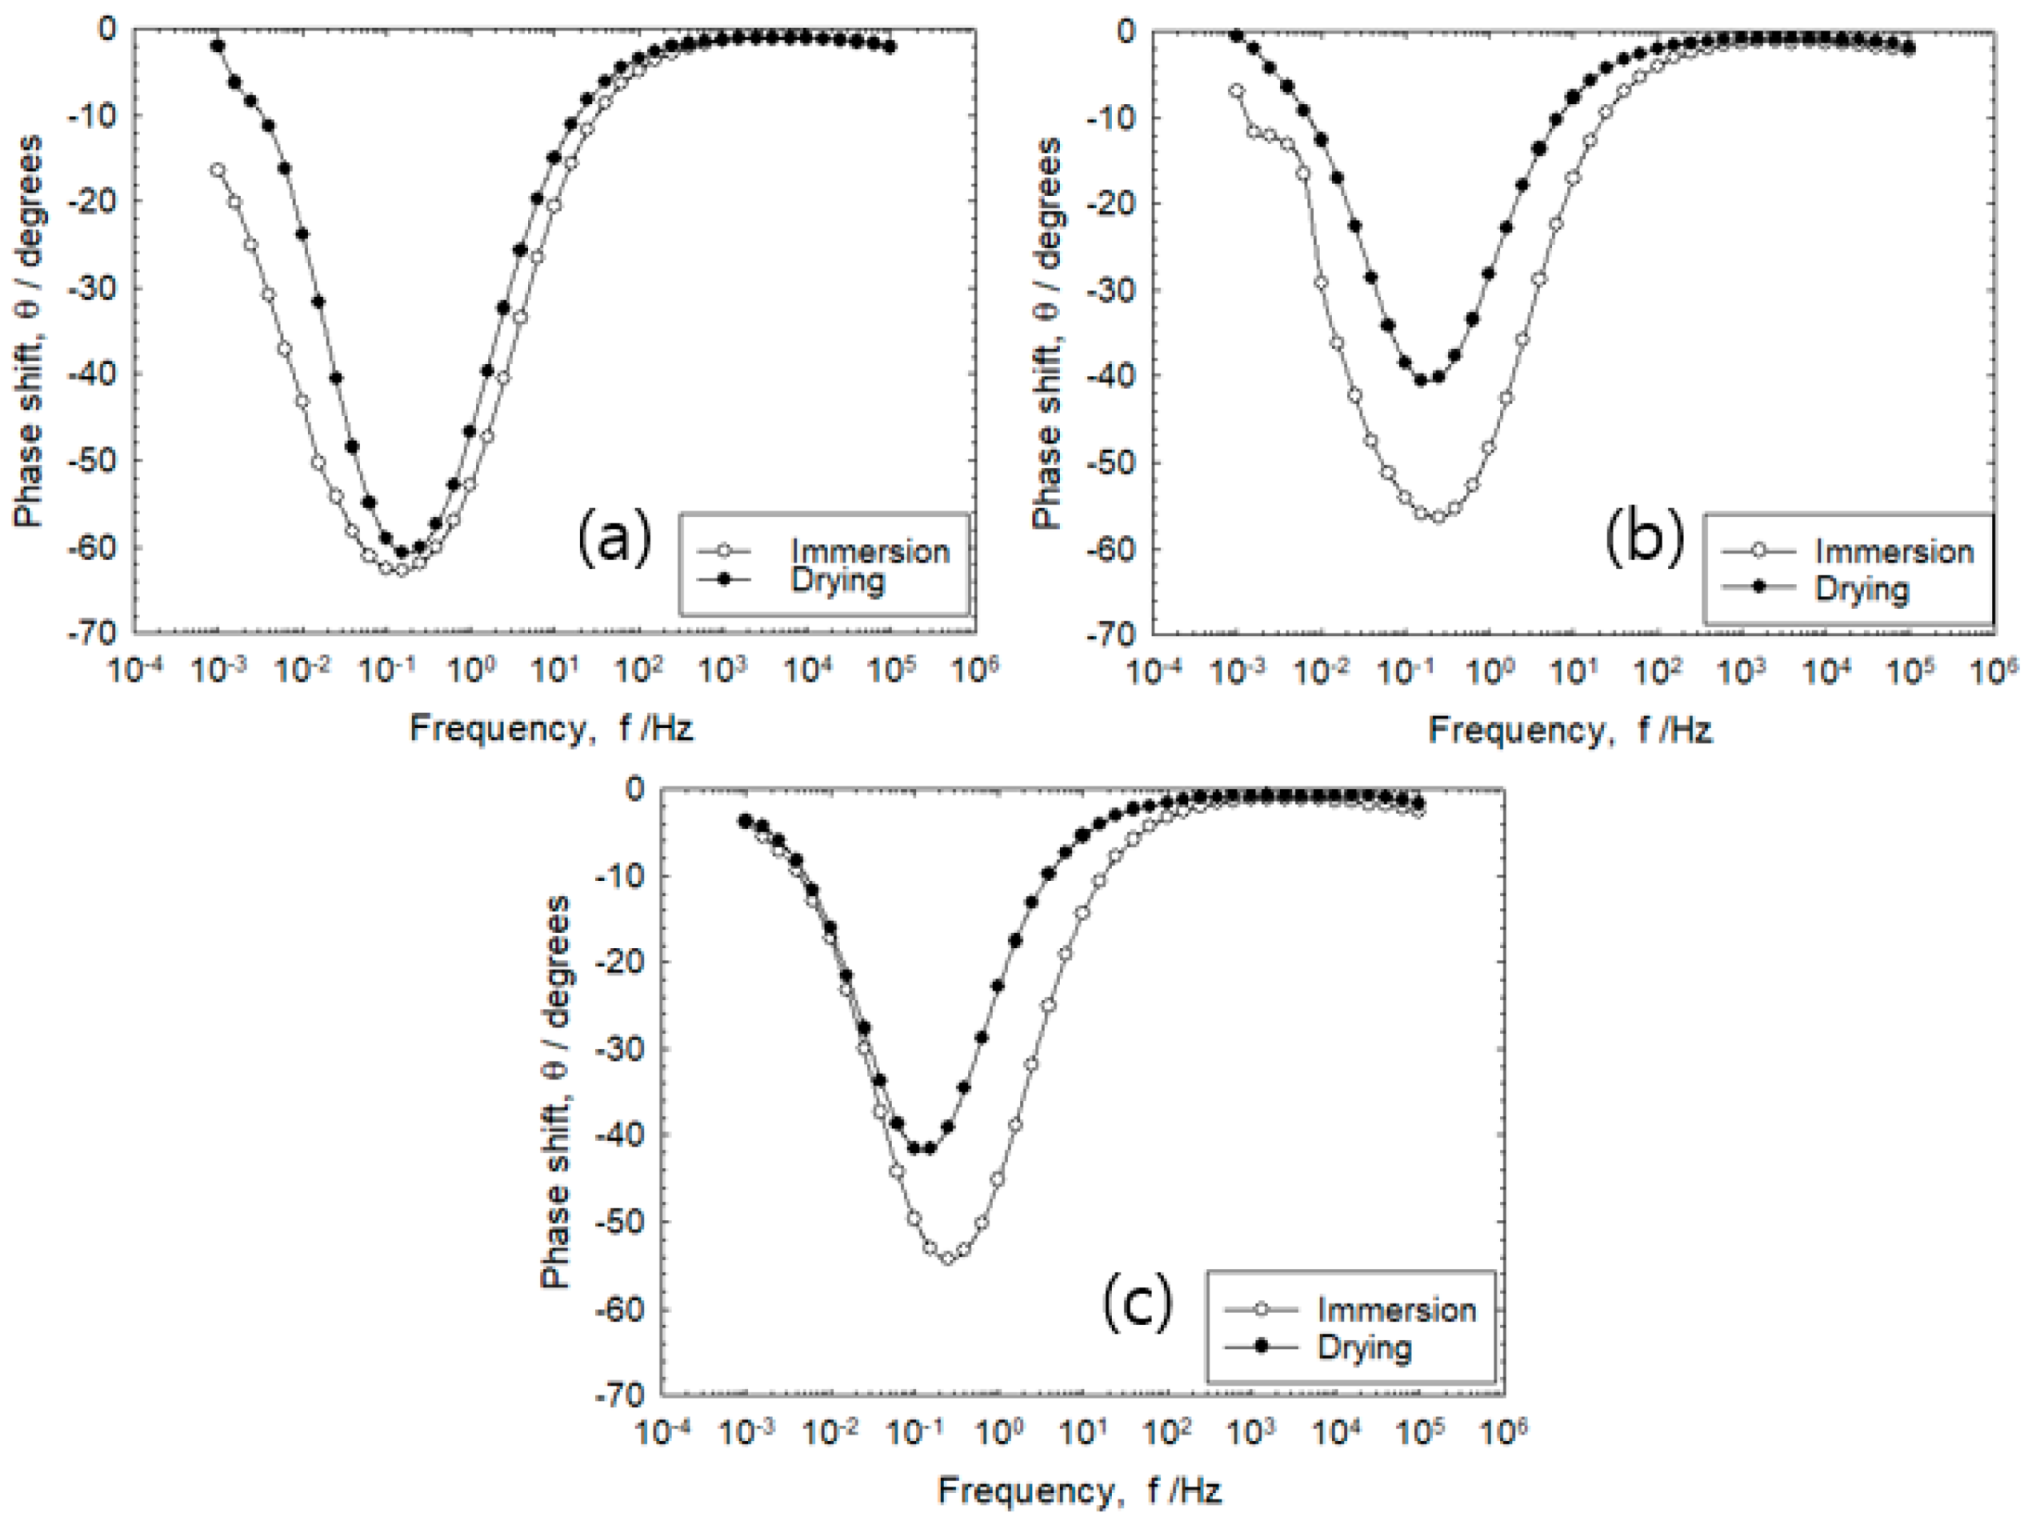
3.6. Effect of Drying Condition on IR Drop
4. Discussion
5. Conclusions
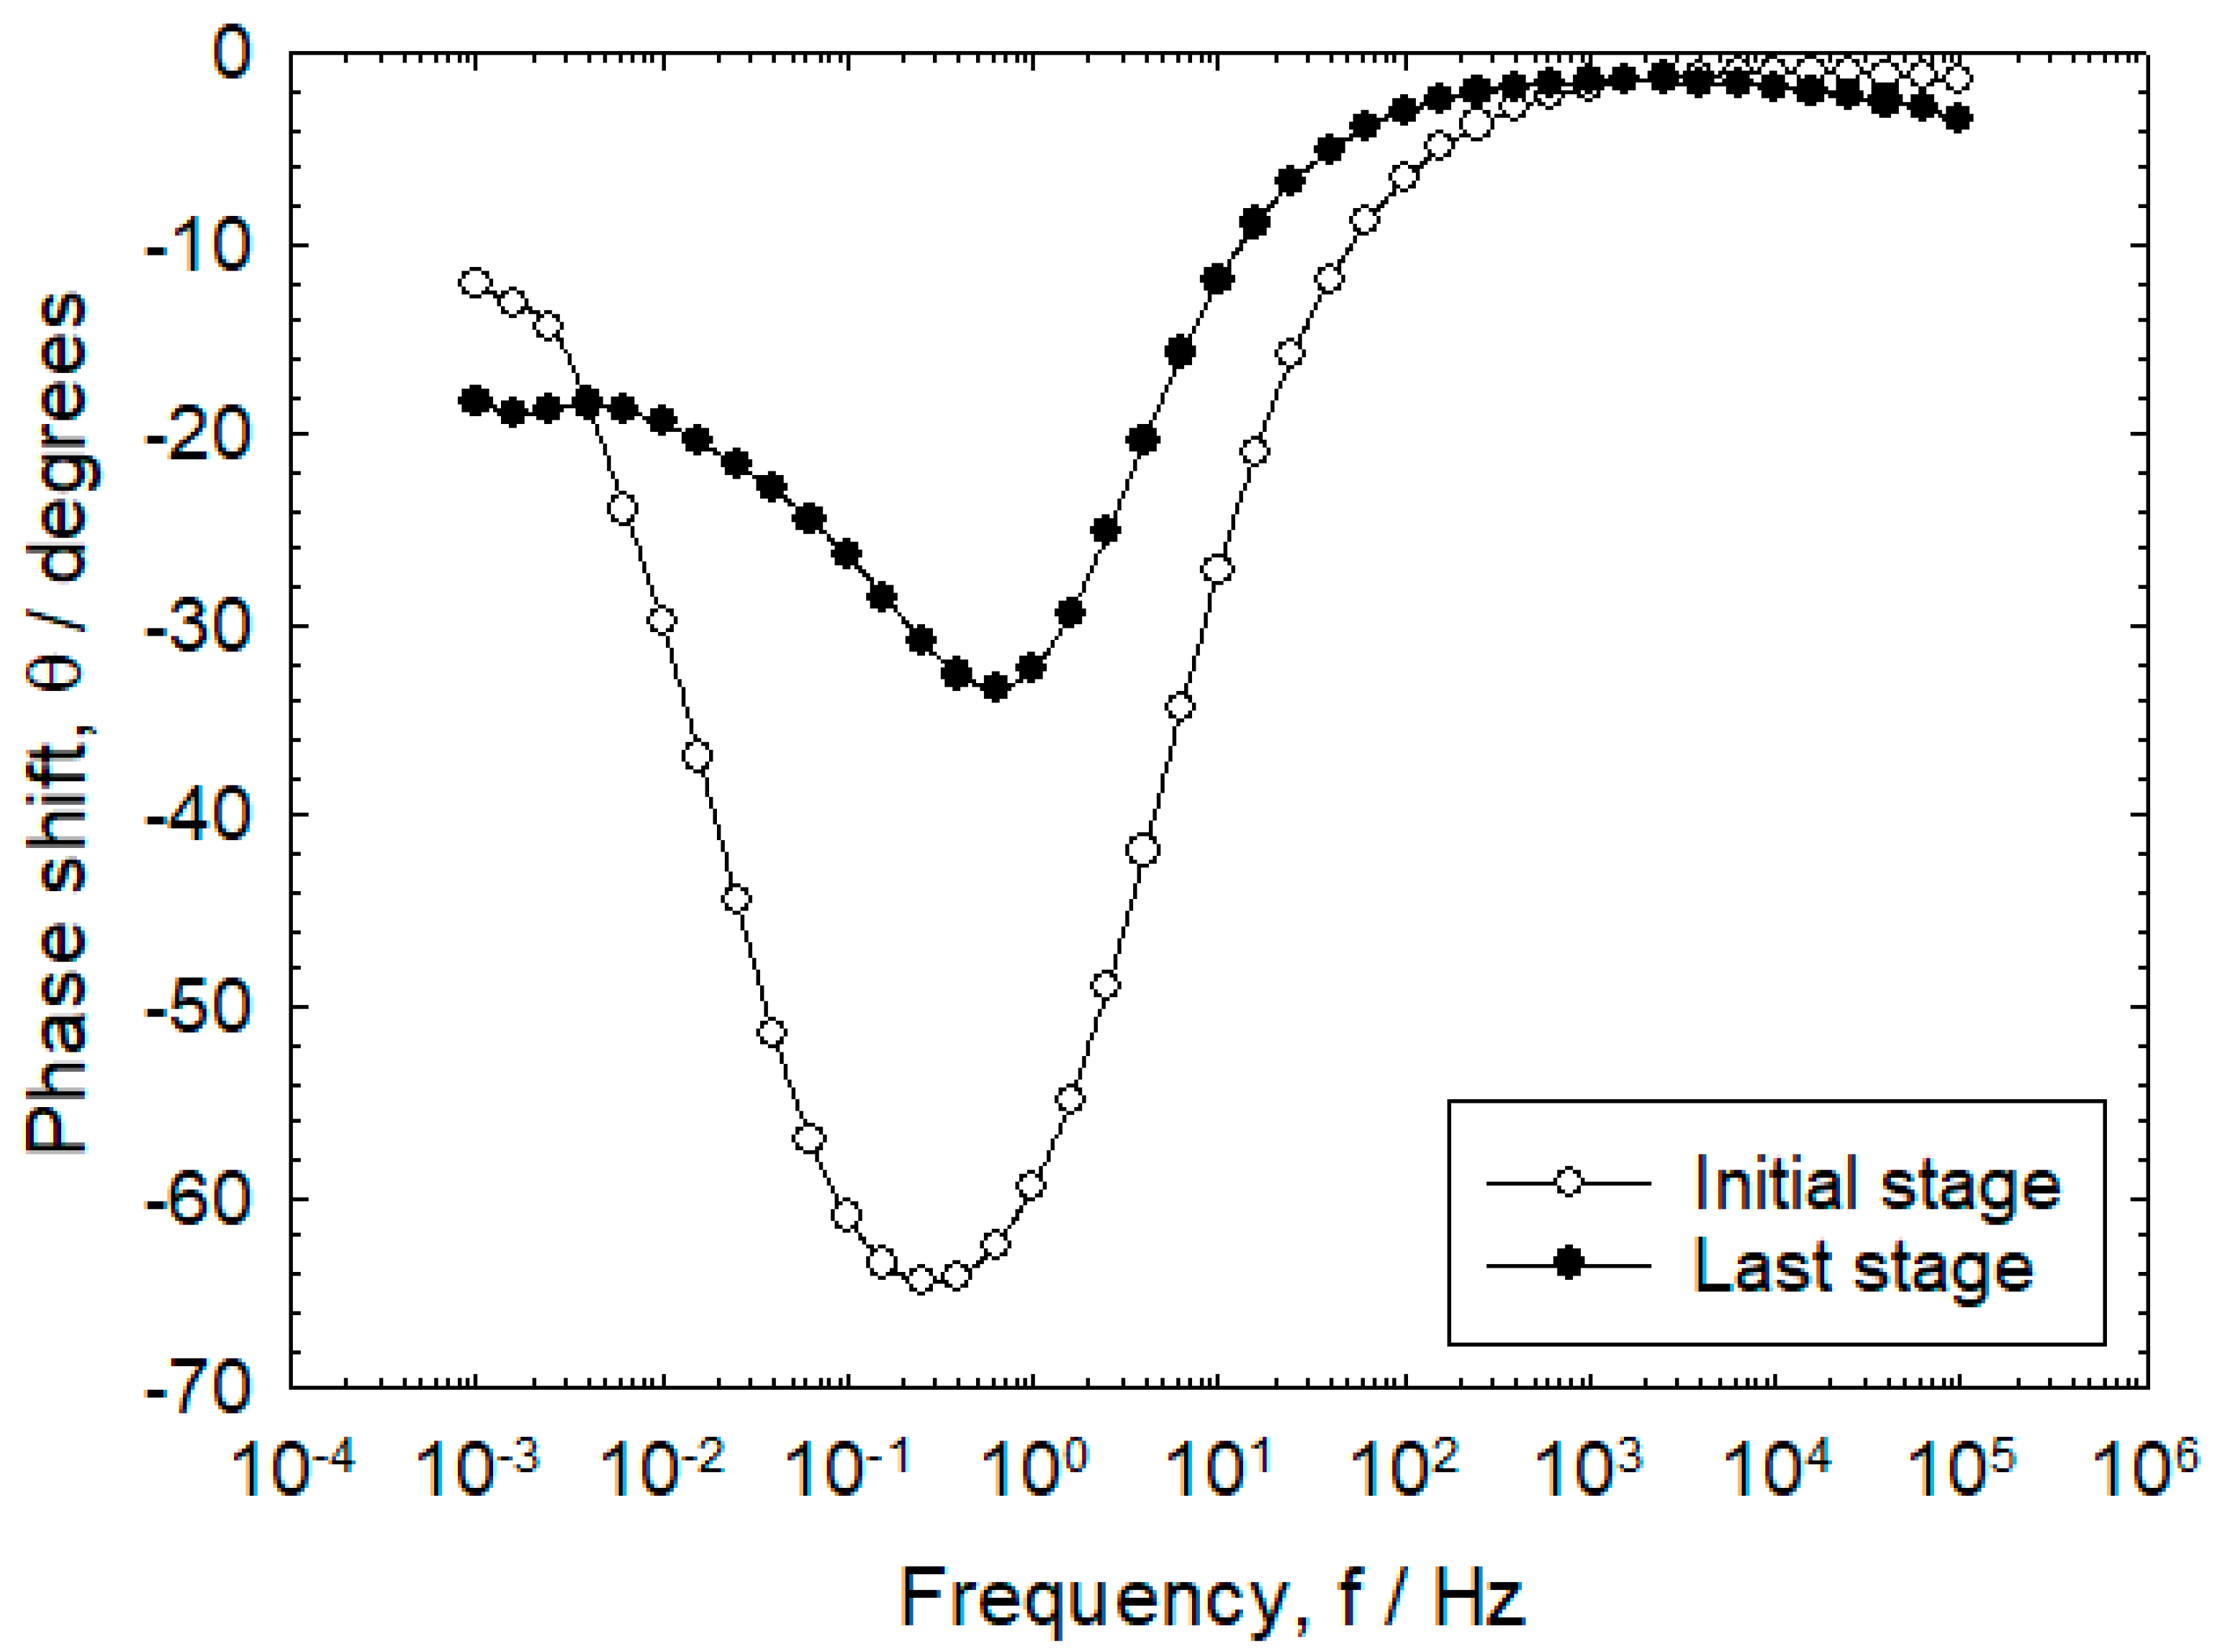
- During the early stage of wet–dry cycle, the rebar/mortar is represented by a simple equivalent circuit. As the wet–dry cycle progresses, chloride ion penetration would cause the charge transfer resistance to decrease. Meanwhile, the Warbug impedance that represents oxygen diffusion in the mortar was detected in the low frequency range.
- During the drying stage, both corrosion rate and Rs of the rebars were observed to increase rapidly. The Rs value was observed to become higher under dry condition, which is attributed to thinner electrolyte layers and higher corrosion rate of the rebar. The high corrosion rate indicates formation of oxide layers during the drying cycle.
- During monitoring of the corrosion rate via AC impedance, accurate measurement of the polarization resistance was ensured by compensating the IR drop based on the dry state of the specimen and quantity of corrosion products found on the rebar surface.
- The value of the polarization resistance corrected using Rs was different from the polarization resistance without Rs correction, attributed from drying condition, rust layer, distance between electrodes.
- The percent error (%) of the charge transfer resistance and polarization resistance derived from the fitting of Nyquist plots with the experimental results at 10 mHz/10 kHz was observed to decrease with increasing wet–dry cycles.
Author Contributions
Funding
Conflicts of Interest
References
- Sohail, M.G.; Kahraman, R.; Alnuaimi, N.A.; Gencturk, B.; Alnahhal, W.; Dawood, M.; Belarbi, A. Electrochemical behavior of mild and corrosion resistant concrete reinforcing steels. Constr. Build. Mater. 2020, 232, 117205. [Google Scholar] [CrossRef]
- Dong, S.-G.; Lin, C.-J.; Hu, R.-G.; Li, L.-Q.; Du, R.-G. Effective monitoring of corrosion in reinforcing steel in concrete constructions by a multifunctional sensor. Electrochim. Acta 2011, 56, 1881–1888. [Google Scholar] [CrossRef]
- Cao, M.; Liu, L.; Yu, Z.; Fan, L.; Li, Y.; Wang, F. Electrochemical corrosion behavior of 2A02 Al alloy under an accelerated simulation marine atmospheric environment. J. Mater. Sci. Technol. 2019, 35, 651–659. [Google Scholar] [CrossRef]
- Lu, S.; Wang, Z. Macro-Cell Current Measured by Tower-Type Sensor in Chloride-Contaminated Mortar. IEEE Sens. J. 2011, 11, 1711–1712. [Google Scholar] [CrossRef]
- Lu, S.; Ba, H.-J. Corrosion sensor for monitoring the service condition of chloride-contaminated cement mortar. Sensors 2010, 10, 4145–4158. [Google Scholar] [CrossRef] [PubMed]
- Mu, X.; Wei, J.; Dong, J.; Ke, W. In Situ Corrosion Monitoring of Mild Steel in a Simulated Tidal Zone without Marine Fouling Attachment by Electrochemical Impedance Spectroscopy. J. Mater. Sci. Technol. 2014, 30, 1043–1050. [Google Scholar] [CrossRef]
- Chi, L.; Wang, Z.; Lu, S.; Zhao, D.; Yao, Y. Development of mathematical models for predicting the compressive strength and hydration process using the EIS impedance of cementitious materials. Constr. Build. Mater. 2019, 208, 659–668. [Google Scholar] [CrossRef]
- Ribeiro, D.V.; Abrantes, J.C.C. Application of electrochemical impedance spectroscopy (EIS) to monitor the corrosion of reinforced concrete: A new approach. Constr. Build. Mater. 2016, 111, 98–104. [Google Scholar] [CrossRef]
- Jeong, J.-A. Consideration on the Risk of Corrosion Assessment in Reinforced Concrete Structure by Corrosion Potential Criterion. Corros. Sci. Technol. 2015, 14, 147–152. [Google Scholar] [CrossRef]
- Kim, J.K.; Nishikata, A.; Tsuru, T. Impedance Characteristics of Reinforcing Steel in Mortar and Corrosion Monitoring. Zairyo-to-Kankyo 2002, 51, 57–67. [Google Scholar] [CrossRef]
- Nishikata, A.; Zhu, Q.; Tada, E. Long-term monitoring of atmospheric corrosion at weathering steel bridges by an electrochemical impedance method. Corros. Sci. 2014, 87, 80–88. [Google Scholar] [CrossRef]
- Ryl, J.; Darowicki, K. Impedance Monitoring of Carbon Steel Cavitation Erosion under the Influence of Corrosive Factors. J. Electrochem. Soc. 2008, 155, P44–P49. [Google Scholar] [CrossRef]
- Nishikata, A.; Ichihara, Y.; Tsuru, T. Electrochemical impedance spectroscopy of metals covered with a thin electrolyte layer. Electrochim. Acta 1996, 41, 1057–1062. [Google Scholar] [CrossRef]
- Nishikata, A.; Ichihara, Y.; Tsuru, T. An application of electrochemical impedance spectroscopy to atmospheric corrosion study. Corros. Sci. 1995, 37, 897–911. [Google Scholar] [CrossRef]
- Haruyama, S.; Tsuru, T. STP727 Electrochemical Corrosion Testing ASTM; ASTM International: West Conshohocken, PA, USA, 1981. [Google Scholar]
- Yadav, A.P.; Nishikata, A.; Tsuru, T. Electrochemical impedance study on galvanized steel corrosion under cyclic wet–dry conditions––influence of time of wetness. Corros. Sci. 2004, 46, 169–181. [Google Scholar] [CrossRef]
- Yadav, A.P.; Katayama, H.; Noda, K.; Masuda, H.; Nishikata, A.; Tsuru, T. Effect of Fe–Zn alloy layer on the corrosion resistance of galvanized steel in chloride containing environments. Corros. Sci. 2007, 49, 3716–3731. [Google Scholar] [CrossRef]
- Xia, D.-H.; Song, S.; Qin, Z.; Hu, W.; Behnamian, Y. Review—Electrochemical Probes and Sensors Designed for Time-Dependent Atmospheric Corrosion Monitoring: Fundamentals, Progress, and Challenges. J. Electrochem. Soc. 2020, 167, 037513. [Google Scholar]
- Stern, M.; Geary, A.L. Electrochemical Polarization I. A Theoretical Analysis of the Shape of Polarization Curves. J. Electrochem. Soc. 1957, 104, 56–63. [Google Scholar] [CrossRef]
- Kim, J.N.; Jee, N.Y. A Study on the Distribution of Stern-Geary Constant for Calculating the Corrosion Current Density of Steel Reinforcement in Concrete by Means of the Polarization Resistance Method. Korea Soc. IT Serv. 2007, 11, 113–121. [Google Scholar]
- Macdonald, D.D. Reflections on the history of electrochemical impedance spectroscopy. Electrochim. Acta 2006, 51, 1376–1388. [Google Scholar] [CrossRef]
- BRE. Digest 444 Corrosion of Steel in Concrete: Part 2—Investigation and Assessment Building Research Establishment; BRE: Bracknell, UK, 2000. [Google Scholar]
- Joh, S.H.; Lim, Y.C.; Ismail, M.; Lee, H.S. Fundamental Study on Developing Embedded Miini- Sensor for Nondestructive Diagnosis Corrosion of Rebar. J. Korea Inst. Struct. Maint. Insp. 2010, 14, 179–186. [Google Scholar]
- Jones, D.A. Principles and Prevention of Corrosion, 2nd ed.; Prentice Hall: Upper Saddle River, NJ, USA, 1996; ISBN 978-0-13-359993-0. [Google Scholar]
- Kouřil, M.; Novák, P.; Bojko, M. Limitations of the linear polarization method to determine stainless steel corrosion rate in concrete environment. Cem. Concr. Compos. 2006, 28, 220–225. [Google Scholar] [CrossRef]
- Tomashov, N.D. Theory of Corrosion and Protection of Metals: The Science of Corrosion; Macmillan: New York, NY, USA, 1966. [Google Scholar]
- Shi, W.; Dong, Z.H.; Kong, D.J.; Guo, X.P. Application of wire beam electrode technique to investigate initiation and propagation of rebar corrosion. Cem. Concr. Res. 2013, 48, 25–33. [Google Scholar] [CrossRef]
- Cruz, R.P.V.; Nishikata, A.; Tsuru, T. AC impedance monitoring of pitting corrosion of stainless steel under a wet–dry cyclic condition in chloride-containing environment. Corros. Sci. 1996, 38, 1397–1406. [Google Scholar] [CrossRef]


| Specimen | Clear Cover (mm) | Distance of Rebar (mm) |
|---|---|---|
| 1 | 5 | 10 |
| 2 | 10 | 10 |
| 3 | 30 | 10 |
| 4 | 50 | 10 |
| 5 | 10 | 10 |
| 6 | 10 | 30 |
| 7 | 10 | 80 |
| Parameters | Wet Process in 2nd Cycle | Wet Process in 26th Cycle | ||||||
|---|---|---|---|---|---|---|---|---|
| Clear Cover (mm) | Clear Cover (mm) | |||||||
| 5 | 10 | 30 | 50 | 5 | 10 | 30 | 50 | |
| Rs (kΩcm2) | 0.8 | 0.7 | 1.0 | 0.9 | 2.0 | 2.2 | 2.2 | 2.6 |
| T (μFcm−2) | 63 | 44 | 48 | 45 | 98 | 83 | 84 | 45 |
| Rc (kΩcm2) | 119 | 500 | 14,284 | 15,000 | 16.9 | 20.3 | 25.5 | 101.5 |
| α1 | 0.79 | 0.88 | 0.91 | 0.89 | 0.64 | 0.64 | 0.71 | 0.87 |
| WR (Ωcm2) | - | - | - | - | 440 | - | - | - |
| WT | - | - | - | - | 752 | - | - | - |
| α2 | - | - | - | - | 0.18 | - | - | - |
| Cycles | Experimental | Fitted | Error (%) | |||||||
|---|---|---|---|---|---|---|---|---|---|---|
| Rc | Rs | Rp | Rc | Rs | Rp | Rc | Rs | Rp | ||
| 2 | Wet | 79.7 | 0.8 | 78.9 | 119.8 | 0.8 | 119.0 | 33.4 | 0 | 33.6 |
| 4 | Wet | 66.4 | 0.6 | 65.7 | 99.9 | 0.6 | 99.2 | 33.0 | 0 | 33.0 |
| Dry | 57.5 | 2.4 | 55.0 | 66.0 | 2.4 | 63.6 | 12.9 | 0 | 13.4 | |
| 18 | Wet | 18.1 | 1.9 | 16.1 | 17.5 | 1.9 | 15.5 | 3.4 | 0 | 3.9 |
| Dry | 26.7 | 4.5 | 22.1 | 25.7 | 4.5 | 21.1 | 3.8 | 0 | 4.7 | |
| 26 | Wet | 17.9 | 1.9 | 15.9 | 16.9 | 2.0 | 14.8 | 6.0 | 0 | 7.0 |
| Parameters | Wet Process in 4th Cycle | Wet Process in 18th Cycle | ||
|---|---|---|---|---|
| Clear Cover (5 mm) | Clear Cover (5 mm) | |||
| Experiment | Fitted | Experiment | Fitted | |
| Rs (kΩcm2) | 0.6 | 0.6 | 1.9 | 1.9 |
| T (μF(cm−2)) | - | 71 | - | 88 |
| Rc (kΩcm2) | 66.4 | 99.9 | 18.1 | 17.5 |
| α1 | - | 0.77 | - | 0.69 |
| WR (Ωcm2) | - | - | - | 370 |
| WT | - | - | - | 600 |
| α2 | - | - | - | 0.23 |
© 2019 by the authors. Licensee MDPI, Basel, Switzerland. This article is an open access article distributed under the terms and conditions of the Creative Commons Attribution (CC BY) license (http://creativecommons.org/licenses/by/4.0/).
Share and Cite
Kim, J.-K.; Kee, S.-H.; Futalan, C.M.; Yee, J.-J. Corrosion Monitoring of Reinforced Steel Embedded in Cement Mortar under Wet-And-Dry Cycles by Electrochemical Impedance Spectroscopy. Sensors 2020, 20, 199. https://doi.org/10.3390/s20010199
Kim J-K, Kee S-H, Futalan CM, Yee J-J. Corrosion Monitoring of Reinforced Steel Embedded in Cement Mortar under Wet-And-Dry Cycles by Electrochemical Impedance Spectroscopy. Sensors. 2020; 20(1):199. https://doi.org/10.3390/s20010199
Chicago/Turabian StyleKim, Je-Kyoung, Seong-Hoon Kee, Cybelle M. Futalan, and Jurng-Jae Yee. 2020. "Corrosion Monitoring of Reinforced Steel Embedded in Cement Mortar under Wet-And-Dry Cycles by Electrochemical Impedance Spectroscopy" Sensors 20, no. 1: 199. https://doi.org/10.3390/s20010199
APA StyleKim, J.-K., Kee, S.-H., Futalan, C. M., & Yee, J.-J. (2020). Corrosion Monitoring of Reinforced Steel Embedded in Cement Mortar under Wet-And-Dry Cycles by Electrochemical Impedance Spectroscopy. Sensors, 20(1), 199. https://doi.org/10.3390/s20010199