1. Introduction
Wireless sensor networks (WSNs) have emerged as a promising technology for various application scenarios, such as battlefield monitoring, emergency response, environmental monitoring, and healthcare monitoring. However, WSNs are vulnerable to various threats because they are usually deployed in a hostile or harsh environment [
1]. Sensor nodes in WSNs are captured relatively easily by attackers, and then act as malicious nodes that launch various attacks, such as selective forwarding, wormhole, sinkhole, hello flooding, and Sybil [
2,
3,
4]. Malicious nodes drop some or all packets, so some important data cannot reach the sink node if the routing protocol is not immune to such attacks. Even worse, the network might partly or completely fail. The traditional routing mechanisms were designed for data transmission and are thus not applicable to WSNs in the presence of malicious nodes. Furthermore, routing in WSNs is constrained by the energy and computing capacities of sensor nodes. In recent years, the routing security of WSNs has become a hot research topic [
5,
6,
7].
The existing routing protocols for WSNs cannot effectively balance security and energy consumption [
8,
9,
10]. Most of these protocols rely on encryption and trust mechanisms to guarantee security. Although encryption can help WSNs to resist specific types of network attacks, the routing protocols embedded with encryption are vulnerable to other types of network intrusions, which will result in more energy consumption. With more routing paths, we can improve the resilience of these protocols, but the construction and maintenance of extra routes result in more consumption of the energy and storage space of sensor nodes. Trust-based routing protocols can resist various types of attacks, but the calculation of trust values always uses very high memory and consumes substantial energy. The existing routing protocols are typically optimized for energy consumption; thus, a complete route for a pair of nodes is normally generated by augmenting the current path one hop at a time. However, the generated routes are not globally optimal and may fail to work in the presence of malicious attacks. Therefore, it is very hard for existing routing protocols to find a secure route that can balance security and the constraints on the computing and battery capacities of WSNs.
In this paper, we propose a new secure routing protocol for WSNs in the presence of malicious nodes. The protocol finds a secure route by taking into account both the trust value and the status of each relay node in the route. We use attack probability to represent the trust of each sensor node, and the trust value is calculated by the historical communication behaviors of the sensor node and the trust information of its neighbors. With the trust value, we can forecast the future behaviors of the sensor node. Furthermore, we can use the associated information of the sensor nodes to establish a secure route for data transmission between a pair of sensor nodes, which can effectively eliminate interference from malicious nodes. Some sensor nodes may have incomplete information, so we also leverage the indirect trust value from other nodes to enhance the accuracy of the direct trust value.
Our secure routing protocol chooses one sensor node at a time to improve the success rate of data communication without identifying the type of attack. In particular, a sensor node that has more residual energy and is closer to the sink node is selected as the next relay node. Thus, we can reach a trade-off between security and energy consumption for each sensor node. In addition, all secure routes are constructed via the serial–parallel system theory of the classical reliability theory, which guarantees the global optimization of our solution. It is able to not only resist various attacks, but also to choose a route with little interference and no fault in the wireless communication environment.
The contributions of this work can be summarized as follows:
We propose a globally optimal secure routing method in the presence of malicious nodes. In this method, the security, energy consumption, and load balance of the entire path are comprehensively evaluated by sensing the status and trust of nodes in the network so that the optimal route is found.
On the basis of the sensed trust value and status, an information-aware secure routing evaluation method is proposed in this paper. A secure route is evaluated by a cost function, which is a comprehensive evaluation of the associated information of the nodes in the path, i.e., the trust value of the path from the source node to the sink node and the status of each node in the path, where the status of a node is a hybrid metric determined by the residual energy of the node and the distance to the sink.
In the same simulation environment, compared with the Reputation-Based Mechanism to Stimulate Cooperation (RBMSC) model [
11], the proposed model can maintain a higher delivery ratio, which verifies the effectiveness of the proposed model on the basis of global optimization. Furthermore, compared with the traditional Dijkstra algorithm, the packet loss ratio in the improved Dijkstra algorithm is lower because it can more effectively avoid malicious nodes, thus verifying the effectiveness of the improved algorithm.
The rest of this paper is organized as follows. In
Section 2, we summarize the ideas and methods in the existing literature.
Section 3 presents the secure routing model based on information-aware sensor nodes in WSNs. In
Section 4, we show the implementation of the proposed secure routing model using an improved Dijkstra algorithm. In
Section 5, the effectiveness of our model and algorithm is evaluated by five groups of simulations. Finally, the conclusion and future studies are provided in
Section 7.
2. Related Work
In recent years, numerous research works have addressed the problem of secure routing in WSNs. The existing methods for secure routing fall into five categories.
In addition, there are some other types of secure routing models. The authors of [
38] developed a secure routing protocol named the Trust–Distrust Protocol. Trust (or distrust) of the nodes is graded according to the fitness value obtained by tests and calculations in the protocol. The authors of [
39] proposed a trust-based scheme that enforces collaborative behavior in wireless mobile networks by taking peers’ attributes into consideration for an efficient routing scheme. A personalized similarity algorithm for modeling peers’ attributes was introduced as a scaling factor for trust evaluation. The authors of [
40] proposed a time-based trust-aware routing protocol for Low-Power and Lossy Networks (SecTrust-RPL). The proposed SecTrust framework is mapped to the Routing Protocol for Low-Power and Lossy Networks (RPL) and provides a new trust-aware RPL protocol.
Although most of the existing routing protocols for WSNs can meet security requirements, they cannot effectively balance security and energy consumption. In this paper, we propose a hybrid model that combines the directed graph model with the weighting trust model, and we refer to the serial–parallel system in classical reliability theory to achieve secure routing construction. In the model, the calculation of trust values is simplified so that it can effectively balance security and energy consumption.
3. Model and Methods
In this section, the system model is presented first, and then the methods designed for secure routing in WSNs are discussed in detail.
3.1. System Model
We assume that a WSN consists of n nodes and adopts a mesh-network structure as its topology. For a WSN , , N represents the set of sensor nodes, E represents the set of edges connecting the nodes, and is an edge of E} and is a set of weights associated with edges. G has a unique source node () and sink node (). For any two nodes s and d of V, a transmission path of length K is a K-hop path between them, where , , and is an edge of E, ∀i . Consequently, a path from the source to the sink in G can be written as . Along with a multi-hop path to the sink, data can be transmitted to the destination. However, in the presence of malicious nodes (i.e., some nodes of G are captured by attackers and act as malicious nodes), a K-hop path cannot guarantee successful data transmission between and .
3.2. Attack Model
In a WSN, a node captured by an attacker becomes a malicious node that initiates an internal attack on other nodes. We consider the selective forwarding attack [
41] as an attack model. In a selective forwarding attack, an attacker selectively drops some or all packets so valid data cannot be received. Therefore, the normal collection of data is disrupted. The attack behaviors of such attack nodes are less frequent and disruptive than those of ordinary attack nodes, but they are beyond those of the normal nodes. Therefore, the selective forwarding attack is not easily identified by the detection mechanism.
3.3. Attack Behavior Description
The trust value of a node comprises the statistics of historical behaviors and the probability prediction of future behaviors of the node. In our approach, the trust value of a node is evaluated according to its historical communication behaviors. The behavior of a node is divided into normal behavior and abnormal behavior, which is established by evaluating whether the node forwards packets normally.
In this work, sensor nodes can be divided into four categories: Normal nodes, malicious nodes, fault nodes, and dead nodes. According to the attack model in
Section 3.2, normal nodes forward the received packets to the next-hop nodes normally, while malicious nodes discard some or all packets deliberately. To simplify the model, we view both fault nodes and dead nodes as malicious nodes because all three types have a significantly increased packet loss ratio.
3.4. Behavior Collection
According to the above description, abnormal behavior is mainly reflected by whether the packet is successfully forwarded. Promiscuous monitoring is usually adopted to detect the forwarding packet behaviors of nodes, but this method is not appropriate for WSNs because it leads to large energy consumption by nodes. In our method, packet transmission is confirmed by adopting the two-hop acknowledgment mechanism, which can confirm whether the packet is successfully forwarded by the Acknowledge character (ACK) packet. The working principle is as follows. Node i sends a packet to node j. If node j forwards the packet to node k, then node i will receive ACK packets from node j and node k, indicating that node j is behaving normally. Otherwise, node j is behaving abnormally. It is also presumed that node j is behaving abnormally if the ACK packets are not received within the upper bound of time that we set.
3.5. Attack Probability
Malicious nodes in the WSN can initiate internal attacks, so we have to find a secure route to guarantee successful data transmission. We use attack probability to evaluate the trust of a route between two nodes. In the next two subsections, we calculate the attack probabilities of a node and a K-hop path, respectively.
3.5.1. Attack Probability of the Sensor Node
To find the optimal relay node for a given node
i, we have to calculate the attack probabilities of its adjacent nodes.
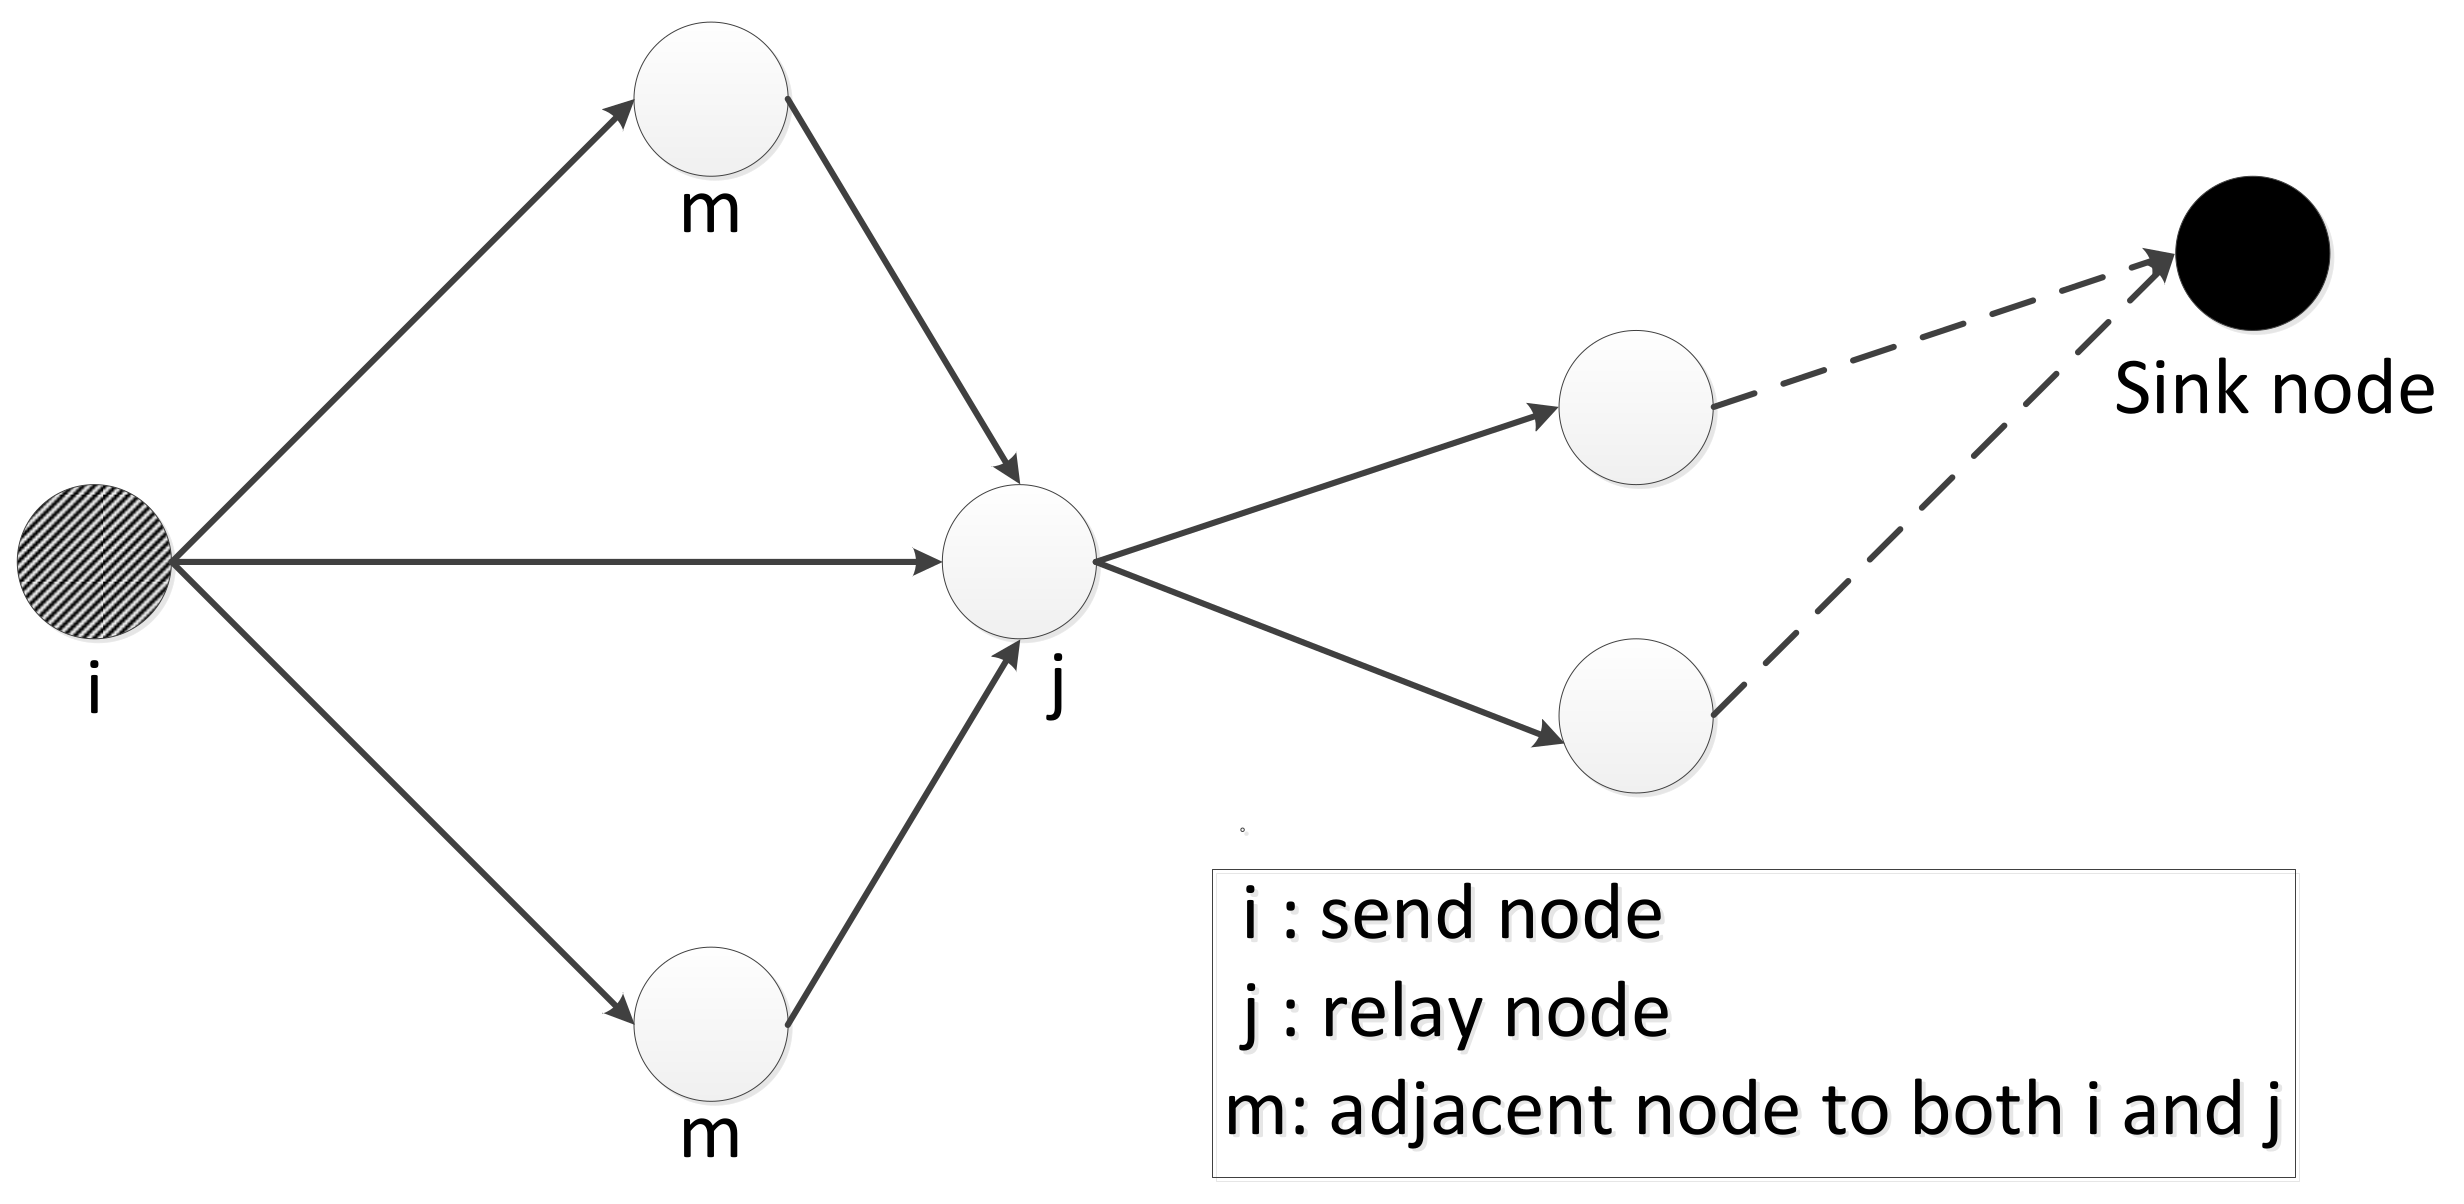
Figure 1 and
Figure 2 show the calculation method of the attack probability. As shown in
Figure 1 and
Figure 2, for an adjacent node
j of
i, we use the former communication behaviors between them to calculate the attack probability. The attack probability
of
j to
i consists of two parts: (1) Direct attack probability
and (2) indirect attack probability
.
Equation (
1) shows the method of calculating the direct attack probability of
j according to its former communication behaviors with
i.
where
is the number of packets sent from
i to
j, and
is the number of packets successfully forwarded by node
j in the past. The direct attack probability is defined as the packet loss ratio of node
j, i.e., the ratio between the number of lost packets and the number of packets sent to
j from
i.
The indirect attack probability, as shown in Equation (
2), calculates the attack probability of
j according to the former communication behaviors with the nodes that are adjacent to both
i and
j [
11].
where
m is a node that is adjacent to both
i and
j,
is the trust value of node
m from
i, and
r is the number of nodes that are adjacent to both
i and
j. The indirect attack probability of node
j is determined by the attack probability of
j to
m. It is a weighted average of the direct attack probabilities of
j to all nodes that are adjacent to both
i and
j. In this way, even if there are some nodes that deliberately reduce the attack probability of a malicious node by propagating an error value, the attack probability of a malicious node can be calculated by other nodes. Thus, the error has little influence on the overall attack probability, and collusion attacks can be resisted.
Summarizing Equations (
1) and (
2), we have the attack probability of node
j, as follows:
3.5.2. Attack Probability of a K-Hop Path
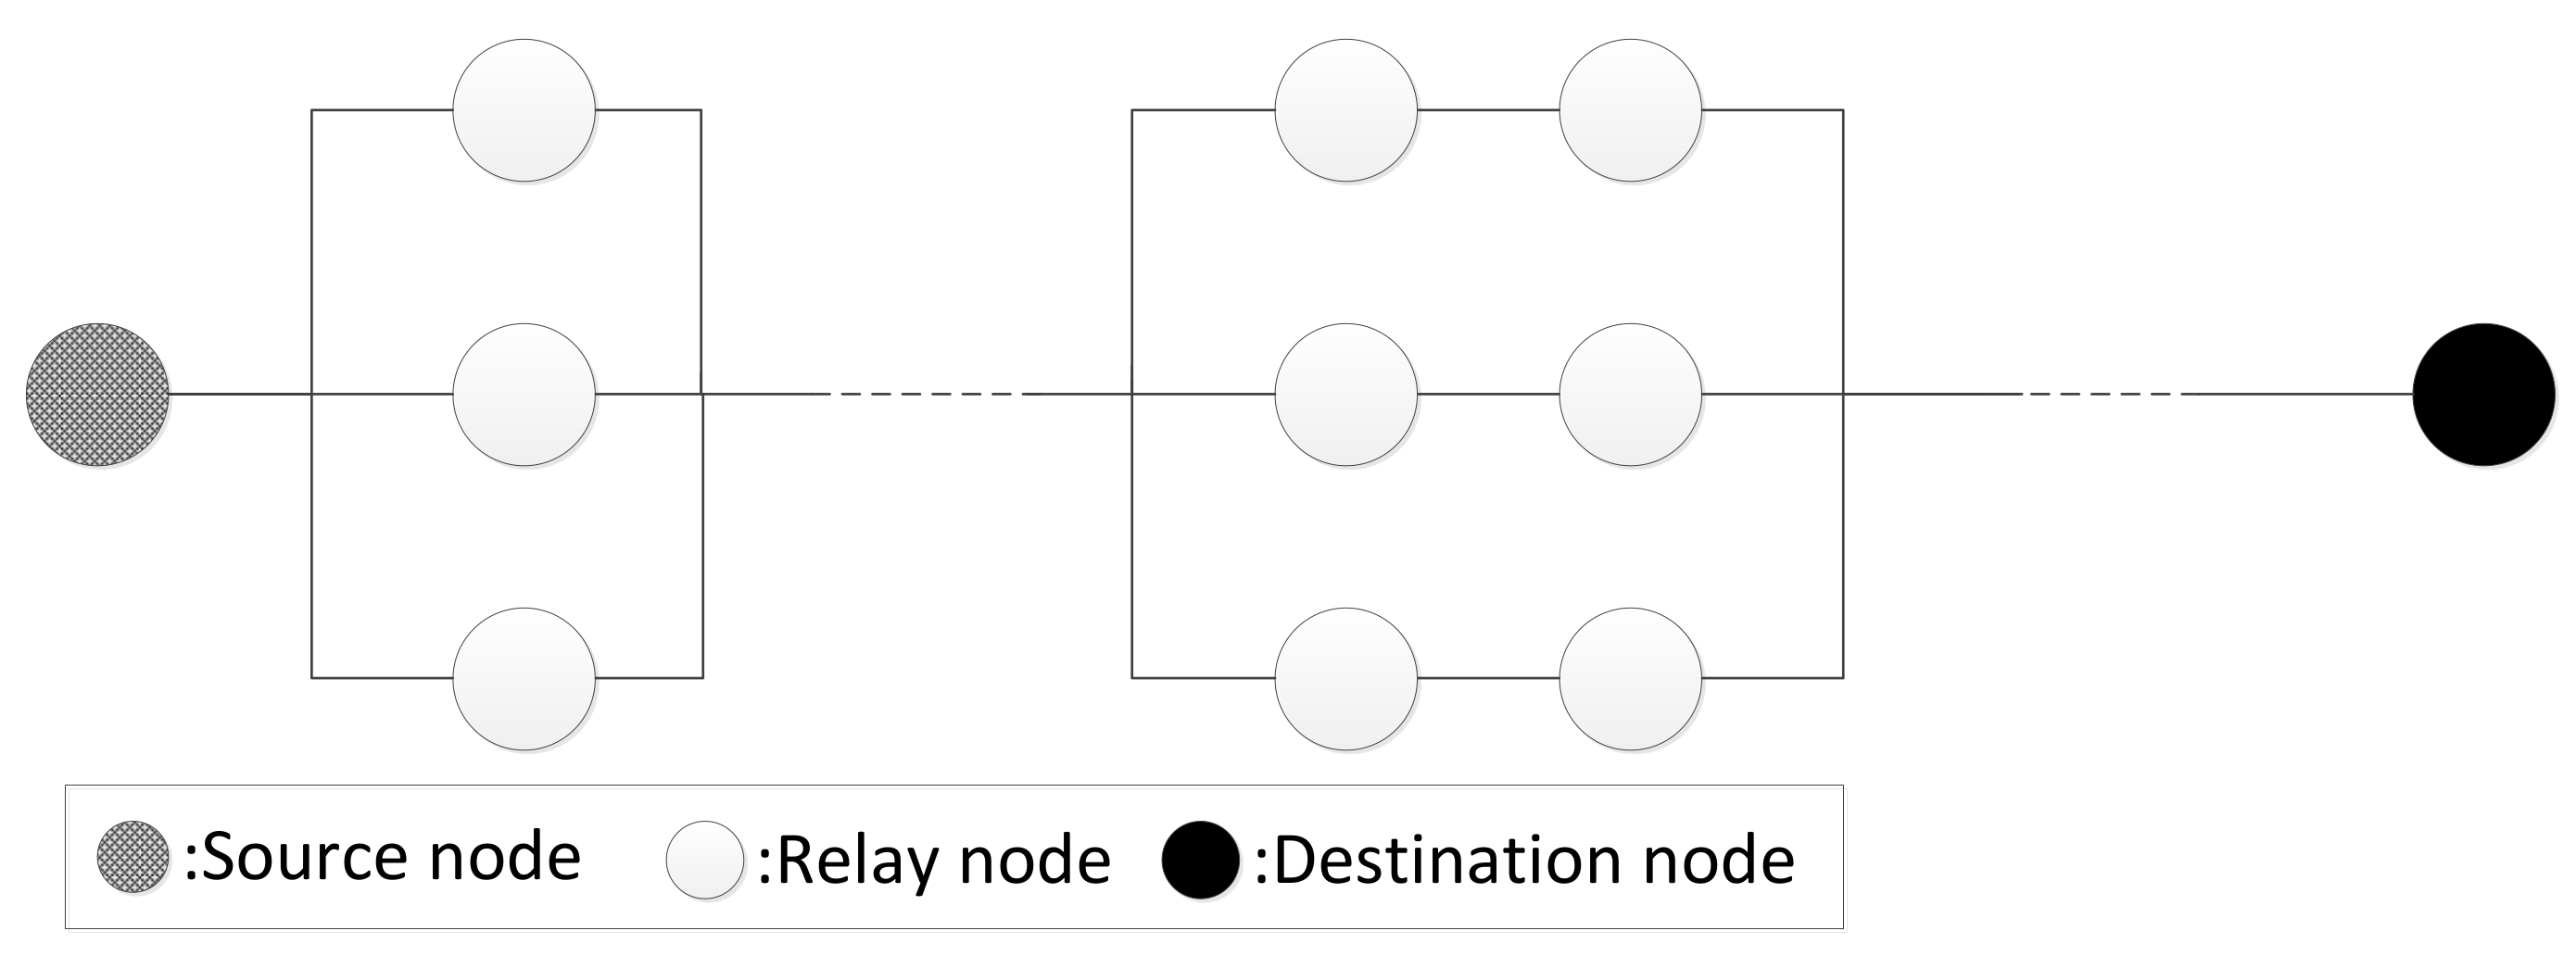
As shown in
Figure 3, a WSN is very similar to the serial–parallel system in classical reliability theory. A route between two nodes in a WSN can be seen as a serial system, and the WSN can be viewed as a complex parallel system because there is more than one route for each pair of nodes. Data can be transmitted along parallel routes. Data can be successfully transmitted to the sink node along a specific route only if all nodes in the route work normally. Therefore, the nodes in a route can be viewed as a serial system of independent components.
According to the serial system theory, the attack probability of a path (
) can be calculated as follows:
where
K is the number of hops.
3.6. Status of Sensor Nodes
In the WSN, the status of each node
j is associated with two values: (1) The residual energy and (2) its distance to the sink node. The status of each node is used as a heuristic to find the optimal secure route. A node with more residual energy that is closer to the sink node is chosen as the next-hop node. To balance the energy consumption and transmission delay for a sensor node, we define a status value for each node:
where
is the energy required to send a packet from
j to the sink, and
is the residual energy of node
j. We use a constant
to balance the weight of
and
.
With Equation (
5), we can designate a node as the next hop if it has more residual energy and is closer to the sink. We further define the value
for the entire path:
The value of the entire path is obtained by adding the status values of each node. is normalized to ensure that it is always less than 1.
3.7. Information-Aware Secure Routing (IASR)
Each node in the WSN is associated with information such as the trust value (attack probability) and status (residual energy and the distance to the sink). We use the attack probability to represent the trust value of a node, and we use the energy consumption required for sending packets from a node to the sink to reflect the distance from the node to the sink.
The secure routing model is information-aware [
42]. In this model, each sensor node chooses a path to the sink so as to minimize its cost in the presence of malicious nodes. From the node information collected, the current and future trust value and status of each adjacent node are sensed by the proposed cost function. Therefore, the minimum cost relay node will be found. The cost function for a node accounts for three aspects: (1) The attack probability for the path from itself to the sink, (2) the residual energy of each node in the path, and (3) the distance from each node in the path to the sink.
When a node
n senses data and transmits it to the sink, it chooses a relay node
from its adjacent nodes and then forms a
K-hop transmission path
to the sink in turn. The cost function of node
n consists of two parts,
and
, which are calculated with the attack probabilities and status values of nodes in the path, respectively.
The cost function of
n is
Equations (7)–(9) show that the cost of a node n is determined by the qualities of the current hop in the path and the cost of the adjacent node chosen by n; thus, global optimization can be ensured.
4. Algorithm
First, we distinguish two types of shortest paths in a WSN G: (1) The single-source shortest path is the shortest path with a designated source node, and (2) the single-destination shortest path is the shortest path with a designated destination node.
The original problem to be solved in this paper is to find the single-destination shortest path. If we invert the direction of all edges in such a path, we turn it into a single-source shortest path. Therefore, the problem can actually be regarded as the computation of all the shortest paths with a designated sink node in a weighted directed graph, which can be solved by the Dijkstra algorithm [
43,
44]. In addition, after the problem is converted, the weight is calculated according to the original direction, in order to ensure correctness; that is, the direction of each edge in the graph is not inverted in the actual calculation.
In the Dijkstra algorithm, the cost (weight) of the edge is generally represented by the distance between two nodes. The cost of the path between any two nodes is the sum of the cost of all edges in the path. In contrast, the weight
in Equation (
9) is a hybrid value of the secure cost and the status of the nodes in the path. Therefore, the shortest path in the Dijkstra algorithm is replaced by the minimum cost path in our model.
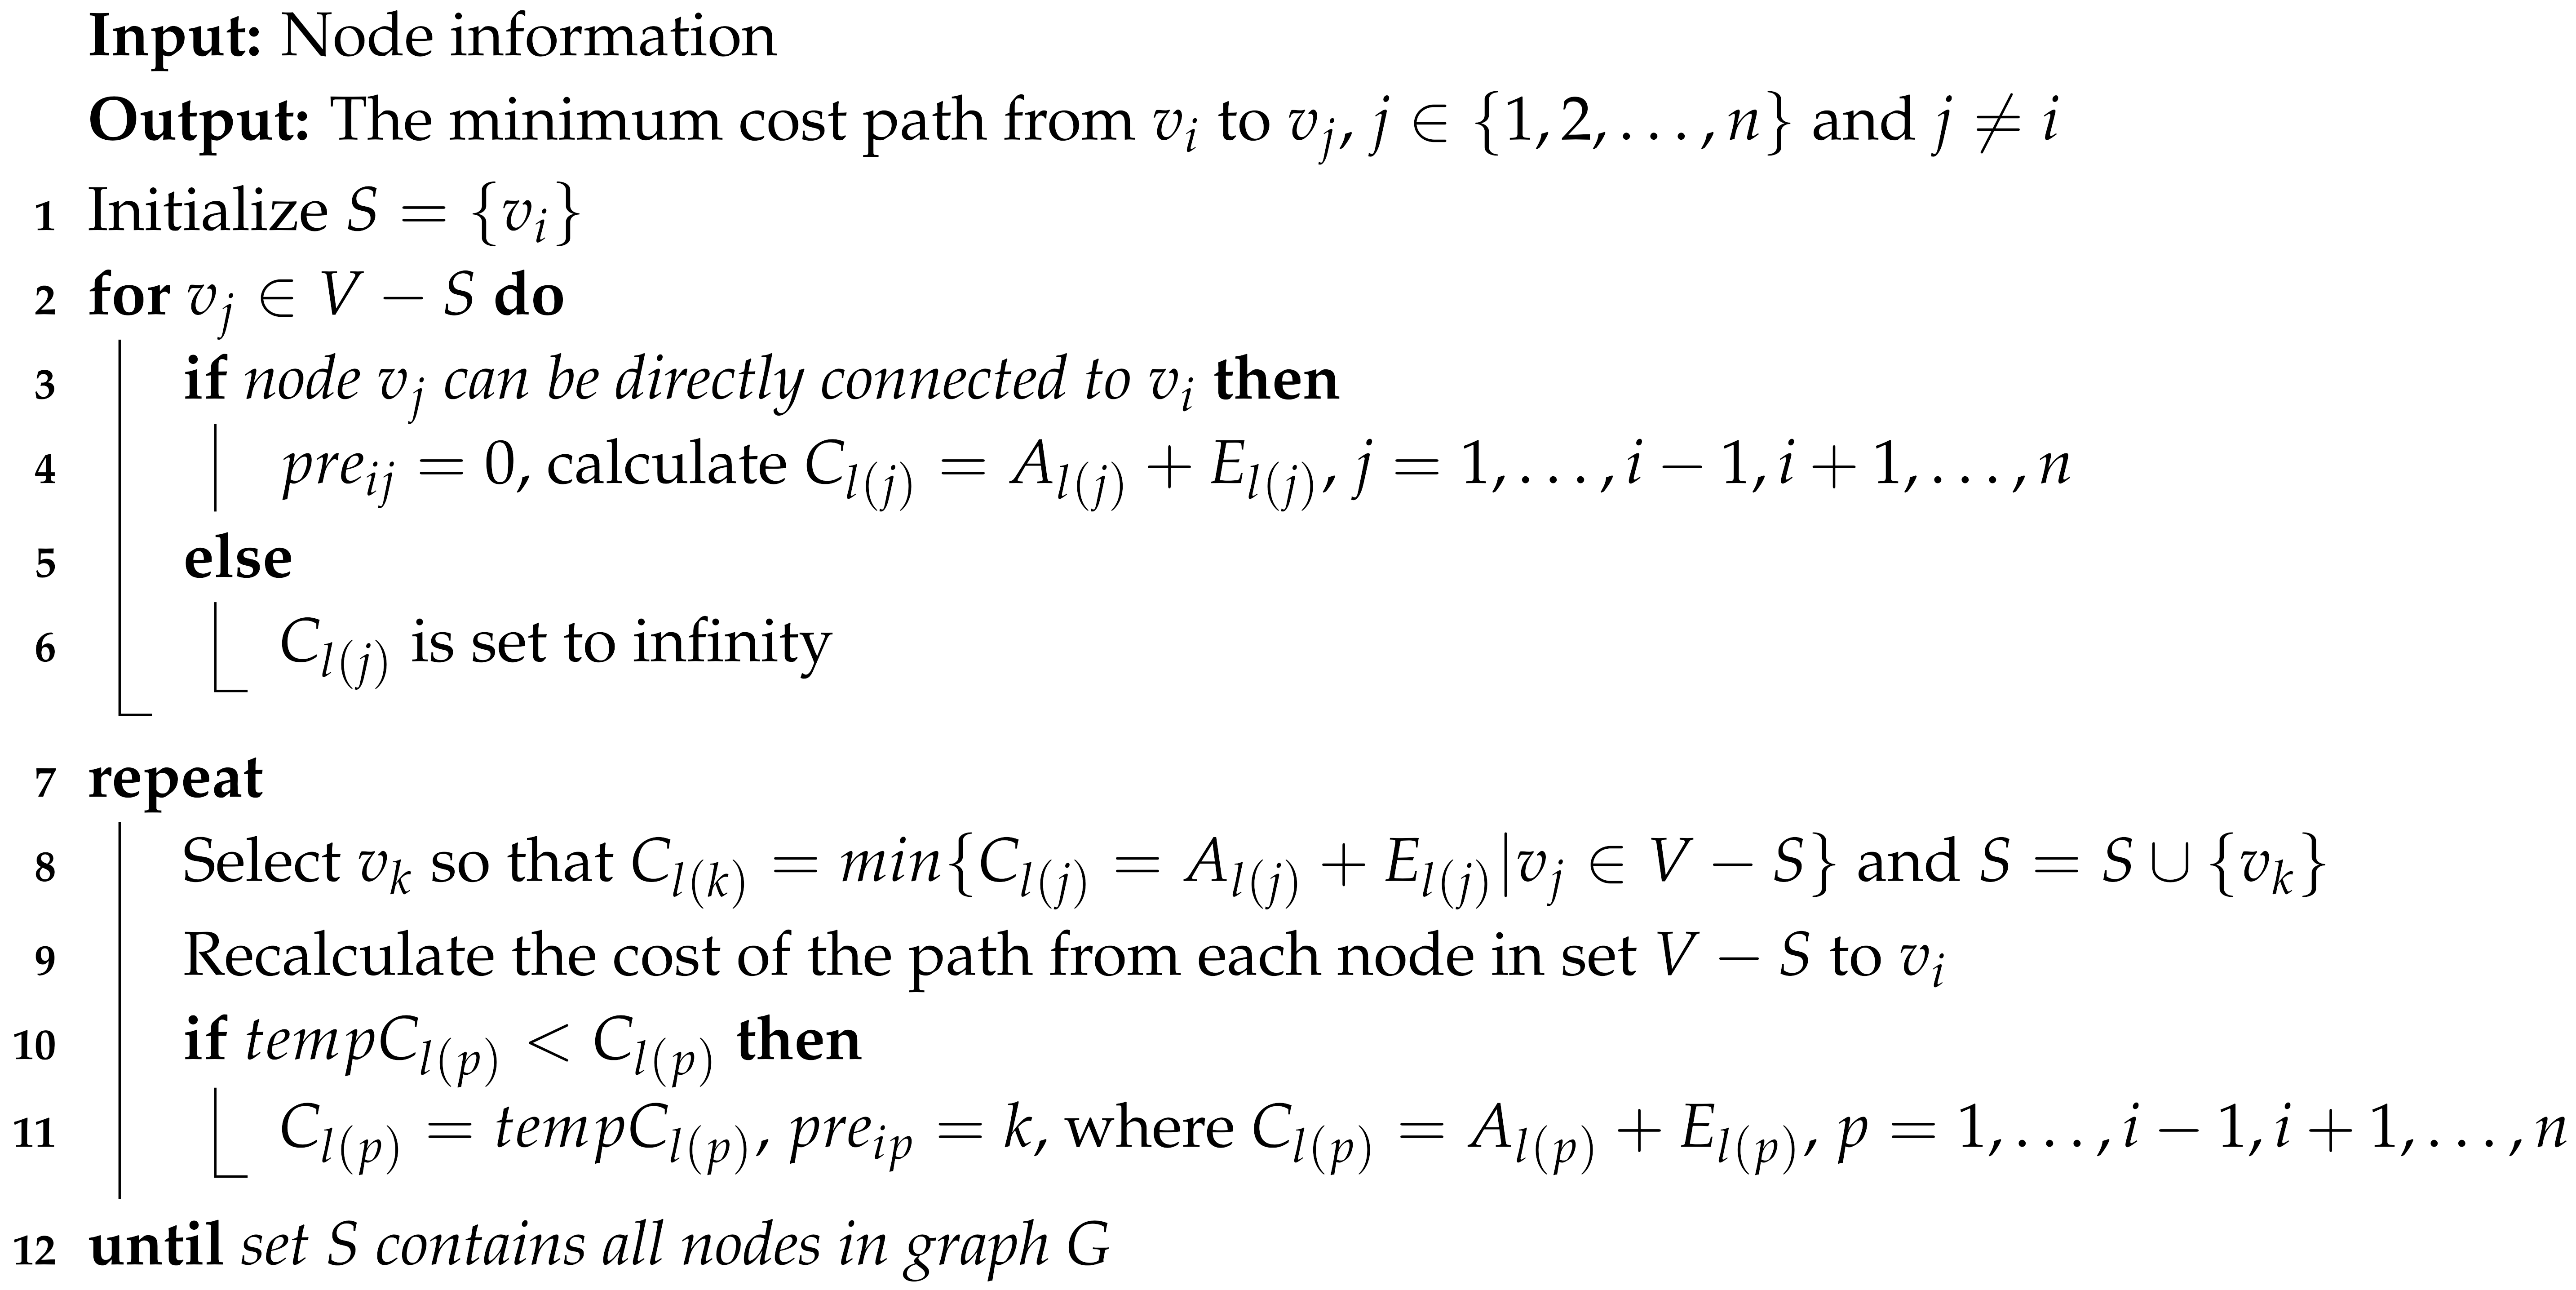
Algorithm 1 depicts the idea for computing the path with the minimum cost. We first illustrate the notations used in Algorithm 1:
The sink node is designated as source node .
V denotes the set of all vertices (). S denotes the set of destination nodes that have found the minimum cost path. denotes the set of nodes that have not found the minimum cost path.
denotes the cost of the minimum cost path from node to source node . denotes the cost of the reconstructed minimum cost path from node to source node .
denotes the intermediate nodes in the minimum cost path from node to source node .
represents the total attack probability of the nodes in the entire path from node to source node , represents the total status value of the nodes in the entire path from node to the source node , and .
Initially,
S only has source node
, i.e.,
. If source node
is adjacent to node
, then we set
and calculate
. If it is not adjacent to node
, then
is set to infinity. Then, we add node
with the least cost in all nodes adjacent to set
S into set
S, and the minimum cost path from node
to source node
is thereby found. Because node
joins set
S, it is necessary to recalculate the cost of the path from each node in set
to source node
. We repeat the above steps (by repeatedly selecting the node with the minimum cost path to join set
S) until set
S contains all nodes in graph
G.
| Algorithm 1: Minimum Cost Path. |
![Sensors 20 00165 i001 Sensors 20 00165 i001]() |
Table 1 compares the improved Dijkstra algorithm and the traditional Dijkstra algorithm.
In regard to the above, the explanations are as follows.
First, it is enough for each sensor node in the network topology to know the adjacent nodes connected to itself. Second, while it is calculating the cost of the adjacent nodes, the sending node requests the adjacent node to send its associated information to itself (the information can be transmitted by means of the message packet); thus, the information of the adjacent node is enough. The associated information includes the trust value of other adjacent nodes, the location and residual energy of the adjacent node, and the cost of the path from the adjacent node to the sink. The secure route in the proposed model is reversely constructed by the Dijkstra algorithm. Therefore, the secure path from the next-hop node to the sink node has been acquired, and the cost value of the path has been calculated in the previous procedure. In the process of secure route selection, it is unnecessary to distribute the information to the whole network, since the local information is enough. In summary, the proposed model can obtain the global optimal path from the source node to the sink node using only the local information obtained.
5. Simulations
5.1. Scene Setting
In this study, a Virtual Machine (Ubuntu 18.04.2 LTS) and Network Simulator version 3 (NS-3.28) were employed to assess the performance of the proposed model. Simulations were conducted using a simulated WSN, in which 100 nodes were randomly deployed in a m square and interconnected with a mesh network. Every node was assigned with the same initial energy and communication radius. Nodes can be divided into four categories: Normal nodes, malicious nodes, fault nodes, and dead nodes. To simplify the model, we view the fault nodes and dead nodes as malicious nodes, so all nodes in the WSN are one of two types.
The energy consumption required for the communication between a pair of nodes follows the radio energy dissipation model, as shown in
Figure 4. We can see from the figure that a transmitter has two parts—i.e., the radio electronics and the power amplifier—whereas a receiver only has radio electronics. The signal transmitting power in the wireless transmission is exponentially attenuated as the transmission distance increases. This loss can be compensated by the power amplifier. The free space model is employed when the distance between the transmitter and the receiver is less than a threshold
. When the distance is greater than or equal to
, the multipath fading model is adopted. The energy consumed by the sensor node sending the message (
l-bit) to the receiver (the distance between the transmitter and the receiver is
d) is expressed as follows [
45]:
The energy consumed to receive the message (
l-bit) is
where
is the energy consumption required for electronic devices to accept and transmit 1-bit data.
and
represent the free space factor and multipath fading factor, respectively.
5.2. Parameter Setting
The parameters in the model are listed in
Table 2 and
Table 3. The parameters may change in different application scenarios.
5.3. Simulation Setup
We ran several simulations to verify the validity of the proposed routing scheme. We calculated the packet loss ratio and delivery ratio in the WSN as follows:
In the two equations, S is the number of packets sent by the source nodes, and R and are the number of packets received by the sink node and the number of lost packets, respectively.
We conducted five groups of simulations to verify the safety and reliability of the proposed routing scheme. In the simulations, we considered two packet-forwarding schemes used by malicious nodes: (1) Random packet loss (RPL), in which a malicious node randomly discards some packets that are supposed to be relayed, and (2) full packet loss (FPL), in which all received packets are dropped. RPL is more confusing and not easily detected (such as a selective forwarding attack). FPL is more harmful but easy to identify. In the G2 simulations, malicious nodes adopted both RPL and FPL schemes, while they adopted RPL in the other simulation groups. In the simulations, under the circumstance of the minimum forwarding threshold set, a node with residual energy of less than can receive packets but cannot forward them.
Simulations were divided into five groups according to the proportion of the malicious nodes in the WSN. The details about each group are as follows:
G1 Simulations: The aim of the first group of simulations was to examine the defense (tolerance) ability of the proposed routing scheme (IASR) against the malicious behavior of sensor nodes. Nodes in the WSN were randomly chosen as malicious, and we examined three levels of the proportion of malicious nodes: 20%, 40%, and 60%.
G2 Simulations: In this group of simulations, we compared the performances of the proposed secure routing model (IASR) and the RBMSC model. The packet delivery ratios of the two models were compared under different conditions by varying to 10%, 20%, 30%, 40%, 50%, and 60%.
G3 Simulations: The aim of the third group of simulations was to compare the performances of the improved Dijkstra algorithm and the traditional Dijkstra algorithm. We evaluated the ability of the two algorithms to defend against attacks from malicious nodes when was set to 20%.
G4 Simulations: This group contained a set of simulations for examining the defense capability comparison of the improved Dijkstra algorithm and the traditional Dijkstra algorithm while was dynamically changing over time. Initially, was 20%, and then it gradually climbed to 40% and 60% during the simulations. In this case, the historical communication behaviors of the node are unreliable. The information obtained earlier is less reliable. Therefore, this dynamic simulation, which refers to recent historical behaviors, is distinct from the other simulations that reference all historical communication behaviors.
G5 Simulations: This group of simulations examined the effectiveness of the proposed secure routing model (IASR) under a random deployment topology. The simulations were randomly deployed in ten different topologies, and the effectiveness of the model was testified in these topologies.
6. Simulation Results
The simulations in each group were repeated 100 times, and the averages were calculated as the final results.
6.1. G1 Simulations: Secure Route Construction
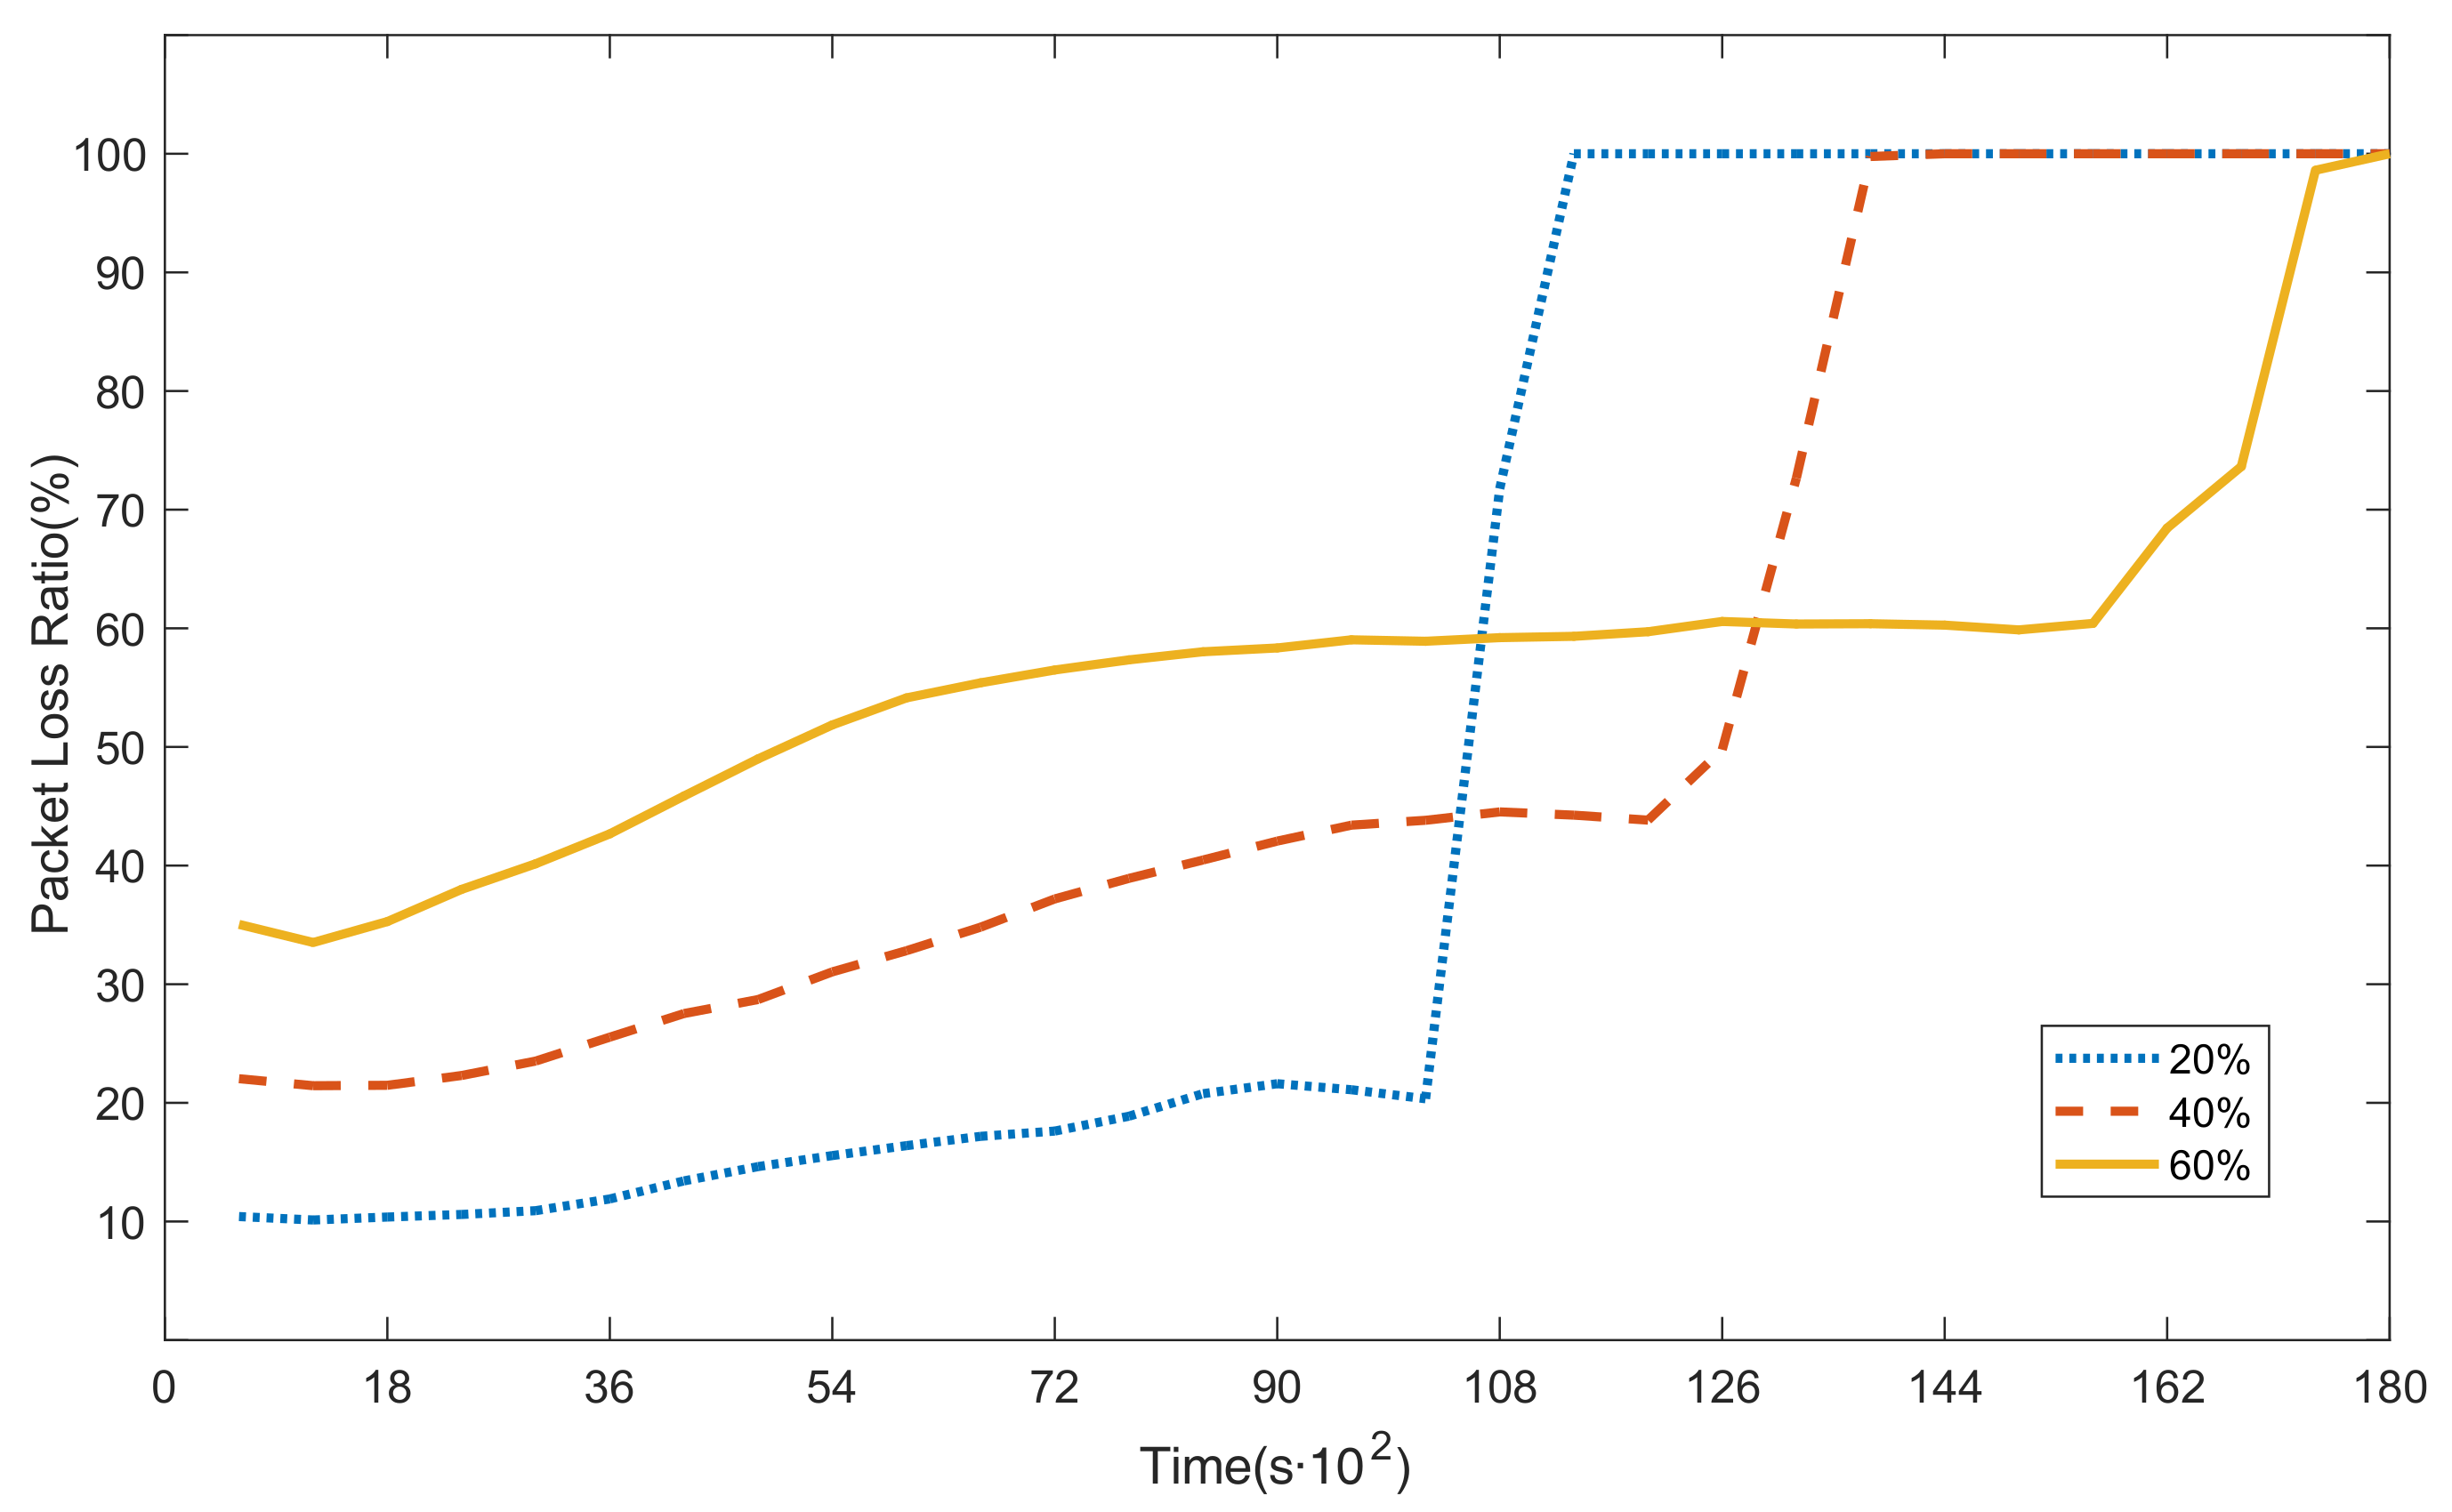
Figure 5 shows the trends of packet loss ratios under different proportions of malicious nodes in our model. As we can see from the figure, the three lines share similar trends. For
= 20% (the blue dotted line), the packet loss ratio slowly increases from 10% to 22% in the first 10,200 s, and it suddenly jumps to 100% in the next 1200 s. For
= 40% (the red dashed line), the packet loss ratio slowly grows from 21% to 45% in the first 12,000 s, and then it suddenly jumps to 100% in the next 1800 s. For
= 60% (the yellow solid line), the packet loss ratio grows from 33% to 60% in the first 15,600 s, and it suddenly jumps to 100% in the next 2400 s. We observed that the more malicious the nodes, the higher the packet loss ratio in the WSN. The average packet loss ratio exceeds 50% when
= 60%, and the WSN cannot tolerate intrusions.
In
Figure 5, for
= 20% (the blue dotted line), the packet loss ratio suddenly jumps to 100% after 10,200 s. Because the load balance is considered in the model, nodes (especially the neighbor nodes around the sink node) in the network almost run out of energy simultaneously. Therefore, the packet loss ratio rises rapidly to 100% in the next 1200 s. The other two cases (
= 40% and
= 60%) are similar to this scenario. The model tries to ensure the load balance of the nodes in WSNs. However, a packet must pass through a limited number of nodes adjacent to the sink node to successfully reach the sink node. These adjacent nodes will run out of energy prematurely and eventually die (as shown in
Figure 6). This is the “Hot Spot” phenomenon in WSNs.
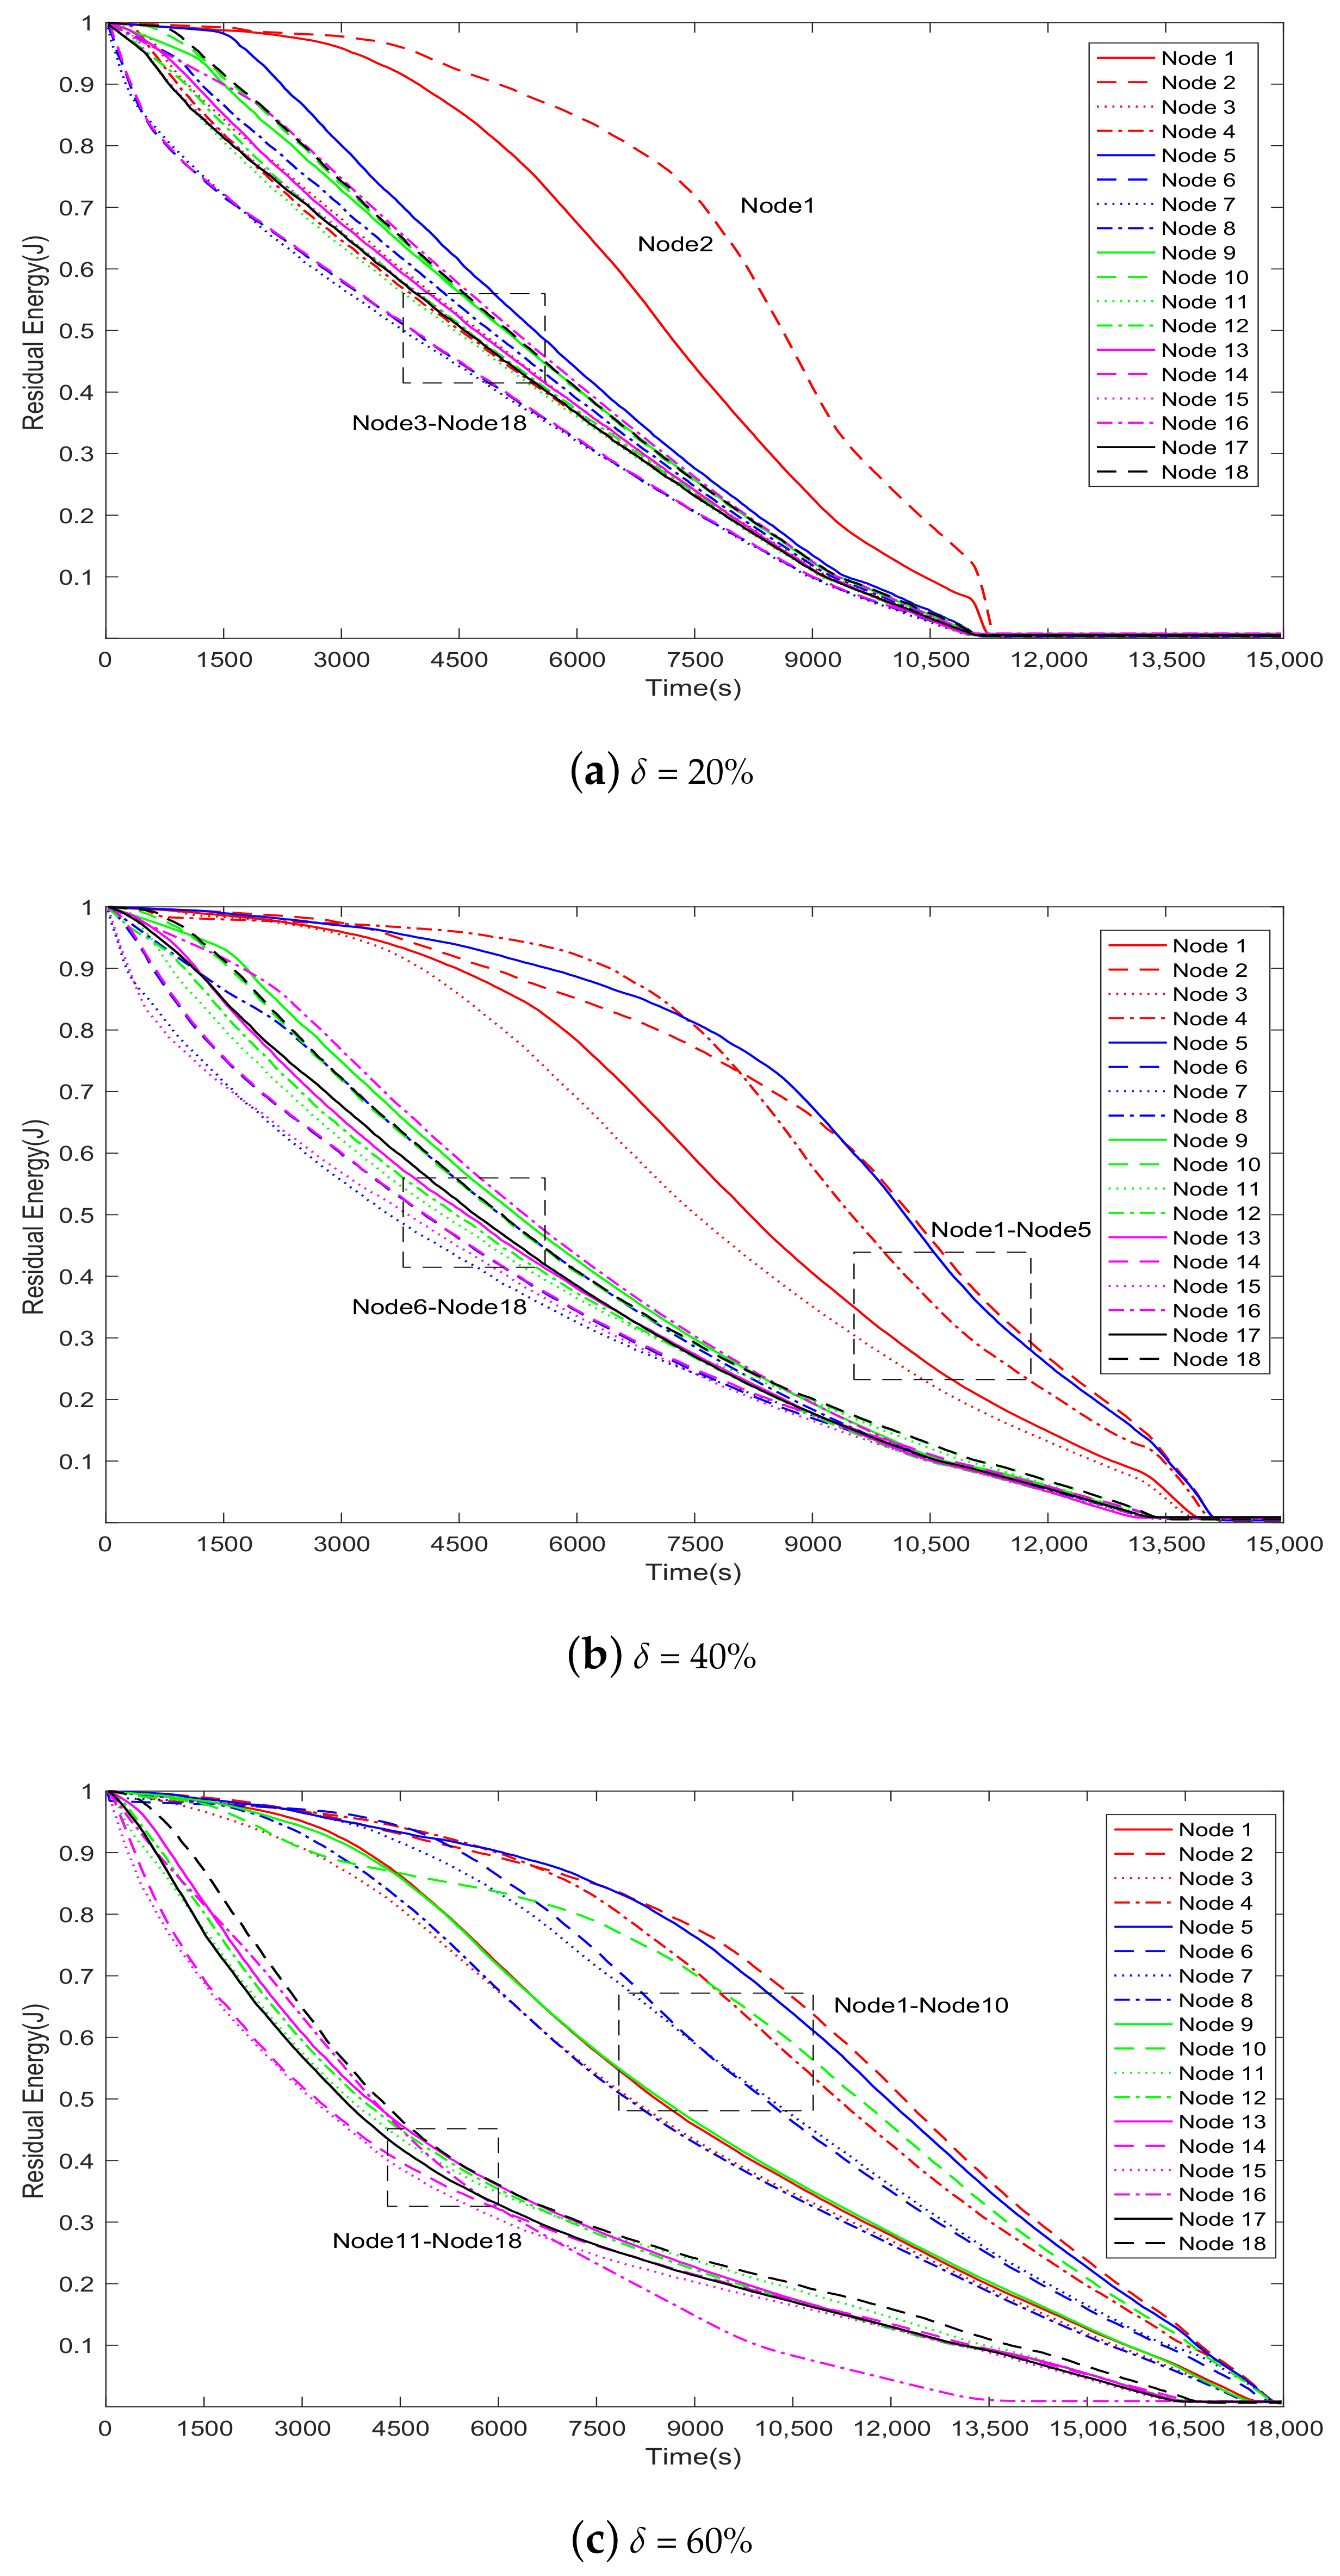
Figure 6a–c show the energy consumption of the 18 nodes near the sink node when the proportions of malicious nodes are 20%, 40%, and 60%, respectively.
In
Figure 6a (
= 20%), when the network is run to the 11,130th second, the residual energies of all 18 nodes are less than the minimum forwarding threshold, so they cannot continue to forward packets. Thus, the packet loss ratio rises rapidly to 100%. Note that this moment basically coincides with the moment at which the blue dotted line in
Figure 5 rises to 100%.
Similarly, in
Figure 6b (
= 40%) and
Figure 6c (
= 60%), when the network is run to the 13,560th second and the 16,740th second, respectively, the residual energies of all 18 nodes are less than the minimum forwarding threshold. Note that the two moments basically coincide with the moment at which the red dashed line and the yellow solid line in
Figure 5 rise to 100%, respectively.
In summary, when the proportion of malicious nodes is 20%, the network packet loss ratio reaches the lowest level, but the packet loss ratio rises to 100% earlier than in the other two cases. In this case, each node (especially the adjacent nodes around the sink node) consumes more energy than the nodes in the other two cases, and the network uses up energy first because it can forward more packets. Therefore, network lifetime in this case is the shortest. Similarly, the packet loss ratio starts to increase earlier and rises more rapidly to 100% in = 40% than in = 60%.
In addition,
Figure 6a–c show that some nodes (nodes 1–2 in
Figure 6a, nodes 1–5 in
Figure 6b, and nodes 1–10 in
Figure 6c)—namely, malicious nodes set up in the simulation—consume less energy than the others. This phenomenon can be explained by two facets. First, malicious nodes are less likely to forward packets and consume a lot of energy, because the proposed model stays away from these nodes to the greatest extent possible. Second, malicious nodes forward packets selectively to economize their energy.
6.2. G2 Simulations: Comparative Studies of Two Models
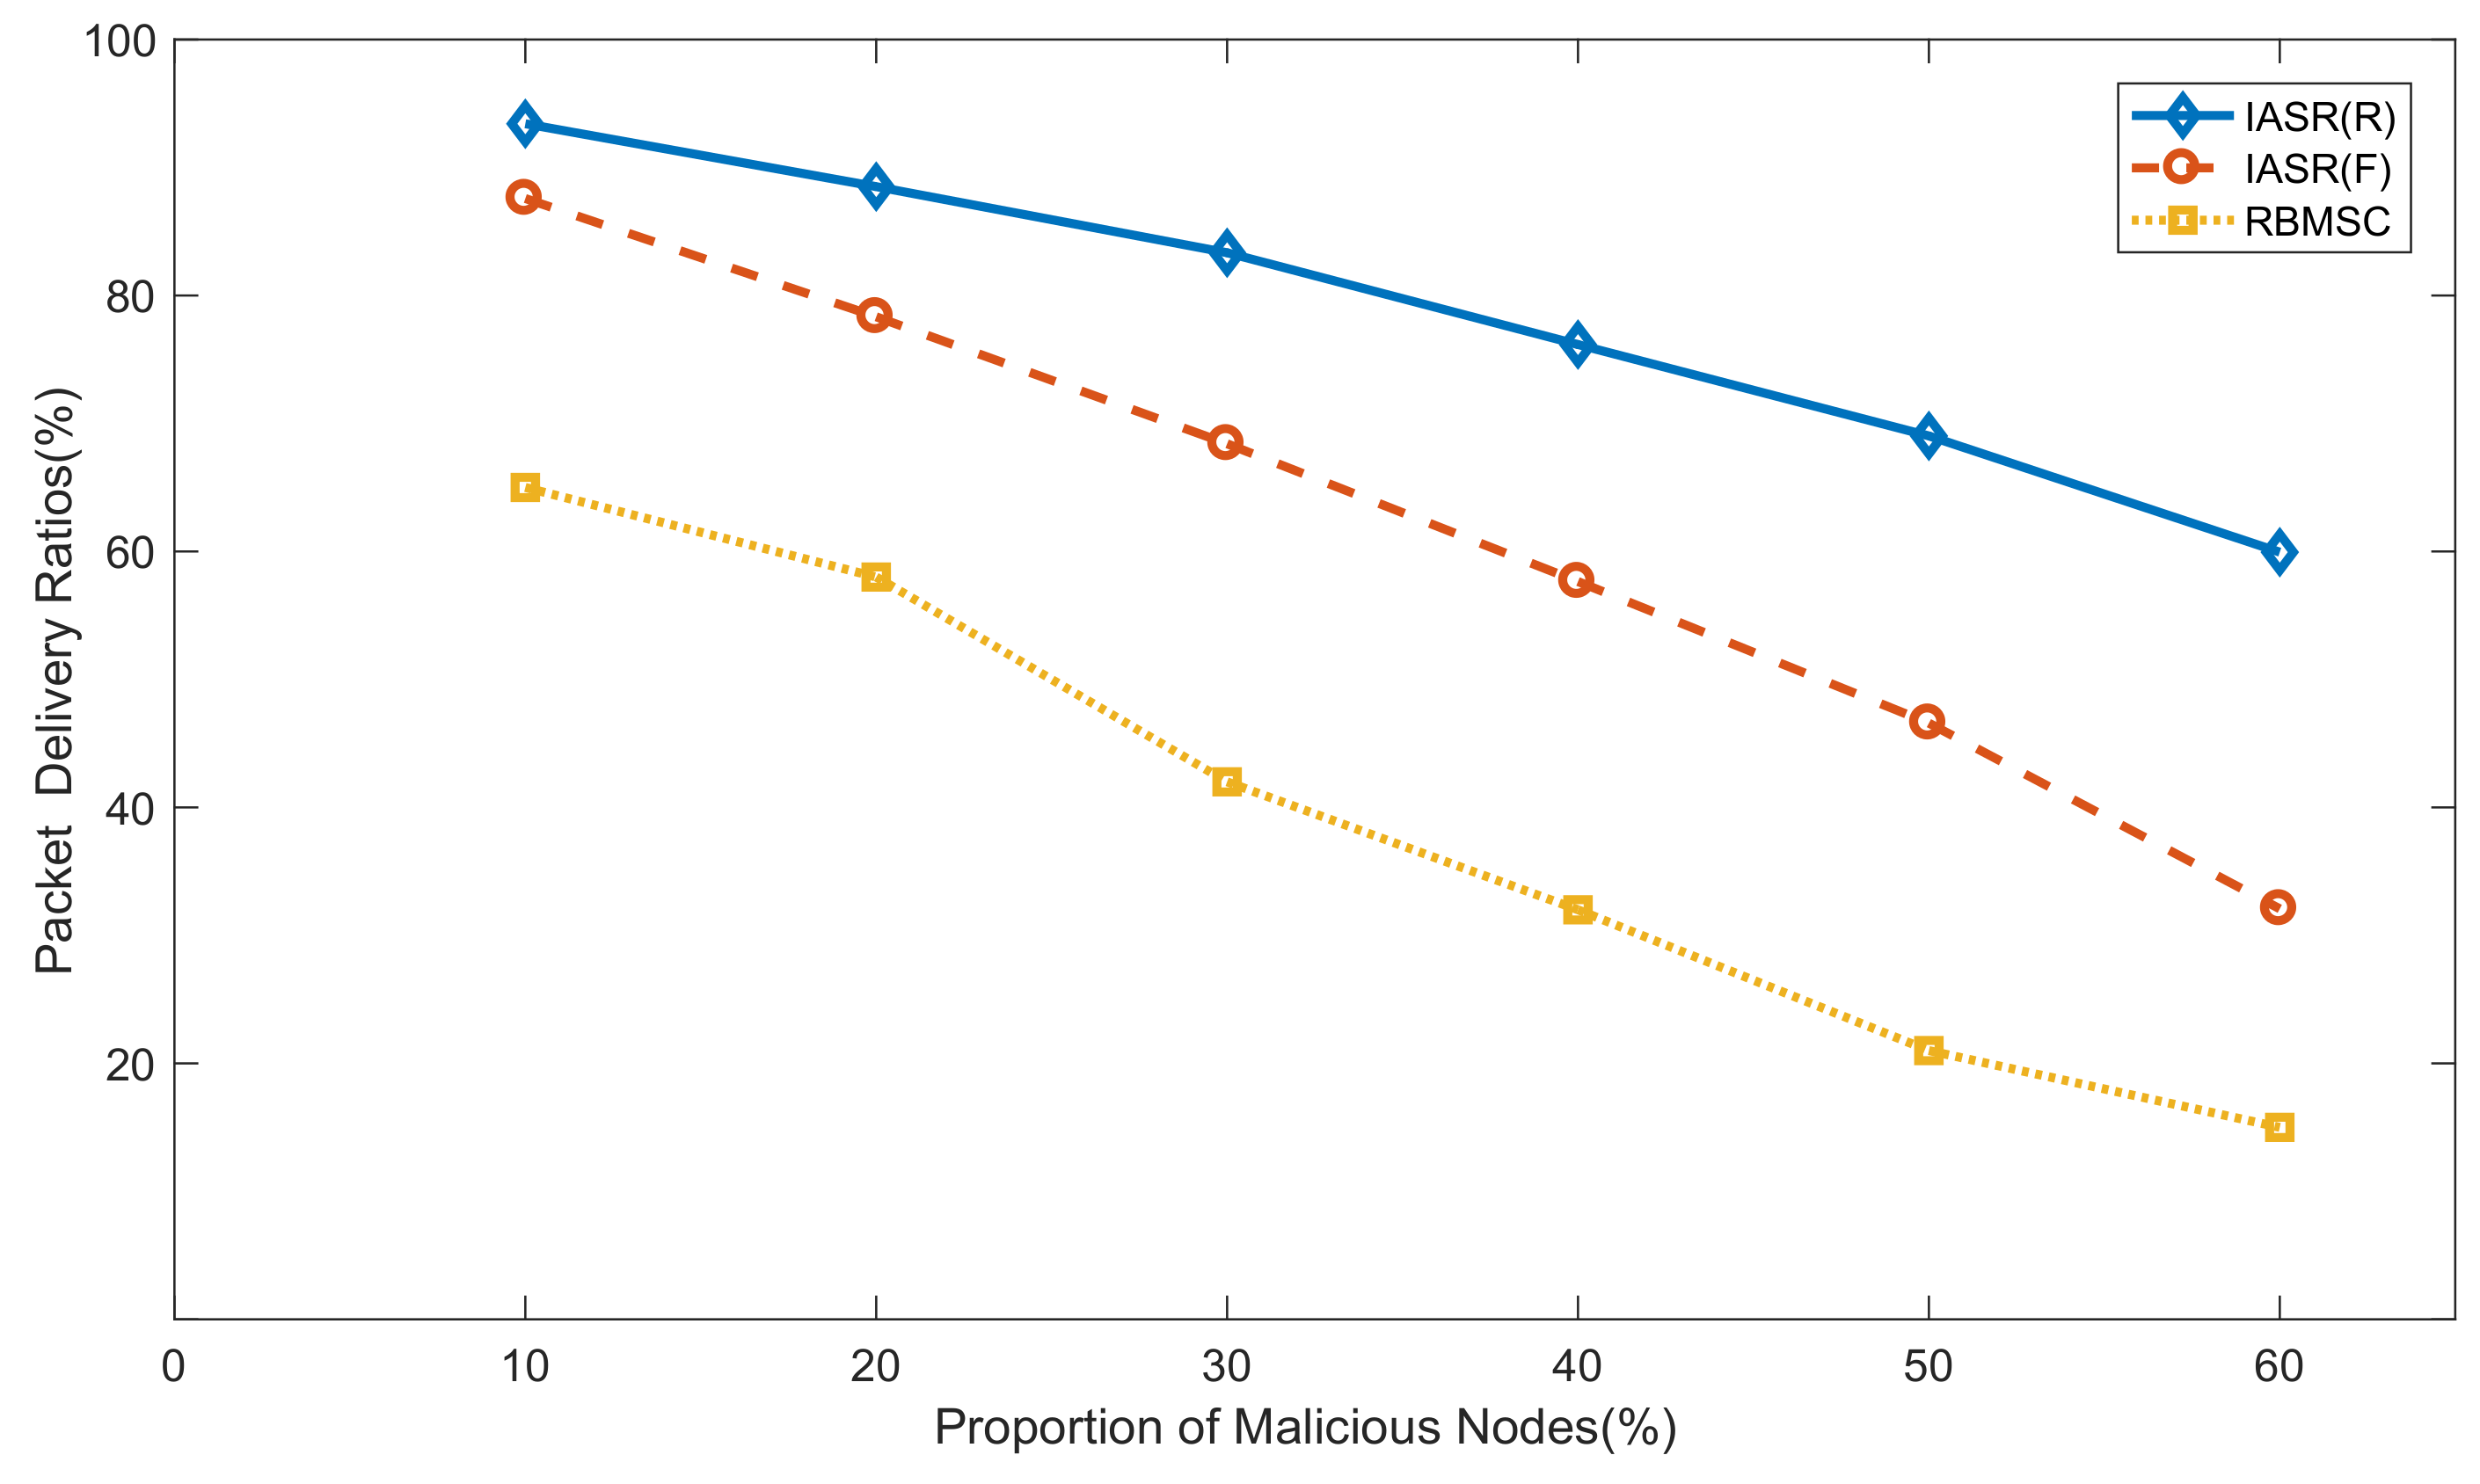
Figure 7 plots the packet delivery ratios of the two models according to the packet-forwarding schemes. The RBMSC model adopted the FPL scheme in the simulation, and it assumes that a malicious node discards all received packets. Objectively, the IASR model verifies both hypotheses that the malicious node processes the packets in the simulation. In
Figure 7, the blue solid line, the red dashed line, and the yellow dotted line respectively represent the packet delivery ratios of the IASR model (RPL), the IASR model (FPL), and the RBMSC model (FPL) with different proportions of malicious nodes in WSNs. As shown in
Figure 7, the performance of the IASR model is superior to that of the RBMSC model for both assumptions.
As the proportion of malicious nodes in WSNs increases, the packet delivery ratios of both models decrease. Compared with the RBMSC model, the IASR model can maintain a higher delivery ratio. This is because, in the process of path selection, the IASR model not only examines the single-hop optional node, but also evaluates the entire path according to the serial–parallel system of reliability theory to ensure global optimization.
6.3. G3 Simulations: Comparative Studies on Algorithms
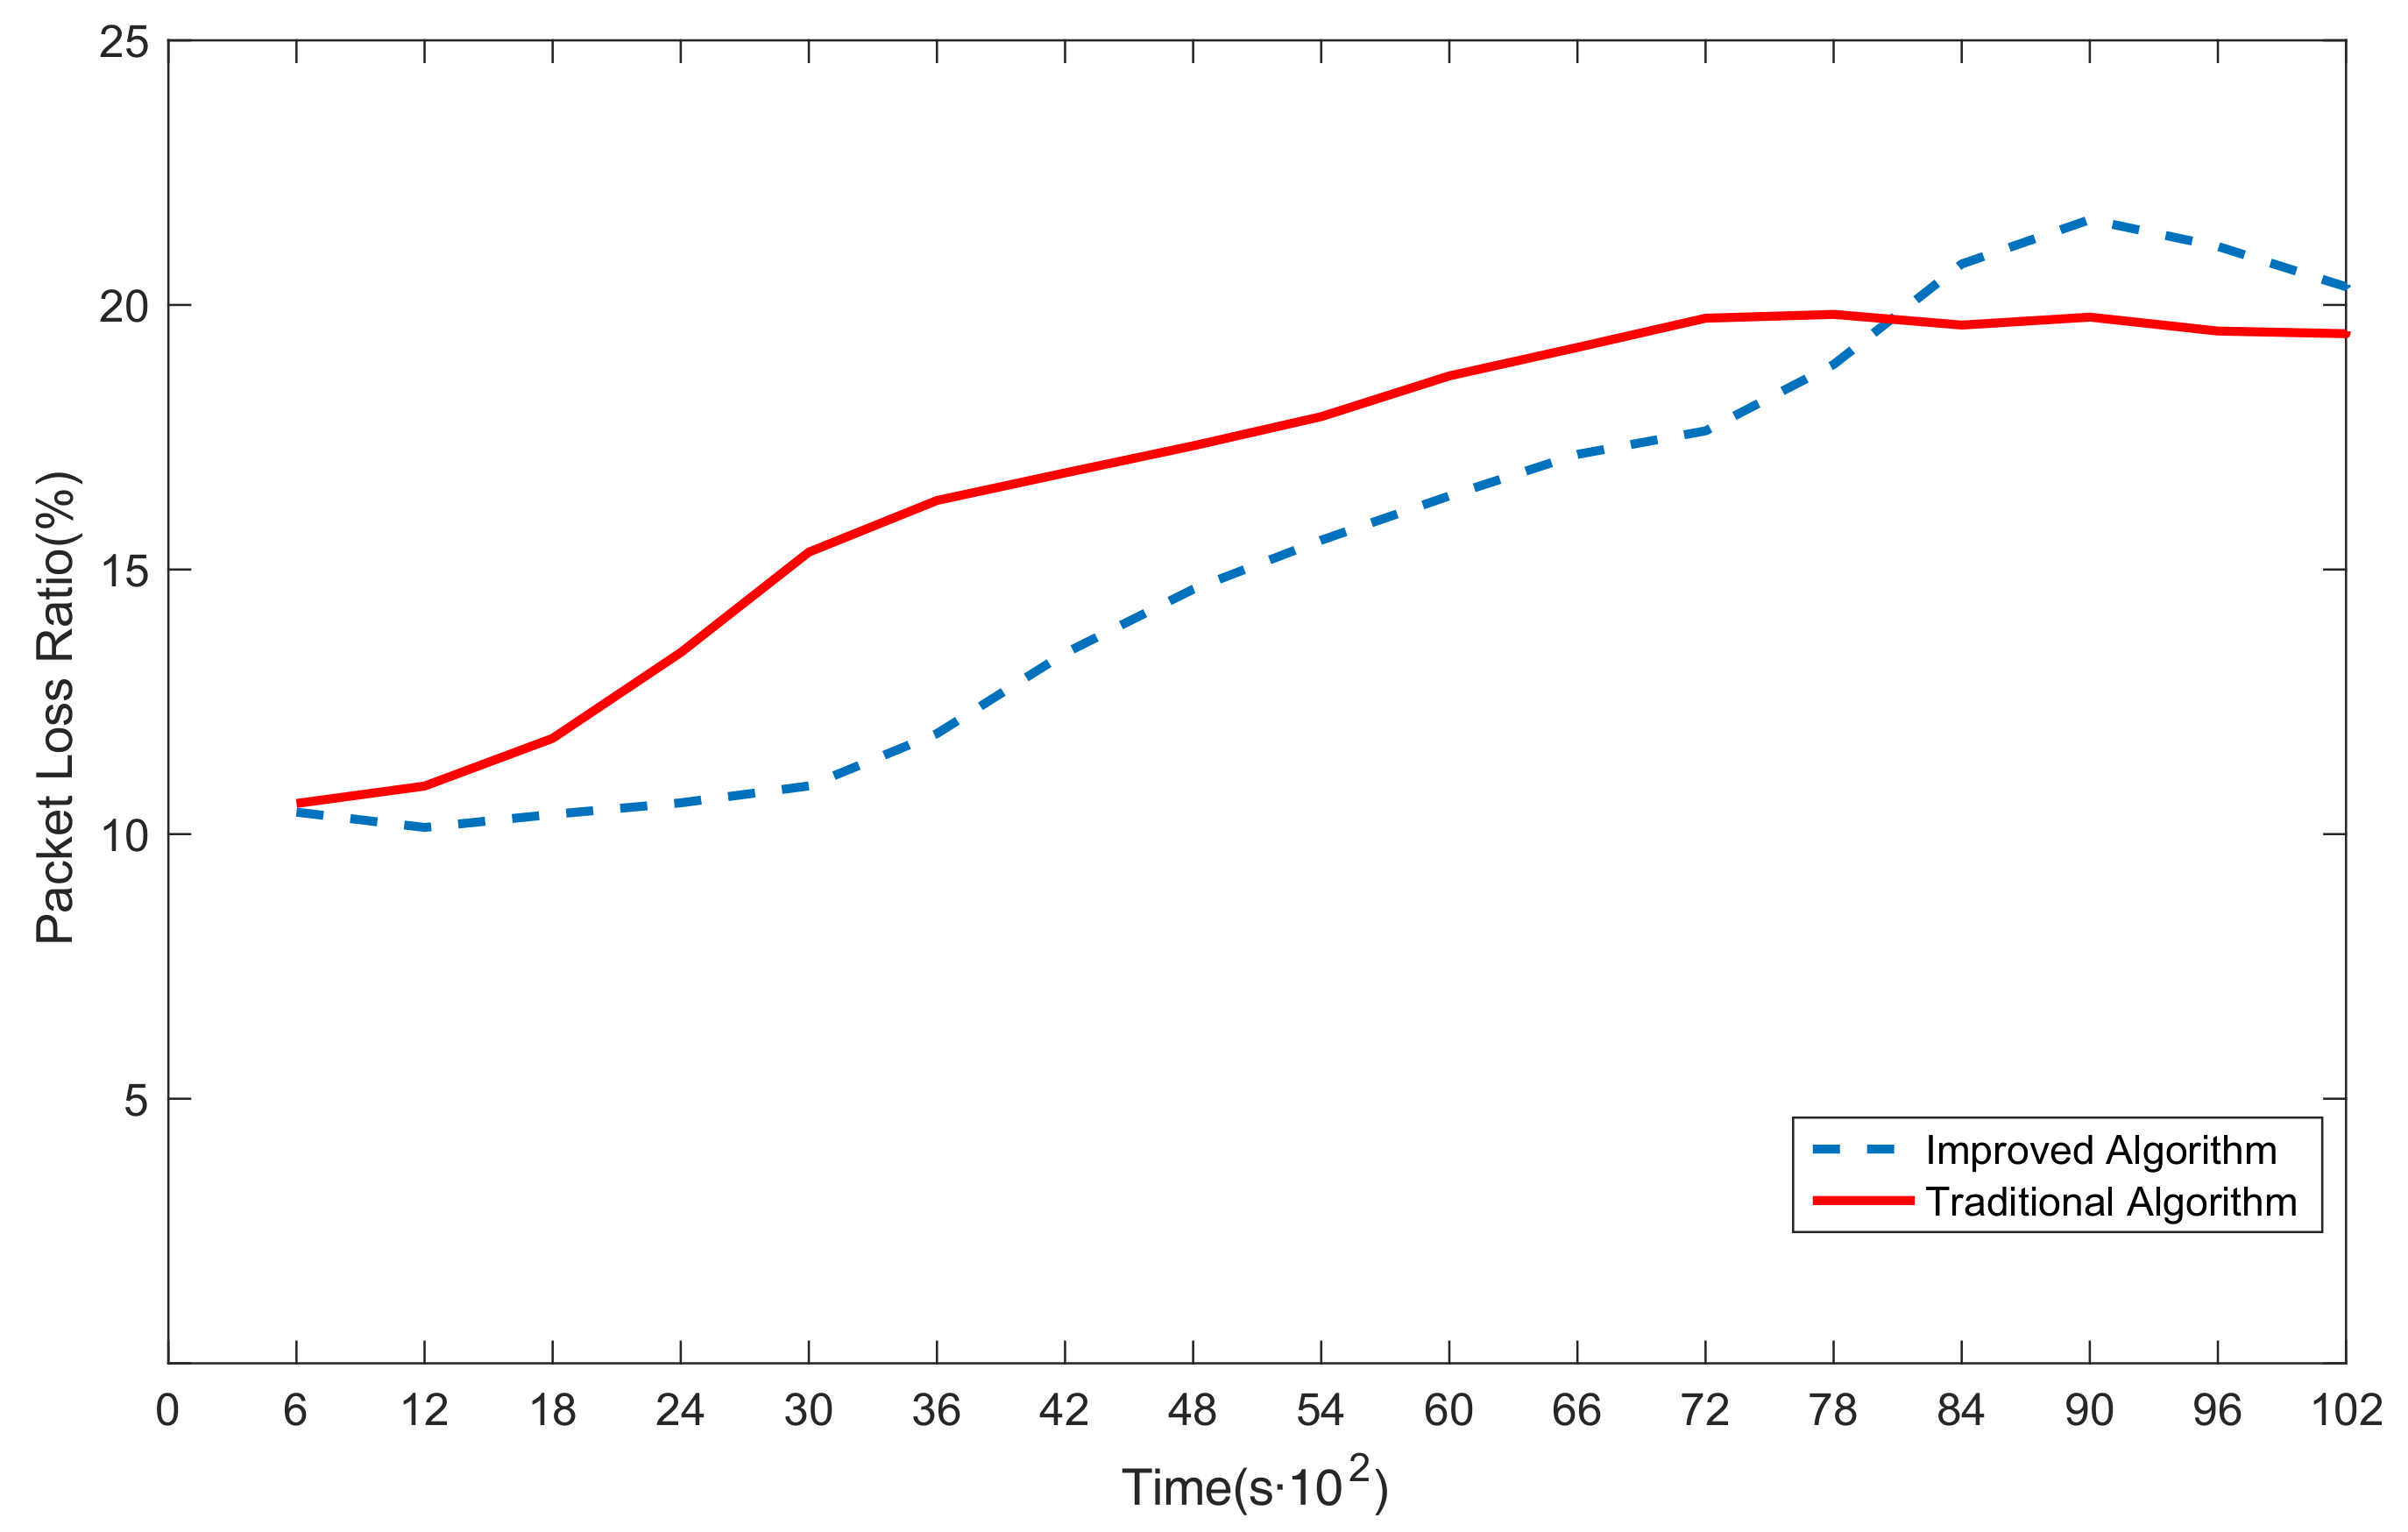
Figure 8 shows a comparison between the improved Dijkstra algorithm and the traditional Dijkstra algorithm. As shown in the figure, the packet loss ratio in the improved Dijkstra algorithm (the blue dashed line) is lower than in the traditional Dijkstra algorithm (the red solid line) before 8100 s. The weight in the improved algorithm is not calculated by simply adding the cost of each hop, but by the cost function shown in Equation (
9). The cost function is based on the serial–parallel system of reliability theory combined with the characteristics of WSNs, so it is more reasonable and effective than traditional methods. However, the packet loss ratio in the traditional algorithm is lower than the improved algorithm after 8100 s. The reason for this change is that some nodes in the WSN have exhausted their energy because, compared with the traditional algorithm, they deliver more packets in the improved algorithm. Therefore, the key nodes in the late stage of the simulation have exhausted their energy and cannot participate in forwarding packets, resulting in an increase in the packet loss ratio.
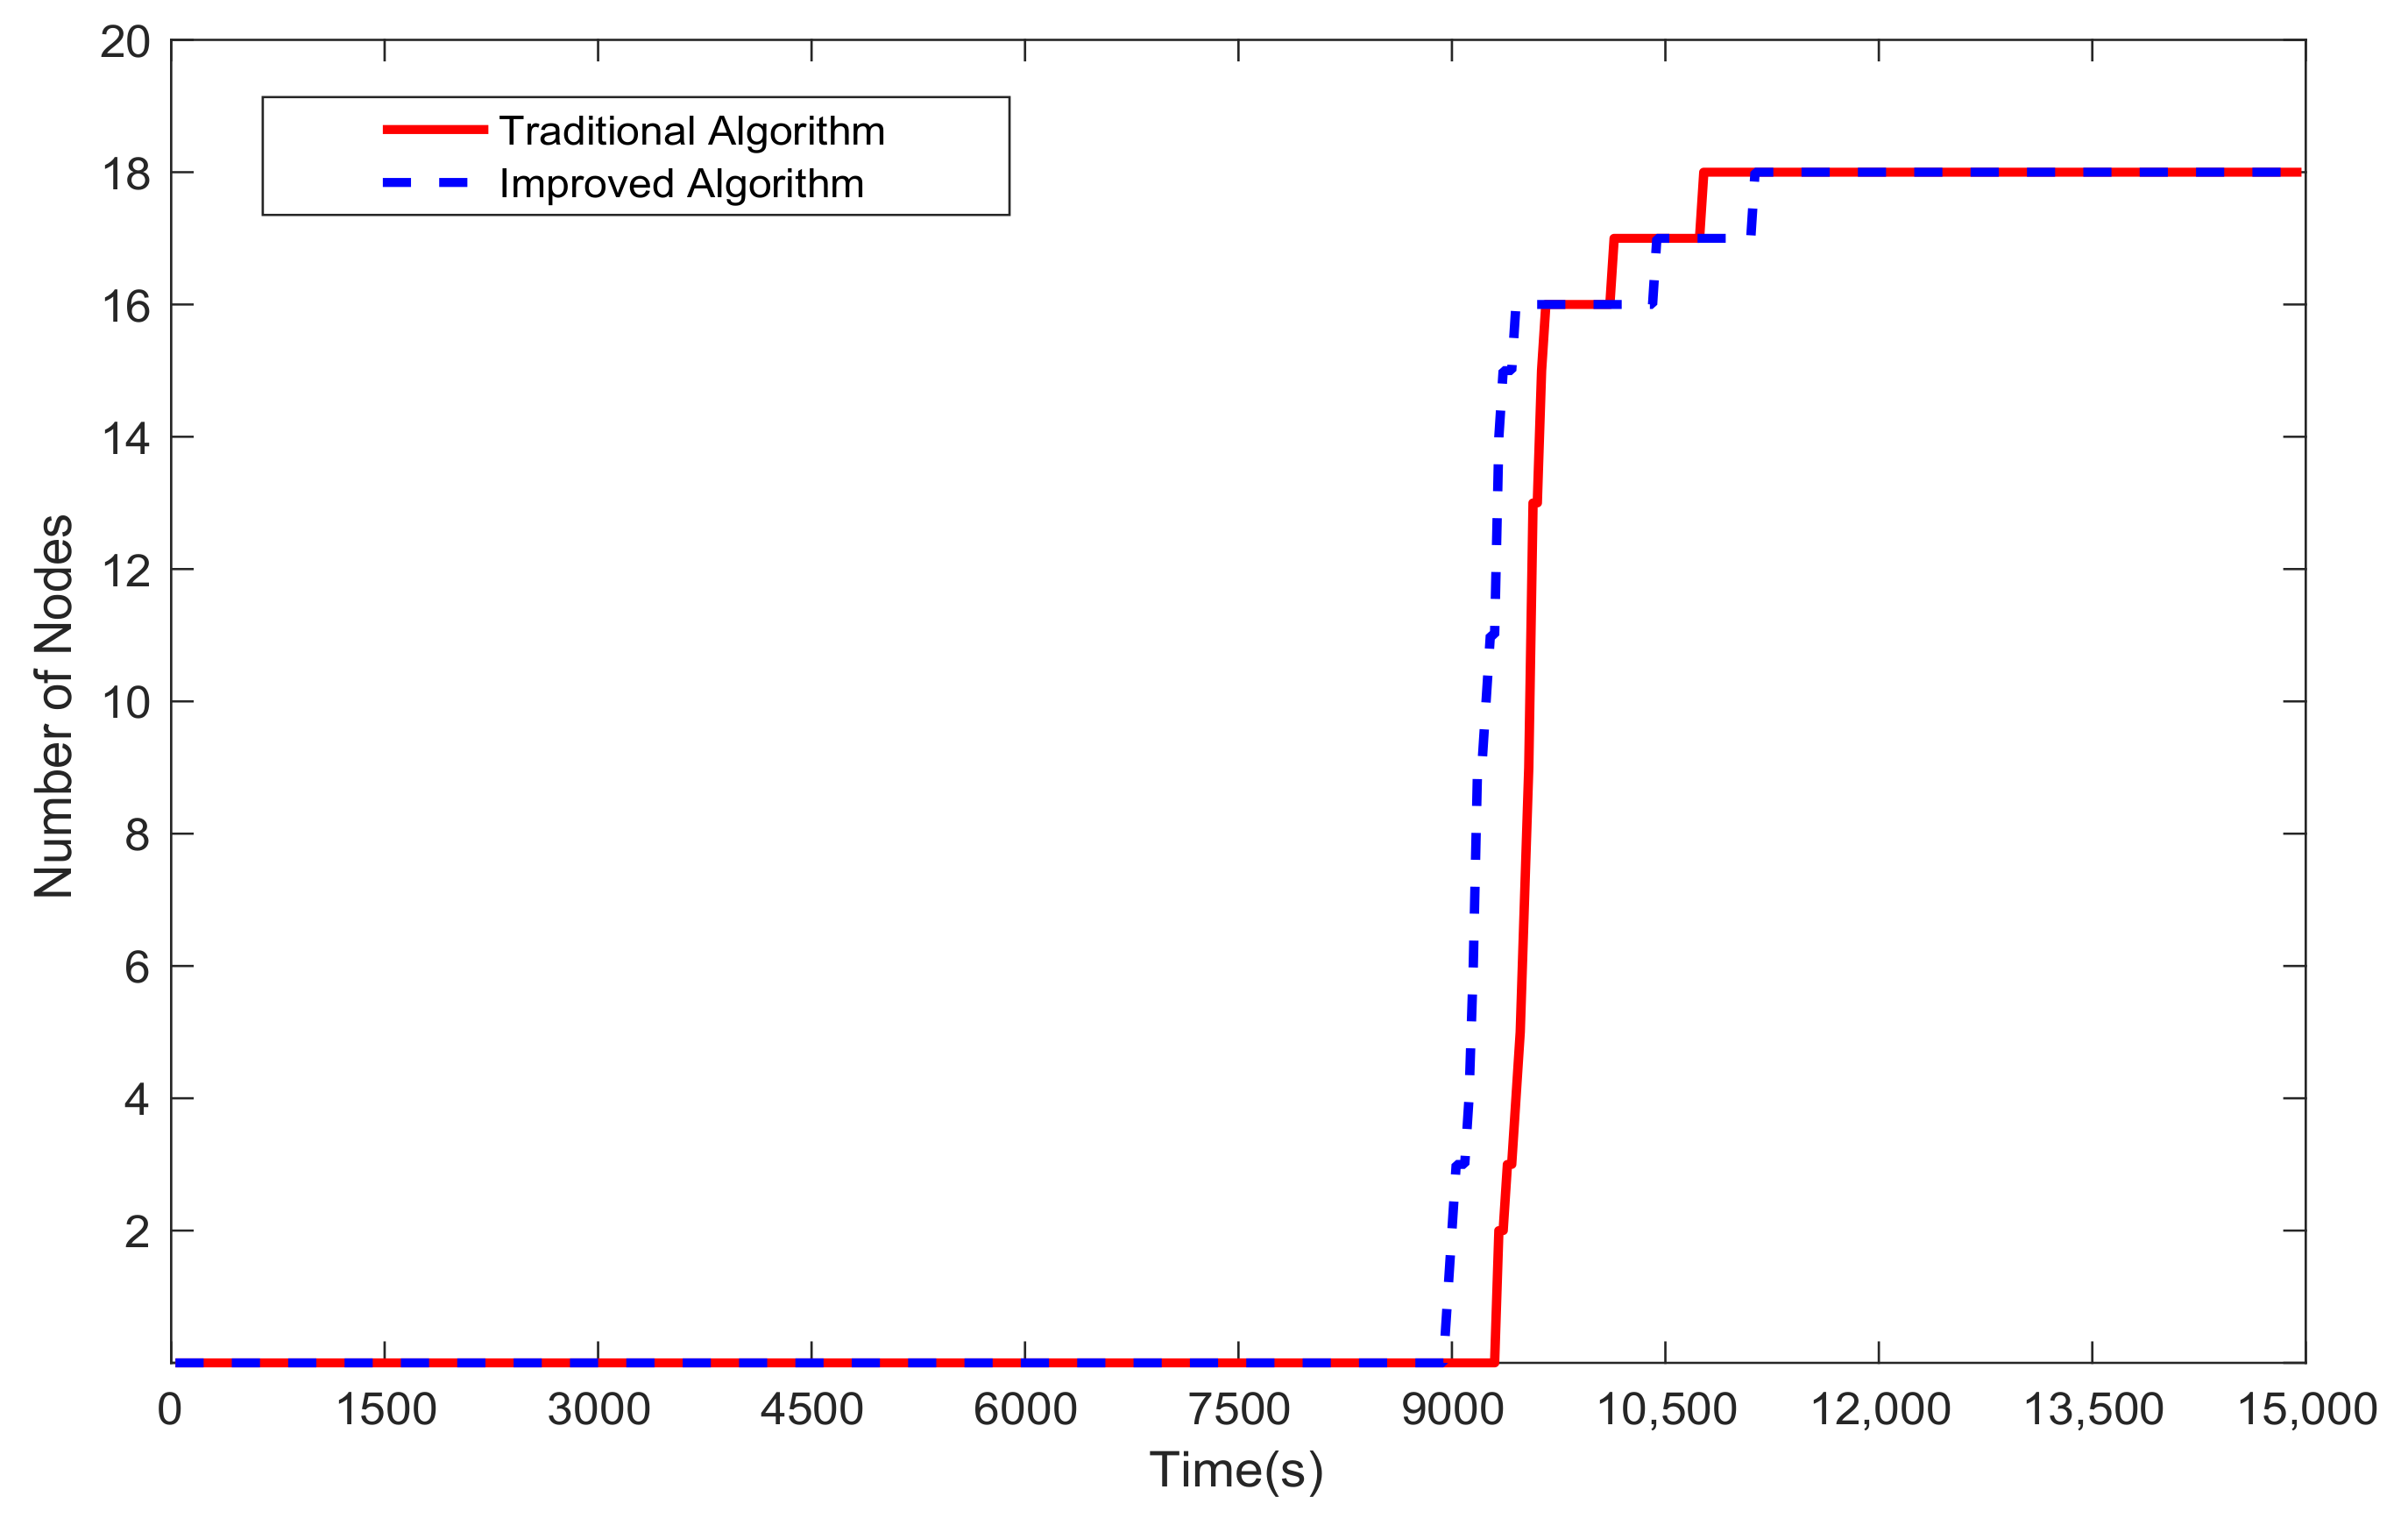
Figure 9 shows the time-varying number of key nodes with residual energy less than
in the two algorithms. Compared with the key nodes with residual energy less than
in the traditional algorithm (the red solid line), they appear first in the improved algorithm (the blue dashed line) and increase dramatically. After 360 s, key nodes with residual energy less than
show up in the traditional algorithm when the number of these nodes rises to 14 in the improved algorithm. Therefore, in the late stage of the simulation, for more available key nodes, there is a lower packet loss ratio in the traditional algorithm than in the improved algorithm.
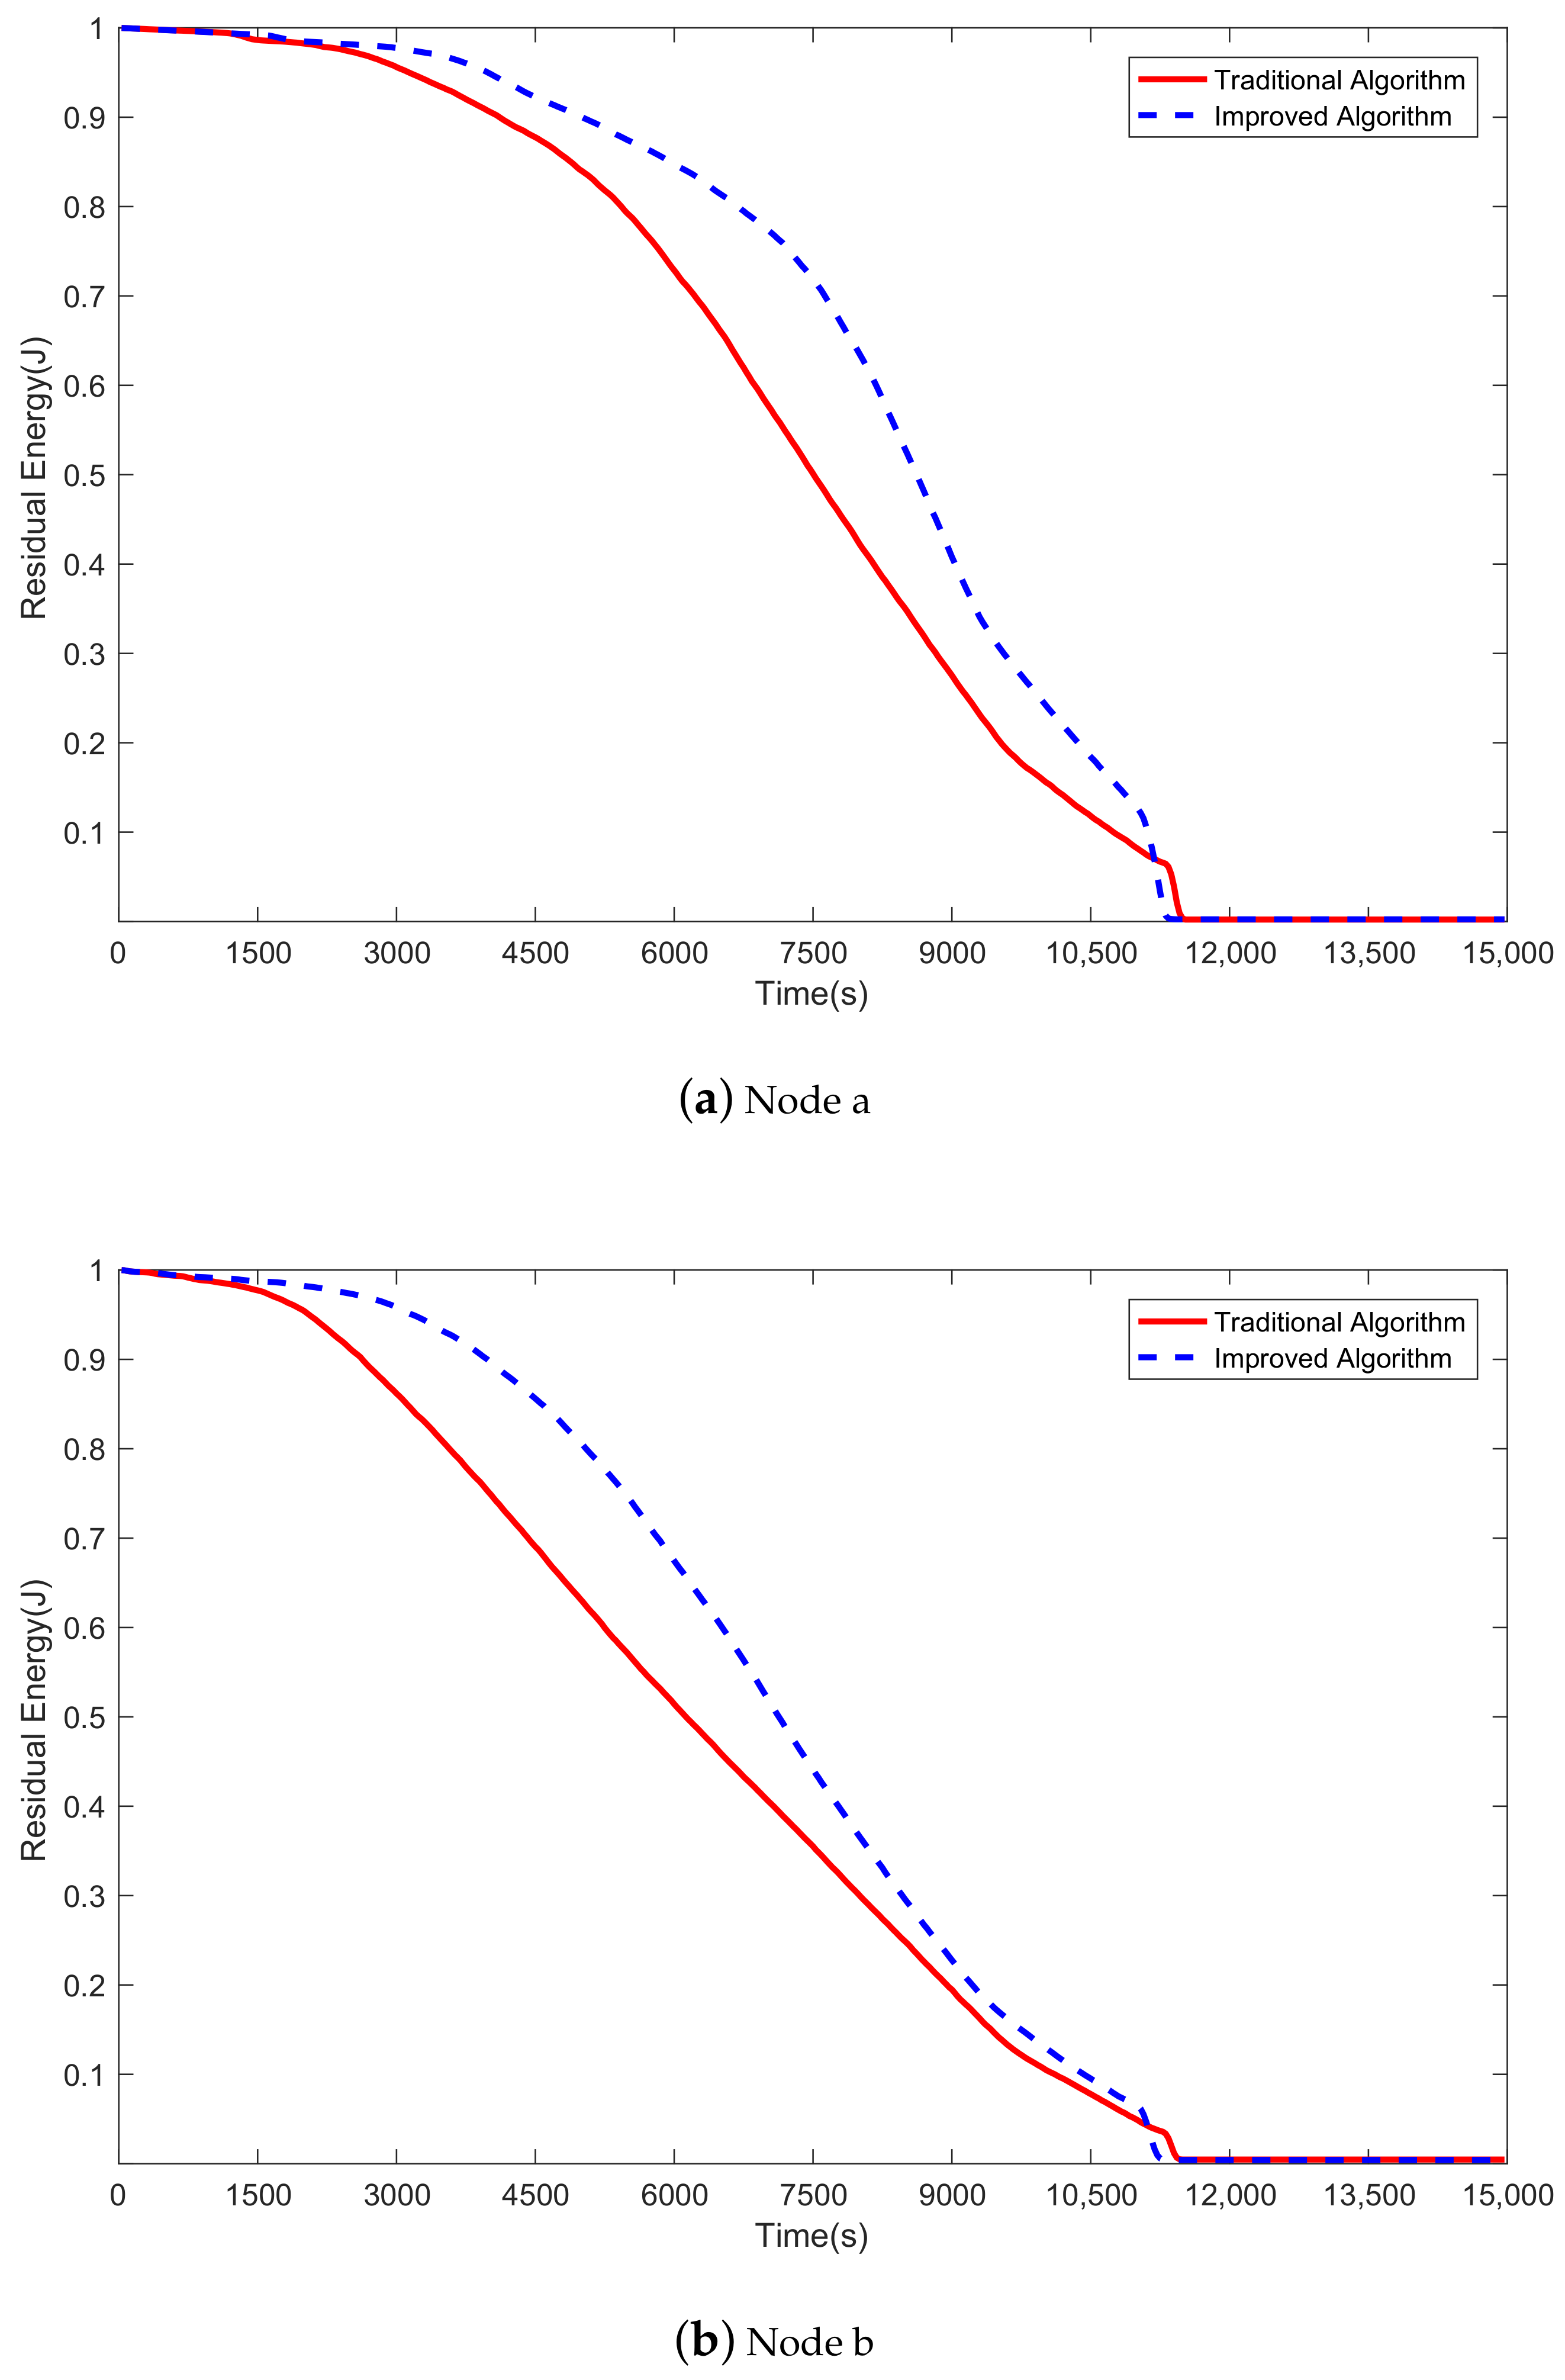
As can be seen in
Figure 6a and
Figure 9, in the final stage, there are only two malicious nodes (a and b) with residual energy more than
, and they consume energy slowly. Both algorithms try not to select a malicious node as a relay node, and malicious nodes do not forward all packets even if they are selected as relay nodes. Therefore, the malicious nodes consume less energy than the other 16 nodes.
Figure 10a,b show the energy consumption of malicious nodes a and b in the two algorithms, respectively. As can be seen from both figures, in the initial period, the energy consumption of malicious nodes a and b in both algorithms is approximate. After a short period, the energy consumption of the nodes in the improved algorithm (the blue dashed line) is significantly lower than that in the traditional algorithm (the red solid line) because the improved algorithm is superior to the traditional algorithm in terms of avoiding malicious nodes. With a lower probability of malicious nodes being selected as the relay node, less energy is consumed by malicious nodes. Hence, the improved algorithm is better than the traditional algorithm.
6.4. G4 Simulations: Dynamic Simulation
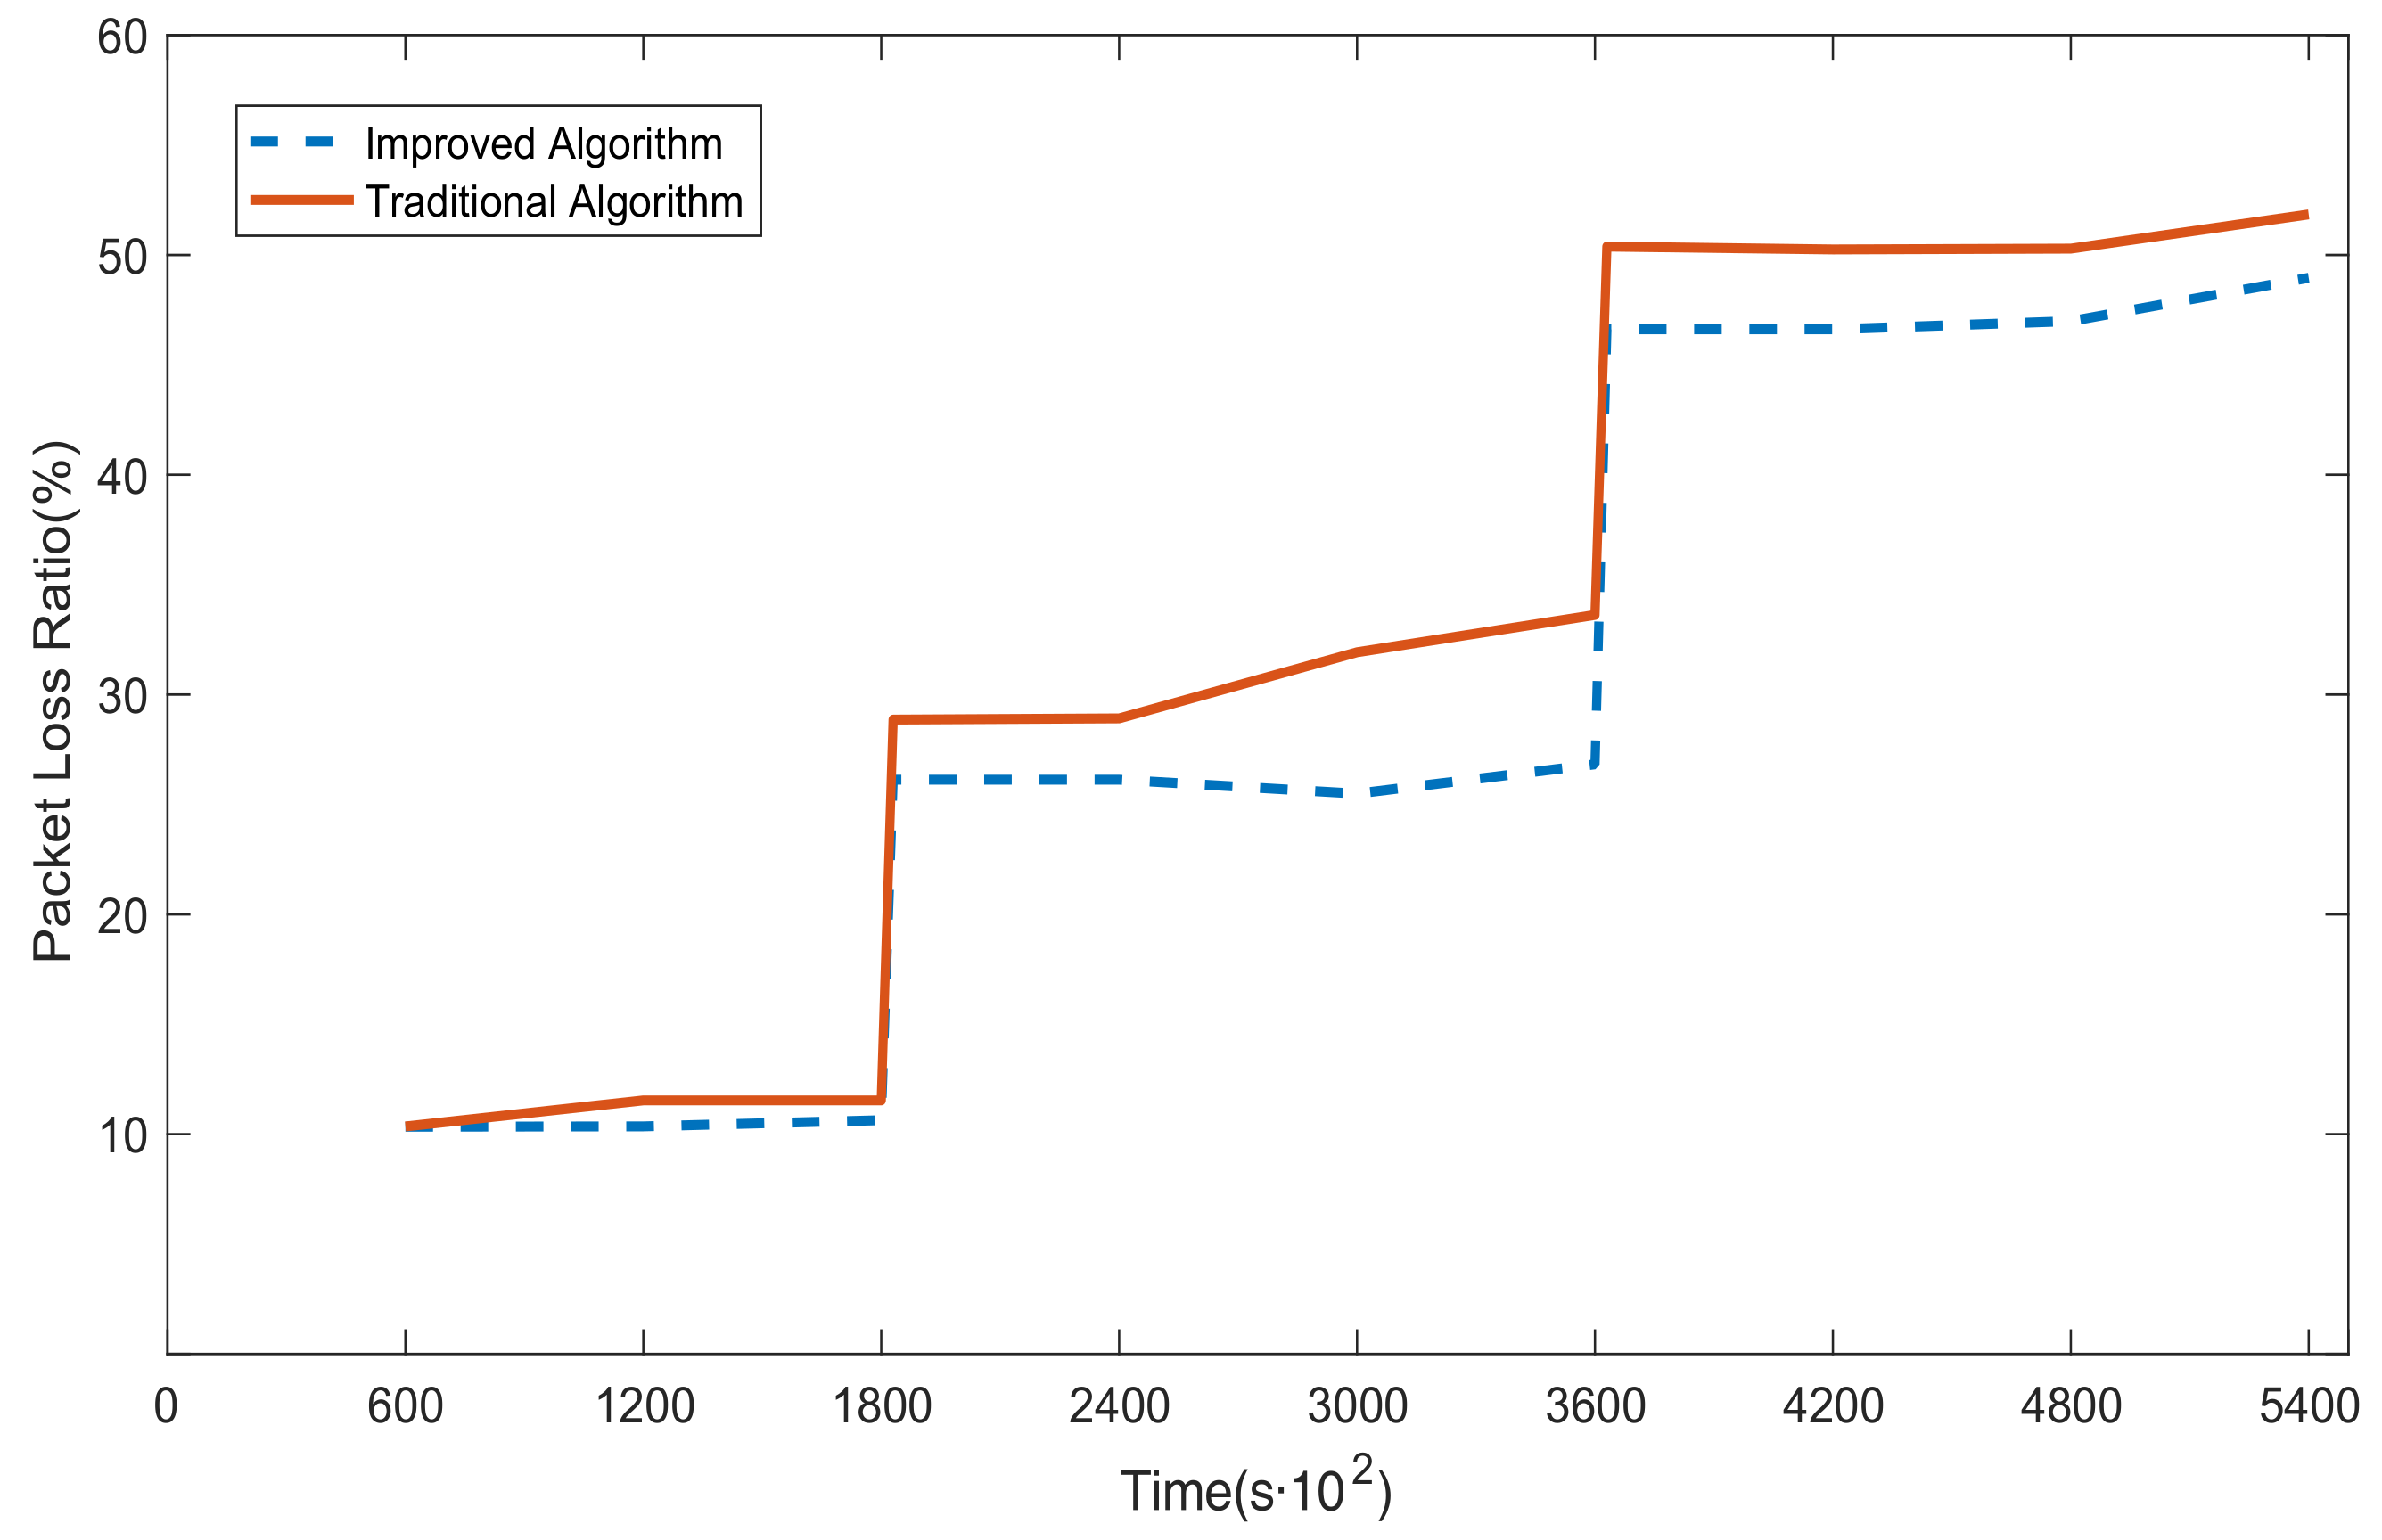
Figure 11 plots the packet loss ratio in two algorithms when the proportion of the malicious nodes in the WSN increases from 20% to 40% (at 1800 s) and then to 60% (at 3600 s). As we can see from the figure, the packet loss ratio grows significantly when the number of malicious nodes increases. The packet loss ratio gradually converges to a steady value after a short learning time. In
Figure 11, the packet loss ratio in the improved Dijkstra algorithm (the blue dashed line) is lower than that in the traditional Dijkstra algorithm (the red solid line) while the number of malicious nodes changes. When the number of malicious nodes that need to be avoided is relatively small, the simulation results show that the packet loss ratio of the improved algorithm is close to that of the traditional algorithm. When the number of malicious nodes approaches half of the total, the improved algorithm obviously outperforms the traditional algorithm. This is due to the fact that the weight calculating method in the improved algorithm is more reasonable and effective than the traditional method, so that the route generated by the improved algorithm can stay away from malicious nodes to the greatest extent possible. Thus, the improved algorithm is superior to the traditional algorithm while the number of malicious nodes changes.
The simulation results verify that the model can learn quickly and maximize network connectivity and the packet delivery ratio, even when the malicious nodes are dynamically increasing. Thus, the intrusion tolerance and robustness of the network can be enhanced.
6.5. G5 Simulations: Random Topology Simulation
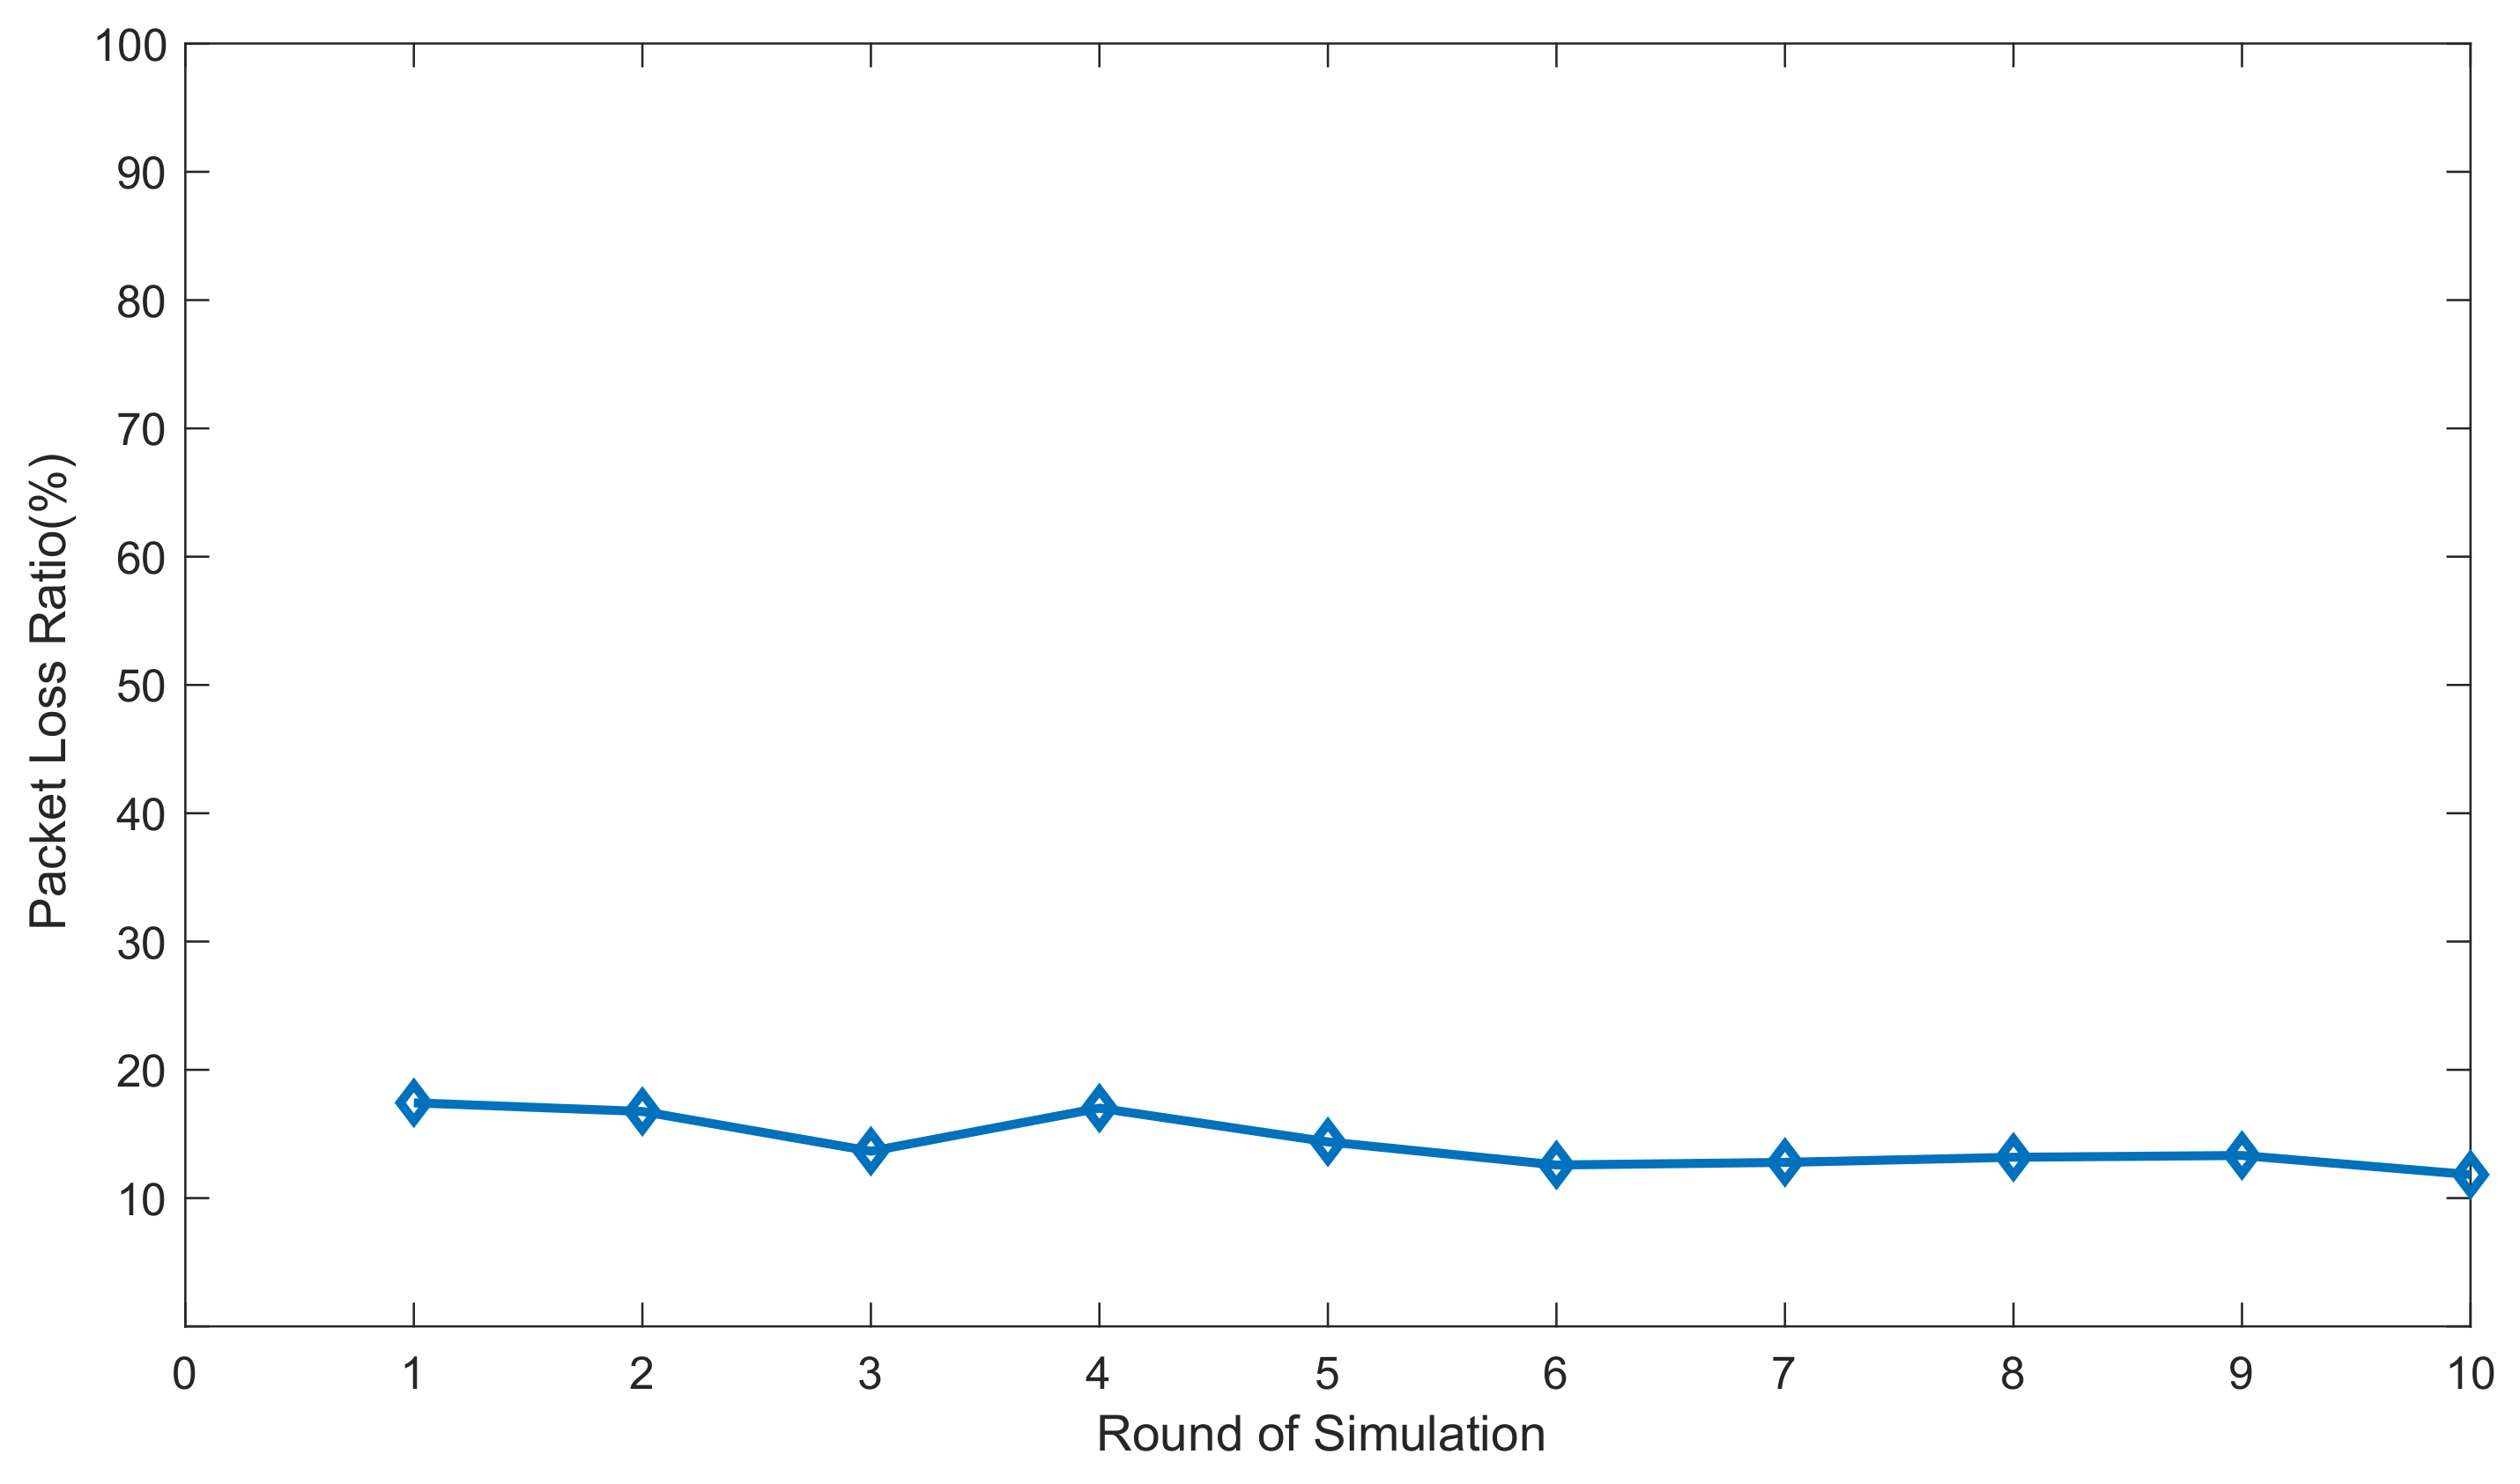
In this group of simulations, to examine the influence of topology on our model, we simulated ten random topologies of the WSN.
Figure 12 plots the packet loss ratios for these topologies. As we can see from the figure, the packet loss ratios, which range from 11% to 18%, show little change among the ten different topologies. Therefore, network topology has little influence on the performance of the model, and the model is robust to various WSN topologies.
7. Conclusions
In this work, we investigated the secure routing problem for WSNs in the presence of malicious nodes. First, we established a network model for multi-hop communications between sensor nodes and the sink node in the presence of malicious nodes in WSNs. The model describes the behaviors of sensor nodes in WSNs. Second, a method for calculating trust between adjacent nodes was determined as the basis for the route selection. The attack probability of the node is used as the metric for the trust of the node, and it depends on the past behaviors of the node. The attack probability of a path is calculated on the basis of the attack probability of each node in the path and the serial–parallel system in reliability theory. Third, we developed a secure routing model based on information-aware sensor nodes in WSNs. The cost function is based on the node information (attack probability of the K-hop path, the status of each node in the path). The sensor node chooses a path with the least cost required to relay the packet to the sink node. Fourth, an improved version of the Dijkstra algorithm was designed to make it more suitable for our model. Finally, we conducted extensive simulations to verify the validity of our model and algorithm.
In the proposed model, the nodes that are closer to the sink node are chosen as relay nodes to save energy and reduce transmission delay. However, the transmission delay of each path is not specifically quantified, and the upper limit of the delay is not set. In the future, we will consider transmission delay as a factor for path selection to make the secure routing model more realistic.
Author Contributions
Conceptualization, Q.S., L.Q. and L.S.; methodology, Q.S., L.Q. and B.X.; validation, Q.S., Y.D. and J.Z.; investigation, Q.S.; data curation, Q.S., Y.D. and J.Z.; writing—original draft preparation, Q.S.; writing—review and editing, L.S.; supervision, L.Q.; project administration, L.S.; funding acquisition, L.S. All authors have read and agreed to the published version of the manuscript.
Funding
This research was funded by the National Natural Science Foundation of China, grant number 61772478.
Conflicts of Interest
The authors declare no conflict of interest.
References
- Wang, Y.; Attebury, G.; Ramamurthy, B. A survey of security issues in wireless sensor networks. IEEE Commun. Surv. Tutor. 2006, 8, 2–22. [Google Scholar] [CrossRef]
- Yu, Y.; Li, K.; Zhou, W.; Li, P. Trust Mechanisms in Wireless Sensor Networks: Attack Analysis and Countermeasures. J. Netw. Comput. Appl. 2012, 35, 867–880. [Google Scholar] [CrossRef]
- Vasudeva, A.; Sood, M. Survey on sybil attack defense mechanisms in wireless ad hoc networks. J. Netw. Comput. Appl. 2018, 120, 78–118. [Google Scholar] [CrossRef]
- Karlof, C.; Wagner, D. Secure routing in wireless sensor networks: attacks and countermeasures. In Proceedings of the First IEEE International Workshop on Sensor Network Protocols and Applications, Anchorage, AK, USA, 11 May 2003. [Google Scholar]
- Hatzivasilis, G.; Papaefstathiou, I.; Manifavas, C. SCOTRES: Secure routing for IoT and CPS. IEEE Internet Things J. 2017, 4, 2129–2141. [Google Scholar] [CrossRef]
- Ishmanov, F.; Bin Zikria, Y. Trust mechanisms to secure routing in wireless sensor networks: current state of the research and open research issues. J. Sens. 2017, 4724852. [Google Scholar] [CrossRef]
- Kim, S.K.; Kim, B.G.; Min, B.J. Intrusion-Tolerant Jini Service Architecture for Integrating Security and Survivability Support in DSN. Int. J. Distrib. Sens. Netw. 2014, 2014, 685240. [Google Scholar] [CrossRef]
- Airehrour, D.; Gutierrez, J.; Ray, S.K. Secure routing for internet of things: A Survey. J. Netw. Comput. Appl. 2016, 66, 198–213. [Google Scholar] [CrossRef]
- Yang, Q.; Zhu, X.; Fu, H. Survey of Security technologies on wireless sensor networks. J. Sens. 2015, 842392. [Google Scholar] [CrossRef]
- Zin, S.M.; Anuar, N.B.; Kiah, M.L.M.; Ahmedy, I. Survey of secure multipath routing protocols for WSNs. J. Netw. Comput. Appl. 2015, 55, 123–153. [Google Scholar] [CrossRef]
- Li, F.; Gao, F.; Yao, L.; Li, P. A reputation-based mechanism to stimulate cooperation in wireless sensor networks. Sens. Transducers 2013, 22, 97–103. [Google Scholar]
- Albakri, A.; Harn, L. Non-Interactive group key pre-distribution scheme (GKPS) for end-to-end routing in wireless sensor networks. IEEE Access 2019, 7, 31615–31623. [Google Scholar] [CrossRef]
- Deng, J.; Han, Y. Multipath key establishment for wireless sensor networks using Just-Enough redundancy transmission. IEEE Trans. Depend. Secure Comput. 2008, 5, 177–190. [Google Scholar] [CrossRef]
- Castiglione, A.; D’Arco, P.; De Santis, A.; Russo, R. Secure group communication schemes for dynamic heterogeneous distributed computing. Future Gener. Comput. Syst. 2017, 74, 313–324. [Google Scholar] [CrossRef]
- Ali, R.; Pal, A.K.; Kumari, S.; Karuppiah, M.; Conti, M. A secure user authentication and key-agreement scheme using wireless sensor networks for agriculture monitoring. Future Gener. Comput. Syst. 2018, 84, 200–215. [Google Scholar] [CrossRef]
- Meena, U.; Sharma, A. Secure key agreement with rekeying using FLSO routing protocol in wireless sensor network. Wirel. Pers. Commun. 2018, 101, 1177–1199. [Google Scholar] [CrossRef]
- Renold, A.P.; Ganesh, A.B. Energy efficient secure data collection with path-constrained mobile sink in duty-cycled unattended wireless sensor network. Pervasive Mob. Comput. 2019, 55, 1–12. [Google Scholar] [CrossRef]
- Oliveira, L.M.L.; Rodrigues, J.J.P.C.; de Sousa, A.F.; Denisov, V.M. Network admission control solution for 6LoWPAN networks based on symmetric key mechanisms. IEEE Trans. Ind. Inform. 2016, 12, 2186–2195. [Google Scholar] [CrossRef]
- Han, L.; Zhou, M.; Jia, W.; Dalil, Z.; Xu, X. Intrusion detection model of wireless sensor networks based on game theory and an autoregressive model. Inf. Sci. 2019, 476, 491–504. [Google Scholar] [CrossRef]
- Arthur, M.P.; Kannan, K. Cross-layer based multiclass intrusion detection system for secure multicast communication of MANET in military networks. Wirel. Netw. 2016, 22, 1035–1059. [Google Scholar] [CrossRef]
- Borkar, G.M.; Mahajan, A.R. A secure and trust based on-demand multipath routing scheme for self-organized mobile ad-hoc networks. Wirel. Netw. 2017, 23, 2455–2472. [Google Scholar] [CrossRef]
- Russia, S.; Anita, R. Joint cost and secured node disjoint energy efficient multipath routing in mobile ad hoc network. Wirel. Netw. 2017, 23, 2307–2316. [Google Scholar] [CrossRef]
- Almazyad, A.S. Reputation-Based mechanisms to avoid misbehaving nodes in ad hoc and wireless sensor networks. Neural Comput. Appl. 2018, 29, 597–607. [Google Scholar] [CrossRef]
- Alnumay, W.; Ghosh, U.; Chatterjee, P. A Trust-Based predictive model for mobile ad hoc network in internet of things. Sensors 2019, 19, 1467. [Google Scholar] [CrossRef] [PubMed]
- Janani, V.S.; Manikandan, M.S.K. Efficient trust management with Bayesian-Evidence theorem to secure public key infrastructure-based mobile ad hoc networks. EURASIP J. Wirel. Commun. Netw. 2018, 2018, 25. [Google Scholar]
- Sethuraman, P.; Kannan, N. Refined trust energy-ad hoc on demand distance vector (ReTE-AODV) routing algorithm for secured routing in MANET. Wirel. Netw. 2017, 23, 2227–2237. [Google Scholar] [CrossRef]
- Shajilin Loret, J.B.; Vijayalakshmi, K. Security enrichment with trust multipath routing and key management approach in WMN. IETE J. Res. 2018, 64, 709–721. [Google Scholar] [CrossRef]
- Yang, L.; Lu, Y.; Liu, S.; Guo, T.; Liang, Z. A dynamic behavior monitoring Game-Based trust evaluation scheme for clustering in wireless sensor networks. IEEE Access 2018, 6, 71404–71412. [Google Scholar] [CrossRef]
- Duan, J.; Gao, D.; Yang, D. An energy-aware trust derivation scheme with game theoretic approach in wireless sensor networks for IoT applications. IEEE Internet Things J. 2014, 1, 58–69. [Google Scholar] [CrossRef]
- Feng, R.; Che, S.; Wang, X. An incentive mechanism based on game theory for trust management. Secur. Commun. Netw. 2014, 7, 2318–2325. [Google Scholar] [CrossRef]
- Mo, J.; Huang, B.; Cheng, X. Improving security and stability of ad hoc on-demand distance vector with fuzzy neural network in vehicular ad hoc network. Int. J. Distrib. Sens. Netw. 2018, 14, 1550147718806193. [Google Scholar] [CrossRef]
- Tan, S.; Li, X.; Dong, Q. A trust management system for securing data plane of ad-hoc networks. IEEE Trans. Veh. Technol. 2016, 65, 7579–7592. [Google Scholar] [CrossRef]
- Isabel, R.A.; Baburaj, E. An optimal trust aware cluster based routing protocol using fuzzy based trust inference model and improved evolutionary particle swarm optimization in WBANs. Wirel. Pers. Commun. 2018, 101, 201–222. [Google Scholar] [CrossRef]
- Kowshik, H.; Kumar, P.R. Optimal function computation in directed and undirected graphs. IEEE Trans. Inf. Theory 2012, 58, 3407–3418. [Google Scholar] [CrossRef]
- Zawaideh, F.; Salamah, M. An efficient weighted trust-based malicious node detection scheme for wireless sensor networks. Int. J. Commun. Syst. 2019, 32, e3878. [Google Scholar] [CrossRef]
- Swaruba, P.; Ganesh, V.R. Weighted voting based trust management for intrusion tolerance in heterogeneous wireless sensor networks. In Proceedings of the International Conference on Information Communication and Embedded Systems (ICICES2014), Chennai, India, 27–28 February 2014; pp. 1–7. [Google Scholar]
- Mahmoud, M.M.E.A.; Lin, X.; Shen, X. Secure and reliable routing protocols for heterogeneous multihop wireless networks. IEEE Trans. Parallel Distrib. Syst. 2015, 26, 1140–1153. [Google Scholar] [CrossRef]
- Karthick, S.; Sree Devi, E.; Nagarajan, R.V. Trust-distrust protocol for the secure routing in wireless sensor networks. In Proceedings of the 2017 International Conference on Algorithms, Methodology, Models and Applications in Emerging Technologies (ICAMMAET), Chennai, India, 16–18 February 2017. [Google Scholar]
- Usman, A.B.; Gutierrez, J. DATM: A dynamic attribute trust model for efficient collaborative routing. Ann. Oper. Res. 2019, 277, 293–310. [Google Scholar] [CrossRef]
- Airehrour, D.; Gutierrez, J.A.; Ray, S.K. SecTrust-RPL: A secure trust-aware RPL routing protocol for Internet of Things. Future Gen. Comput. Syst. 2019, 93, 860–876. [Google Scholar] [CrossRef]
- Xiao, B.; Yu, B.; Gao, C. CHEMAS: Identify suspect nodes in selective forwarding attacks. J. Parallel Distrib. Comput. 2002, 67, 1218–1230. [Google Scholar] [CrossRef]
- Saha, A.; Lee, Y.W.; Hwang, Y.S.; Psannis, K.E.; Kim, B.G. Context-aware block-based motion estimation algorithm for multimedia internet of things (IoT) platform. Pers. Ubiquitous Comput. 2018, 22, 163–172. [Google Scholar] [CrossRef]
- Deng, Y.; Chen, Y.; Zhang, Y.; Mahadevan, S. Fuzzy Dijkstra algorithm for shortest path problem under uncertain environment. Appl. Soft Comput. 2012, 12, 1231–1237. [Google Scholar] [CrossRef]
- Luo, C.; Guo, S.Y.; Guo, S.; Yang, L.; Min, G.; Xie, X. Green Communication in Energy Renewable Wireless Mesh Networks: Routing, Rate Control, and Power Allocation. IEEE Trans. Parallel Distrib. Syst. 2014, 25, 3211–3220. [Google Scholar] [CrossRef]
- Heinzelman, W.B.; Chandrakasan, A.P.; Balakrishnan, H. An application-specific protocol architecture for wireless microsensor networks. IEEE Trans. Wirel. Commun. 2002, 1, 660–670. [Google Scholar] [CrossRef]
© 2019 by the authors. Licensee MDPI, Basel, Switzerland. This article is an open access article distributed under the terms and conditions of the Creative Commons Attribution (CC BY) license (http://creativecommons.org/licenses/by/4.0/).
