Room Temperature Ammonia and Humidity Sensing Using Highly Ordered Nanoporous Alumina Films

Abstract
:Introduction
Experimental
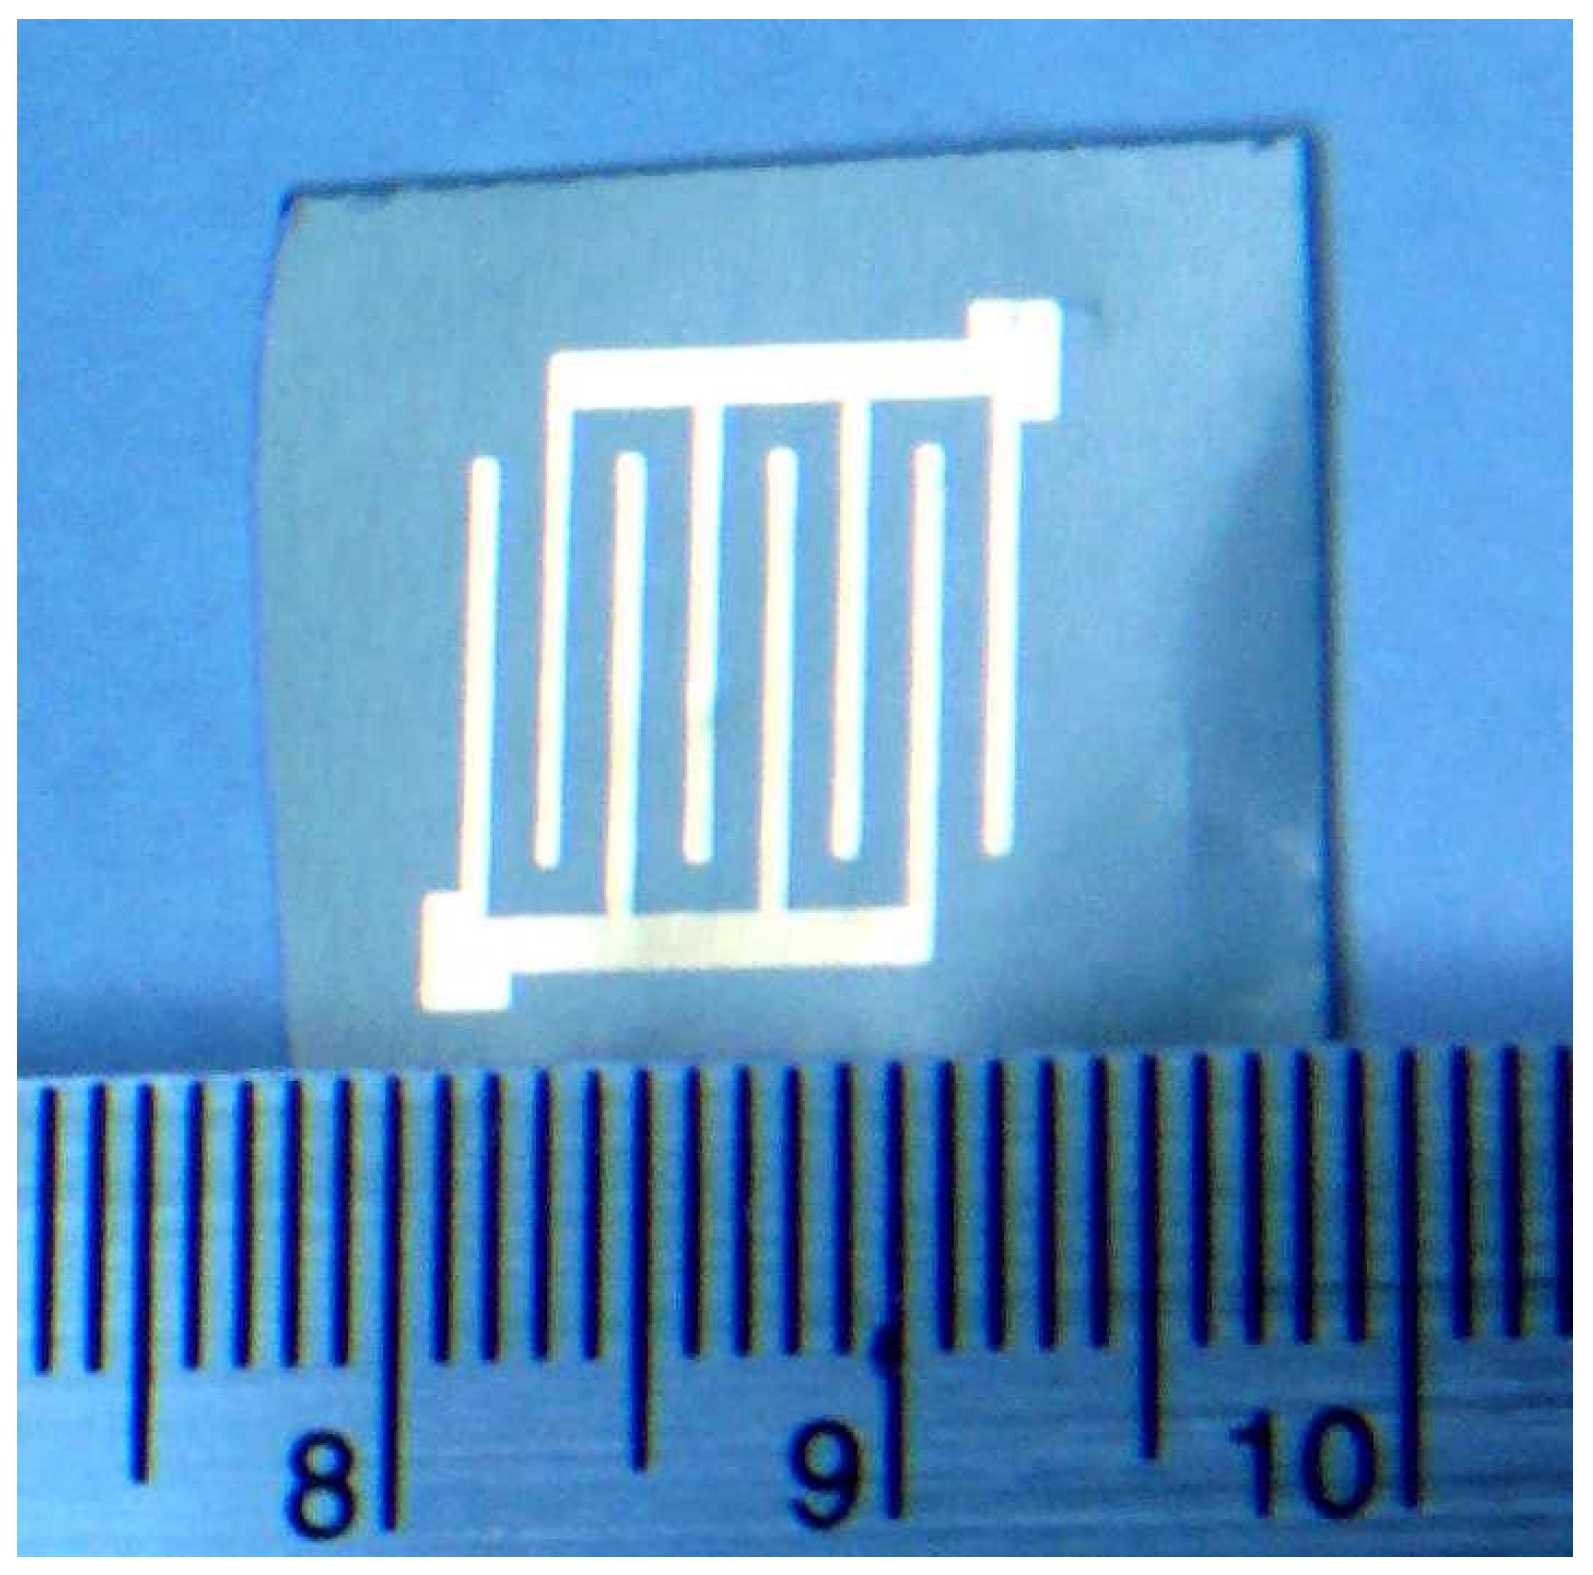
Sample preparation

| Sample | Electrolyte (amount in water) | Anodizing voltage | Duration of anodization (min.) | No. of anodization stages |
|---|---|---|---|---|
| SO50 | 2 wt% oxalic acid | 50V | 120 | one |
| SO30 | 2 wt% oxalic acid | 30V | 120 | one |
| DS15 | 4 wt% sulfuric acid | 15V | 120 | two |

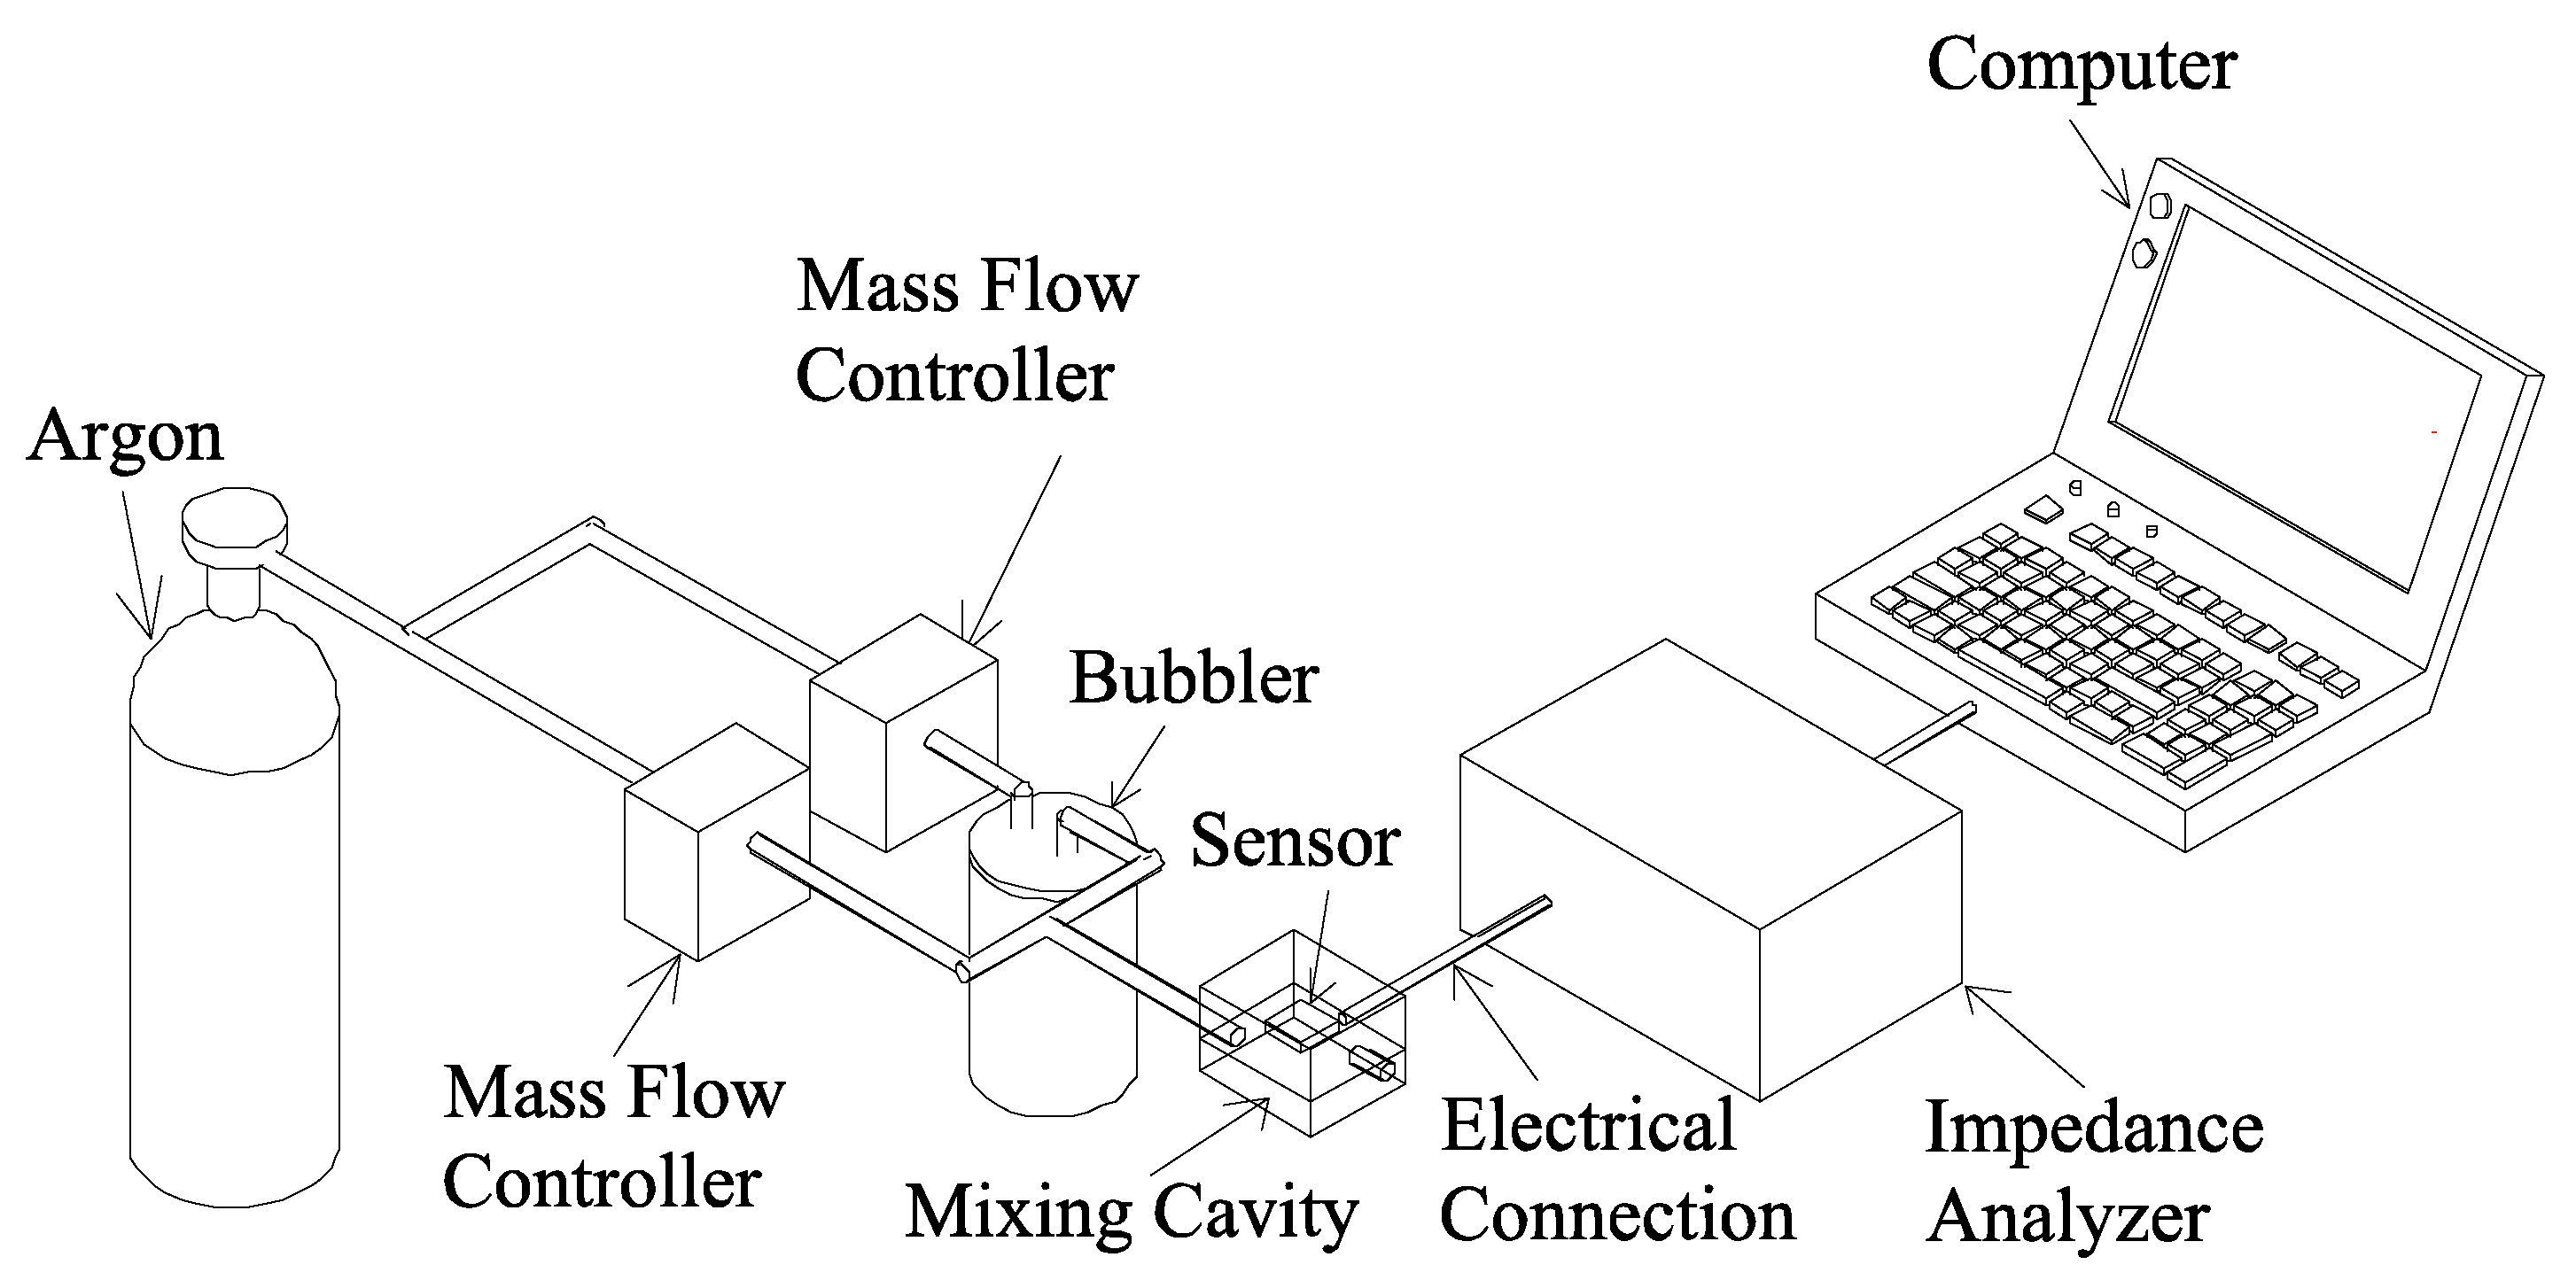
Experimental set up
Results and Discussion
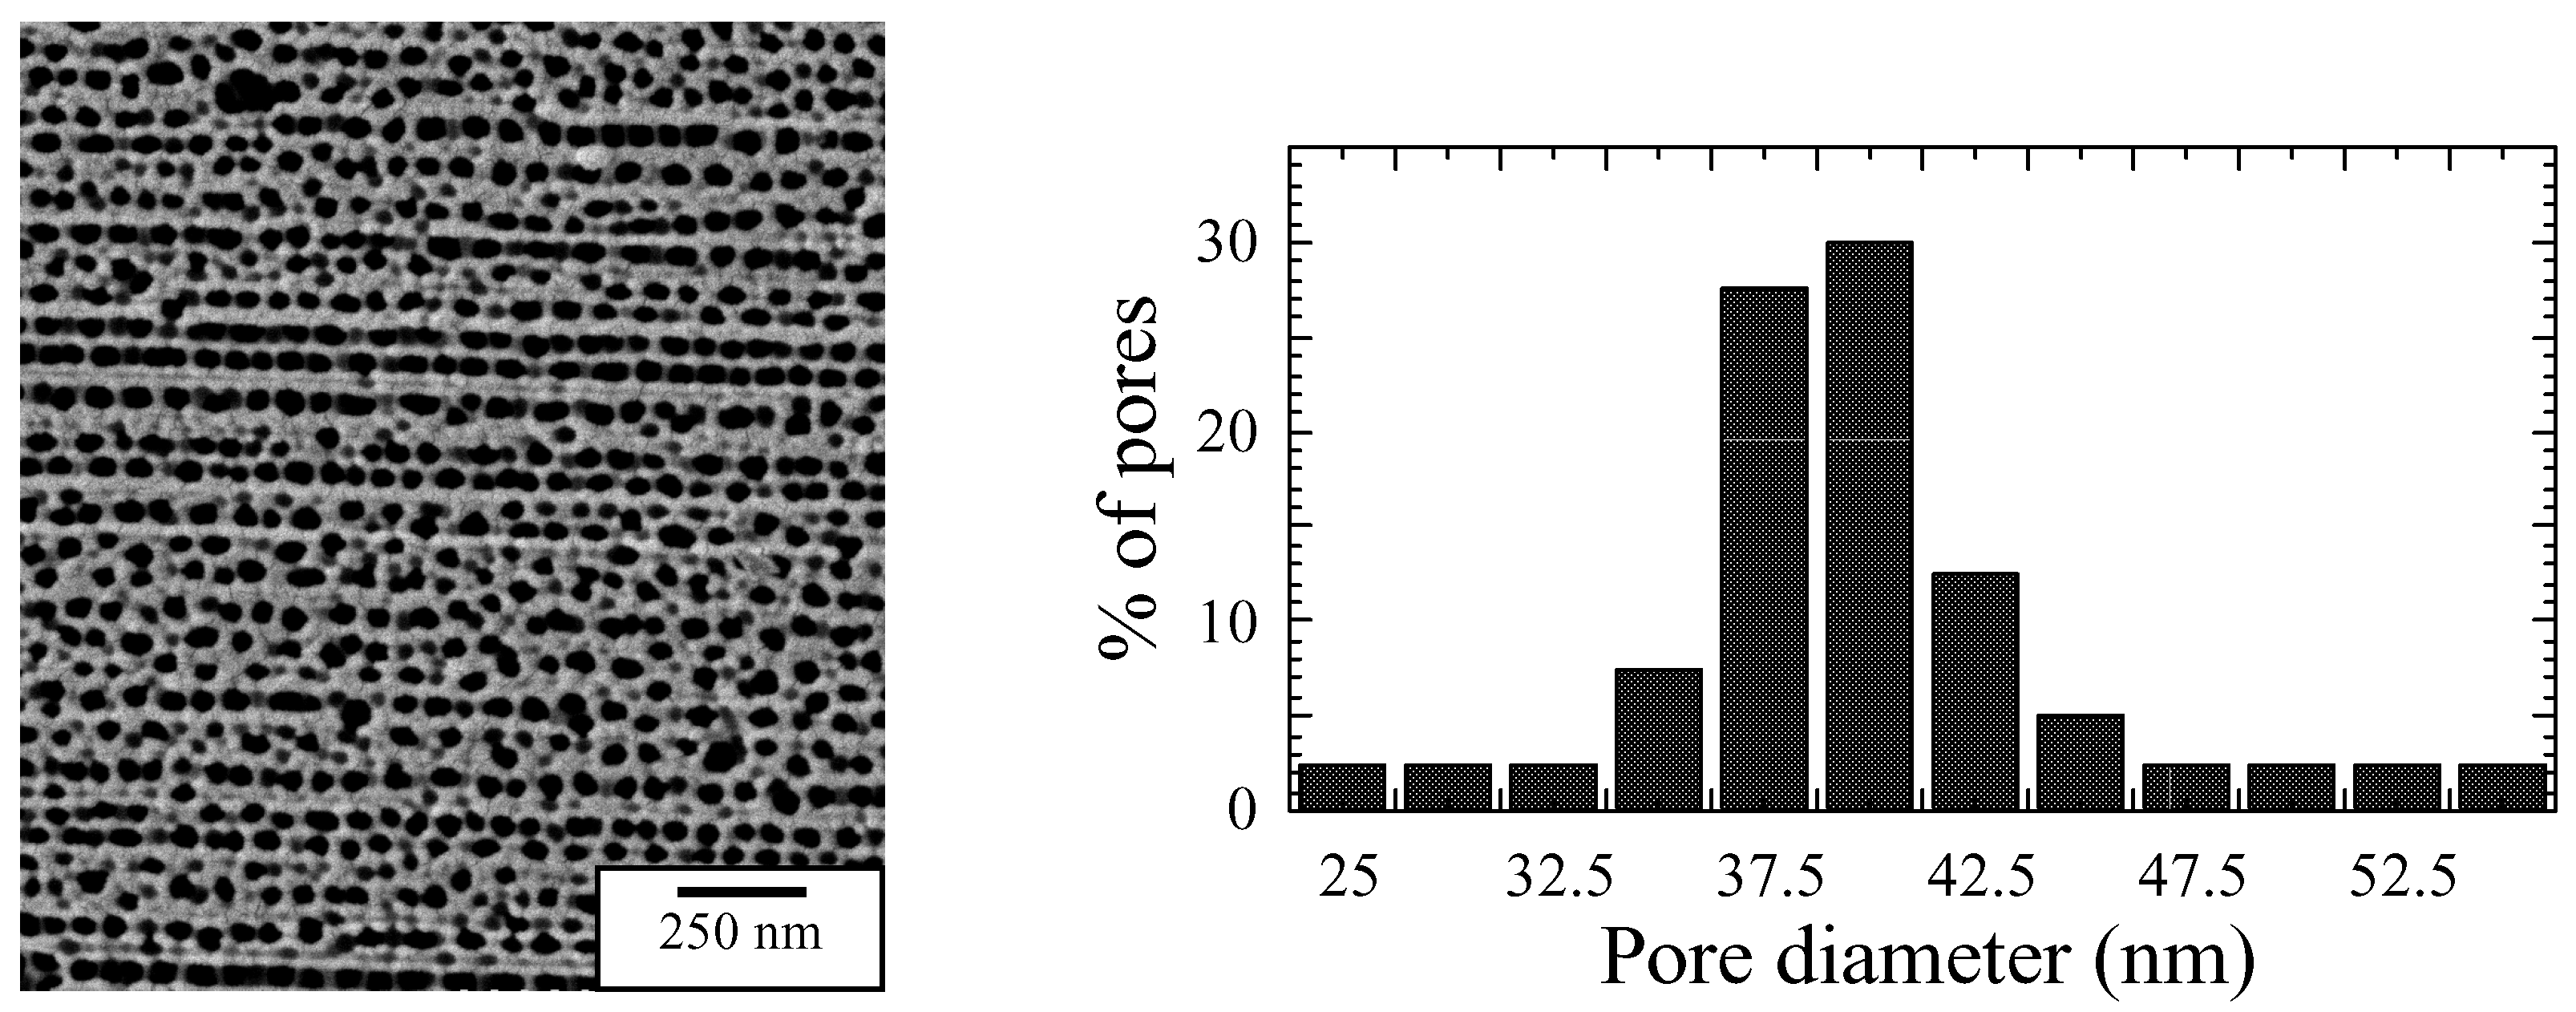
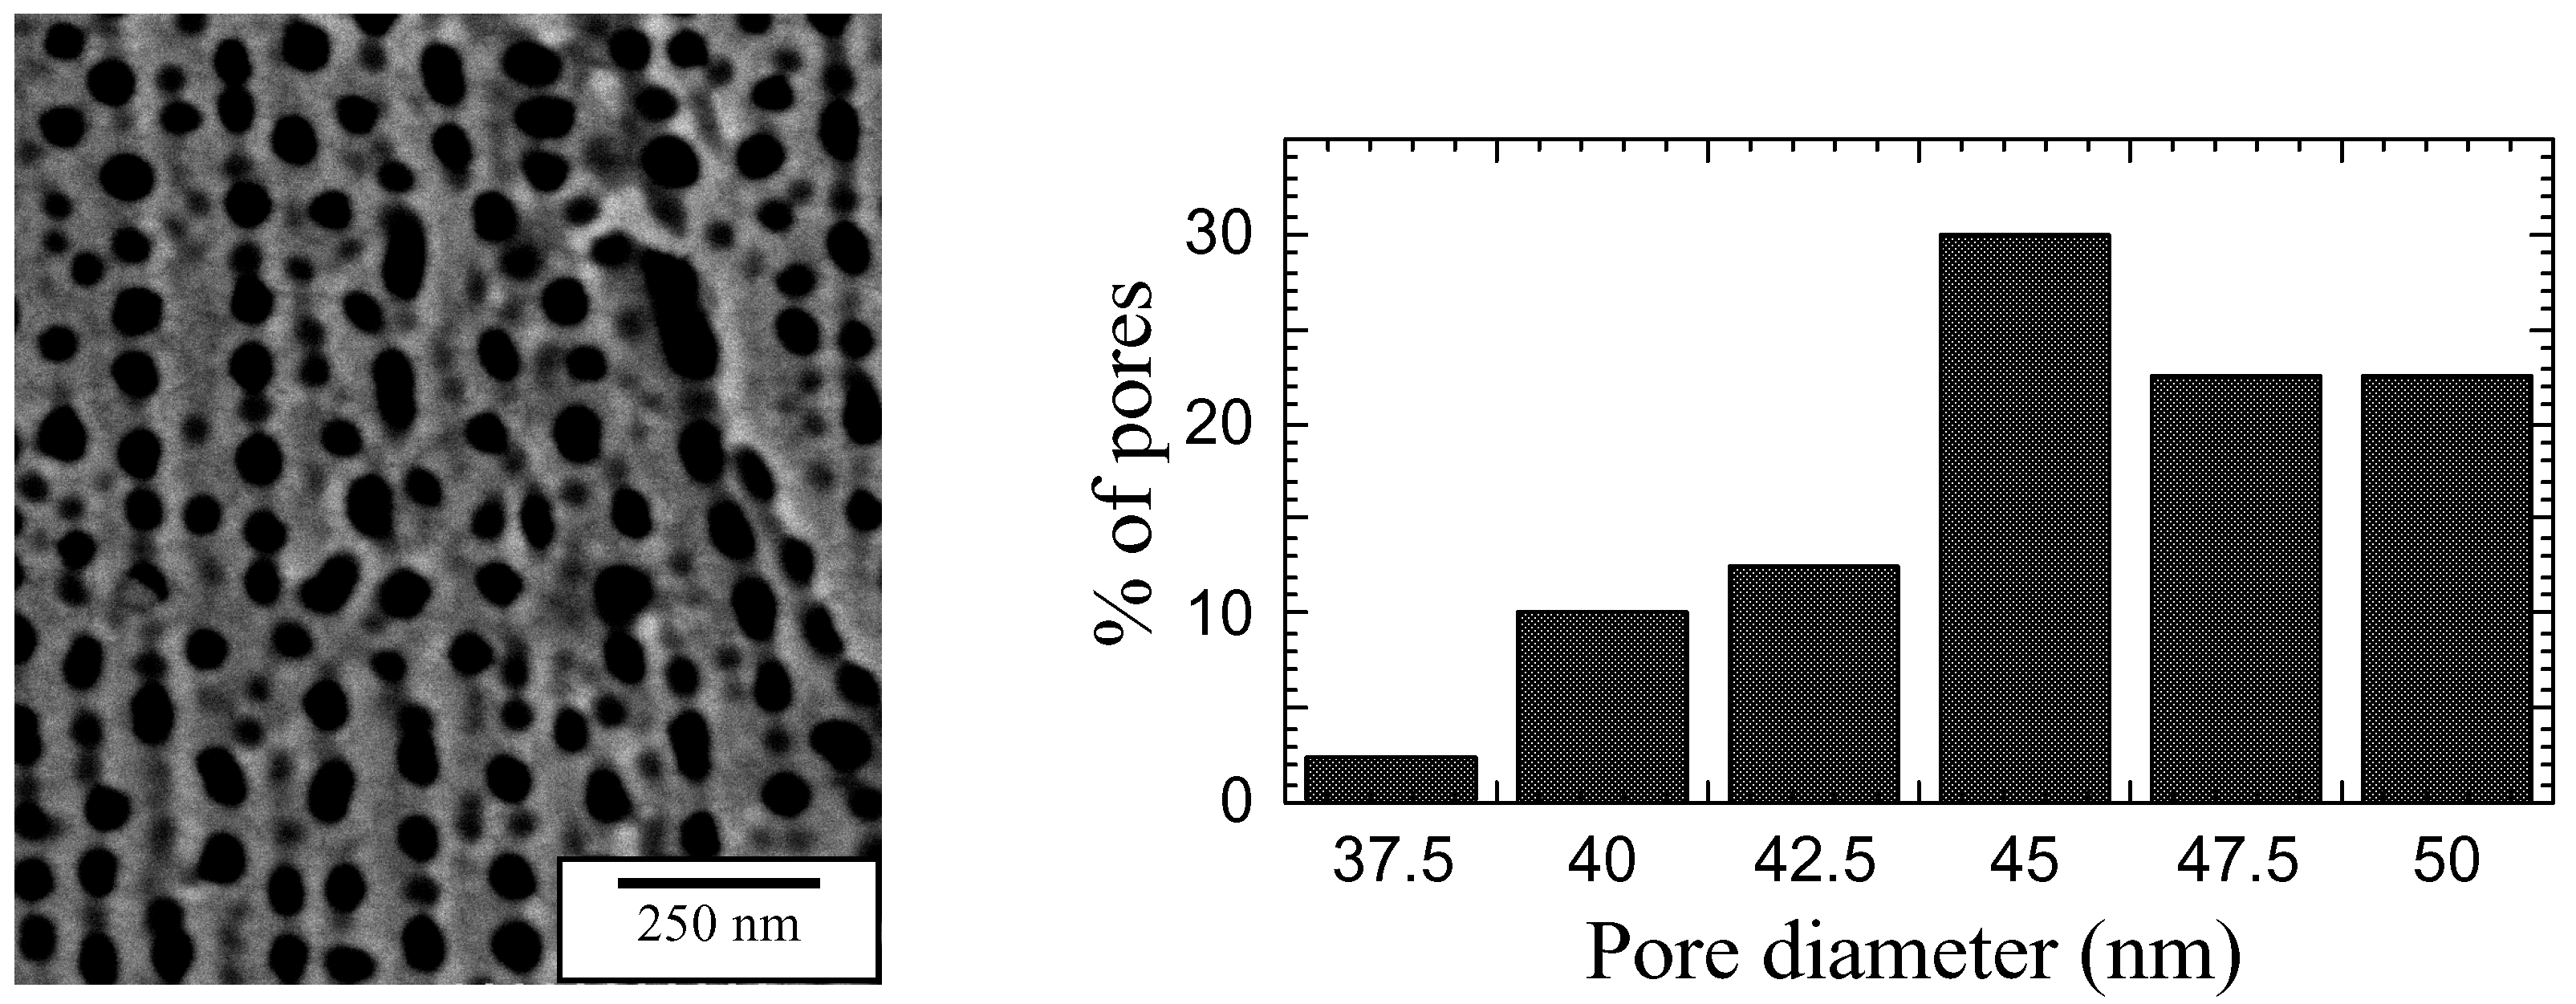
Surface morphology


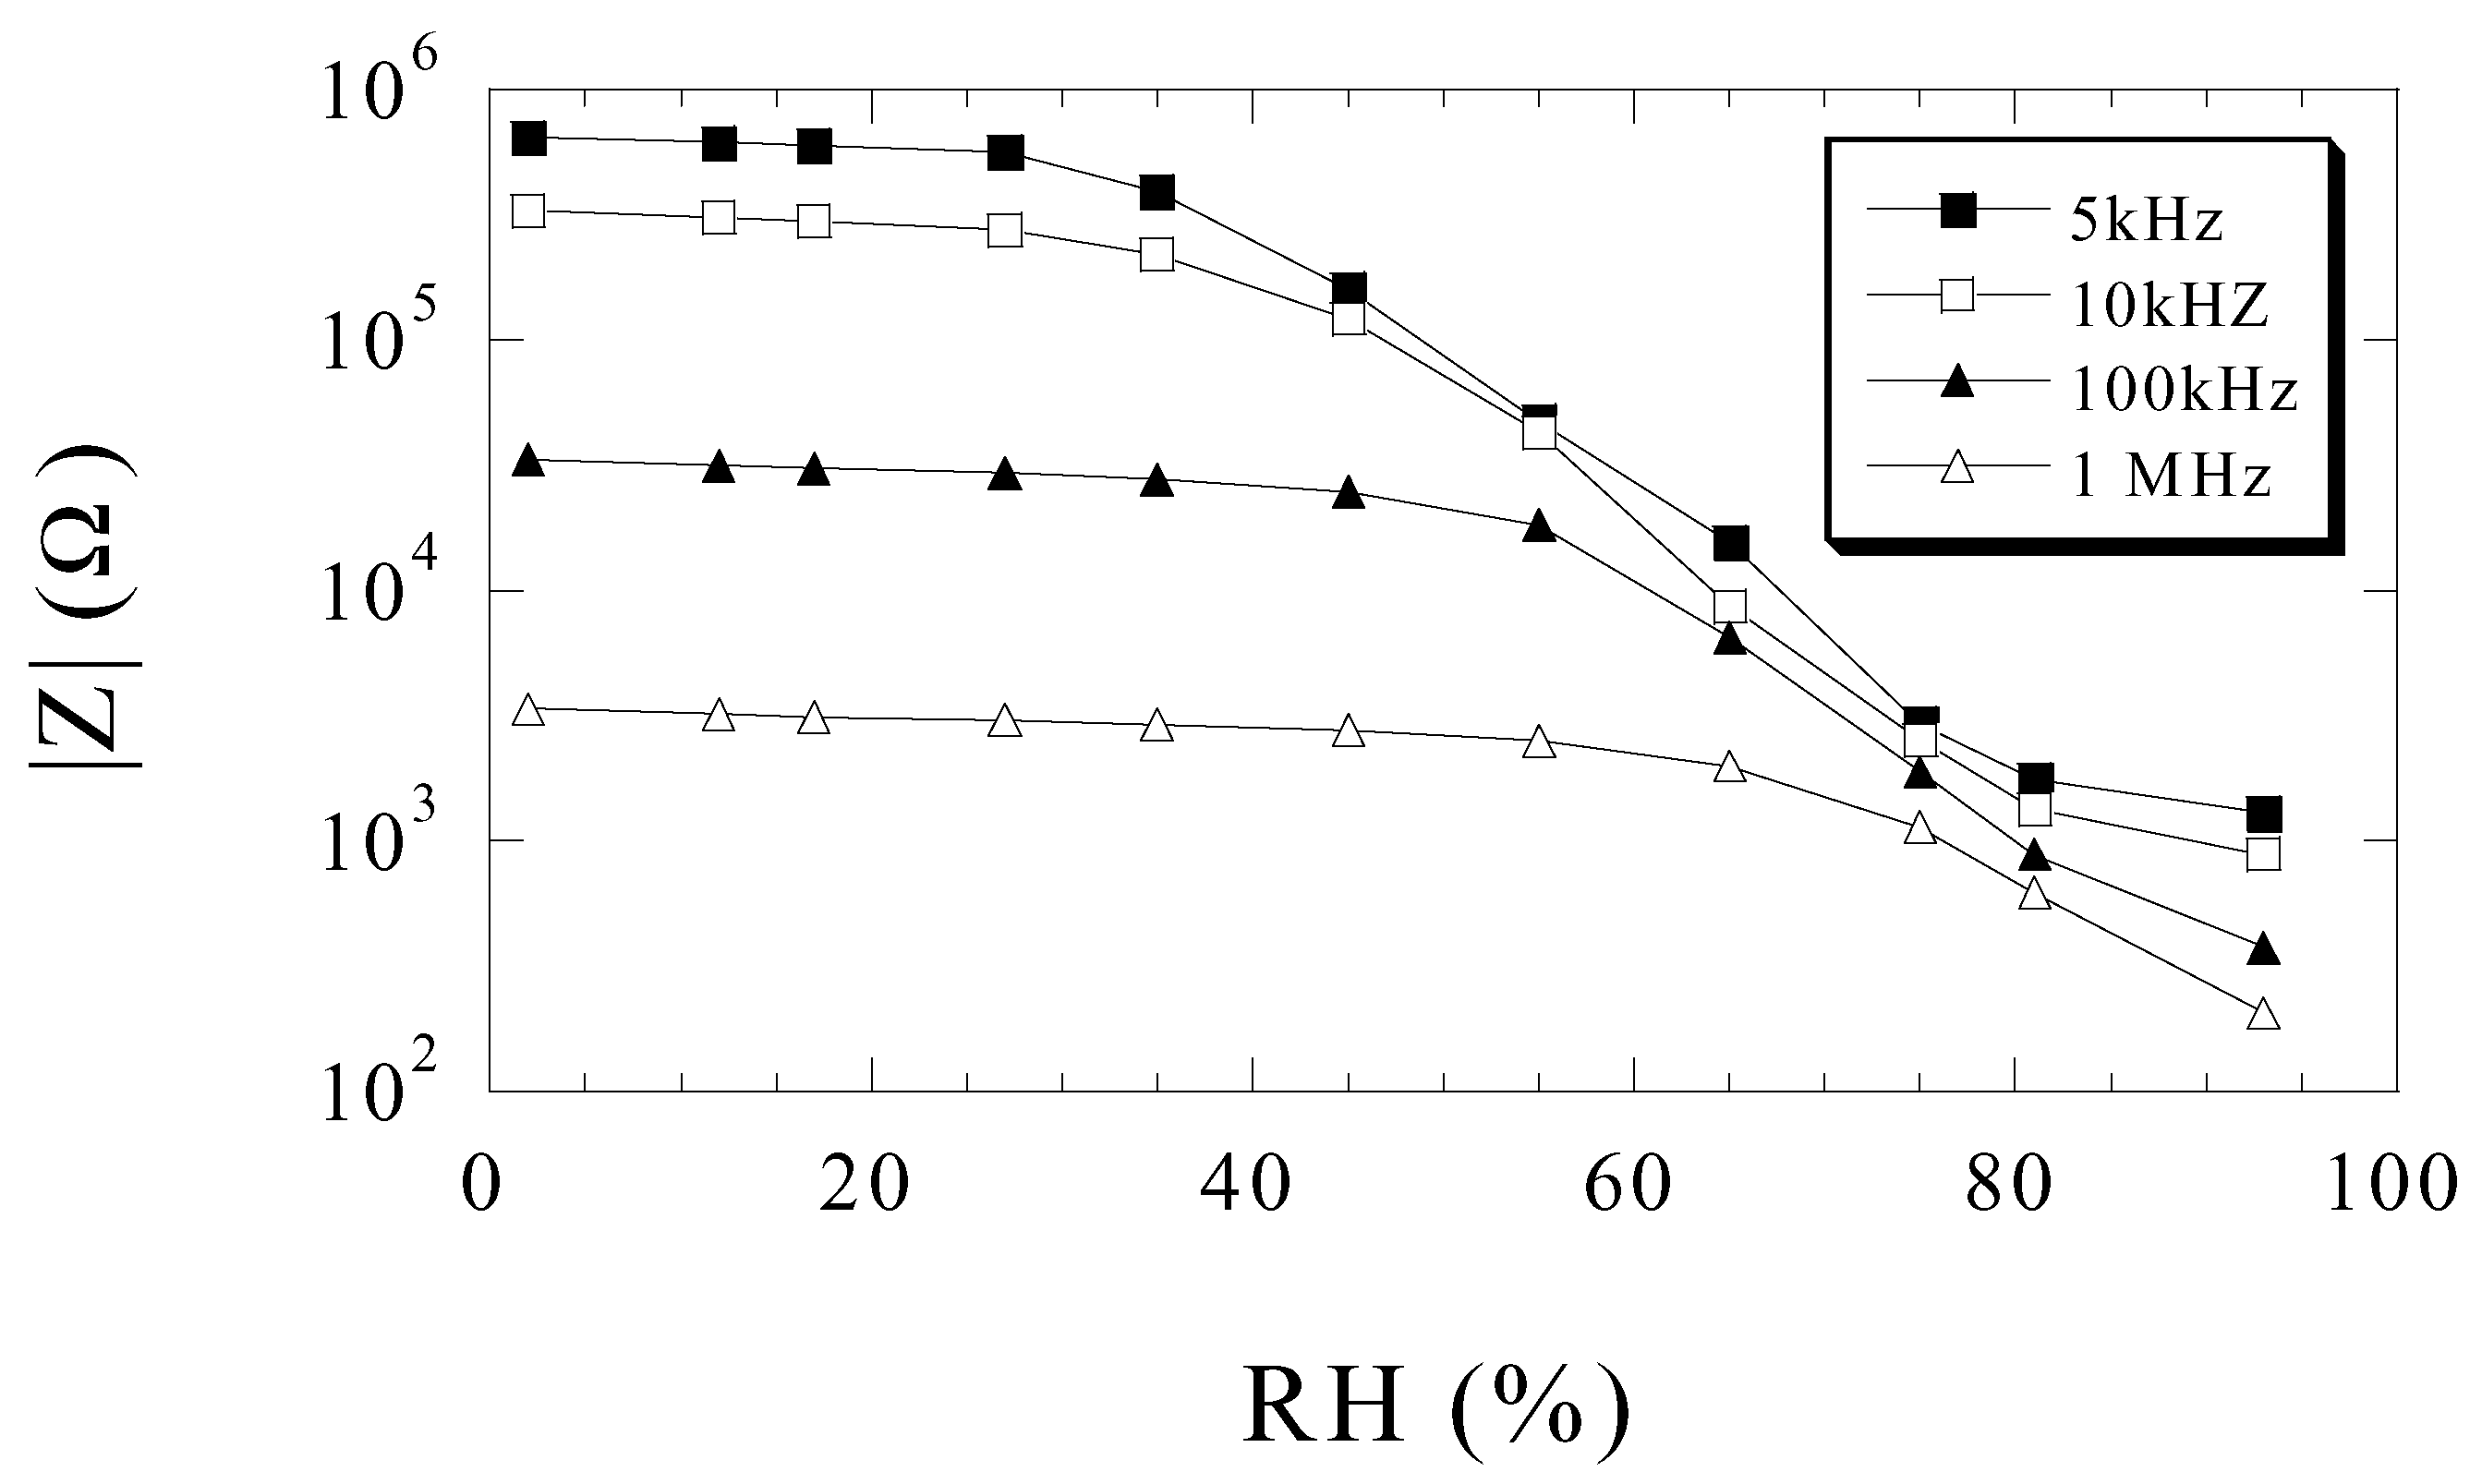
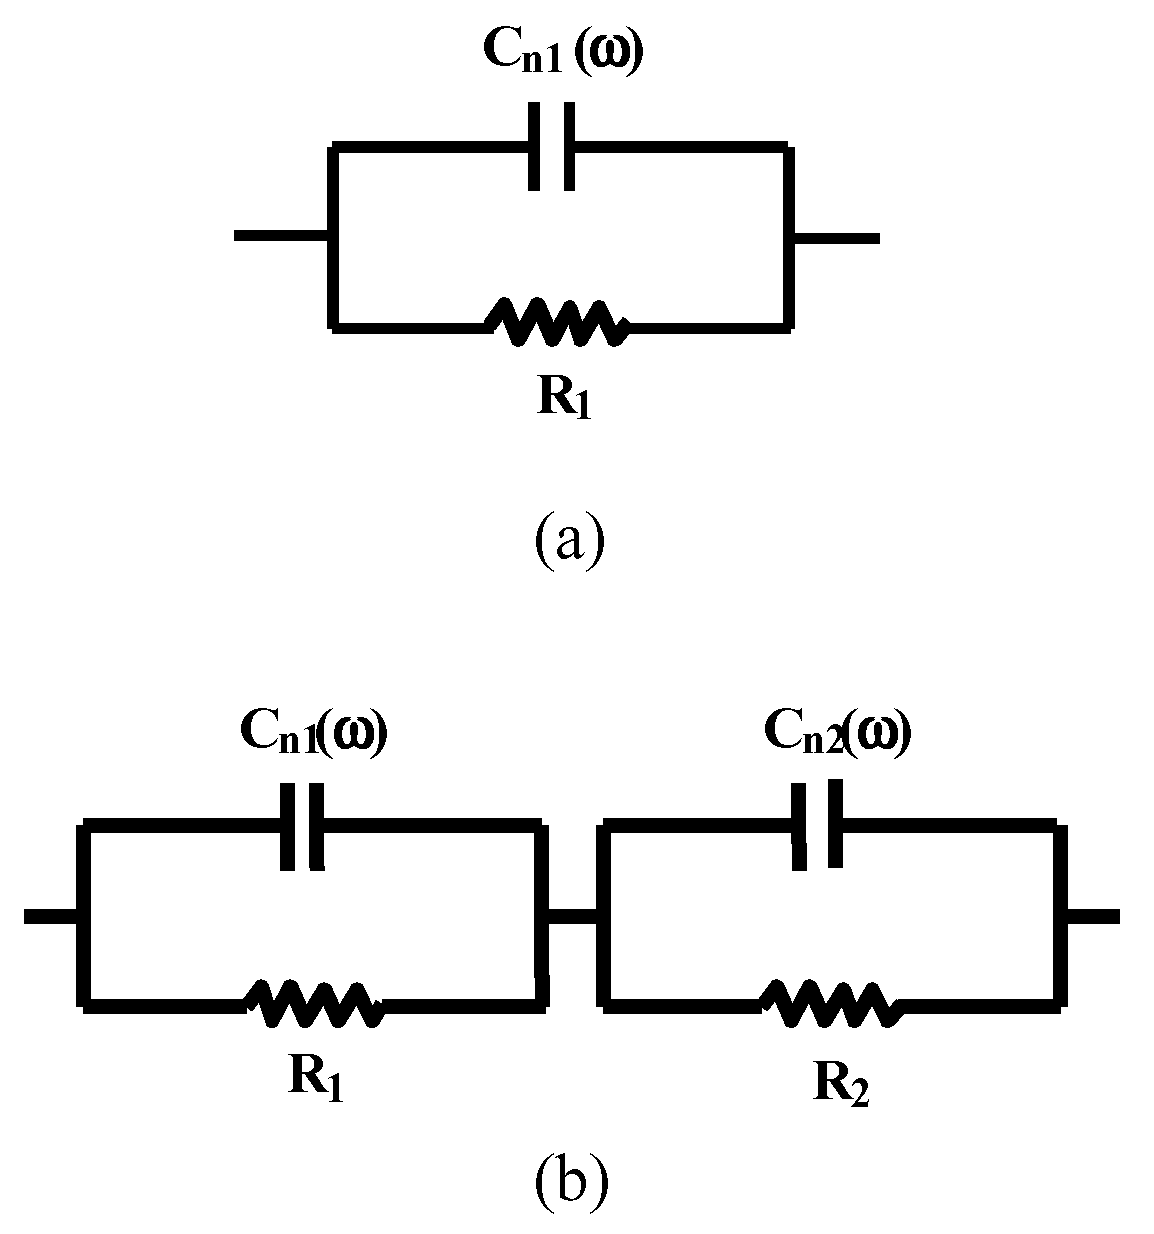
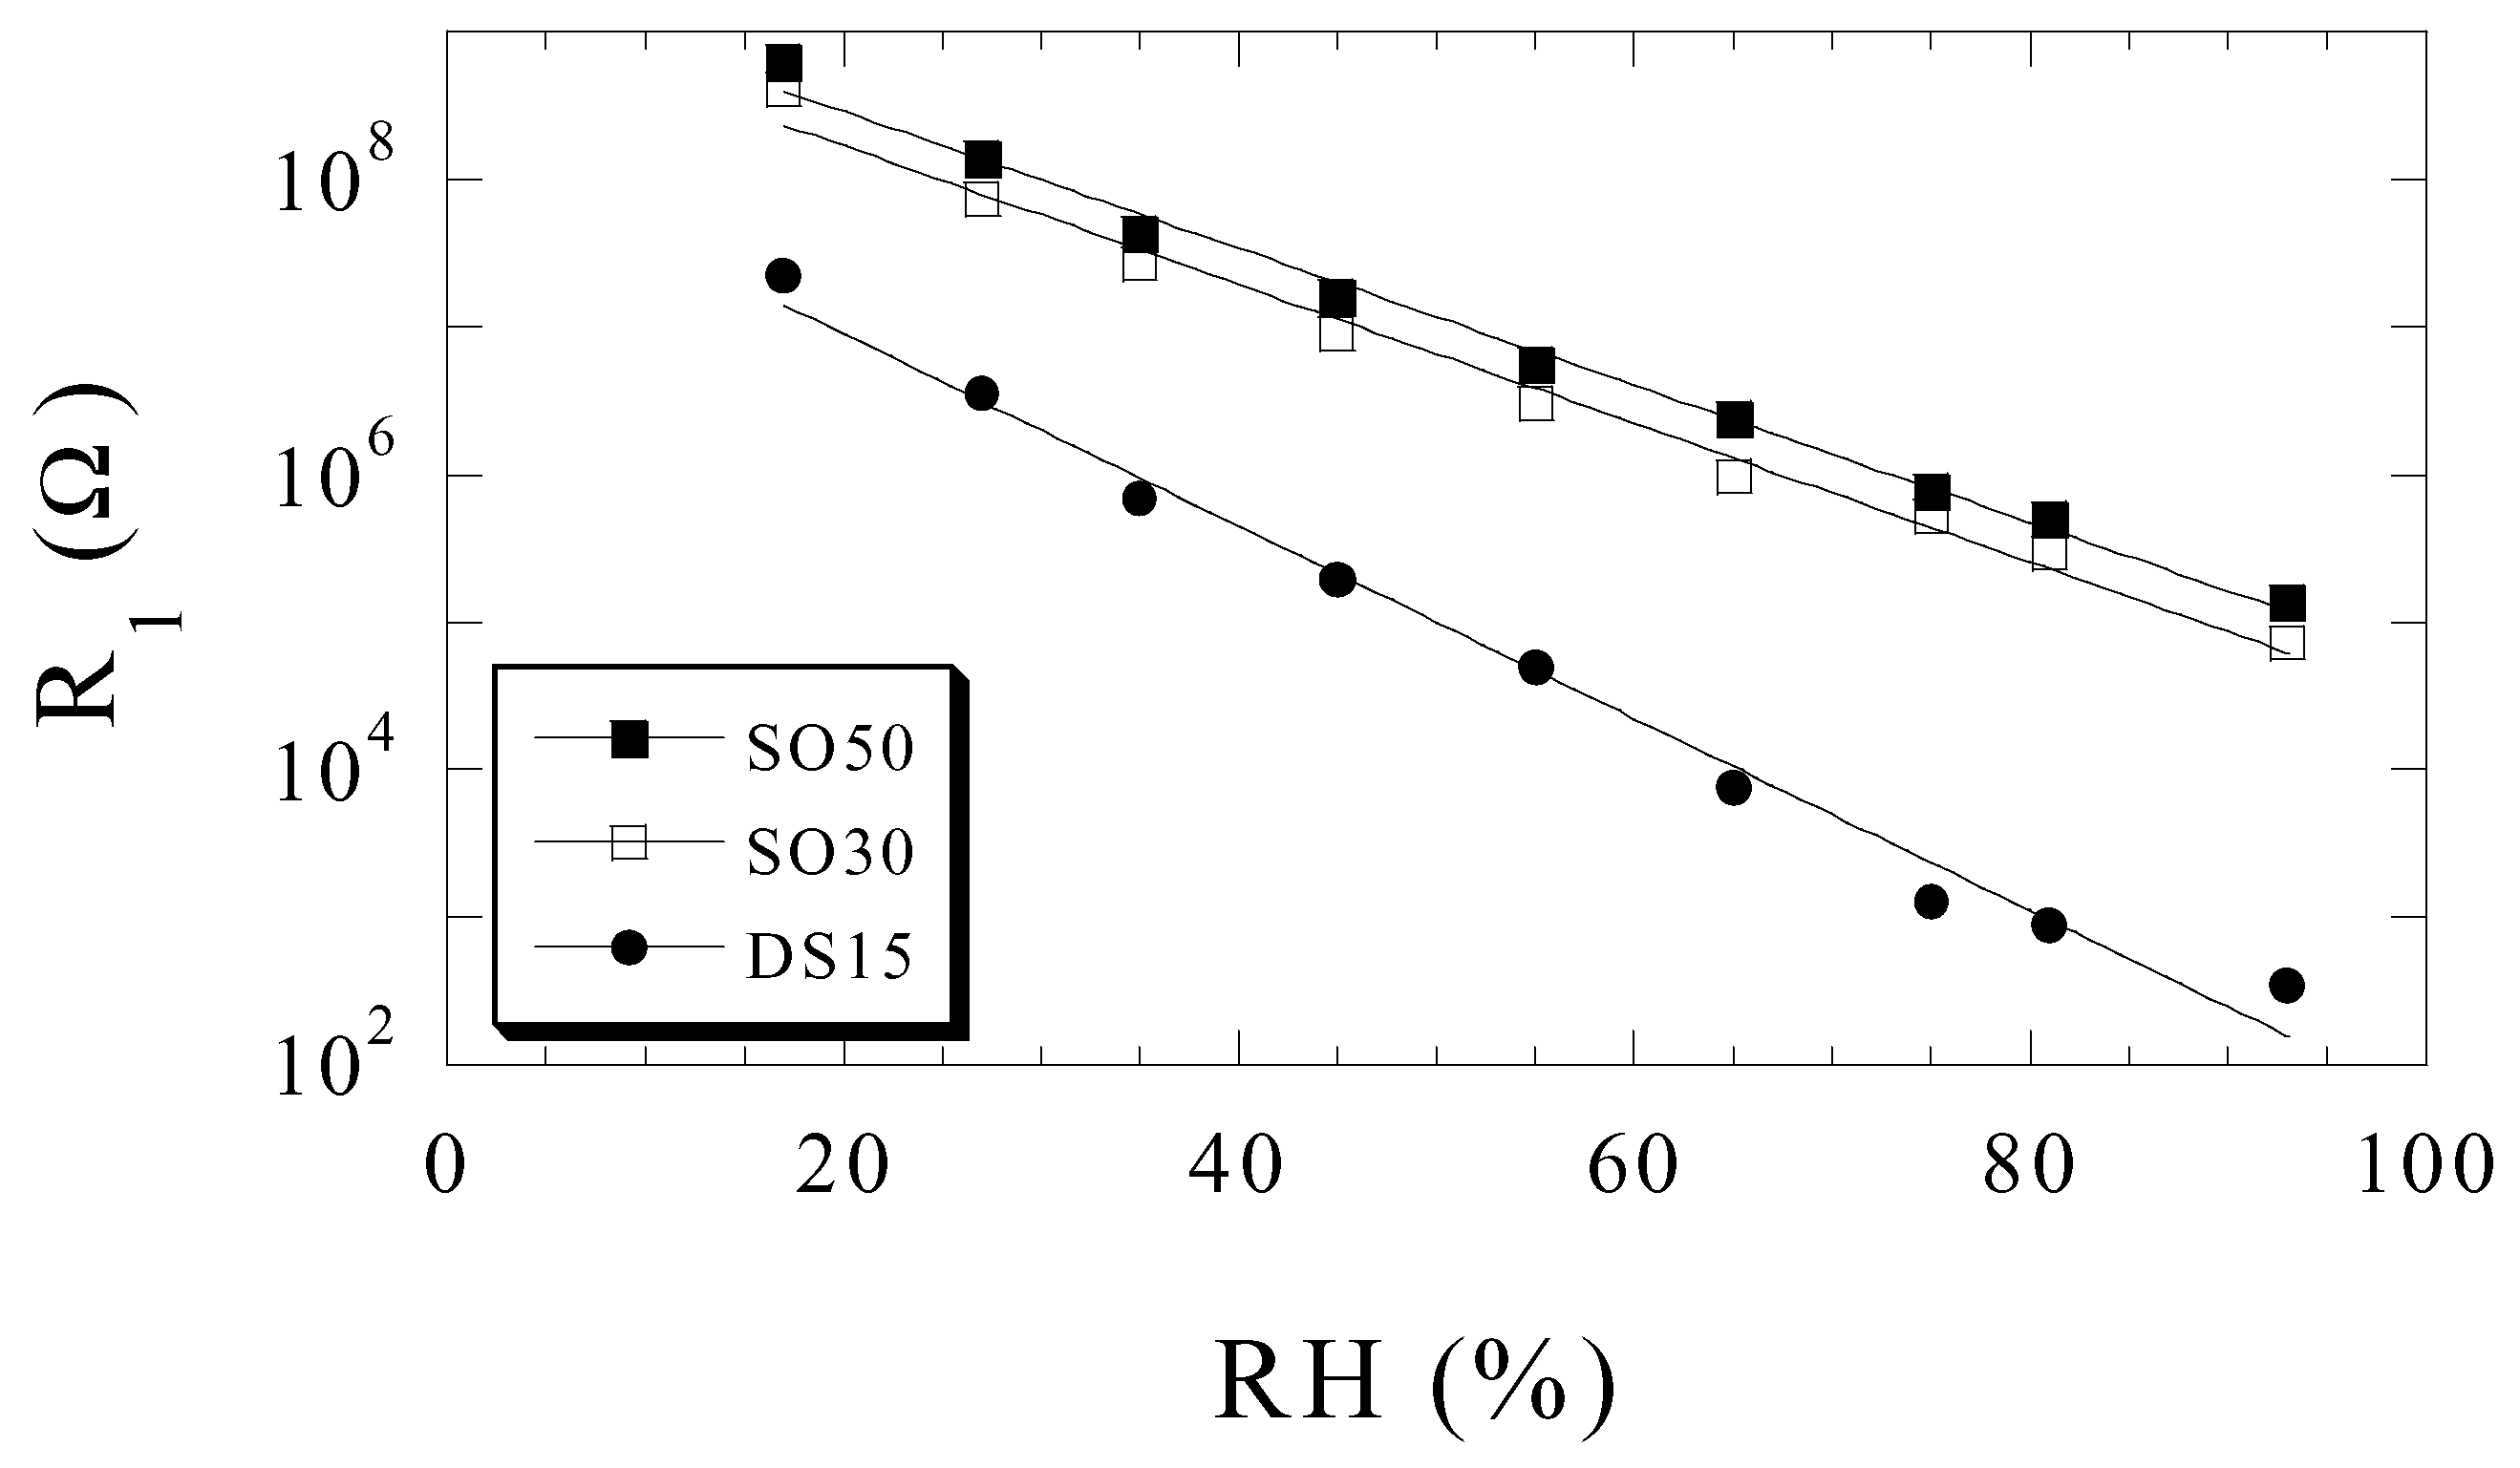
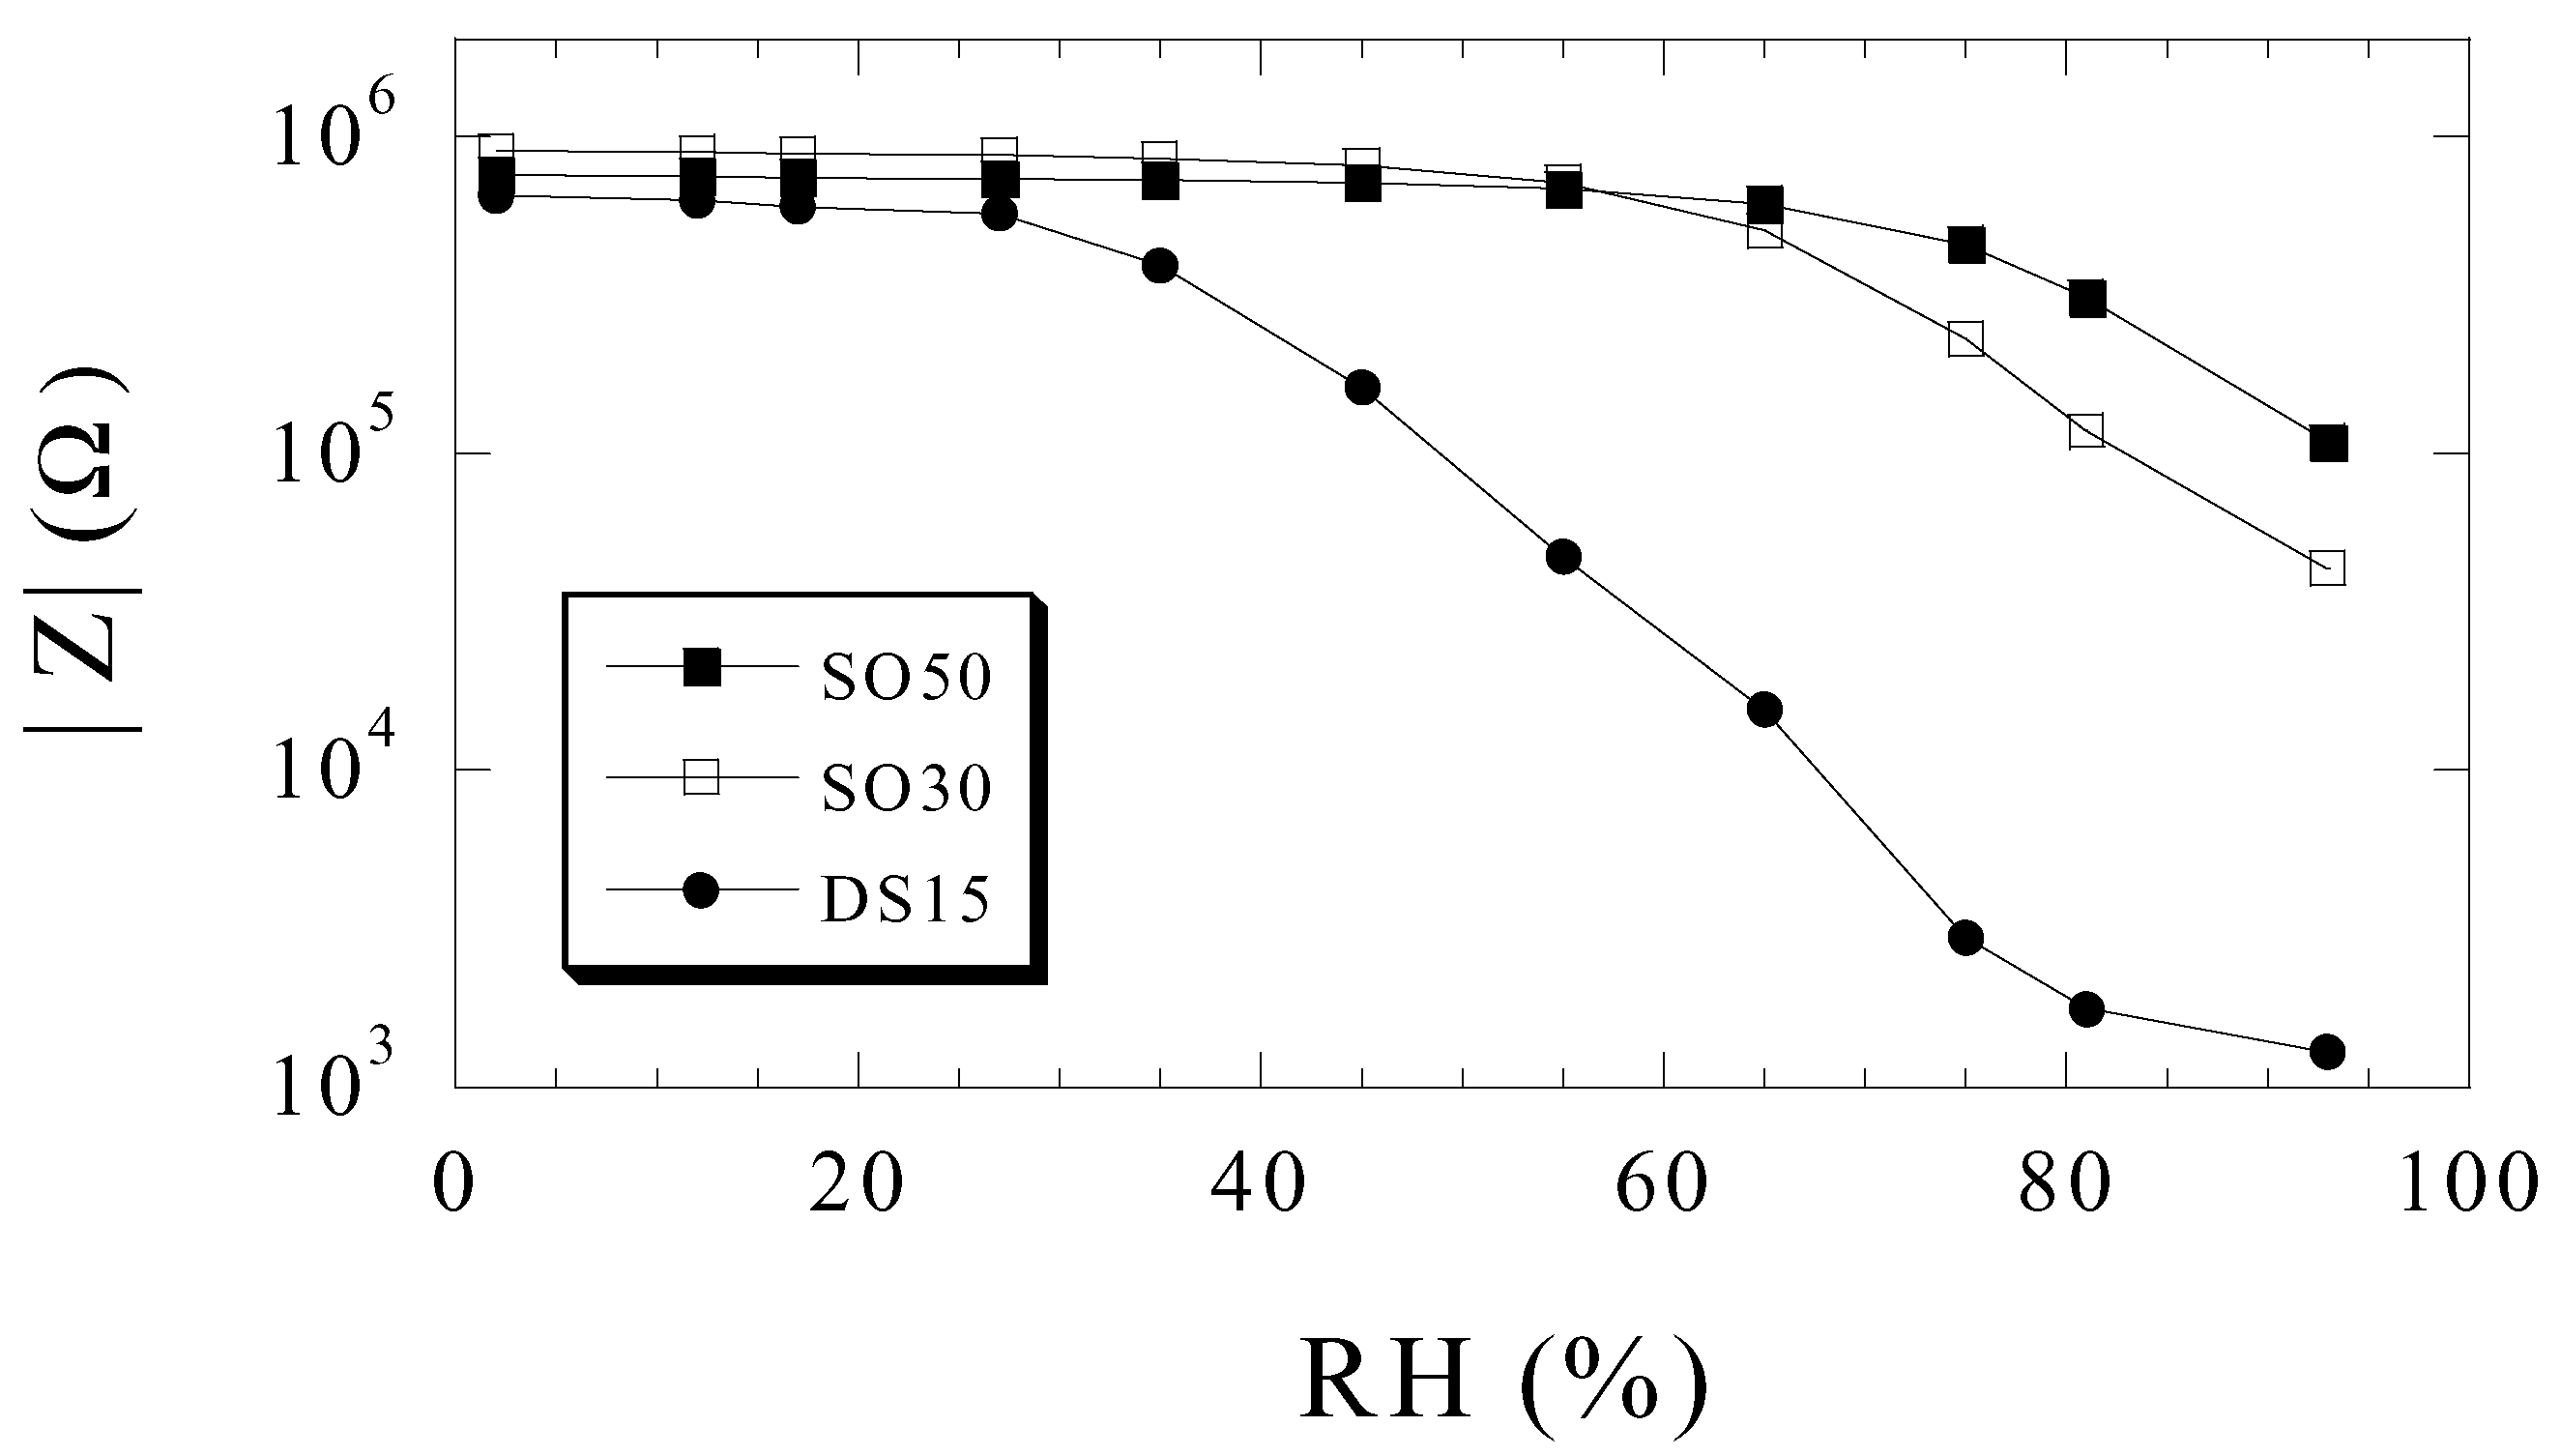
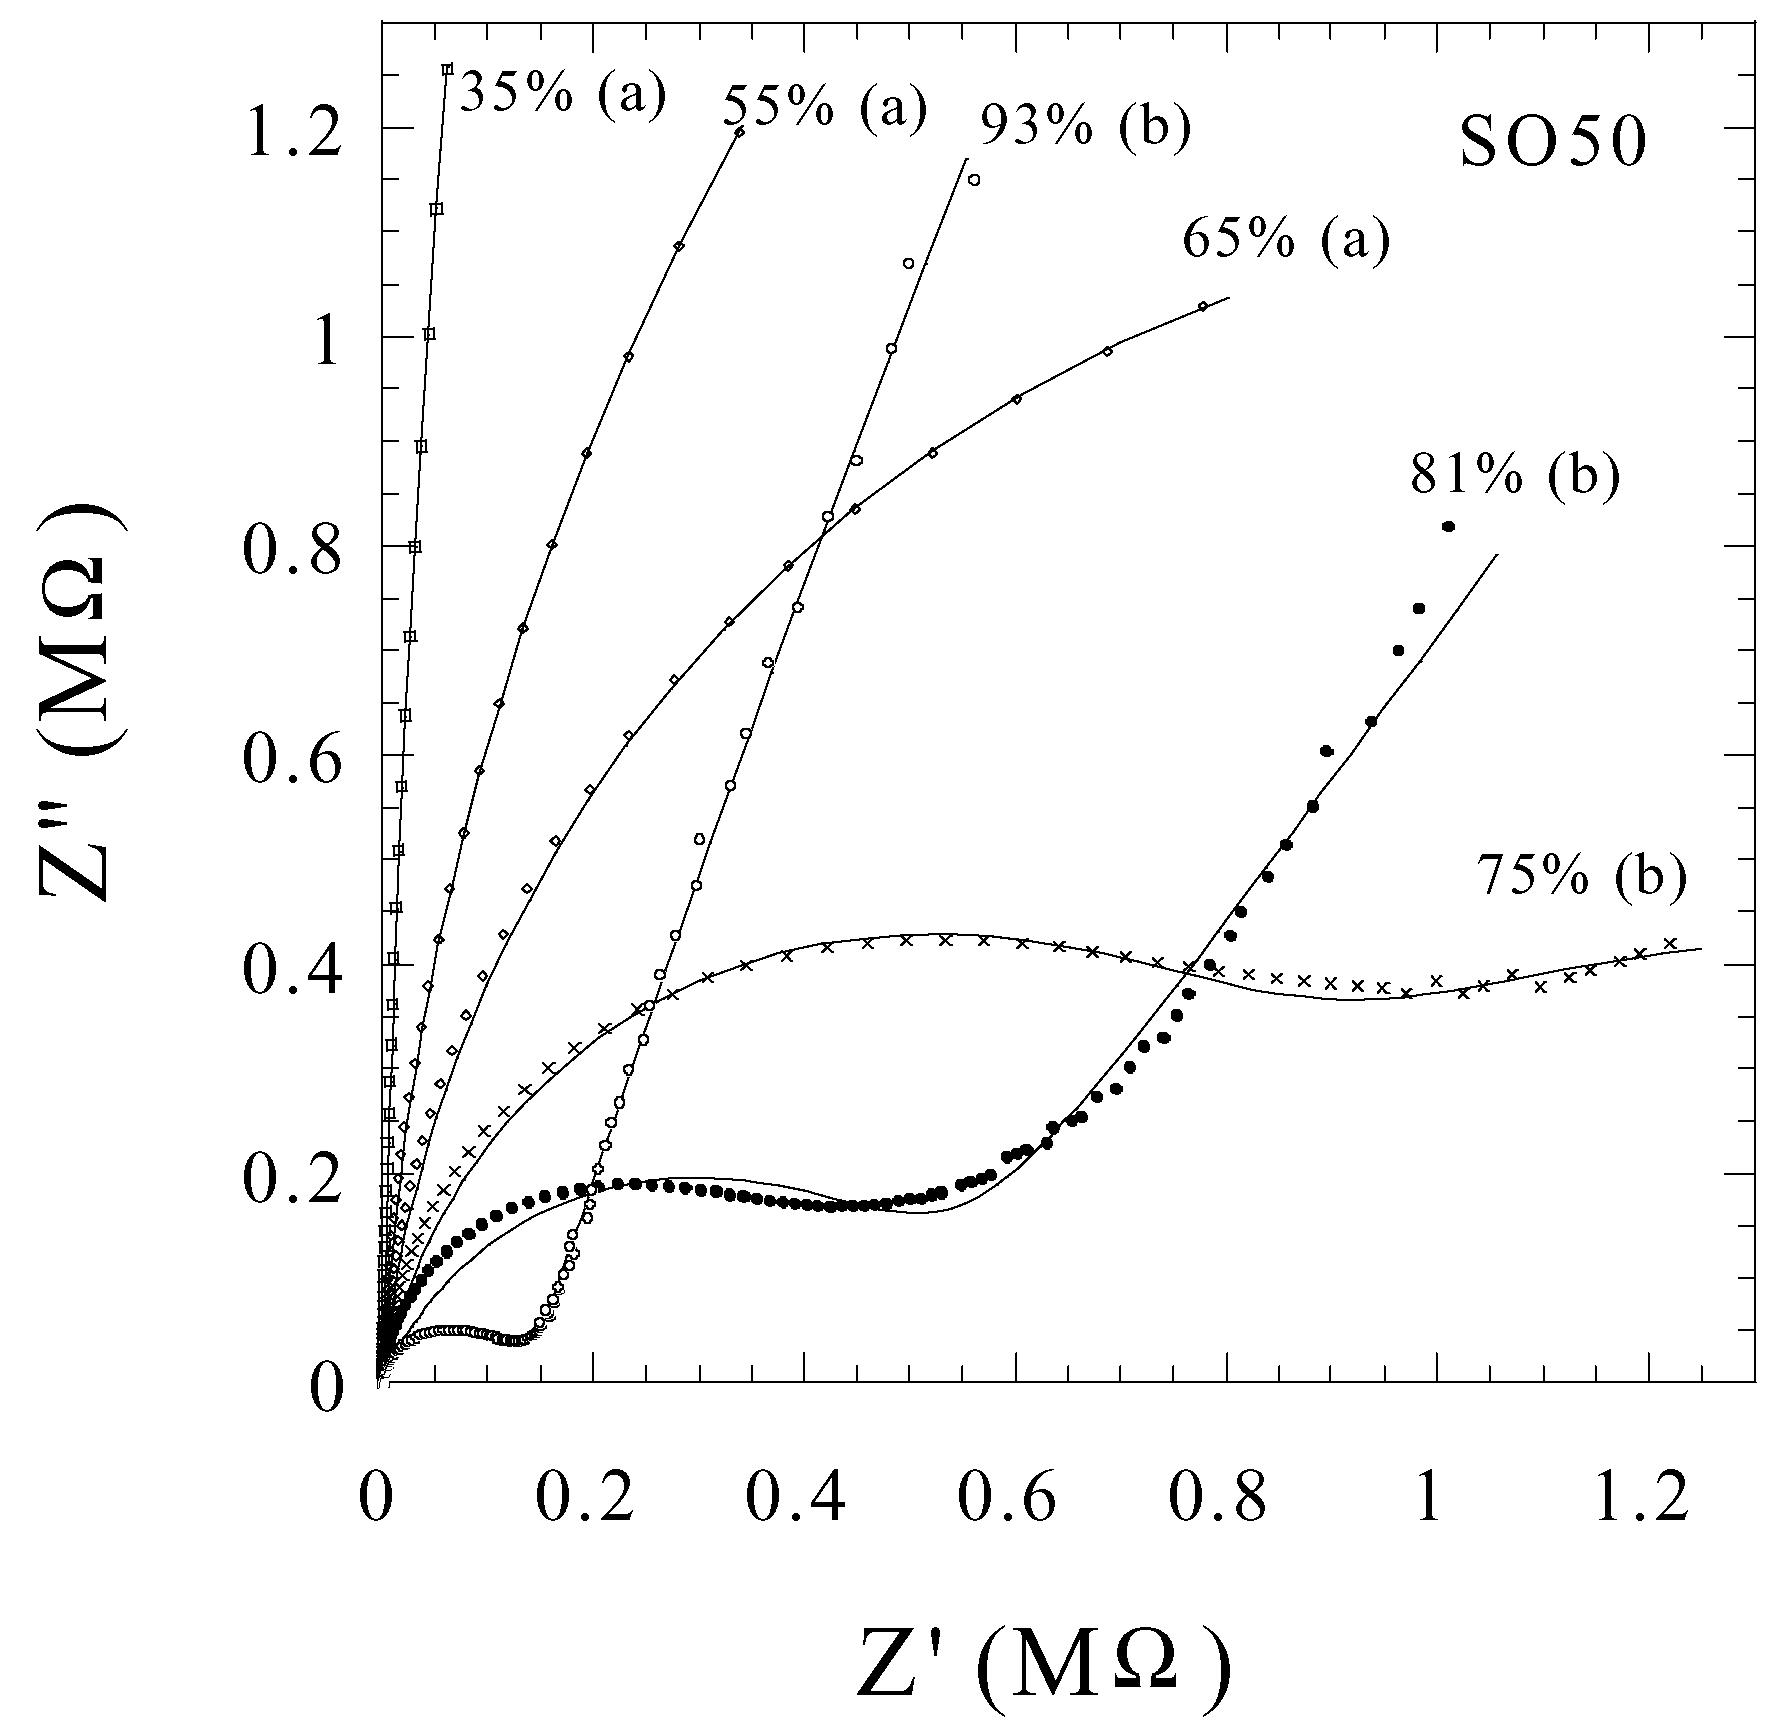
Humidity Sensing


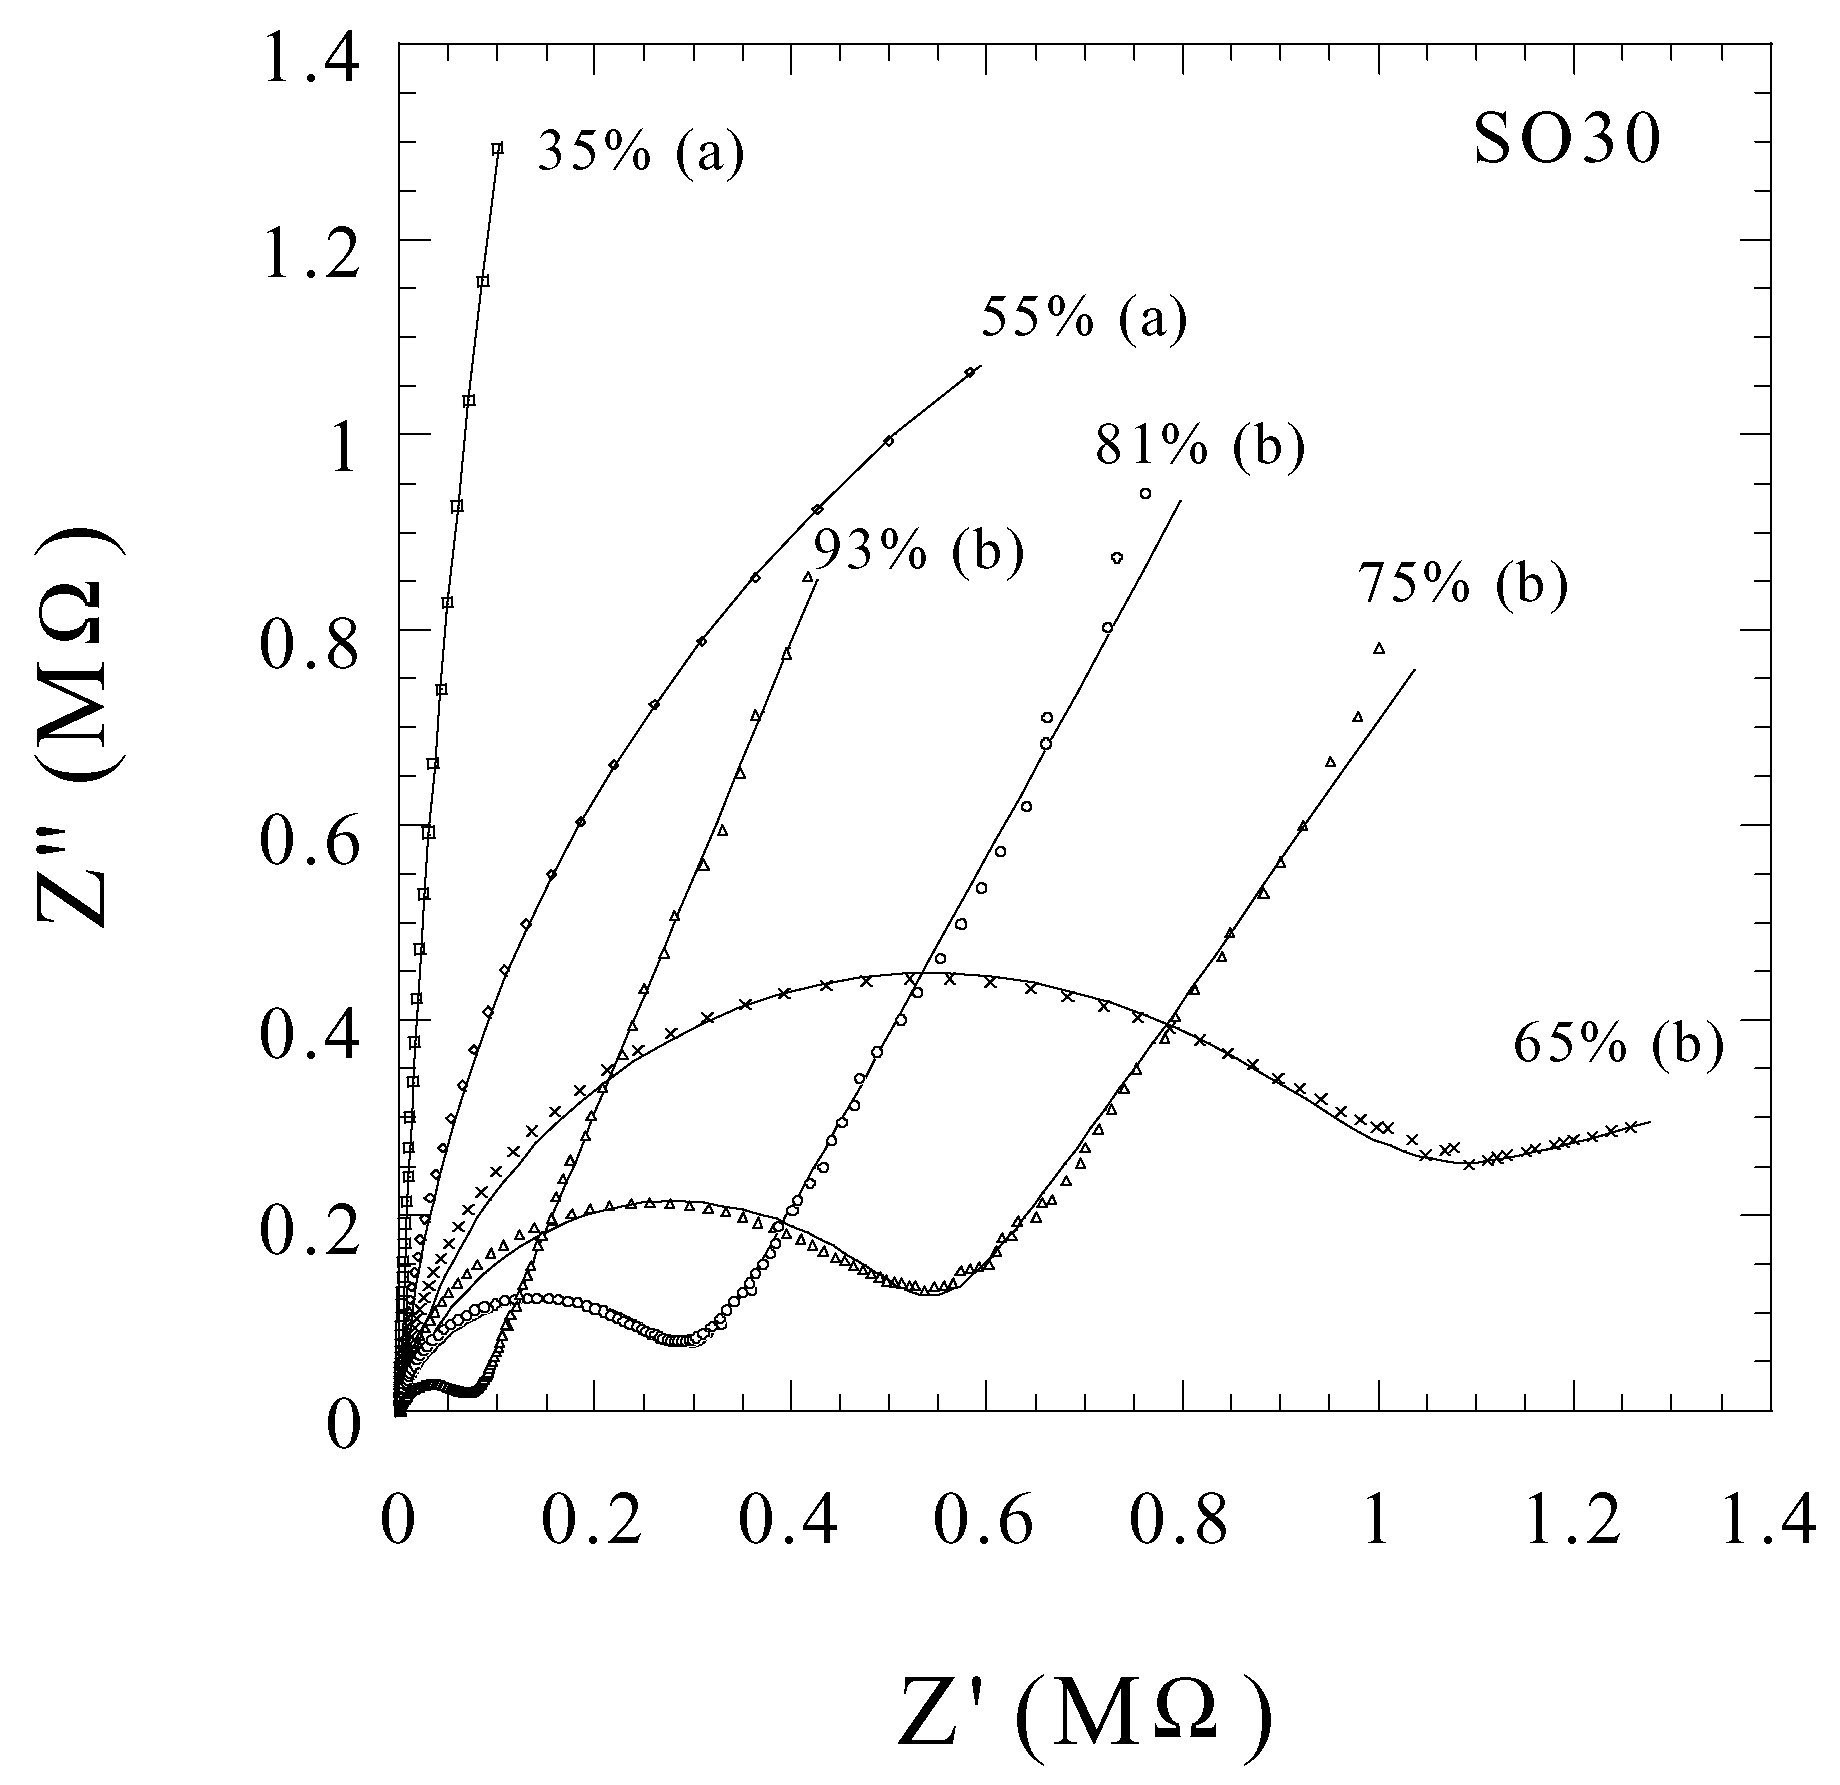
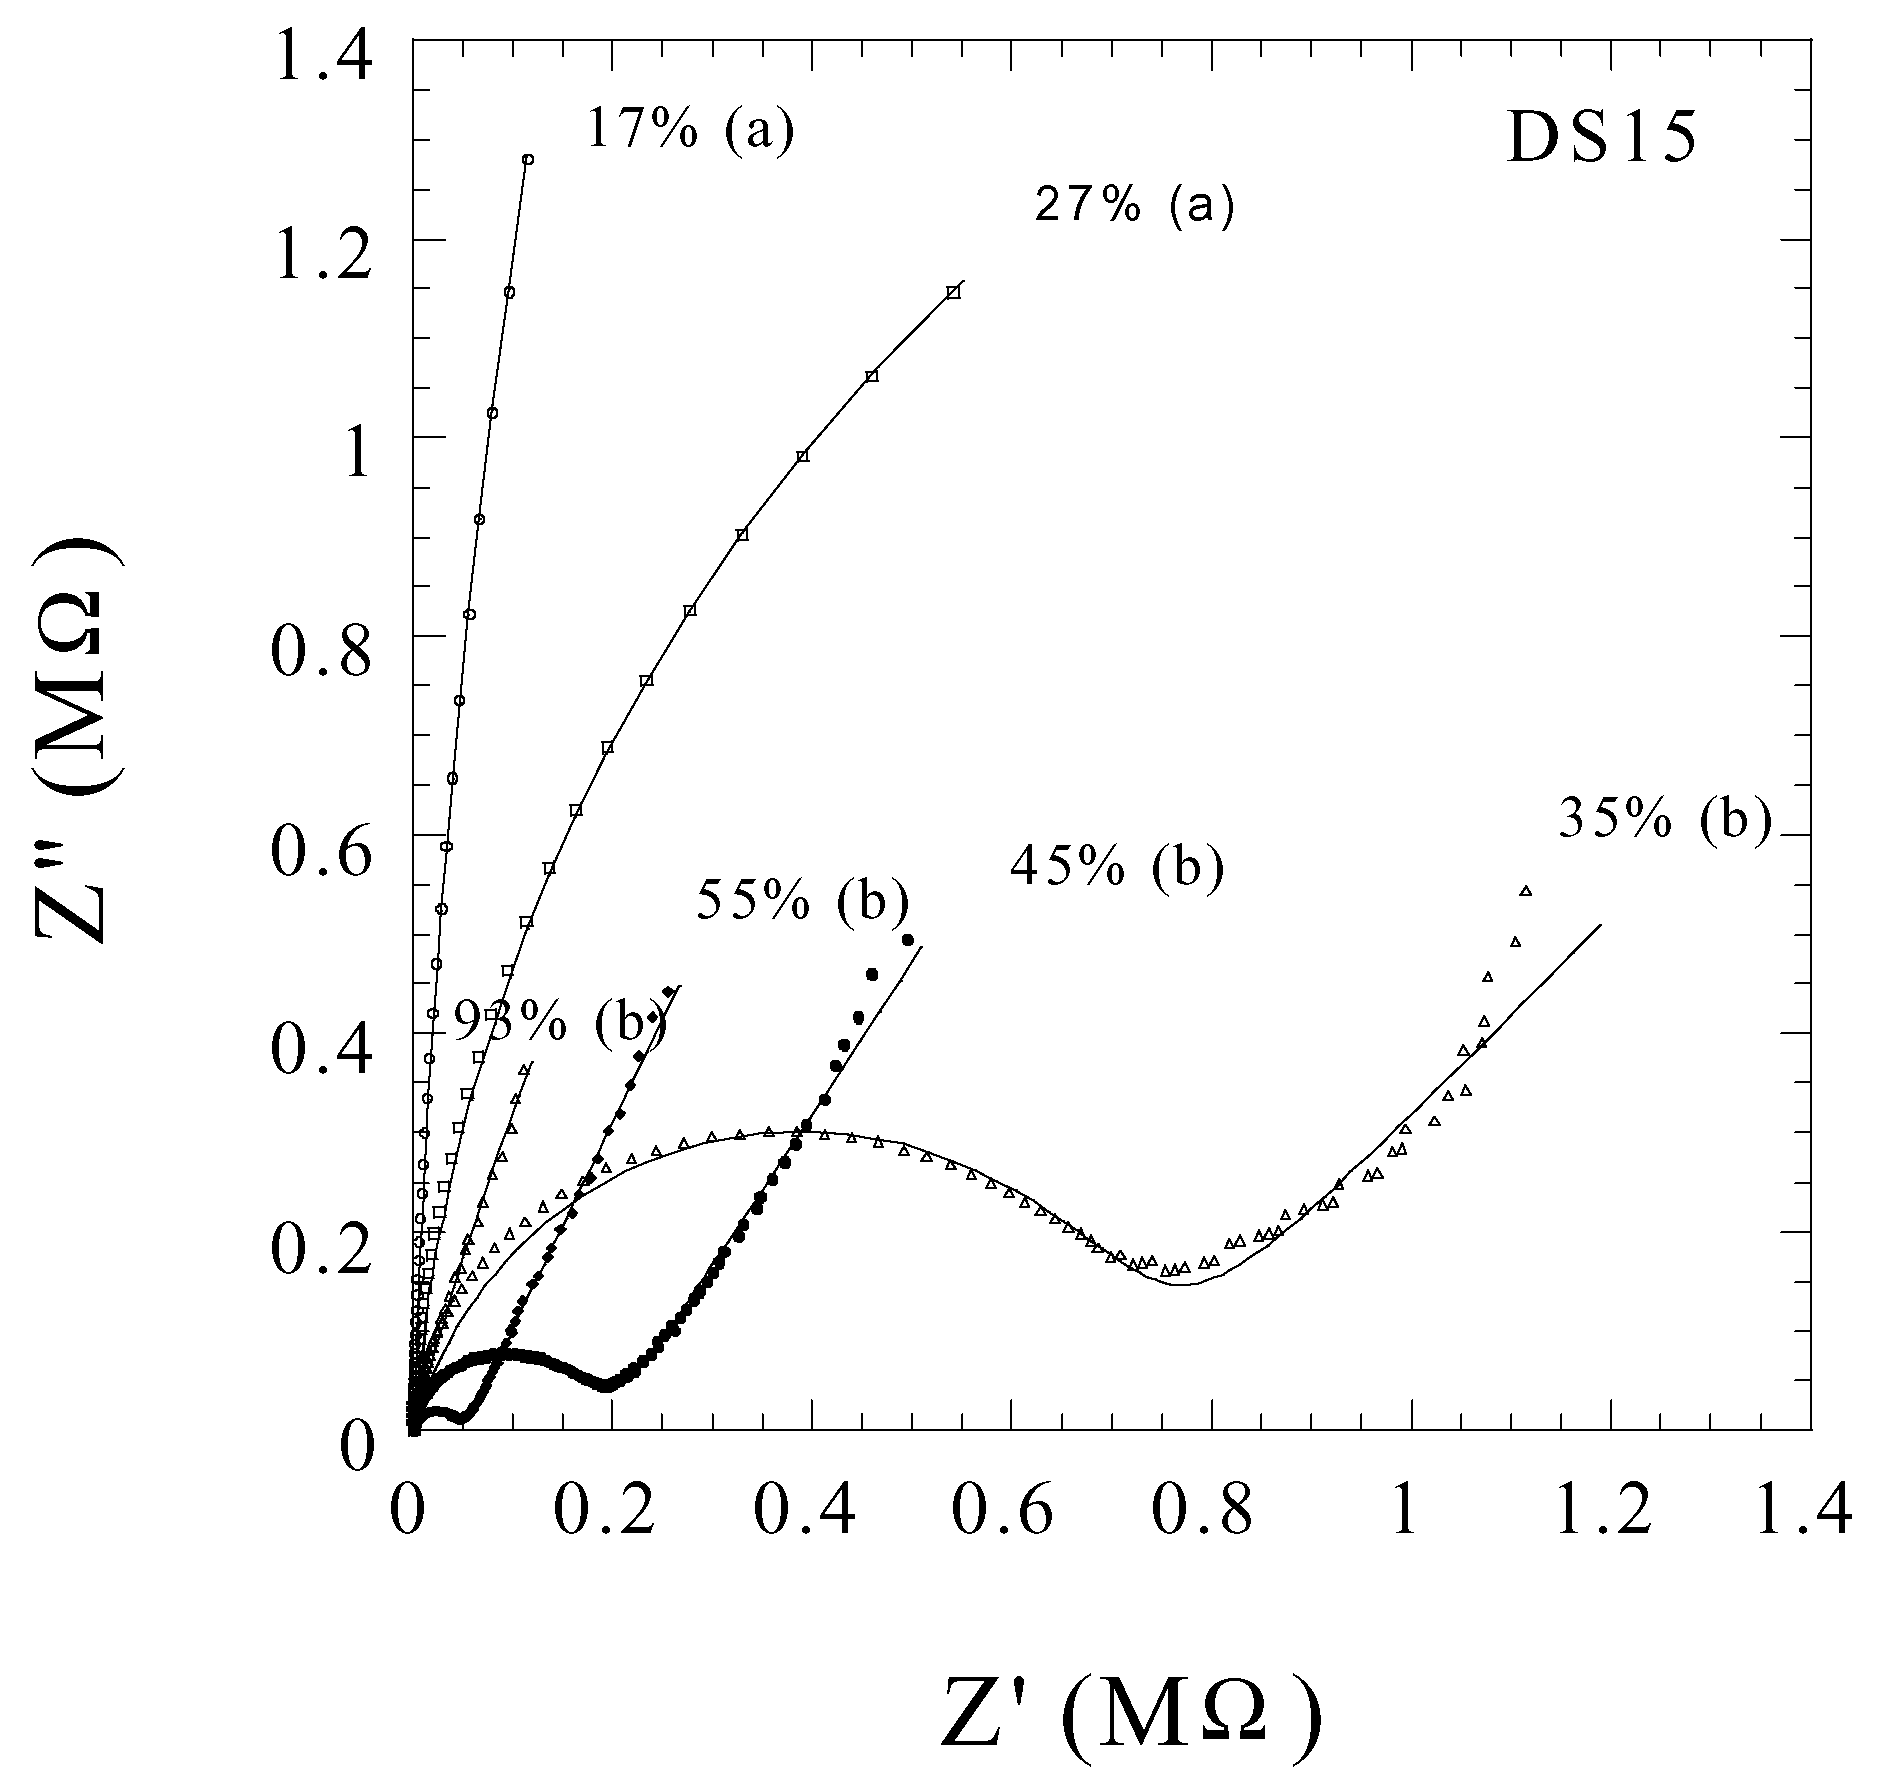


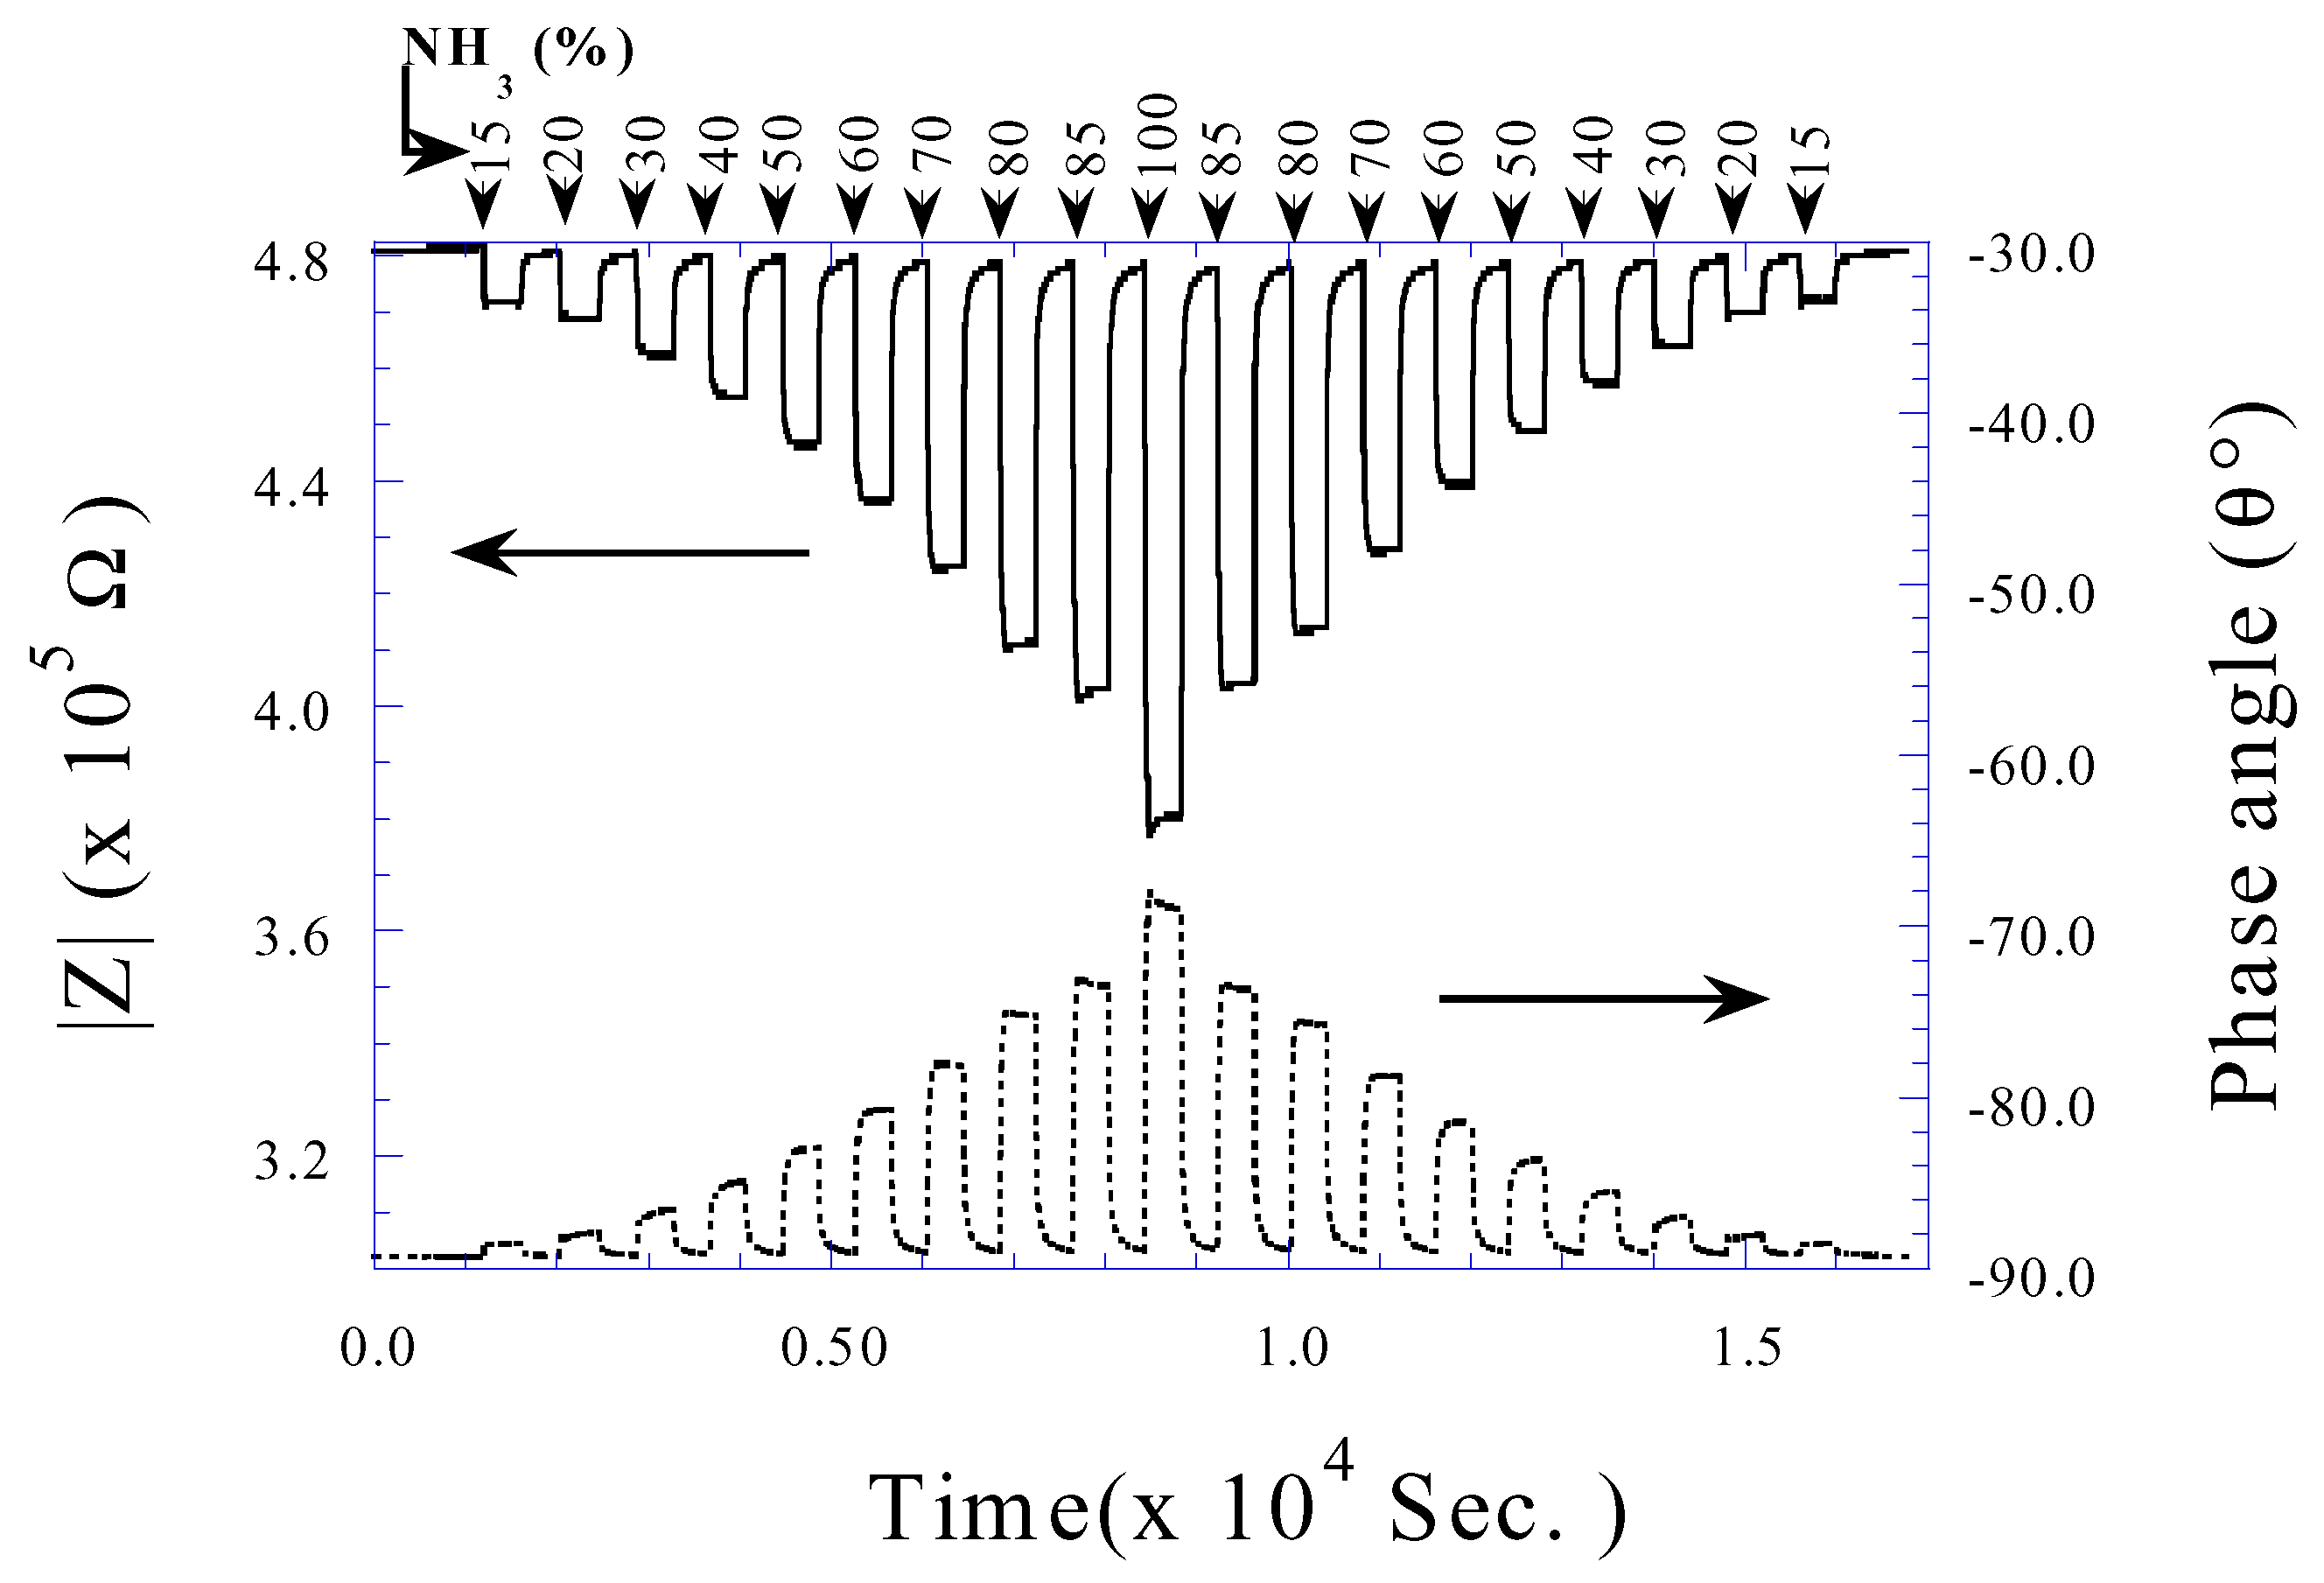
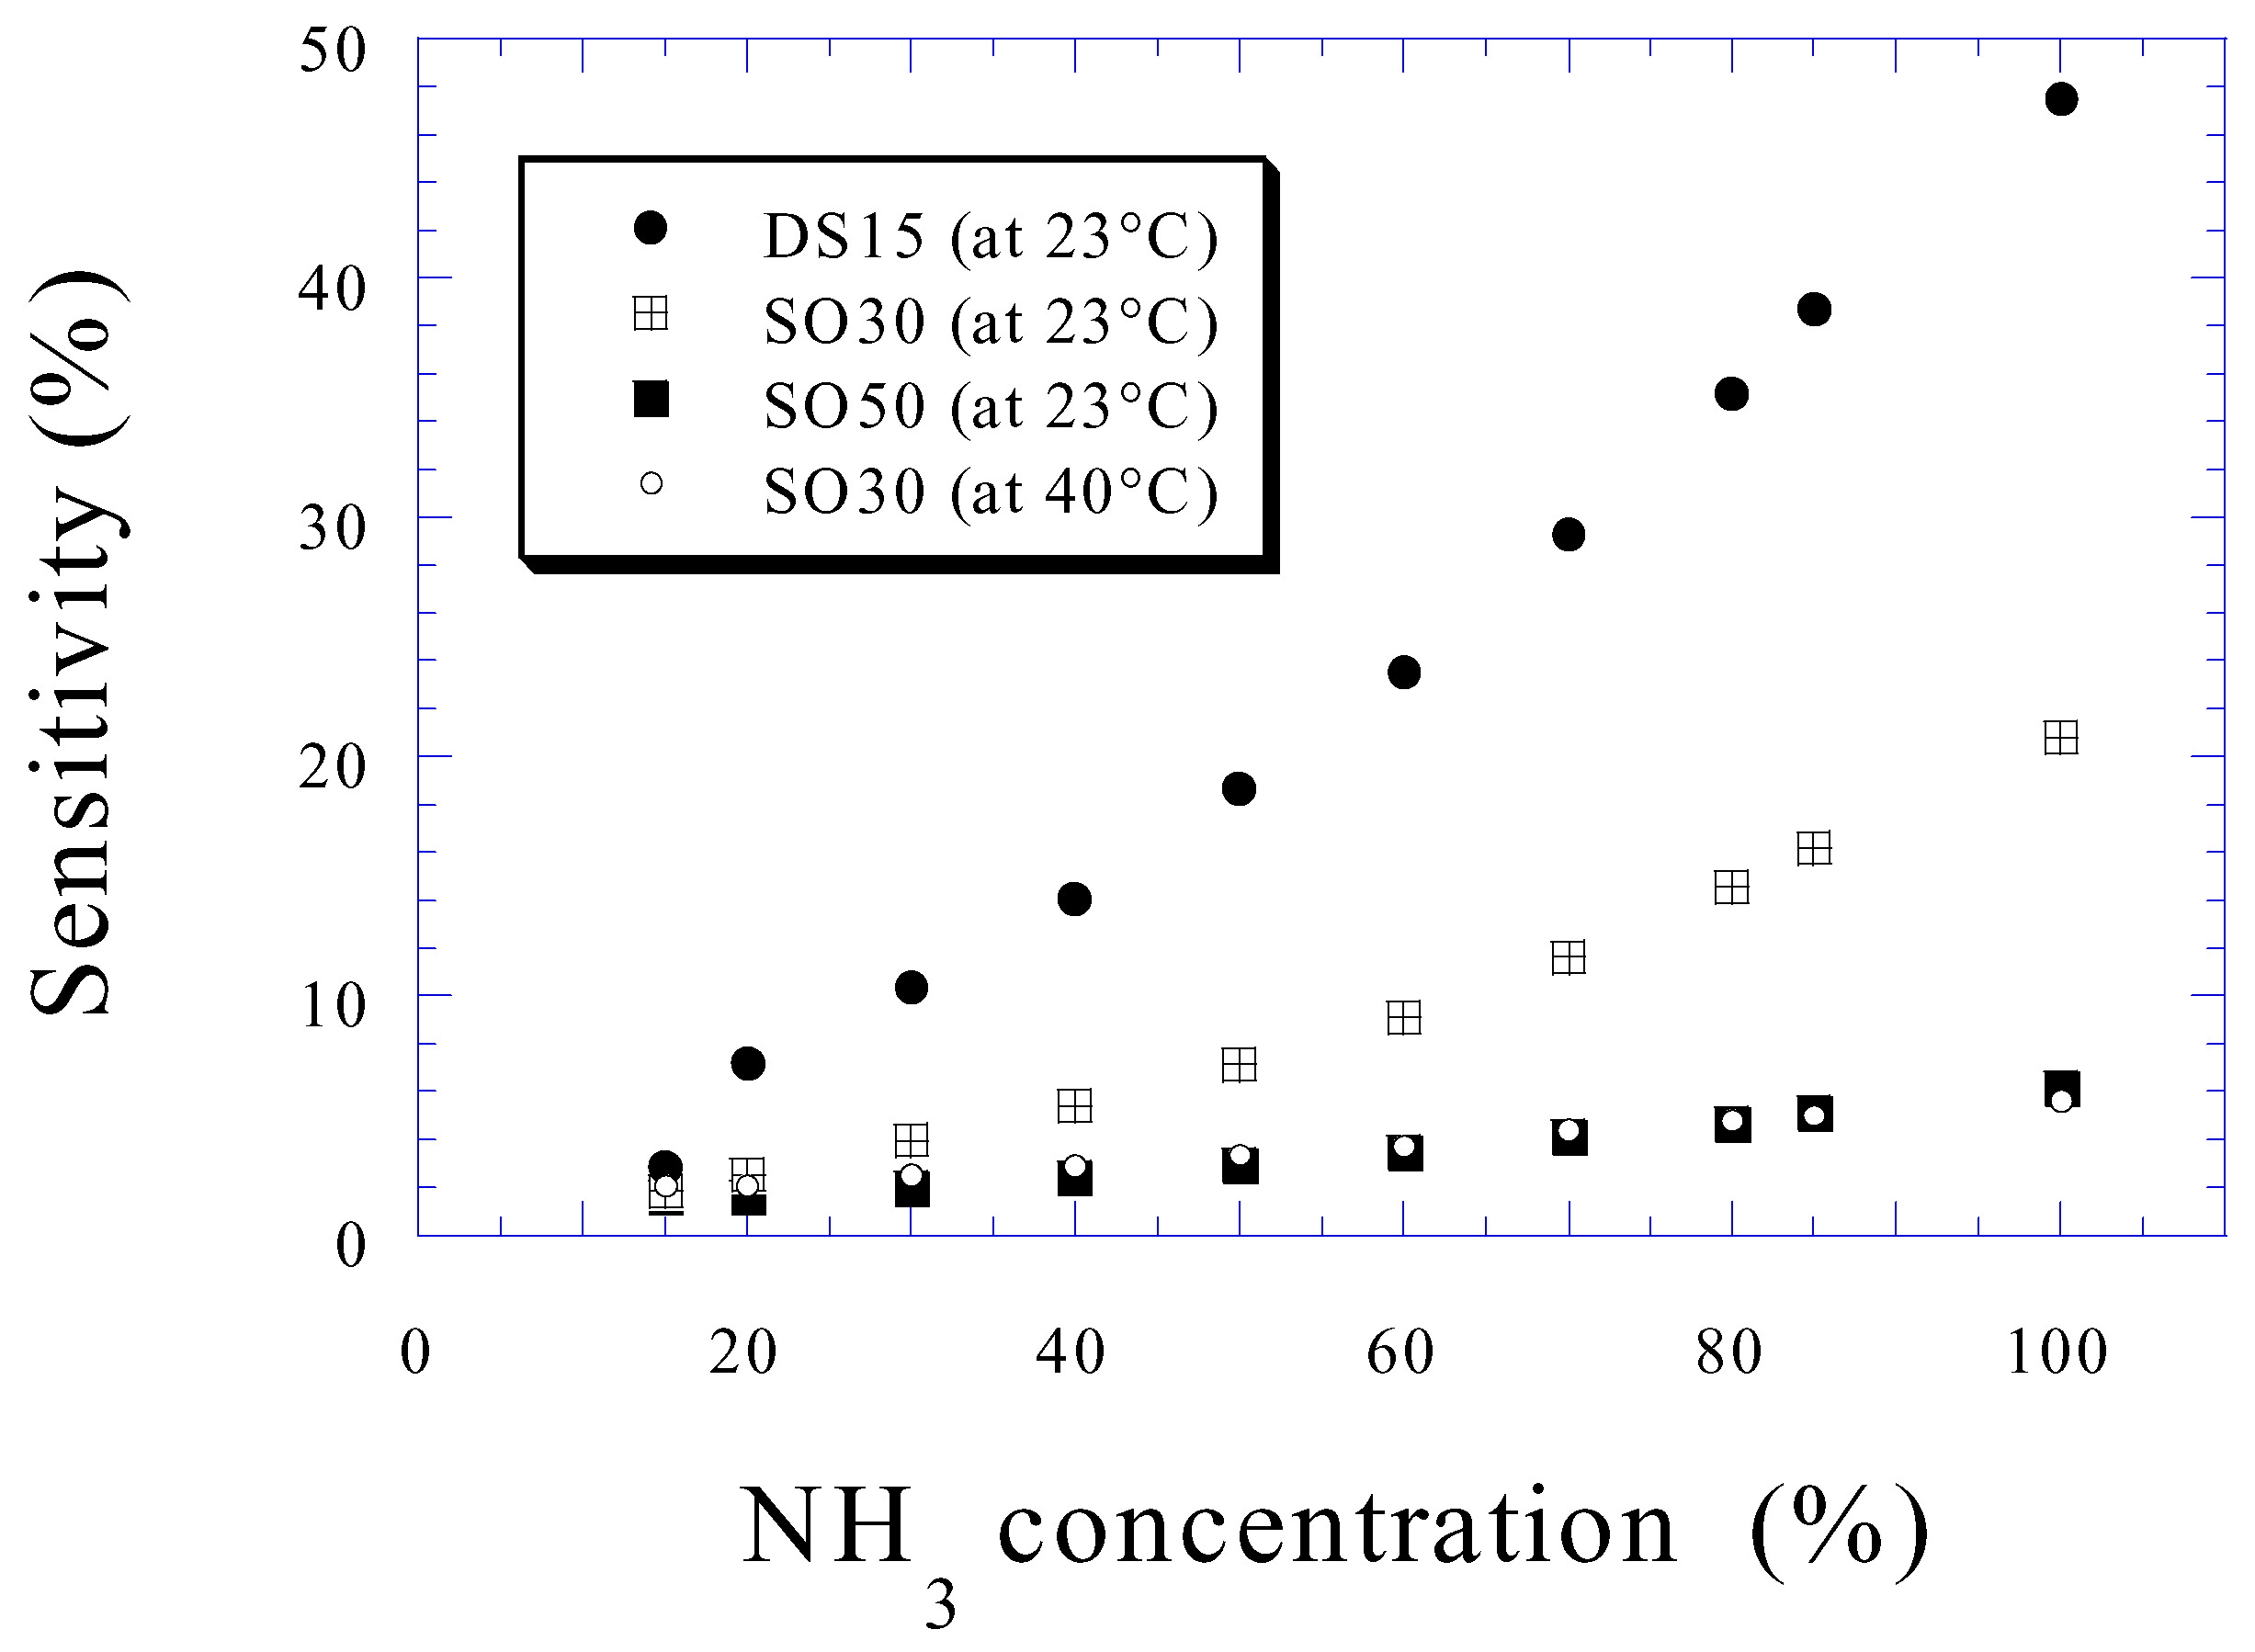
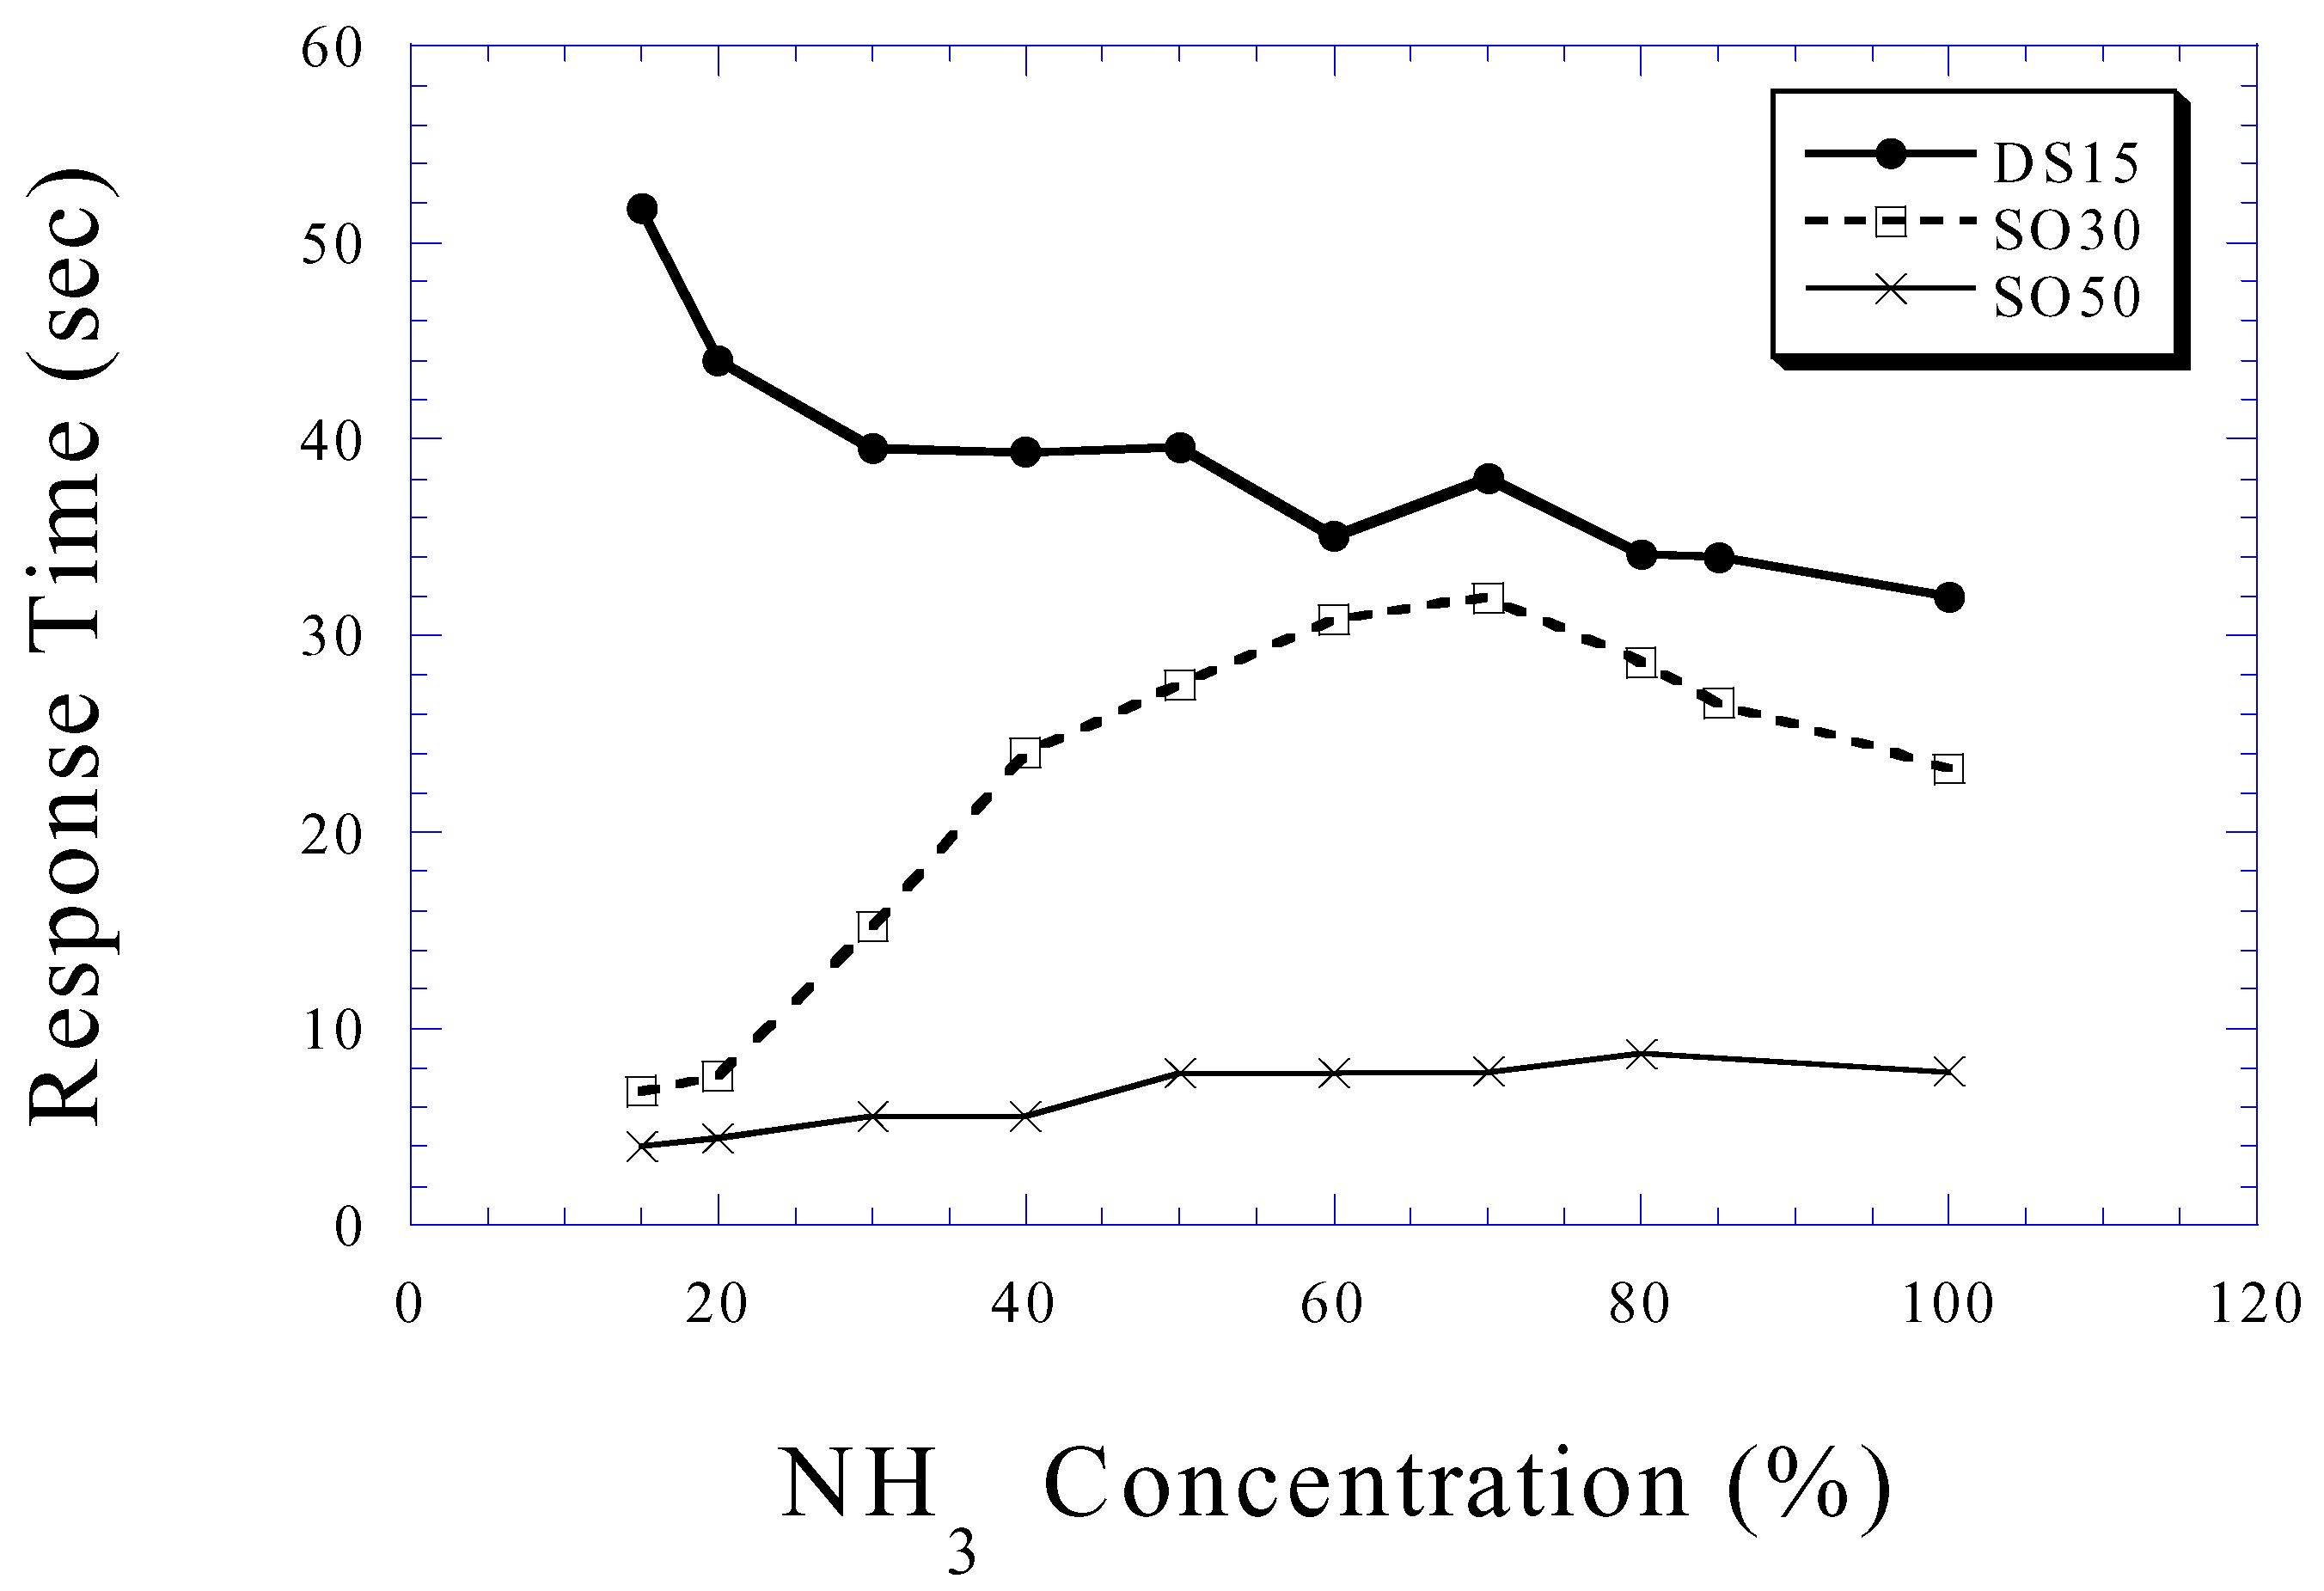
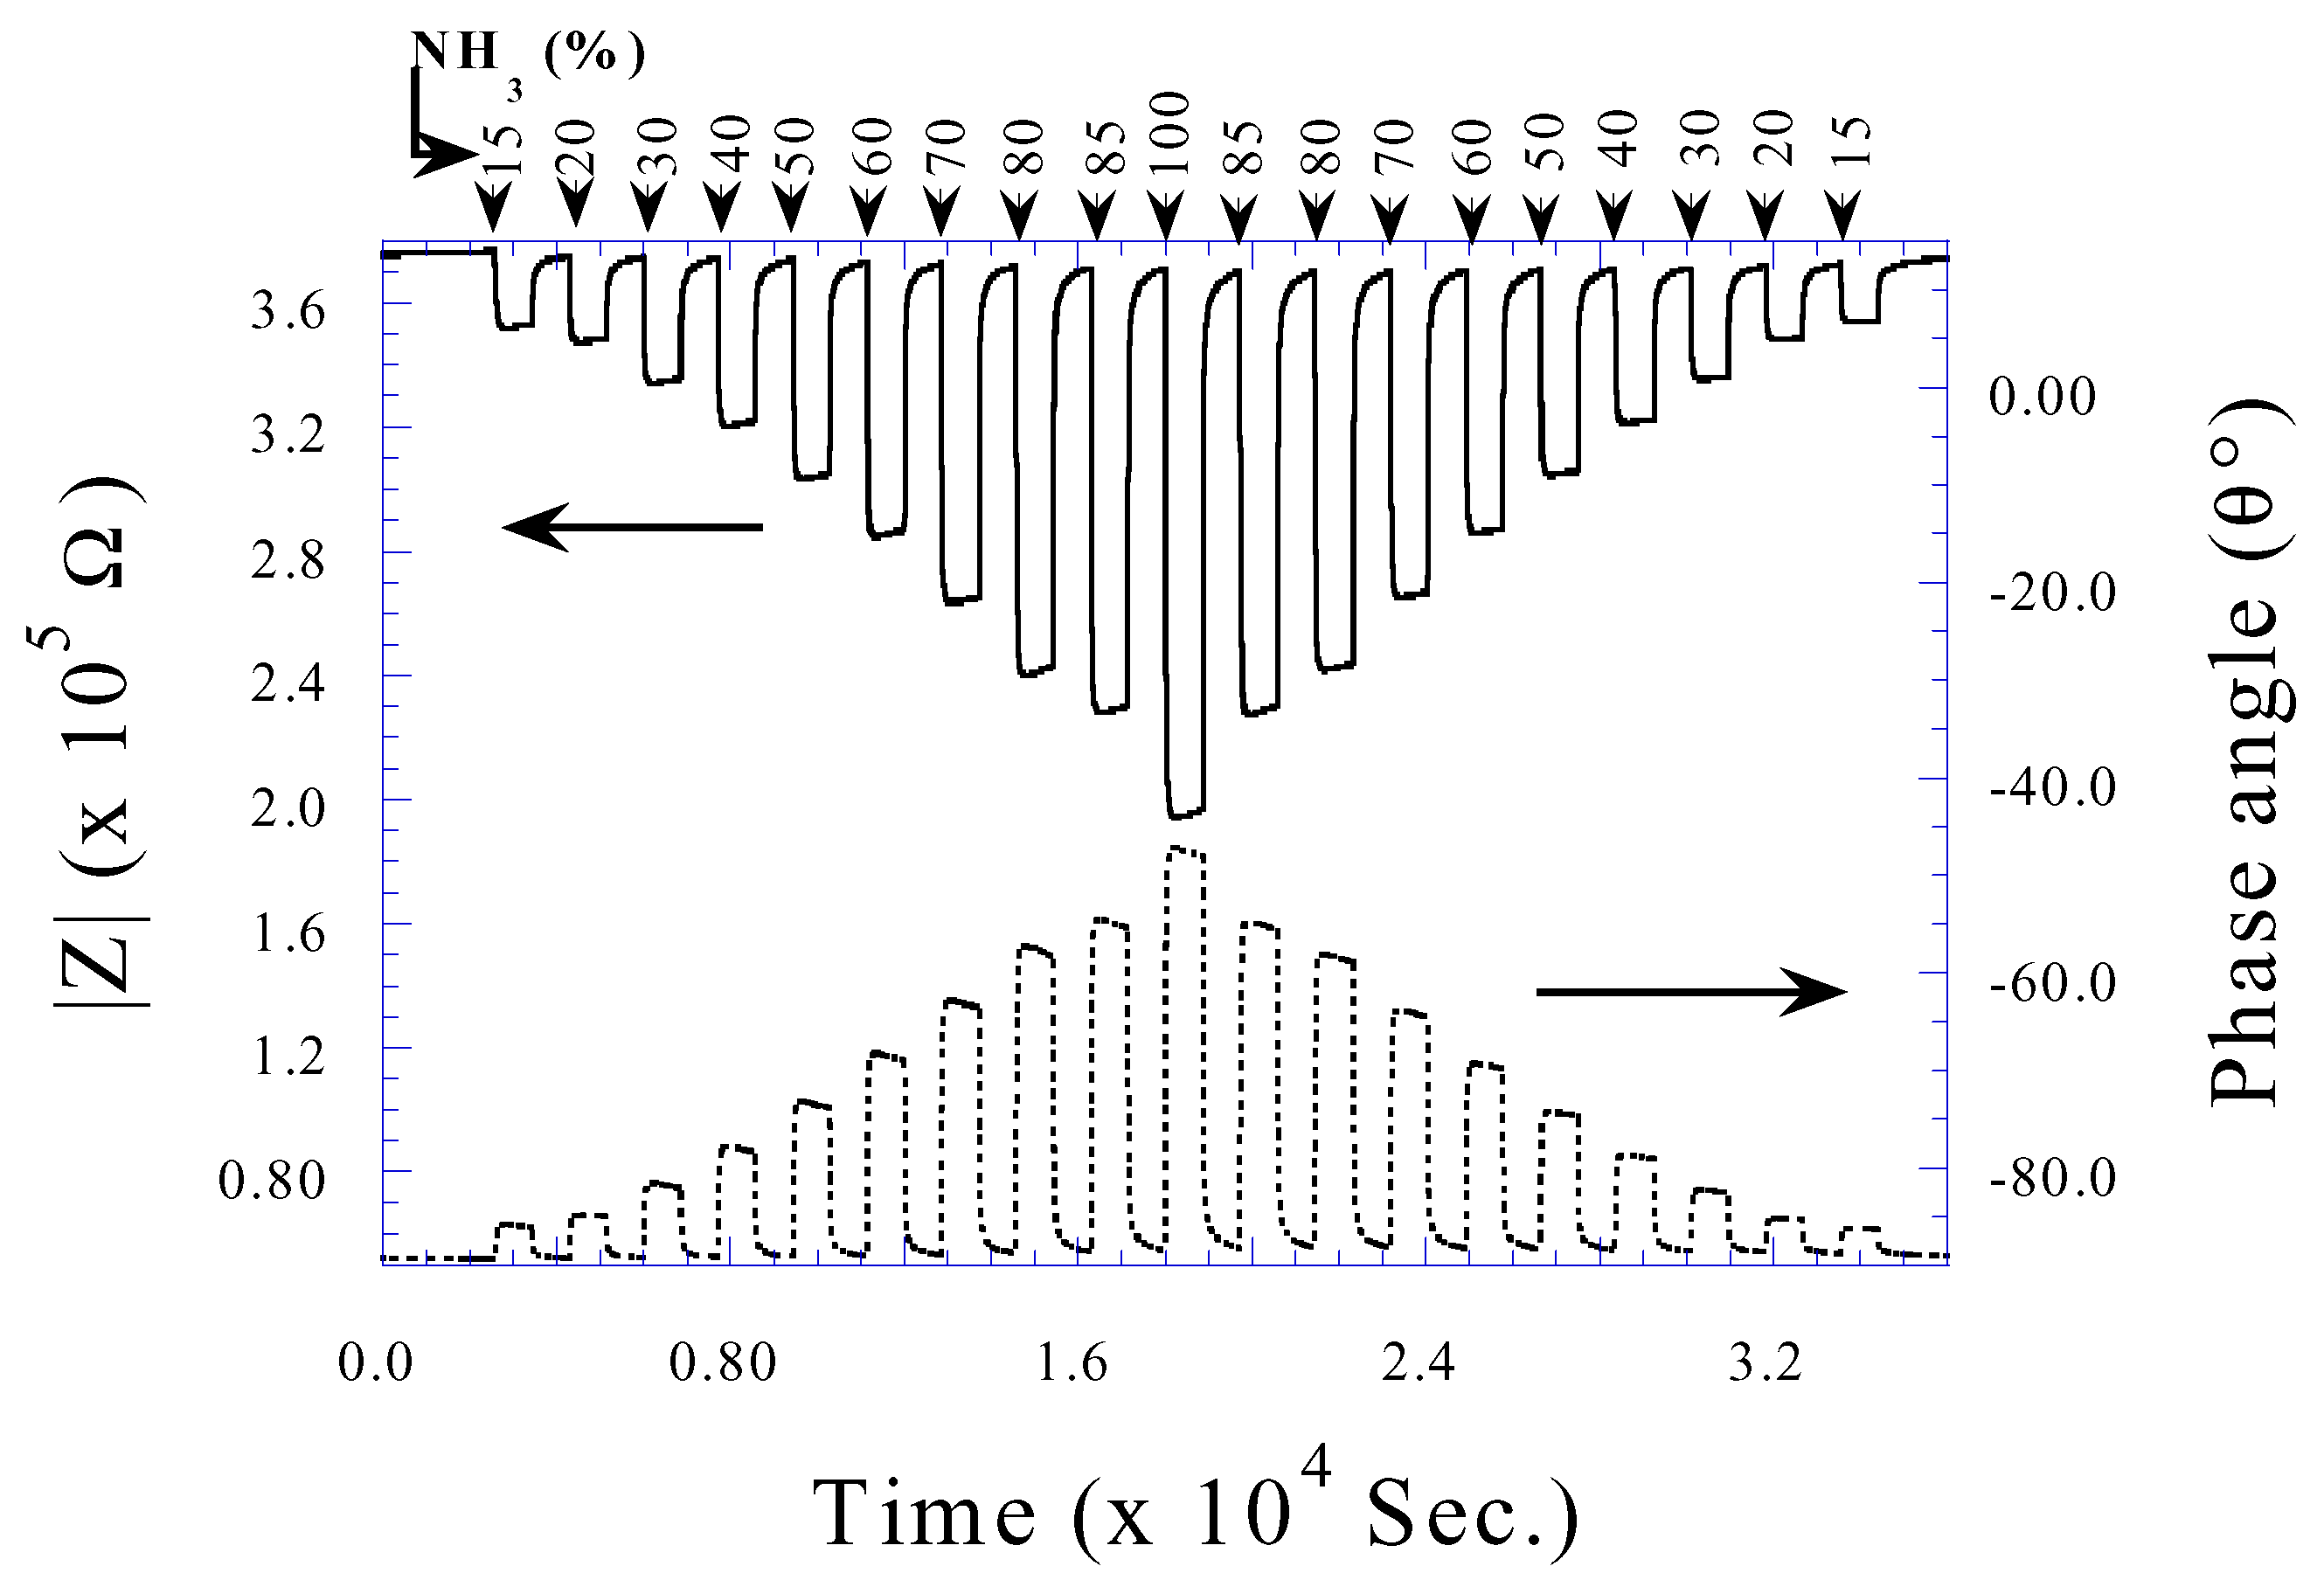
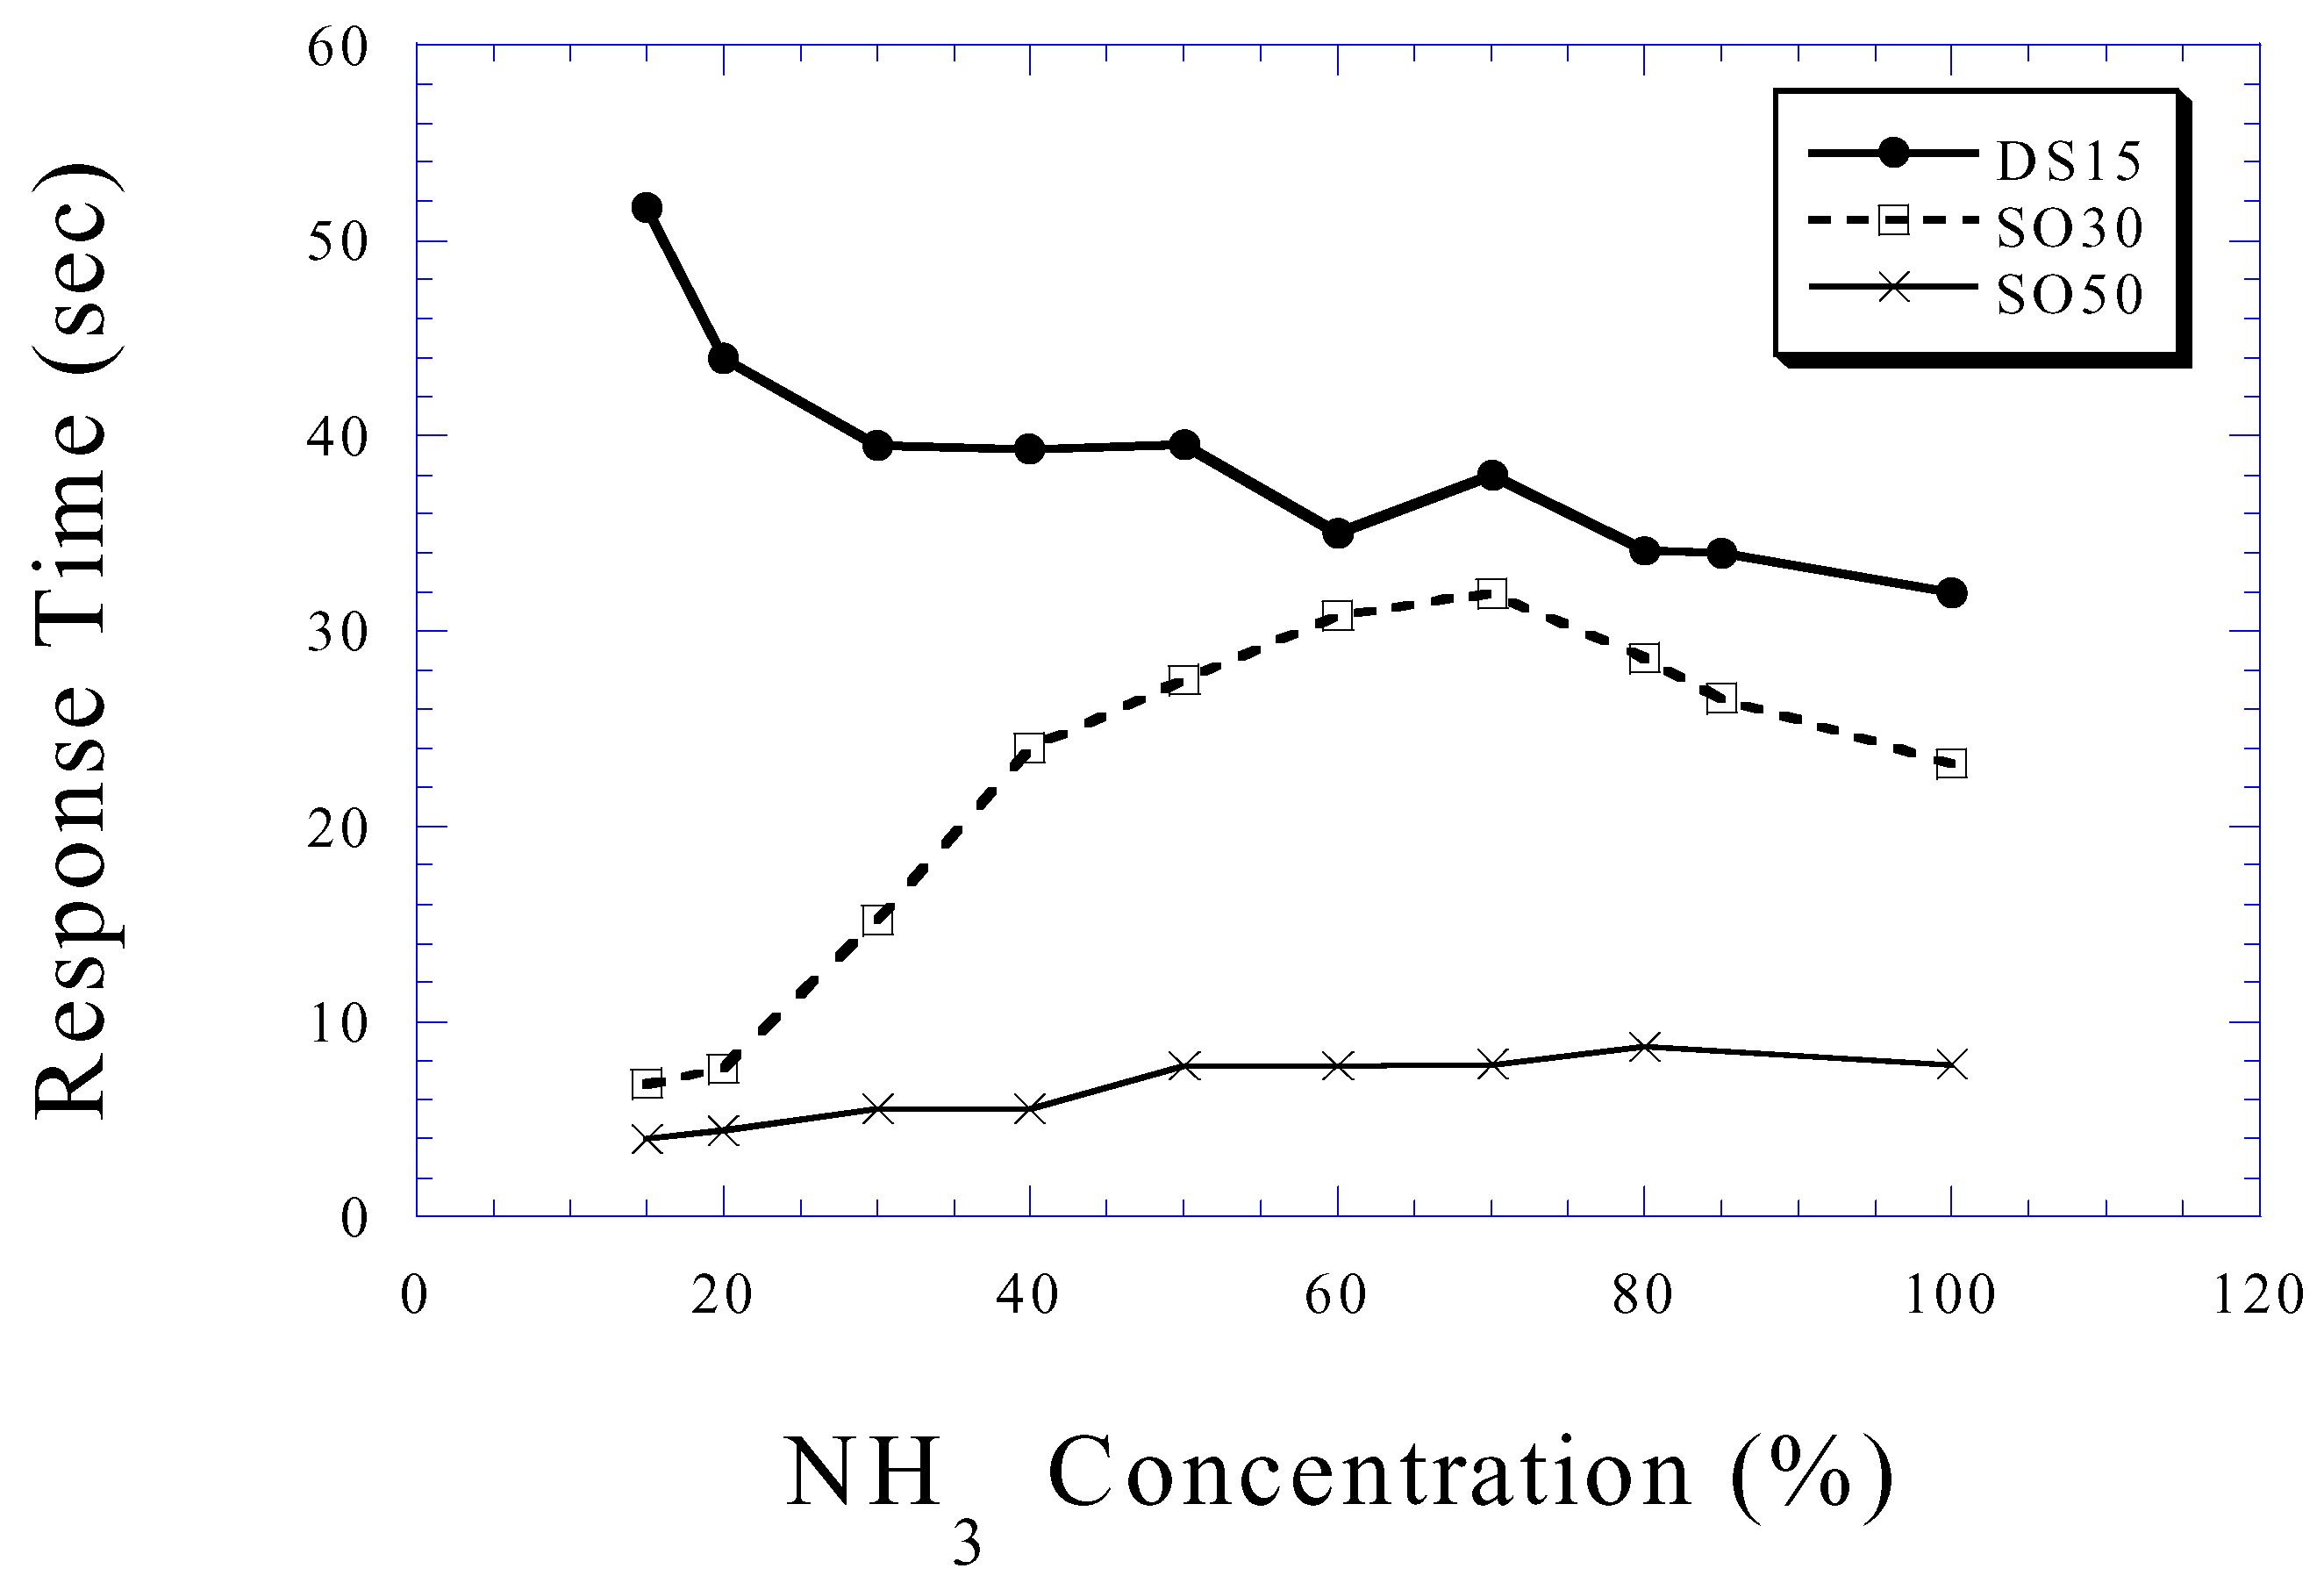
Ammonia Sensing


Conclusions
Acknowledgements
References
- Kulwicki, B. M. Humidity sensors. Journal of American Ceramic Society 1991, 74, 697–708. [Google Scholar] [CrossRef]
- Arai, H.; Seiyama, T. Humidity Sensors, in Sensors: a comprehensive survey. Gopel, W., Hesse, J., Zemel, J.N., Eds.; VCH, Weinheim, 1992; Vol. 3, 981–1012. [Google Scholar]
- Traversa, E. Ceramic sensors for humidity detection: the state-of-the-art and future developments. Sensors and Actuators B 1995, 23, 135–156. [Google Scholar] [CrossRef]
- Yamazoe, N.; Shimizu, Y. Humidity sensors: Principles and applications. Sensors and Actuators 1986, 10, 379–398. [Google Scholar] [CrossRef]
- Bearzotti, I.; Fratoddi, L.; Palummo, S.; Petrocco, A.; Furlani, C.; Sterzo, Lo; Russo, M.V. Highly ethynylated polymers: synthesis and applications for humidity sensors. Sensors and Actuators B 2001, 76, 316–321. [Google Scholar] [CrossRef]
- Sakai, Y.; Sadaoka, Y.; Matsuguchi, M. Humidity sensors based on polymer thin films. Sensors and Actuators B 1996, 35, 85–90. [Google Scholar] [CrossRef]
- Grimes, C.A.; Kouzoudis, D. Remote Query Measurement of Pressure, Fluid-Flow Velocity, and Humidity Using Magnetoelastic Thick-Film Sensors. Sensors and Actuators A 2000, 84, 205–212. [Google Scholar] [CrossRef]
- Ong, K.G.; Grimes, C.A.; Robbins, C.L.; Singh, R. S. Design and Application of a Wireless, Passive, Resonant-Circuit Environmental Monitoring Sensor. Sensors and Actuators A 2001, 93, 33–43. [Google Scholar] [CrossRef]
- Seiyama, T.; Yamazoe, N.; Arai, H. Ceramic humidity sensors. Sensors and Actuators 1983, 4, 85–96. [Google Scholar] [CrossRef]
- Ketron, L. Ceramic sensors. Ceramic Bulletin 1989, 68, 860–865. [Google Scholar]
- Traversa, E.; Gusmano, G.; Montenero, A. Innovative humidity sensitive electrical properties of sol-gel processed ceramic thin films. European Journal of Solid State Inorganic Chemistry 1995, 32, 719–729. [Google Scholar]
- Jain, M.K.; Bhatnagar, M.C.; Sharma, G.L. Effect of Li+ doping on ZrO2-TiO2 humidity sensor. Sensors and Actuators B 1999, 55, 180–185. [Google Scholar] [CrossRef]
- Varghese, O.K.; Malhotra, L.K. Studies of ambient dependent electrical behavior of nano-crystalline SnO2 thin films using impedance spectroscopy. Journal of applied physics 2000, 87, 7457–7465. [Google Scholar] [CrossRef]
- Sberveglieri, G.; Murri, R.; Pinto, N. Characterization of porous Al2O3-SiO2/Si sensor for low and medium ranges. Sensors and Actuators B 1995, 23, 177–180. [Google Scholar] [CrossRef]
- Traversa, E.; Baroncini, M.; Bartolomeo, E. D.; Gusmano, G.; Innocenzi, P.; Martucci, A.; Bearzotti, A. Electrical humidity response of sol-gel processed undoped and alkali doped TiO2-Al2O3 thin films. Journal of the European Ceramic Society 1999, 19, 753–758. [Google Scholar] [CrossRef]
- Chou, K.-S.; Lee, T.-K.; Liu, F.-J. Sensing mechanism of a porous ceramic as humidity sensor. Sensors and Actuators B 1999, 56, 106–111. [Google Scholar] [CrossRef]
- Traversa, E.; Gnappi, G.; Montenero, A.; Gusmano, G. Ceramic thin films by sol-gel processing as novel materials for integrated humidity sensors. Sensors and Actuators B 1996, 31, 59–70. [Google Scholar] [CrossRef]
- Yeh, Y.-C.; Tseng, T.-Y.; Chang, D.-A. Electrical properties of porous titania ceramic humidity sensors. Journal of the American Ceramic Society 1989, 72, 1472–1475. [Google Scholar] [CrossRef]
- Traversa, E. Design of ceramic materials for chemical sensors with novel properties. Journal of American Ceramic Society 1995, 78, 2625–2632. [Google Scholar] [CrossRef]
- Yamamoto, T.; Murukami, K. Humidity sensor using TiO2-SnO2 ceramics, in Chemical Sensor Technology. Seiyama, T., Ed.; vol.2, 1989; 133–149. [Google Scholar]
- Ansbacher, F.; Jason, A. C. Effects of water vapour on the electrical properties of anodised aluminum. Nature 1953, 171, 177–178. [Google Scholar] [CrossRef]
- Khanna, V. K.; Nahar, R. K. Effect of moisture on the dielectric properties of porous alumina films. Sensors and Actuators 1984, 5, 187–198. [Google Scholar] [CrossRef]
- Basu, S.; Chatterjee, S.; Saha, M.; Bhandyopadhay, S.; Mistry, K. K.; Sengupta, K. Study of electrical characeristics of porous alumina sensors for detection of low moisture in gases. Sensors and Actuators B 2001, 79, 182–186. [Google Scholar] [CrossRef]
- Sberveglieri, G.; Anchisini, R.; Murri, R.; Ercoli, C.; Pinto, N. An Al2O3 sensor for low humidity content: characterisation by impedance spectroscopy. Sensors and Actuators B 1996, 32, 1–5. [Google Scholar] [CrossRef]
- Mai, L. H.; Hoa, P. T. M.; Binh, N. T.; Ha, N. T. T.; An, D. K. Some investigation results of the instability of humidity sensors based on alumina and porous silicon materials. Sensors and Actuators B 2000, 66, 63–65. [Google Scholar] [CrossRef]
- Chatterjee, S.; Basu, S.; Bandyopadhay, S.; Mistry, K. K.; Sengupta, K. Humidity sensor using porous tape cast alumina substrate. Review of Scientific Instruments 2001, 72, 2792–2792. [Google Scholar] [CrossRef]
- Nahar, R. K. Study of the performance degradation of thin aluminum oxide sensor at high humidity. Sensors and Actuators B 2000, 63, 49–54. [Google Scholar] [CrossRef]
- Chen, Z.; Jin, M.-C.; Zhen, C. Humidity sensors with reactively evaporated Al2O3 films as porous dielectrics. Sensors and Actuators 1990, 2, 167–171. [Google Scholar] [CrossRef]
- Basu, S.; Saha, M.; Chatterjee, S.; Mistry, K. K.; Bandyopadhay, S.; Sengupta, K. Porous ceramic sensor for measurement of gas moisture in the ppm range. Materials Letters 2001, 49, 29–33. [Google Scholar] [CrossRef]
- Sadaoka, Y.; Sakai, Y.; Matsumoto, S. Electrical properties of anodised aluminum in a humid atmosphere. Journal of Materials Science 1986, 21, 1269–1274. [Google Scholar] [CrossRef]
- Seiyama, T.; Fueki, K.; Shiokawa, J.; Suzuki, S. (Eds.) Chemical Sensors: Elsevier, New York, 1983.
- Shimisu, Y.; Arai, H.; Seiyama, T. Theoretical studies on the impedance-humidity characteristics of ceramic humidity sensors. Sensors and Actuators 1985, 7, 11–22. [Google Scholar] [CrossRef]
- Nicho, M. E.; Trejo, M.; Garcia-Valenzuela, A.; Saniger, J. M.; Palacios, J.; Hu, J. Polyaniline composite coatings interrogated by a nulling optical-transmittance bridge for sensing low concentrations of ammonia gas. Sensors and Actuators B 2001, 76, 18–24. [Google Scholar] [CrossRef]
- Chabukswar, V. V.; Pethkar, S.; Athawale, A. A. Acrylic acid doped polyaniline as an ammonia sensor. Sensors and Actuators B 2001, 77, 657–663. [Google Scholar] [CrossRef]
- Raimundo, M.; Narayanaswamy, R. Simultaneous determination of relative humidity and ammonia in air employing an optical fibre sensor and artificial neural network. Sensors and Actuators B 2001, 74, 60–68. [Google Scholar] [CrossRef]
- Lin, C. W.; Hwang, B. J.; Lee, C. R. Sensing behaviors of the electrochemically co-deposited polypyrrole-poly(vinyl alcohol) thin film exposed to ammonia gas. Materials Chemistry and Physics 1999, 58, 114–120. [Google Scholar] [CrossRef]
- Teeramongkonrasmee, M. Sriyudthsak Methanol and ammonia sensing characteristics of sol-gel derived thin film gas sensor. Sensors and Actuators B 2000, 66, 256–259. [Google Scholar] [CrossRef]
- Wang, Y. D.; Wu, X. H.; Su, Q.; Li, Y. F.; Zhou, Z. L. Ammonia-sensing characteristics of Pt and SiO2 doped SnO2 materials. Solid-State Electronics 2001, 45, 347–350. [Google Scholar] [CrossRef]
- Zhang, T.; Shen, Y.; Zhang, R.; Liu, X. Ammonia-sensing characteristics of Pt-doped CdSnO3 semiconducting ceramic sensor. Materials Letters 1996, 27, 161–164. [Google Scholar] [CrossRef]
- Shimizu, Y.; Okamoto, T.; Takao, Y.; Egashira, M. Desorption behavior of ammonia from TiO2-based specimens- ammonia sensing mechanism of double-layer sensors with TiO2-based catalyst layers. J. Molecular Catalysis A: Chemical 2000, 155, 183–191. [Google Scholar] [CrossRef]
- Tao, S. H.-; Tang, W. M.-; Ping, L.; Xi, Y. Porosity control of humidity-sensitive ceramics and theoretical model of humidity-sensitive characteristics. Sensors and Actuators 1989, 19, 61–70. [Google Scholar]
- Masuda, H.; Fukuda, K. Ordered metal nanohole arrayes made by a 2-step replication of honeycomb structures of anodic alumina. Science 1995, 268, 1466–1468. [Google Scholar] [CrossRef] [PubMed]
- Masuda, H.; Hasegwa, F.; Ono, S. Self-Ordering of Cell Arrangement of Anodic Porous Alumina Formed in Sulfuric Acid Solution. Journal of the electrochemical society 1997, 144, L127–L129. [Google Scholar] [CrossRef]
- Jessensky, O.; Muller, F.; Gosele, U. Self-organised formation of hexagonal pore arrays in anodic alumina. Applies Physics Letters 1998, 72, 1173–1173. [Google Scholar] [CrossRef]
- Macdonald, J.R. Impedance spectroscopy: John Wiley, New York, 1987.
- http://www.tesatape.com.
- http://www.solartronanalytical.com/downloads/downloads.html.
- Falk, E.; Lacquet, B. M.; Swart, P. L. Determination of equivalent circuit parameters of porous dielectric humidity sensors. Electronic Letters 1992, 28, 166–167. [Google Scholar] [CrossRef]
- Jonscher, A.K. Analysis of the alternating current properties of ionic conductors. Journal of Materials Science 1978, 13, 553–562. [Google Scholar] [CrossRef]
- Jonscher, K. The interpretation of non-ideal dielectric admittance and impedance diagrams. Physica Status Solidi (a) 1975, 32, 665–676. [Google Scholar]
- Fleming, W. J. A physical understanding of solid state humidity sensors. Society of Automotive Engineers Transactions, Section 2 1981, 90, 1656–1667. [Google Scholar]
- Khanna, V. K.; Nahar, R. K. Surface conduction mechanisms and the electrical properties of Al2O3 humidity sensor. Applied Surface Science 1987, 28, 247–264. [Google Scholar] [CrossRef]
- Khanna, V. K.; Nahar, R. K. Carrier-transfer mechanisms and Al2O3 sensors for low and high humidities. Journal of Physics D: Applied physics 1986, 19, L141–L145. [Google Scholar] [CrossRef]
- Nahar, R.K.; Khanna, V.K.; Khokle, W.S. On the origin of the humidity-sensitive electrical properties of porous aluminum oxide. Journal of Physics D: Applied Physics 1984, 17, 2087–2095. [Google Scholar] [CrossRef]
- Nahar, R. K.; Khanna, V. K. Ionic doping and inversion of the characteristic of thin film porous Al2O3 humidity sensor. Sensors and Actuators B 1998, 46, 35–41. [Google Scholar]
- Wood, G. C.; Skeldon, P.; Thompson, G. E.; Shimizu, K. A model for the incorporation of electrolyte species into anodic alumina. Journal of the Electrochemical Society 1996, 143, 74–83. [Google Scholar]
- Patermarakis, G.; Moussoutzanis, K. Mathematical models for the anodisation conditions and structural features of porous anodic Al2O3 films on aluminum. Journal of the Electrochemical Society 1995, 142, 737–743. [Google Scholar] [CrossRef]
- Sample Availability: Available from the authors.
© 2002 by MDPI (http://www.mdpi.net). Reproduction is permitted for noncommercial purposes.
Share and Cite
Dickey, E.C.; Varghese, O.K.; Ong, K.G.; Gong, D.; Paulose, M.; Grimes, C.A. Room Temperature Ammonia and Humidity Sensing Using Highly Ordered Nanoporous Alumina Films. Sensors 2002, 2, 91-110. https://doi.org/10.3390/s20300091
Dickey EC, Varghese OK, Ong KG, Gong D, Paulose M, Grimes CA. Room Temperature Ammonia and Humidity Sensing Using Highly Ordered Nanoporous Alumina Films. Sensors. 2002; 2(3):91-110. https://doi.org/10.3390/s20300091
Chicago/Turabian StyleDickey, Elizabeth C., Oomman K. Varghese, Keat G. Ong, Dawei Gong, Maggie Paulose, and Craig A. Grimes. 2002. "Room Temperature Ammonia and Humidity Sensing Using Highly Ordered Nanoporous Alumina Films" Sensors 2, no. 3: 91-110. https://doi.org/10.3390/s20300091
APA StyleDickey, E. C., Varghese, O. K., Ong, K. G., Gong, D., Paulose, M., & Grimes, C. A. (2002). Room Temperature Ammonia and Humidity Sensing Using Highly Ordered Nanoporous Alumina Films. Sensors, 2(3), 91-110. https://doi.org/10.3390/s20300091