An Innovative Ultrasonic Apparatus and Technology for Diagnosis of Freeze-Drying Process


Abstract
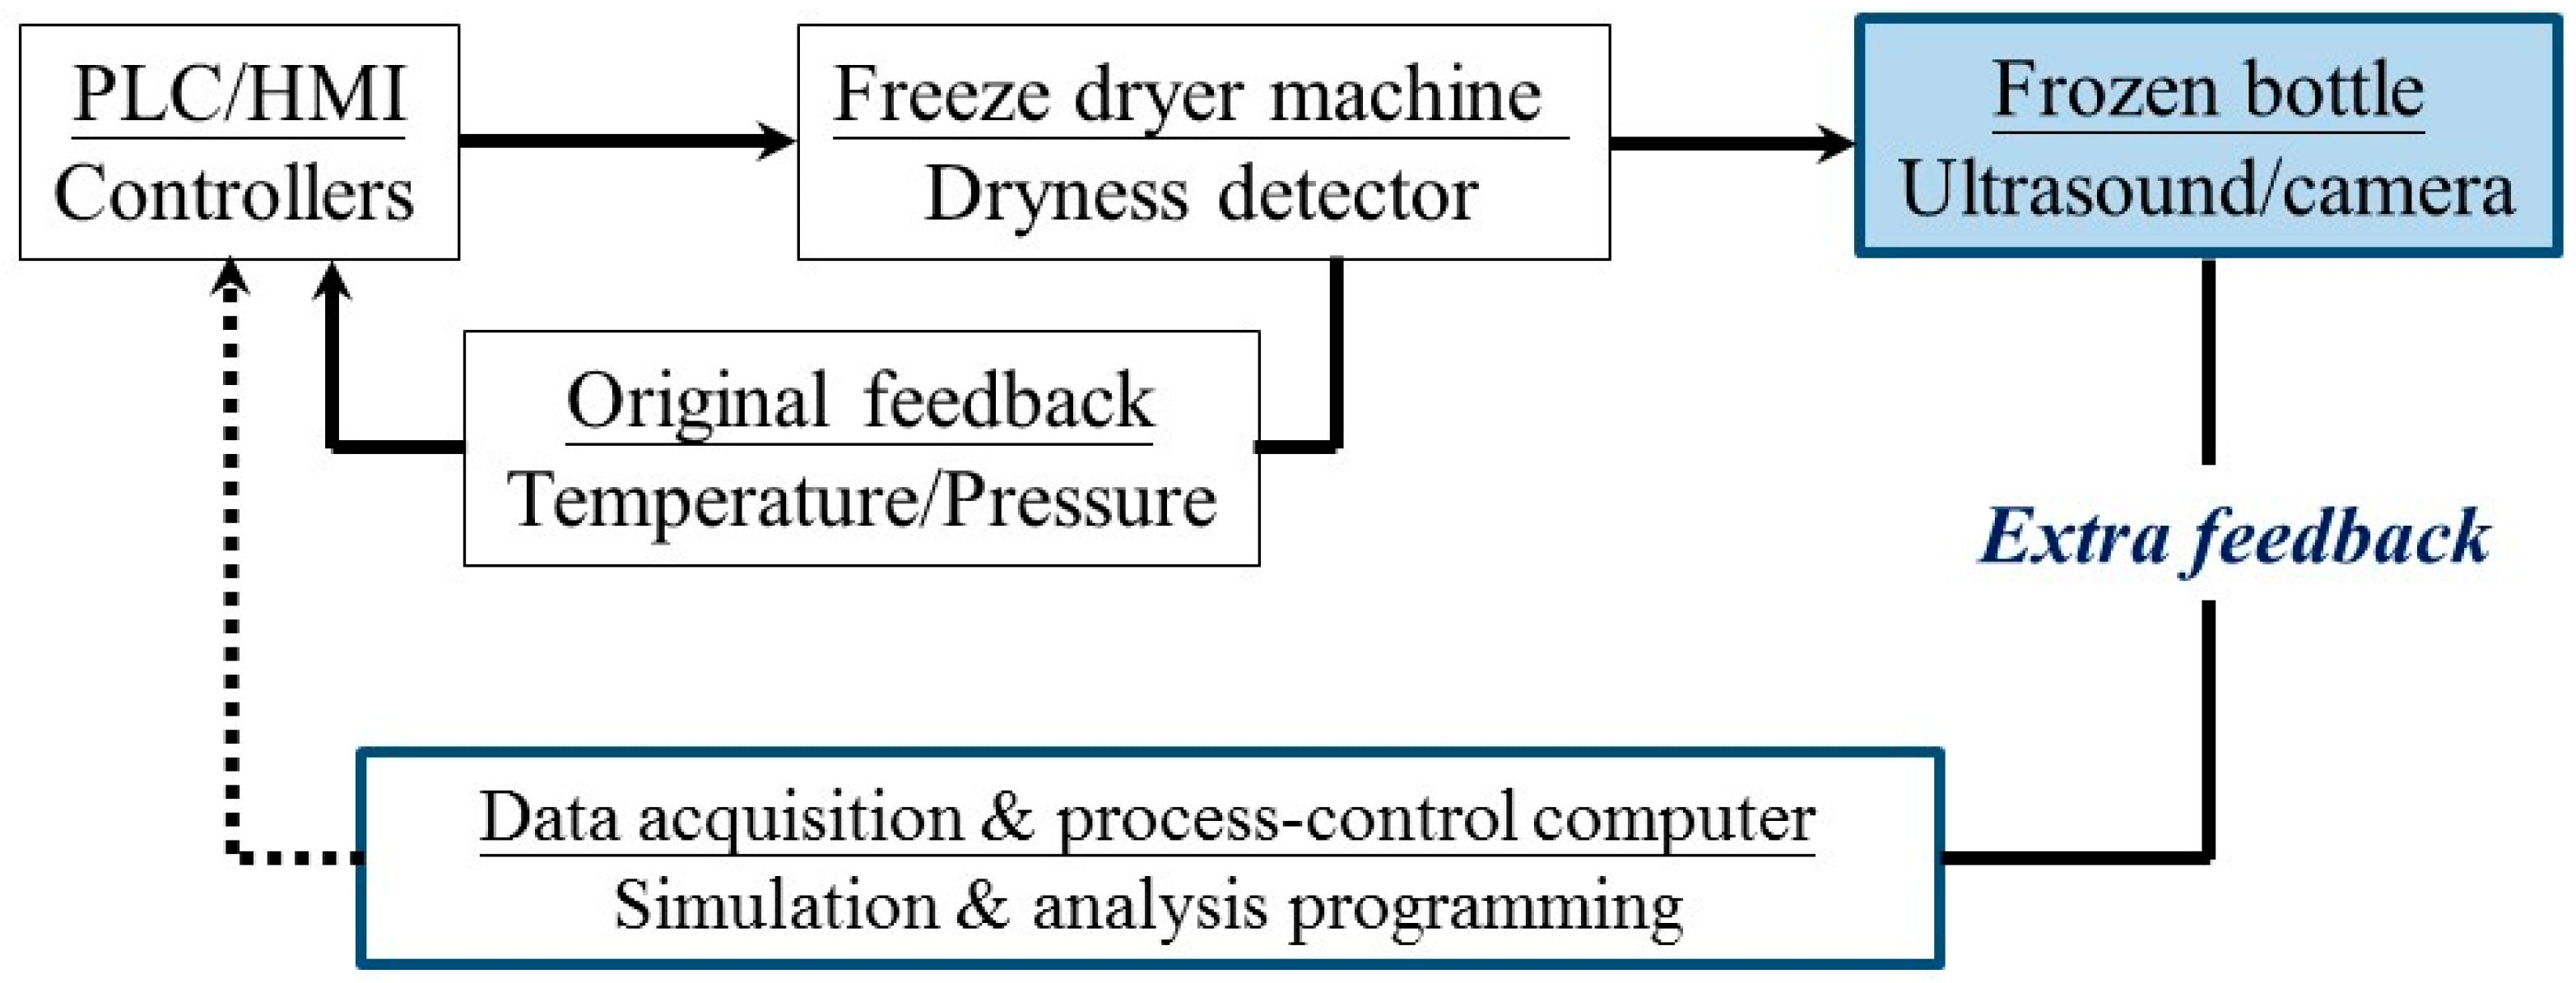
1. Introduction
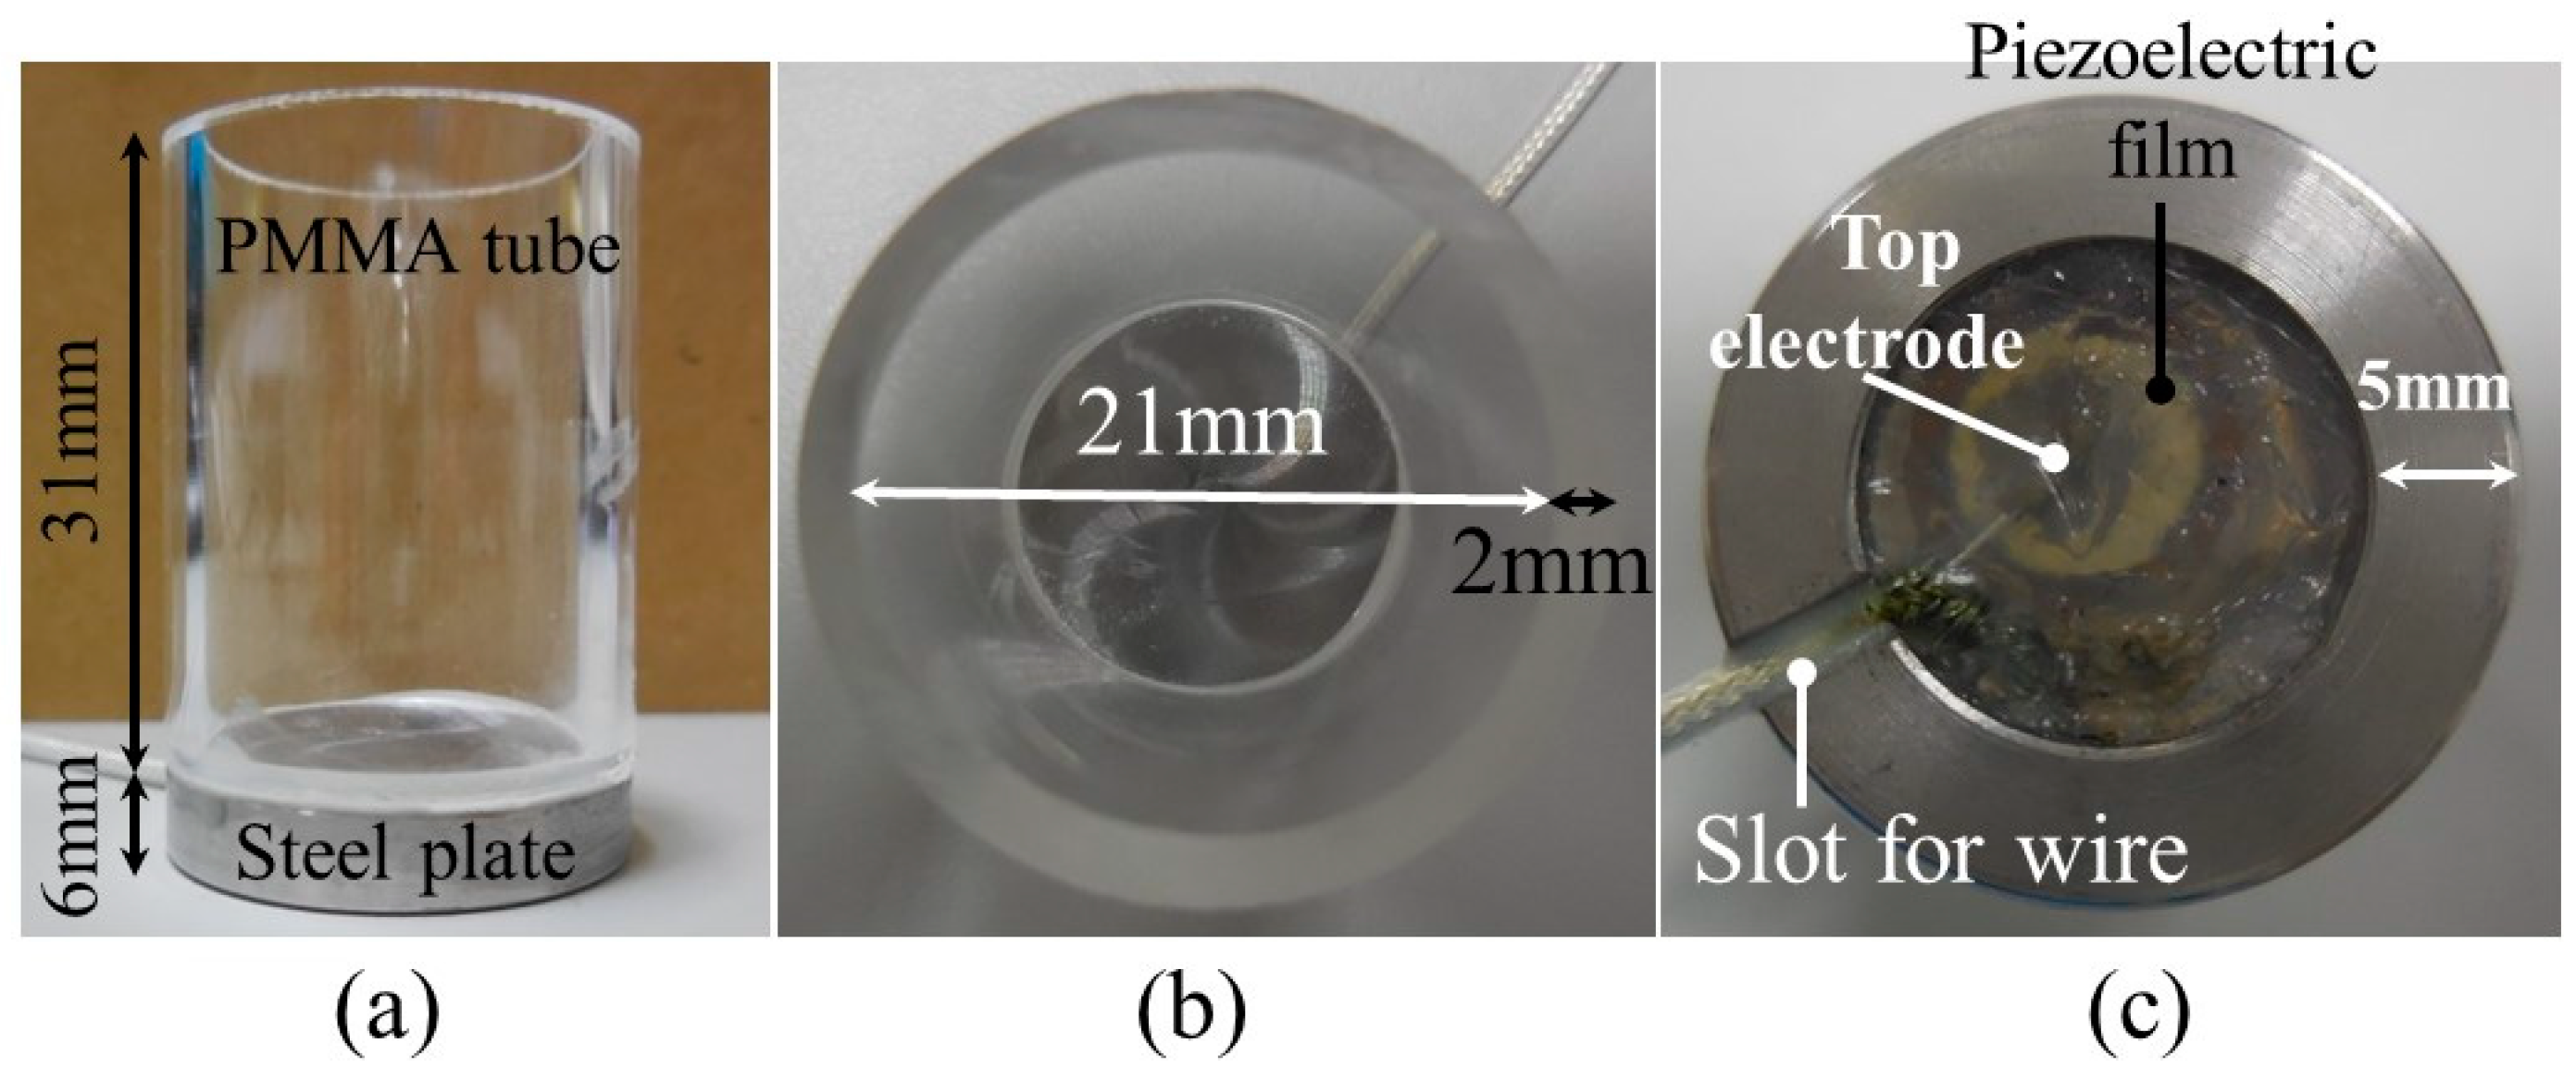
2. Design of Frozen Bottle with Ultrasonic Transducer
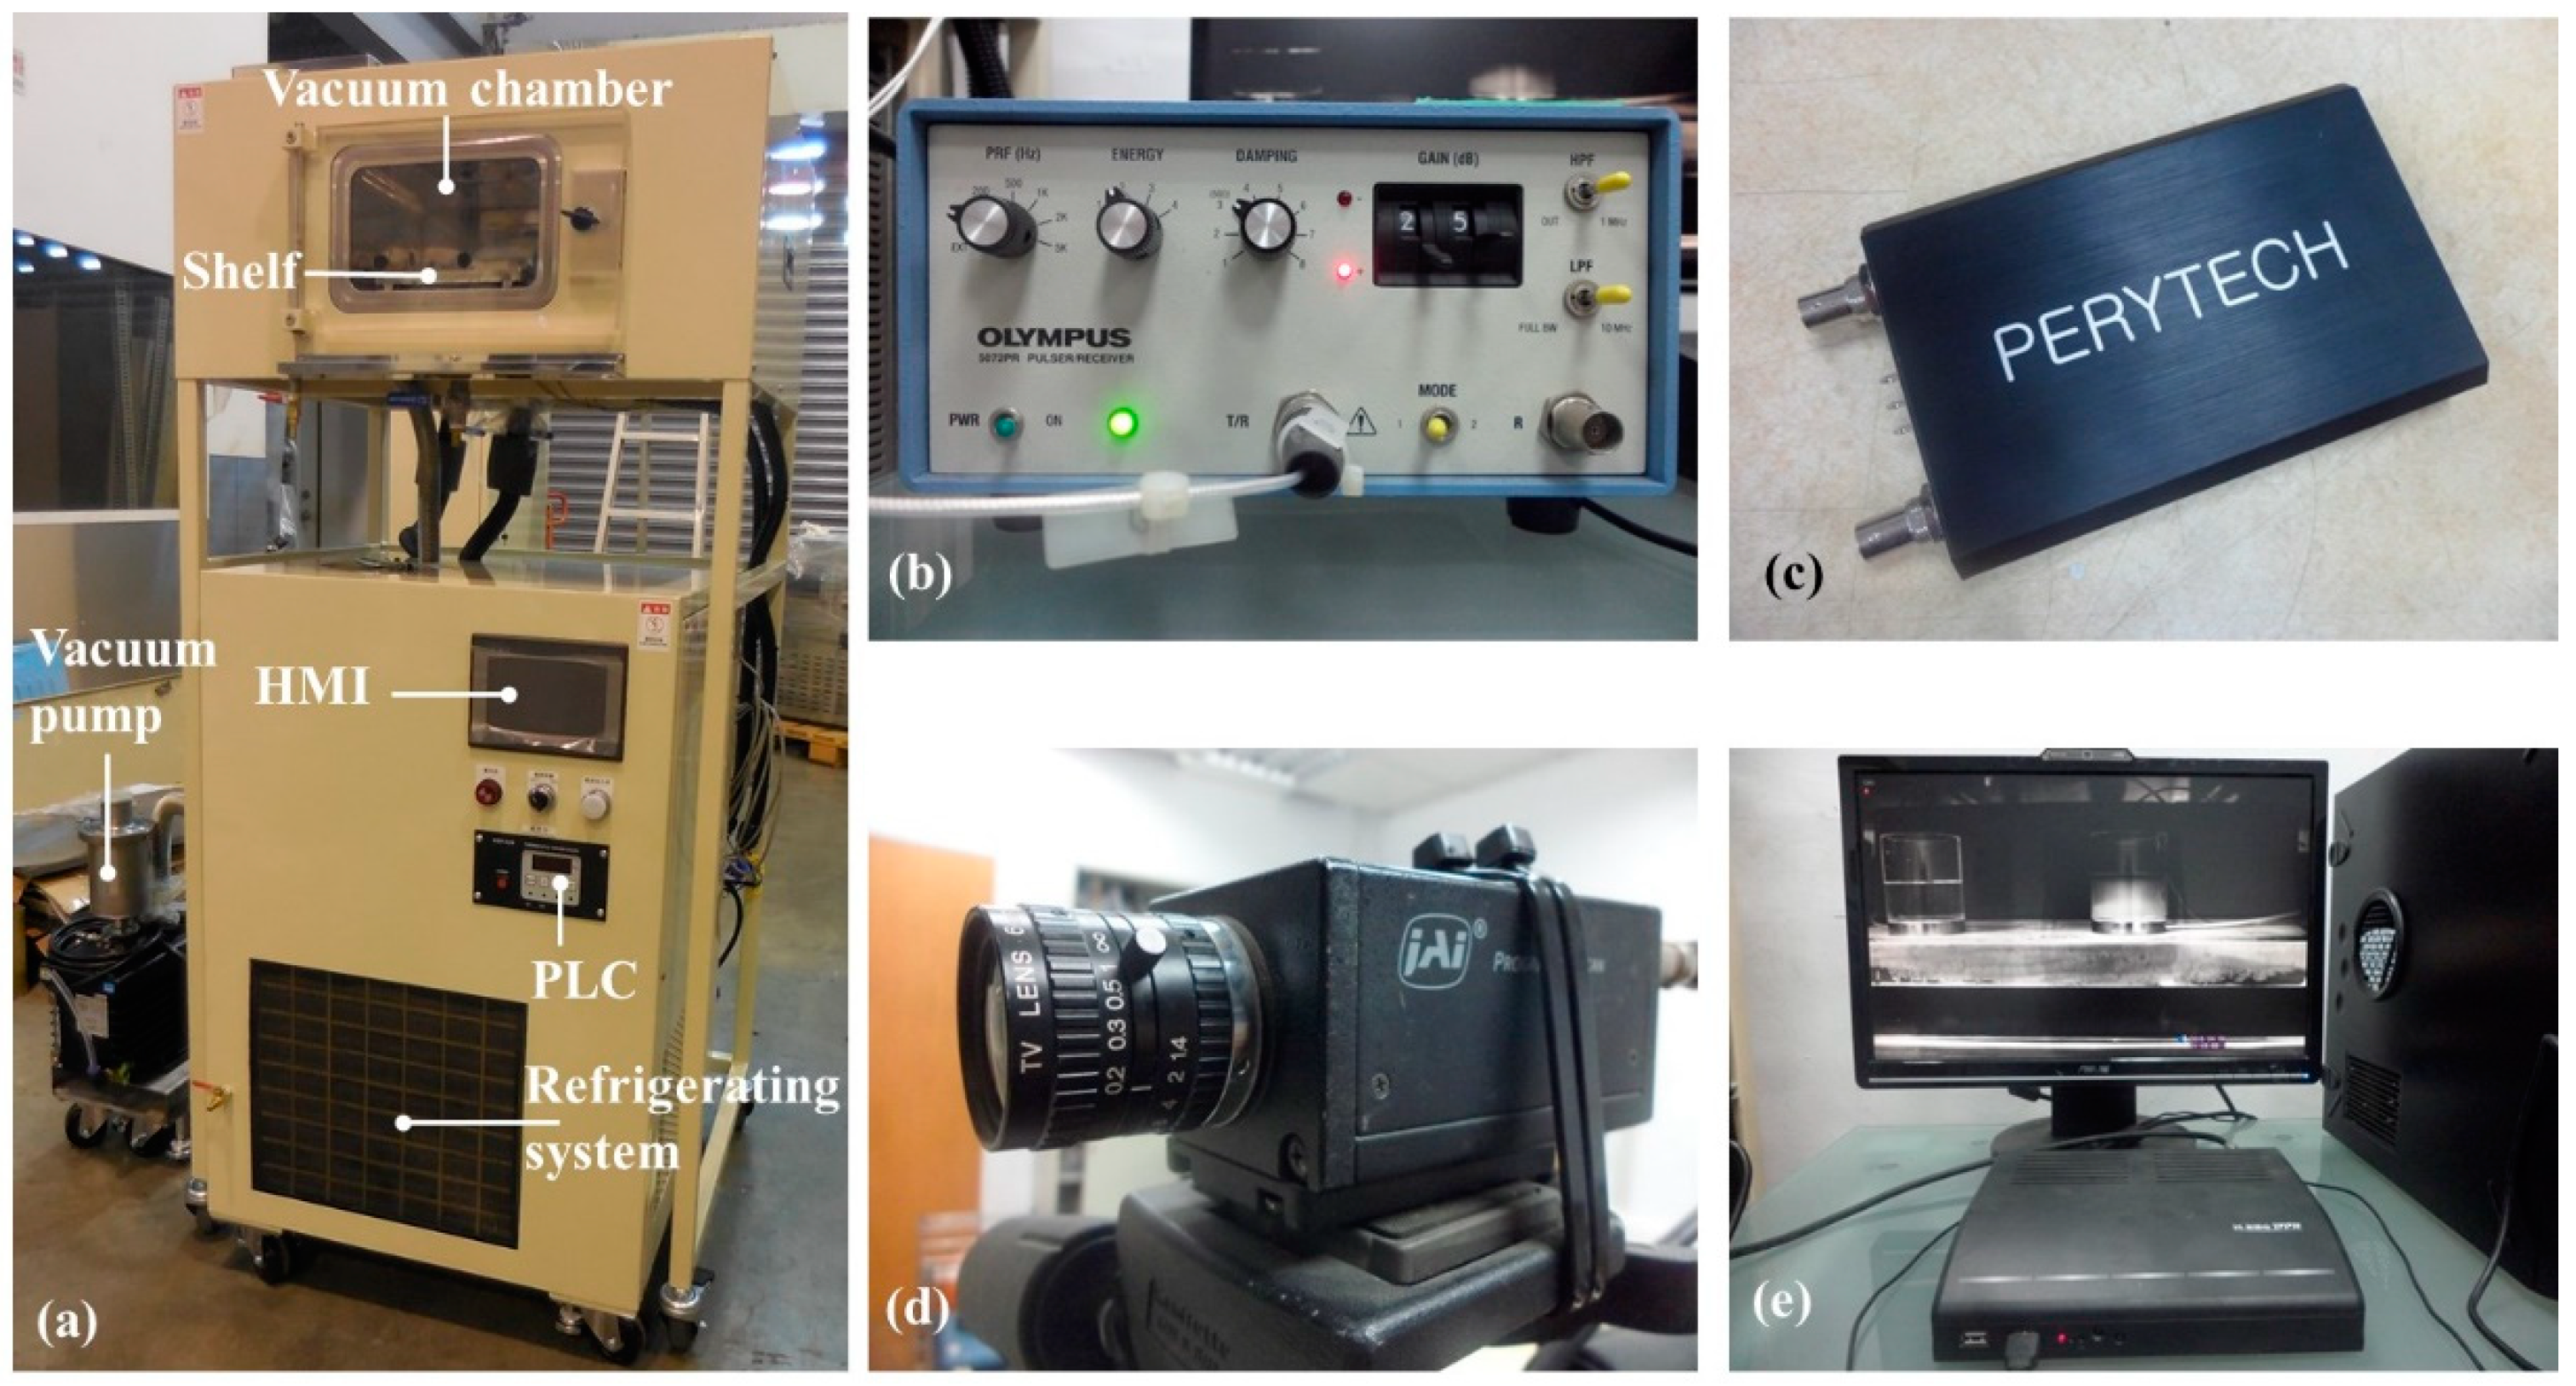
3. Experiments
4. Results and Discussions
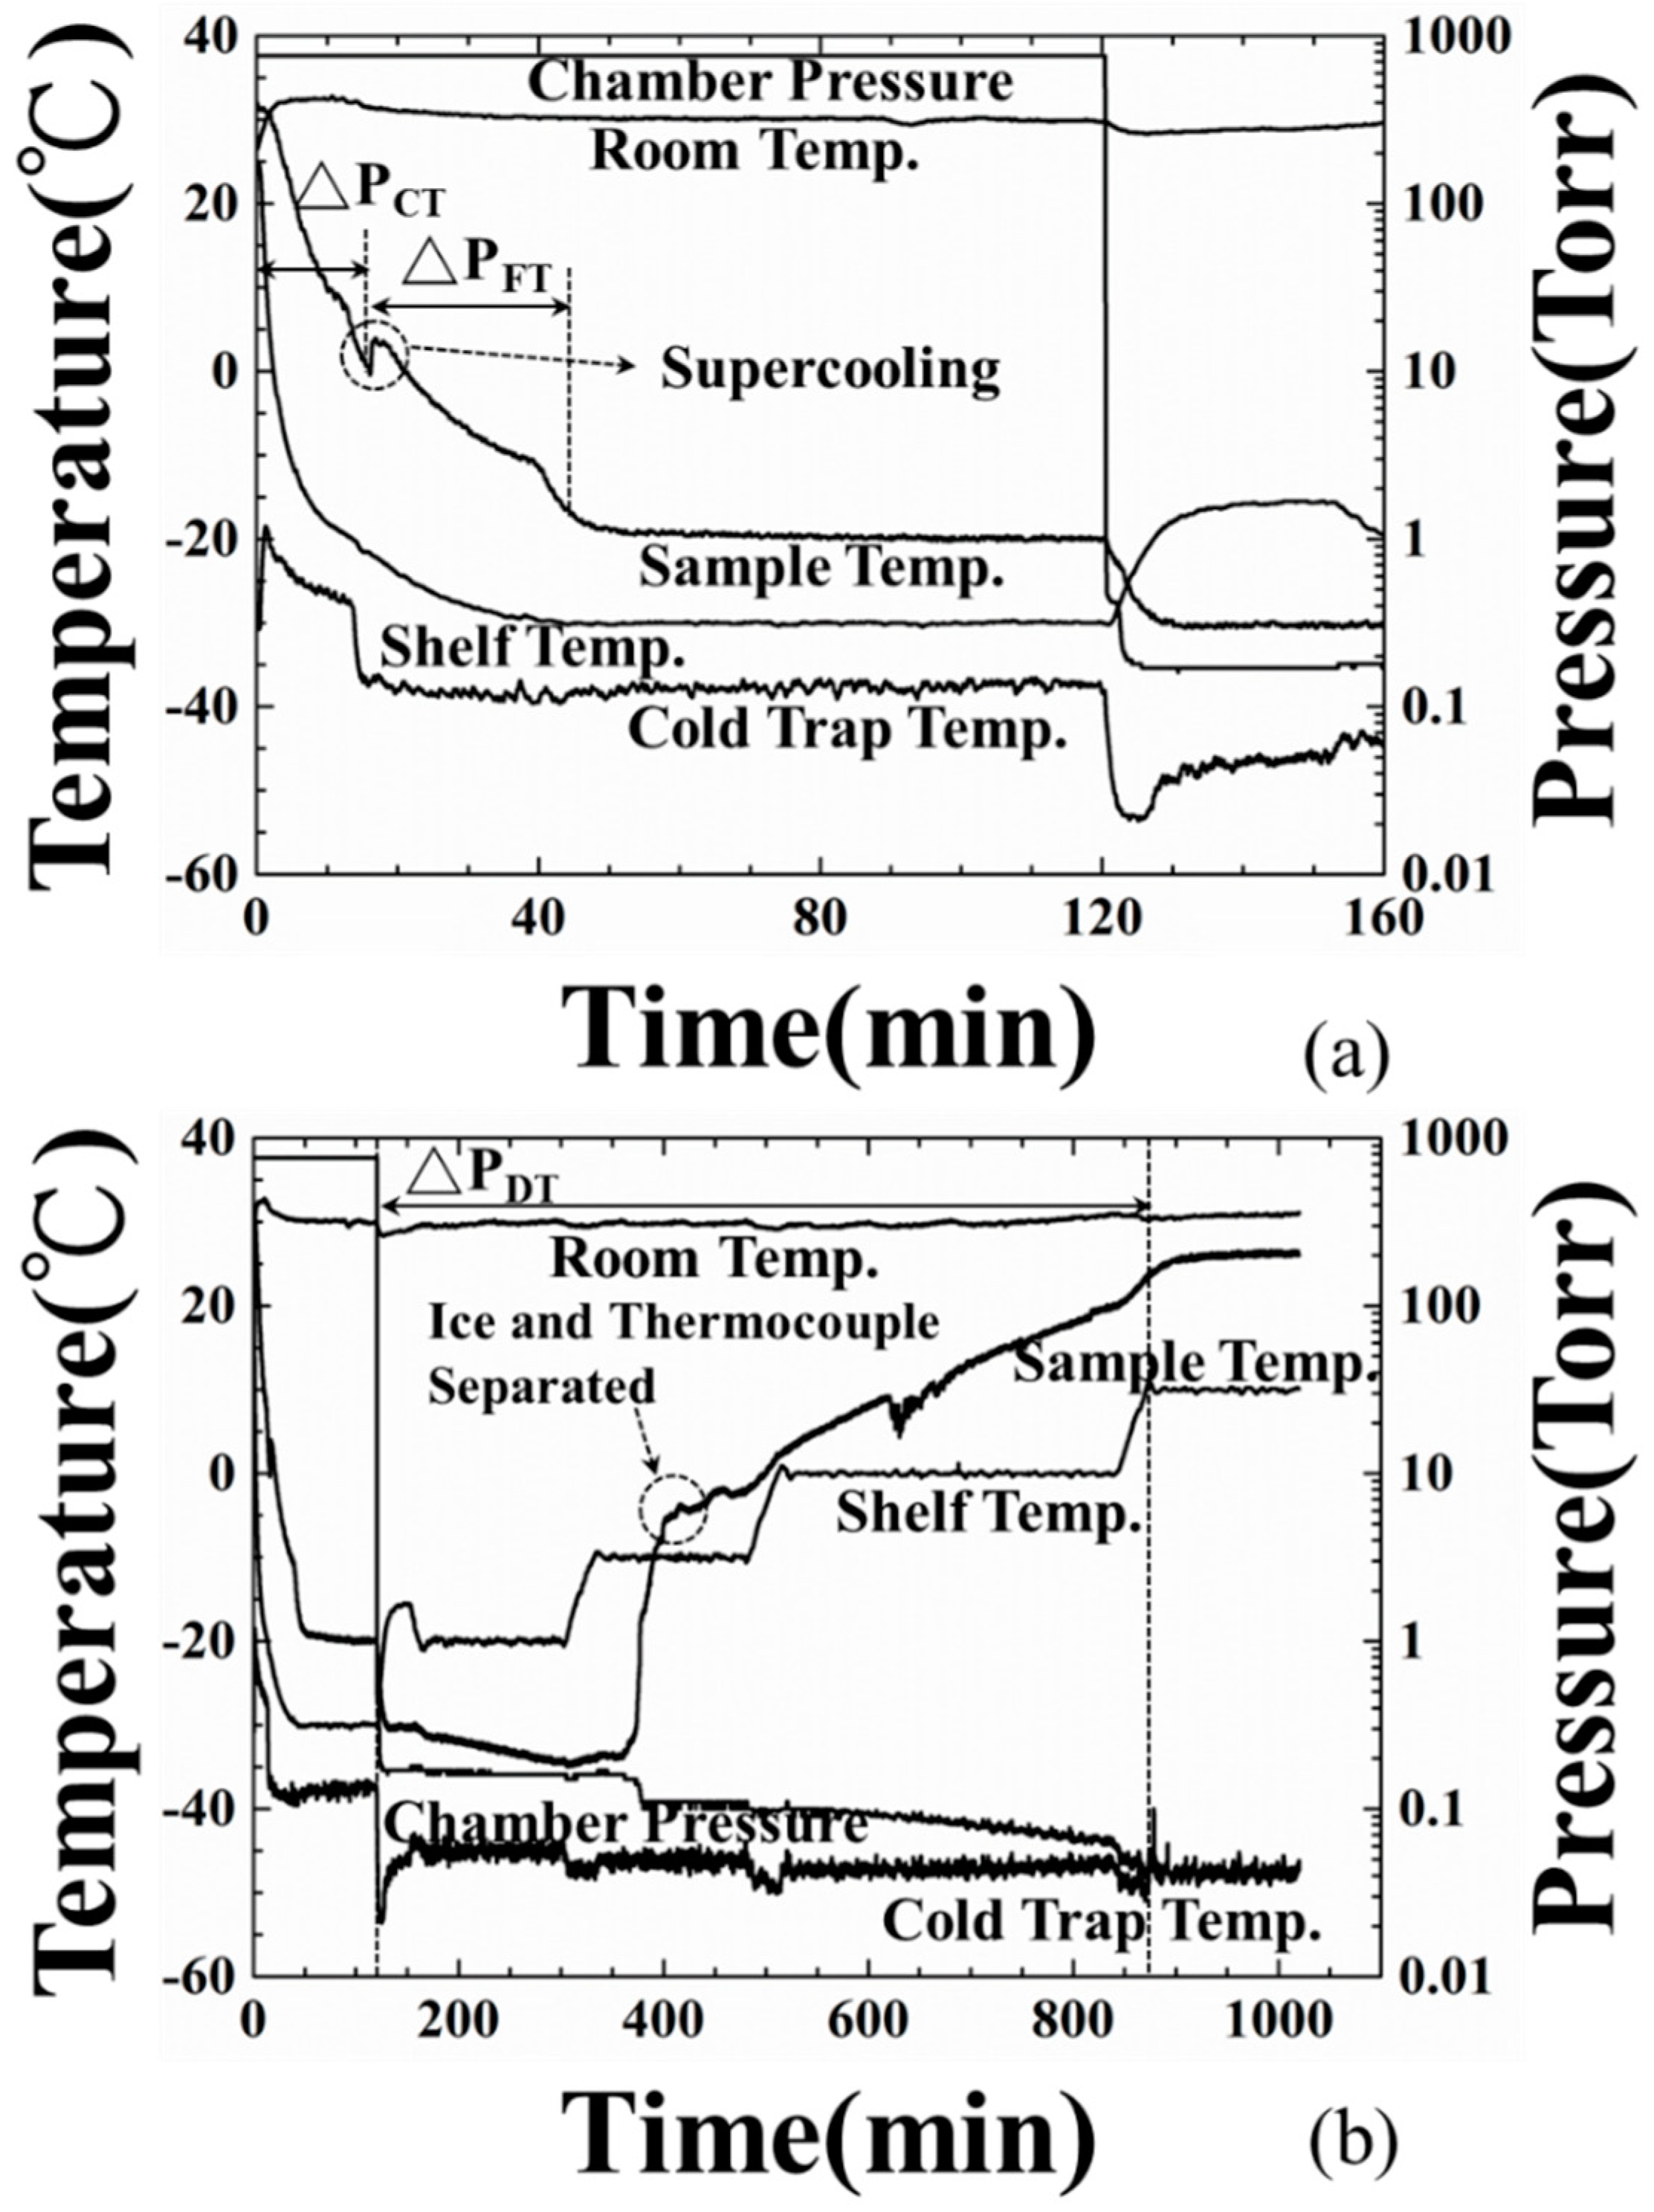
4.1. Temperature and Pressure Variations in the Vacuum Chamber during the Freeze-Drying Process
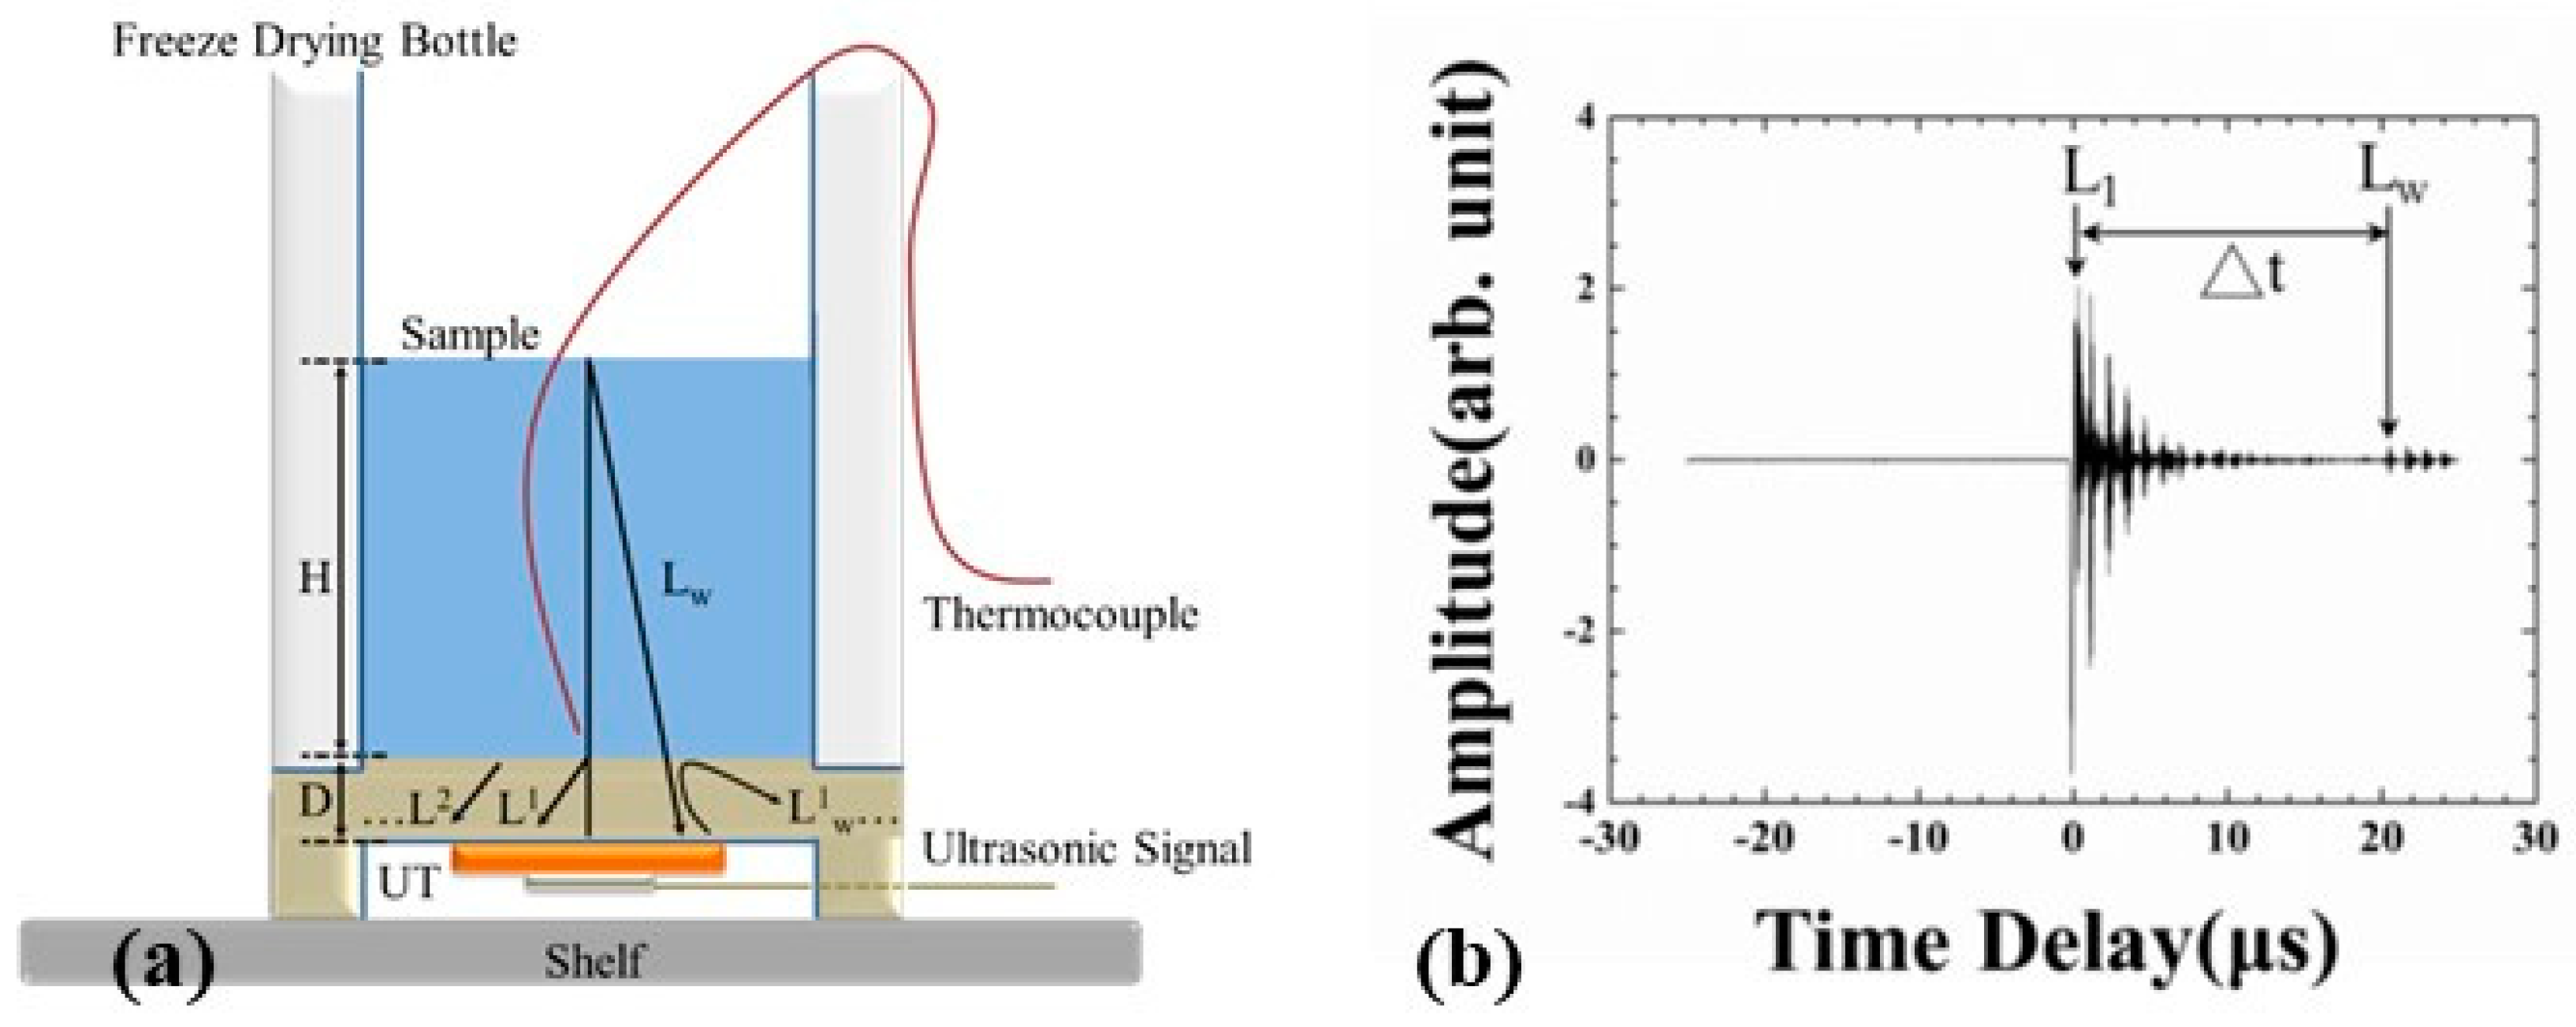
4.2. Amplitude Variation of Ultrasonic Signals during the Freeze-Drying Process
- (1)
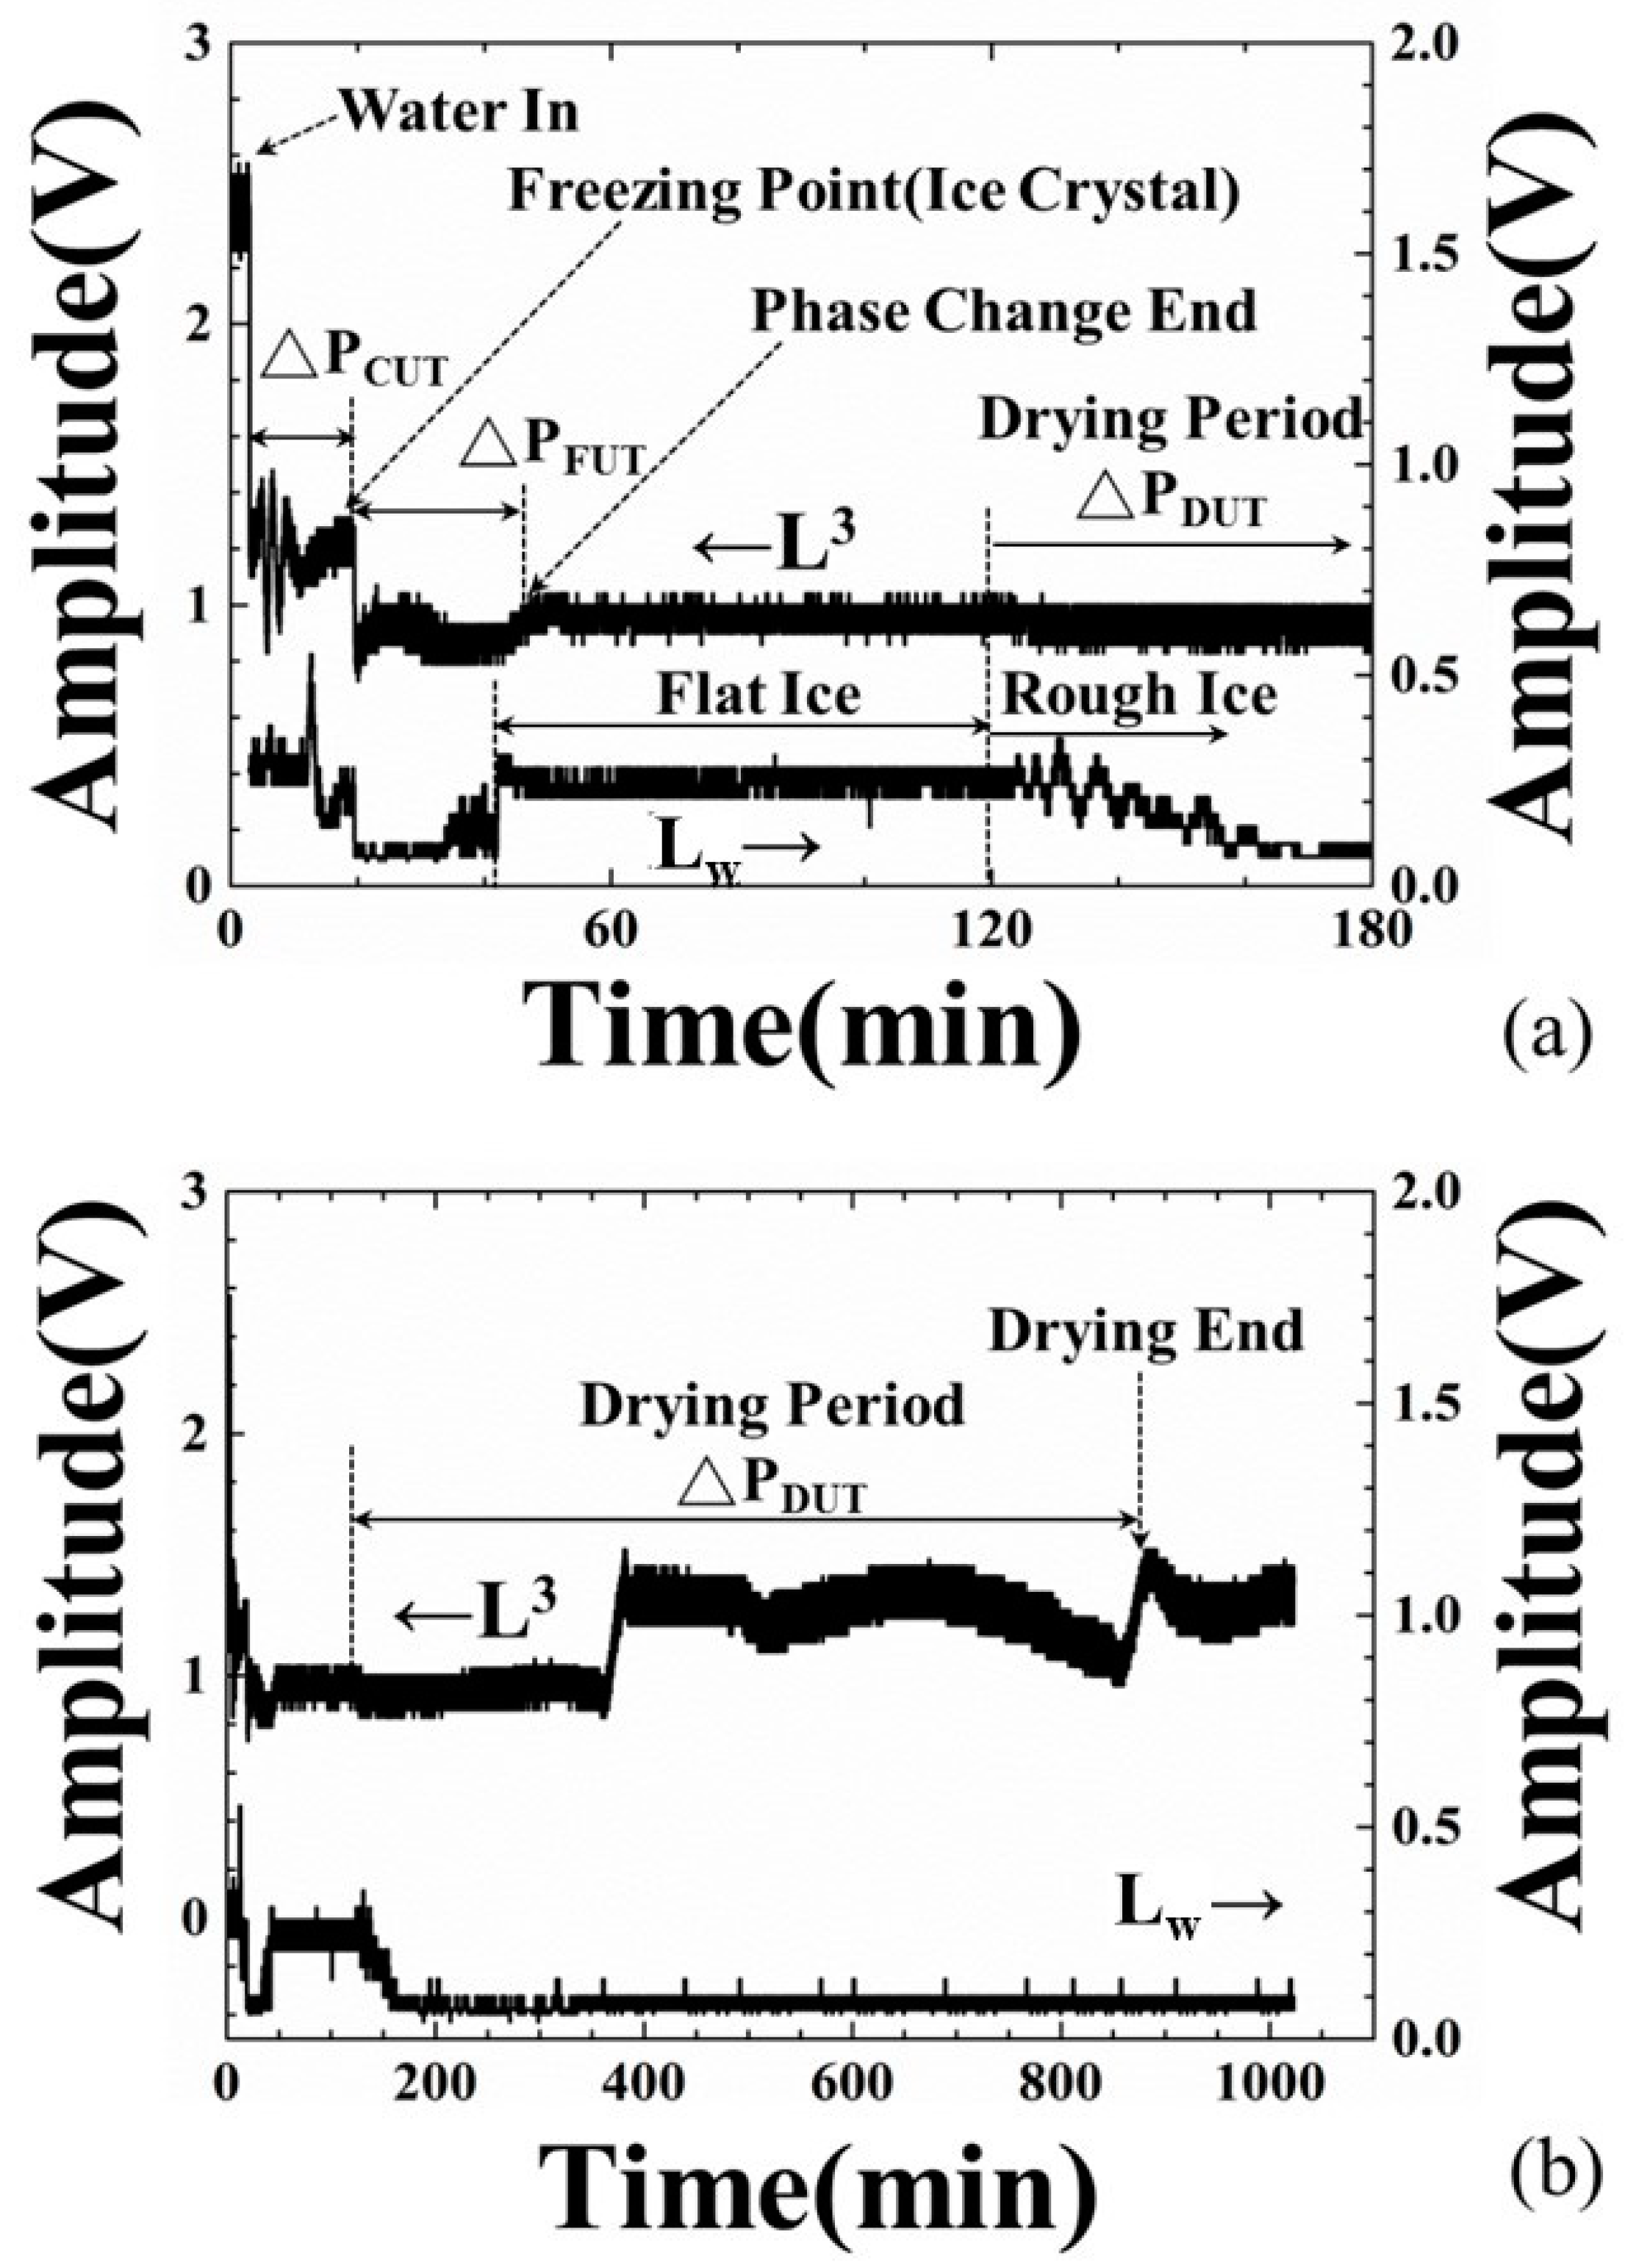
- At the 3.0-min mark: Water was poured into the container. At this moment, the amplitude of ultrasonic L3 echo decreased and Lw echo appeared, due to the fact that a part of the ultrasonic energy transmitted into the water through the steel plate/water interface. Water started to cool down.
- (2)
- At the 19.2-min mark: The amplitudes of the L3 and Lw echoes decreased further, due to the variation of water acoustic impedance. In this supercooling period, this ultrasonic phenomenon may indicate the appearance of ice crystals. The alteration of water property will cause electrical impedance changing [32]. Hence, the amplitude decreasing point of the L3 and Lw echoes is defined as the freezing point of water and the cooling period (ΔPCUT) determined by the amplitude of the L3 echo is defined as the period from water-in to the freezing point.
- (3)
- At the 43.0-min mark: The amplitude of the L3 echo increased to the relative maximum value and that of the Lw echo increased to a stable level, due to the stable ultrasonic impedance. This ultrasonic phenomenon may indicate phase change end of water and a flat ice surface. Hence, the freezing period (ΔPFUT) determined by the ultrasonic L3 echo is defined as the period from the freezing point to the phase change end.
- (4)
- At the 125.0-min mark: The chamber was exhausted and the ice started to sublimate at the 120-min mark. The amplitude of L3 echo decreased a little and that of Lw echo disappeared gradually, due to the sublimation of ice and the rough ice surface.
- (5)
- At the 370.0-min mark: The amplitude of the L3 echo increased suddenly from the bottom line and reach a stable value, due to the fact that the electromechanical coupling factor varied and the ultrasonic energy transmitting into the ice through the steel/ice interface reduced [33]. This ultrasonic phenomenon indicated the reduction of contact surface between ice and steel plate in the drying stage. At this moment, the sublimation of the ice reached a certain level and the thermocouple detached from the ice, as shown in Figure 5b.
- (6)
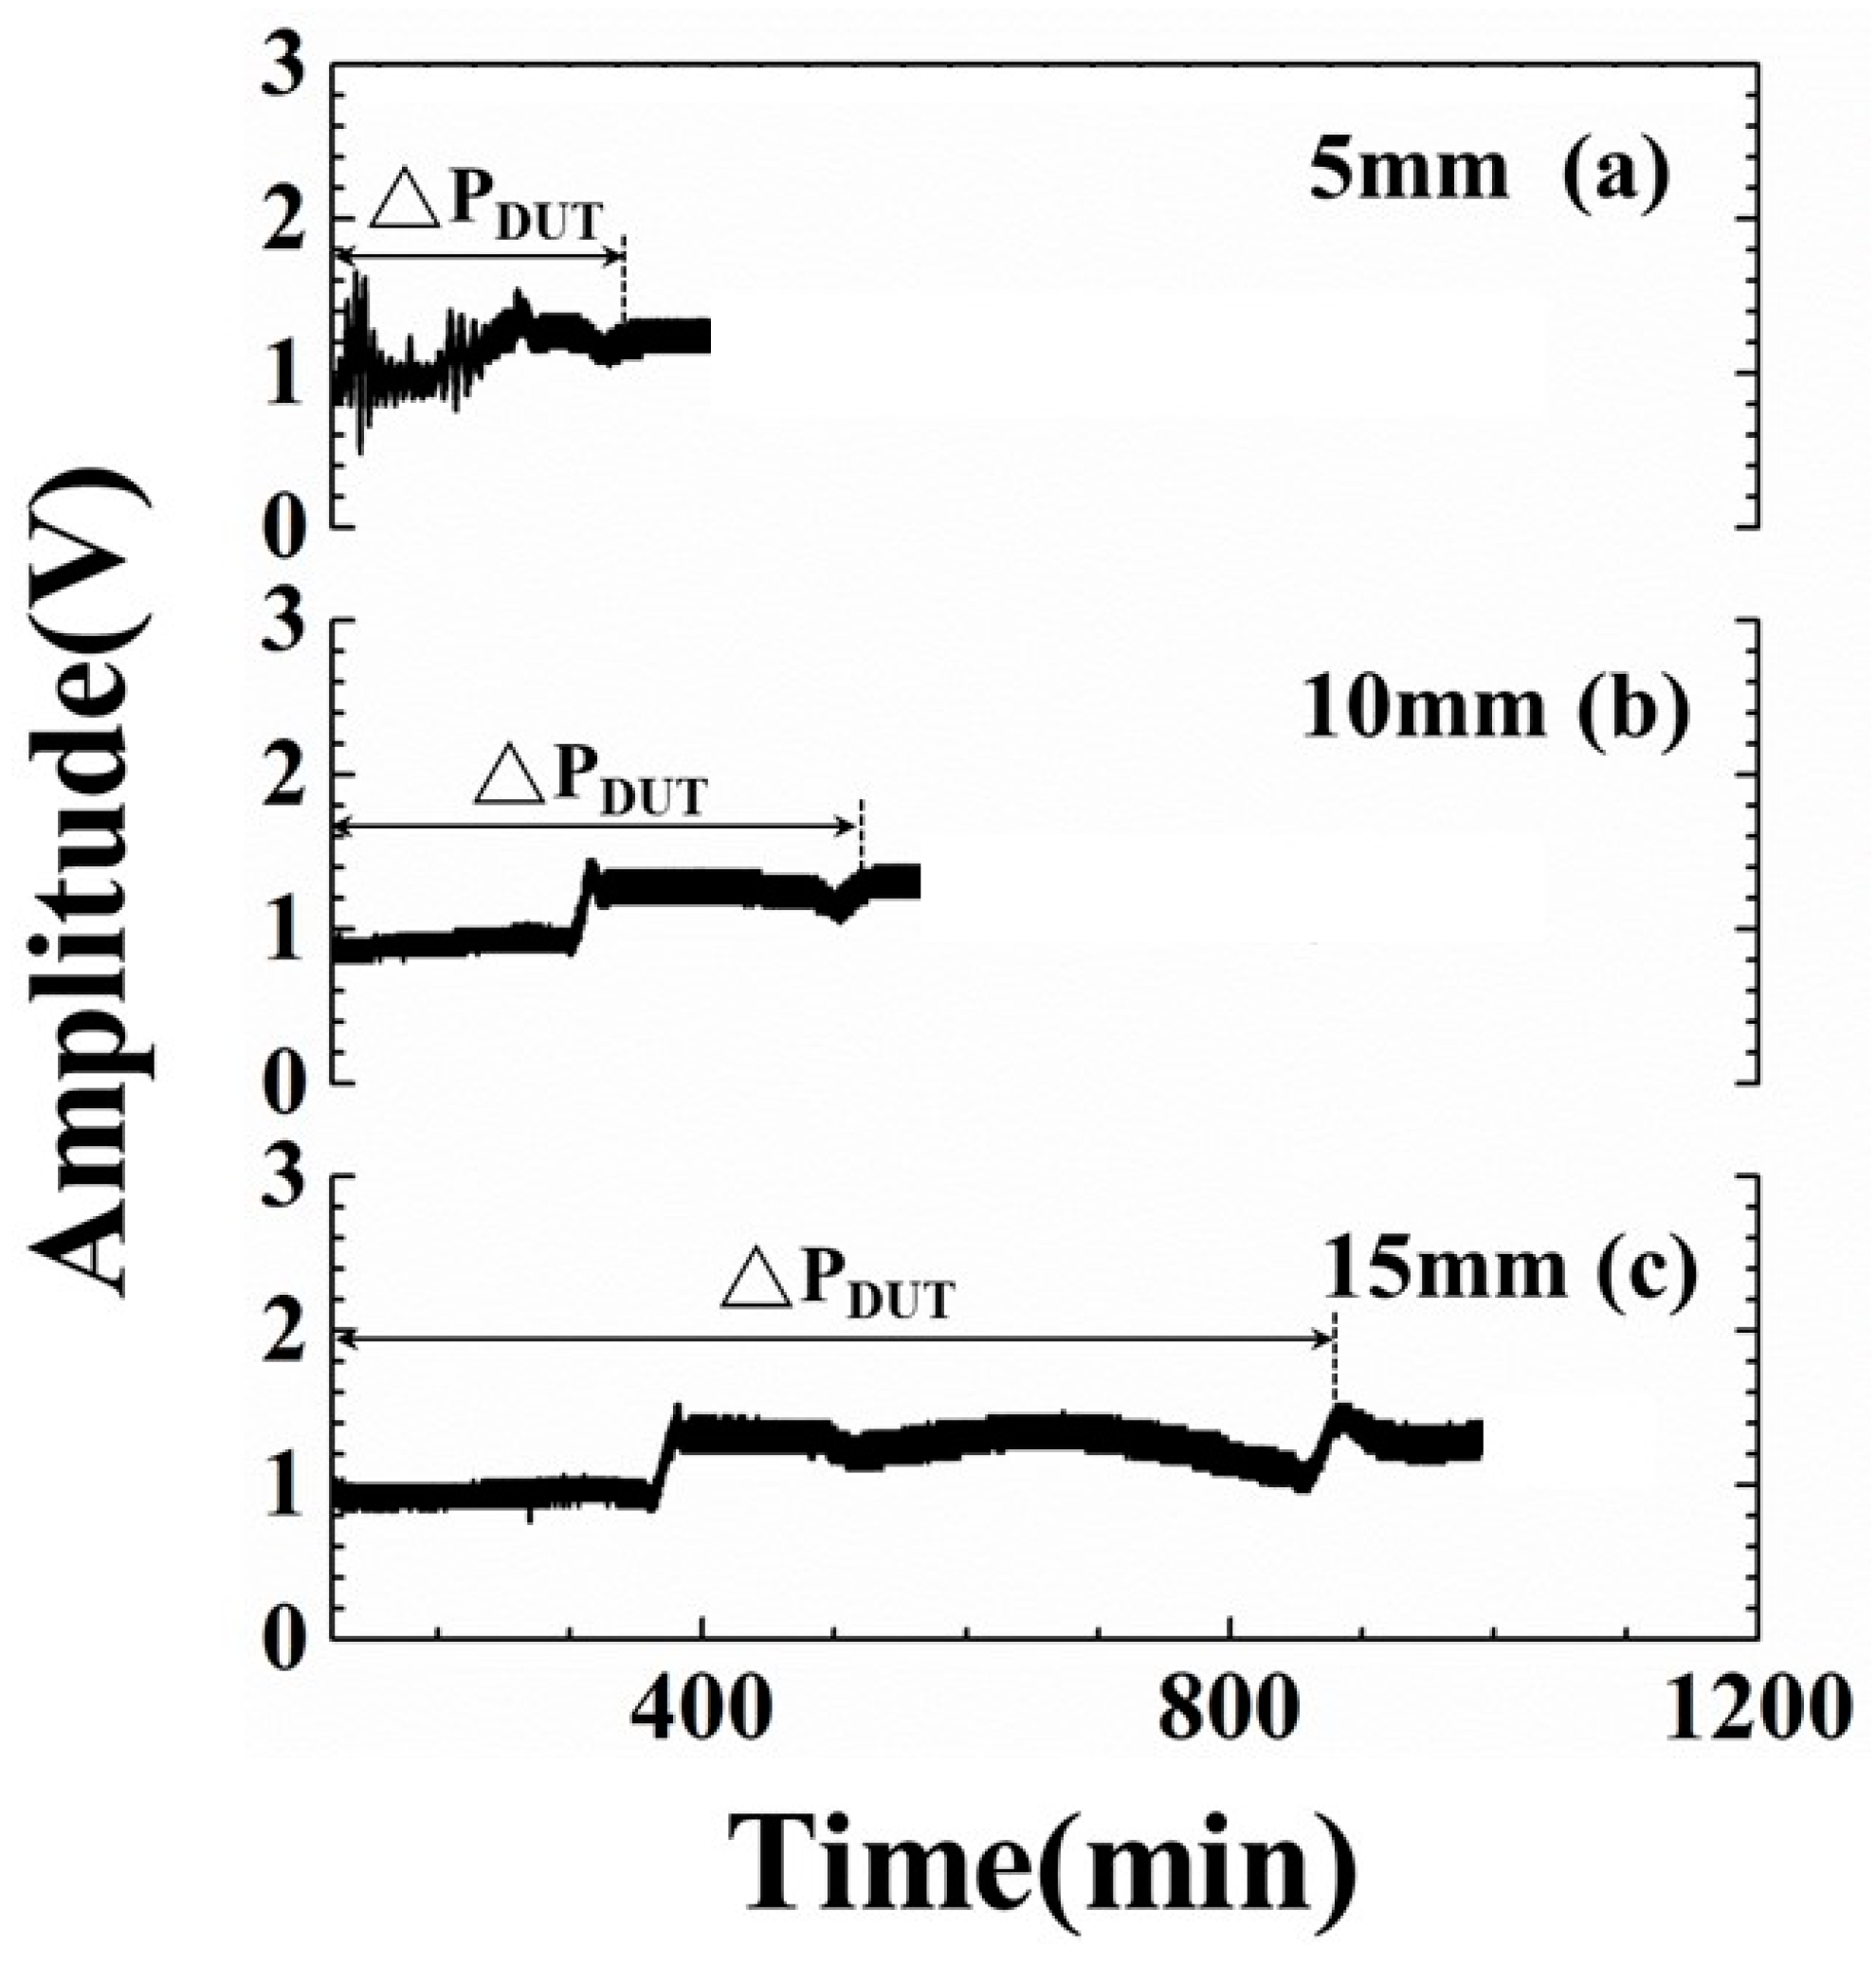
- At the 885.6-min mark: The amplitude of the L3 echo increased suddenly from the reducing tendency and reached a stable value at this moment, due to the fact that the electromechanical coupling factor varied and ultrasonic energy transmitting into the ice through the steel/ice interface reduced further. This ultrasonic phenomenon indicated the complete sublimation of the ice and only few minerals remained on the steel plate surface. This moment is defined as the drying end point. The drying period (ΔPDUT) determined by the ultrasonic L3 echo is defined as the period from the exhaust of chamber to the complete sublimation of the ice, that is, the drying end point. Compared with the typical experiment settings, the indication of drying ends for water by the amplitude variations of ultrasonic L3 echo could reduce the processing period of the 134.4 min/cycle and save 13% of consumed electricity.
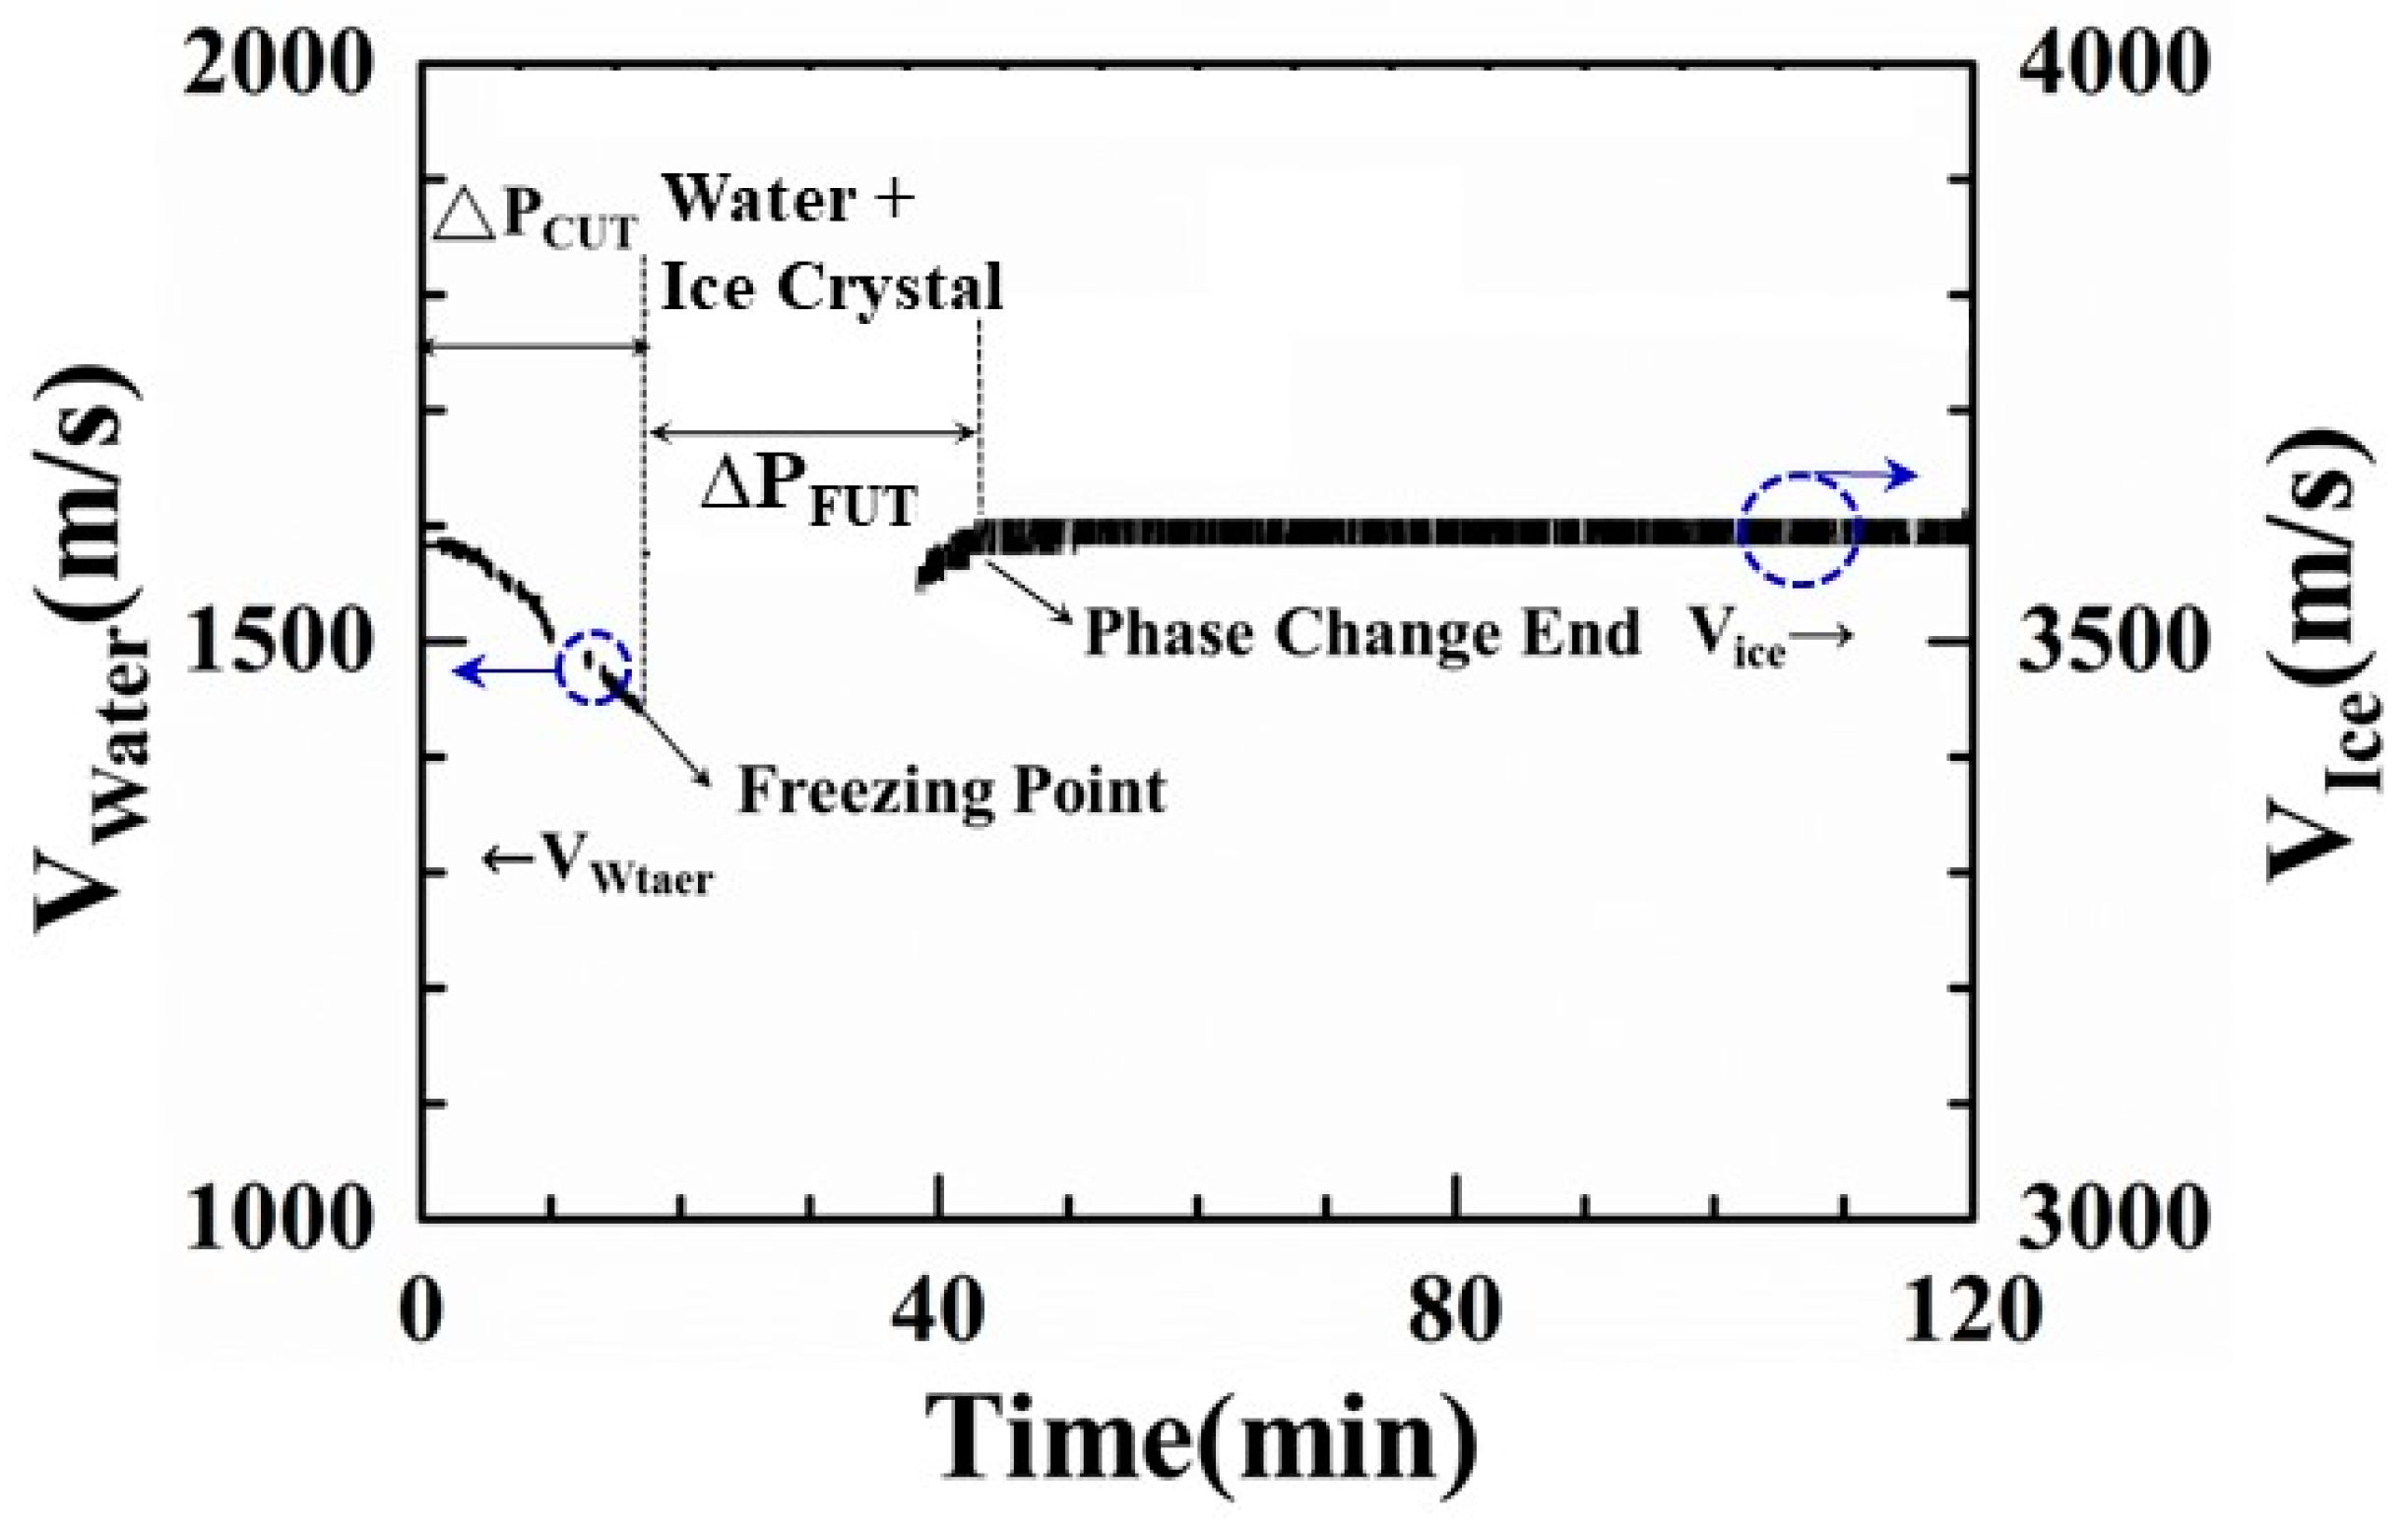
4.3. Variation of Ultrasonic Velocity during the Freeze-Drying Process
4.4. Visual Observation of the Container during the Freeze-Drying Process
- (1)
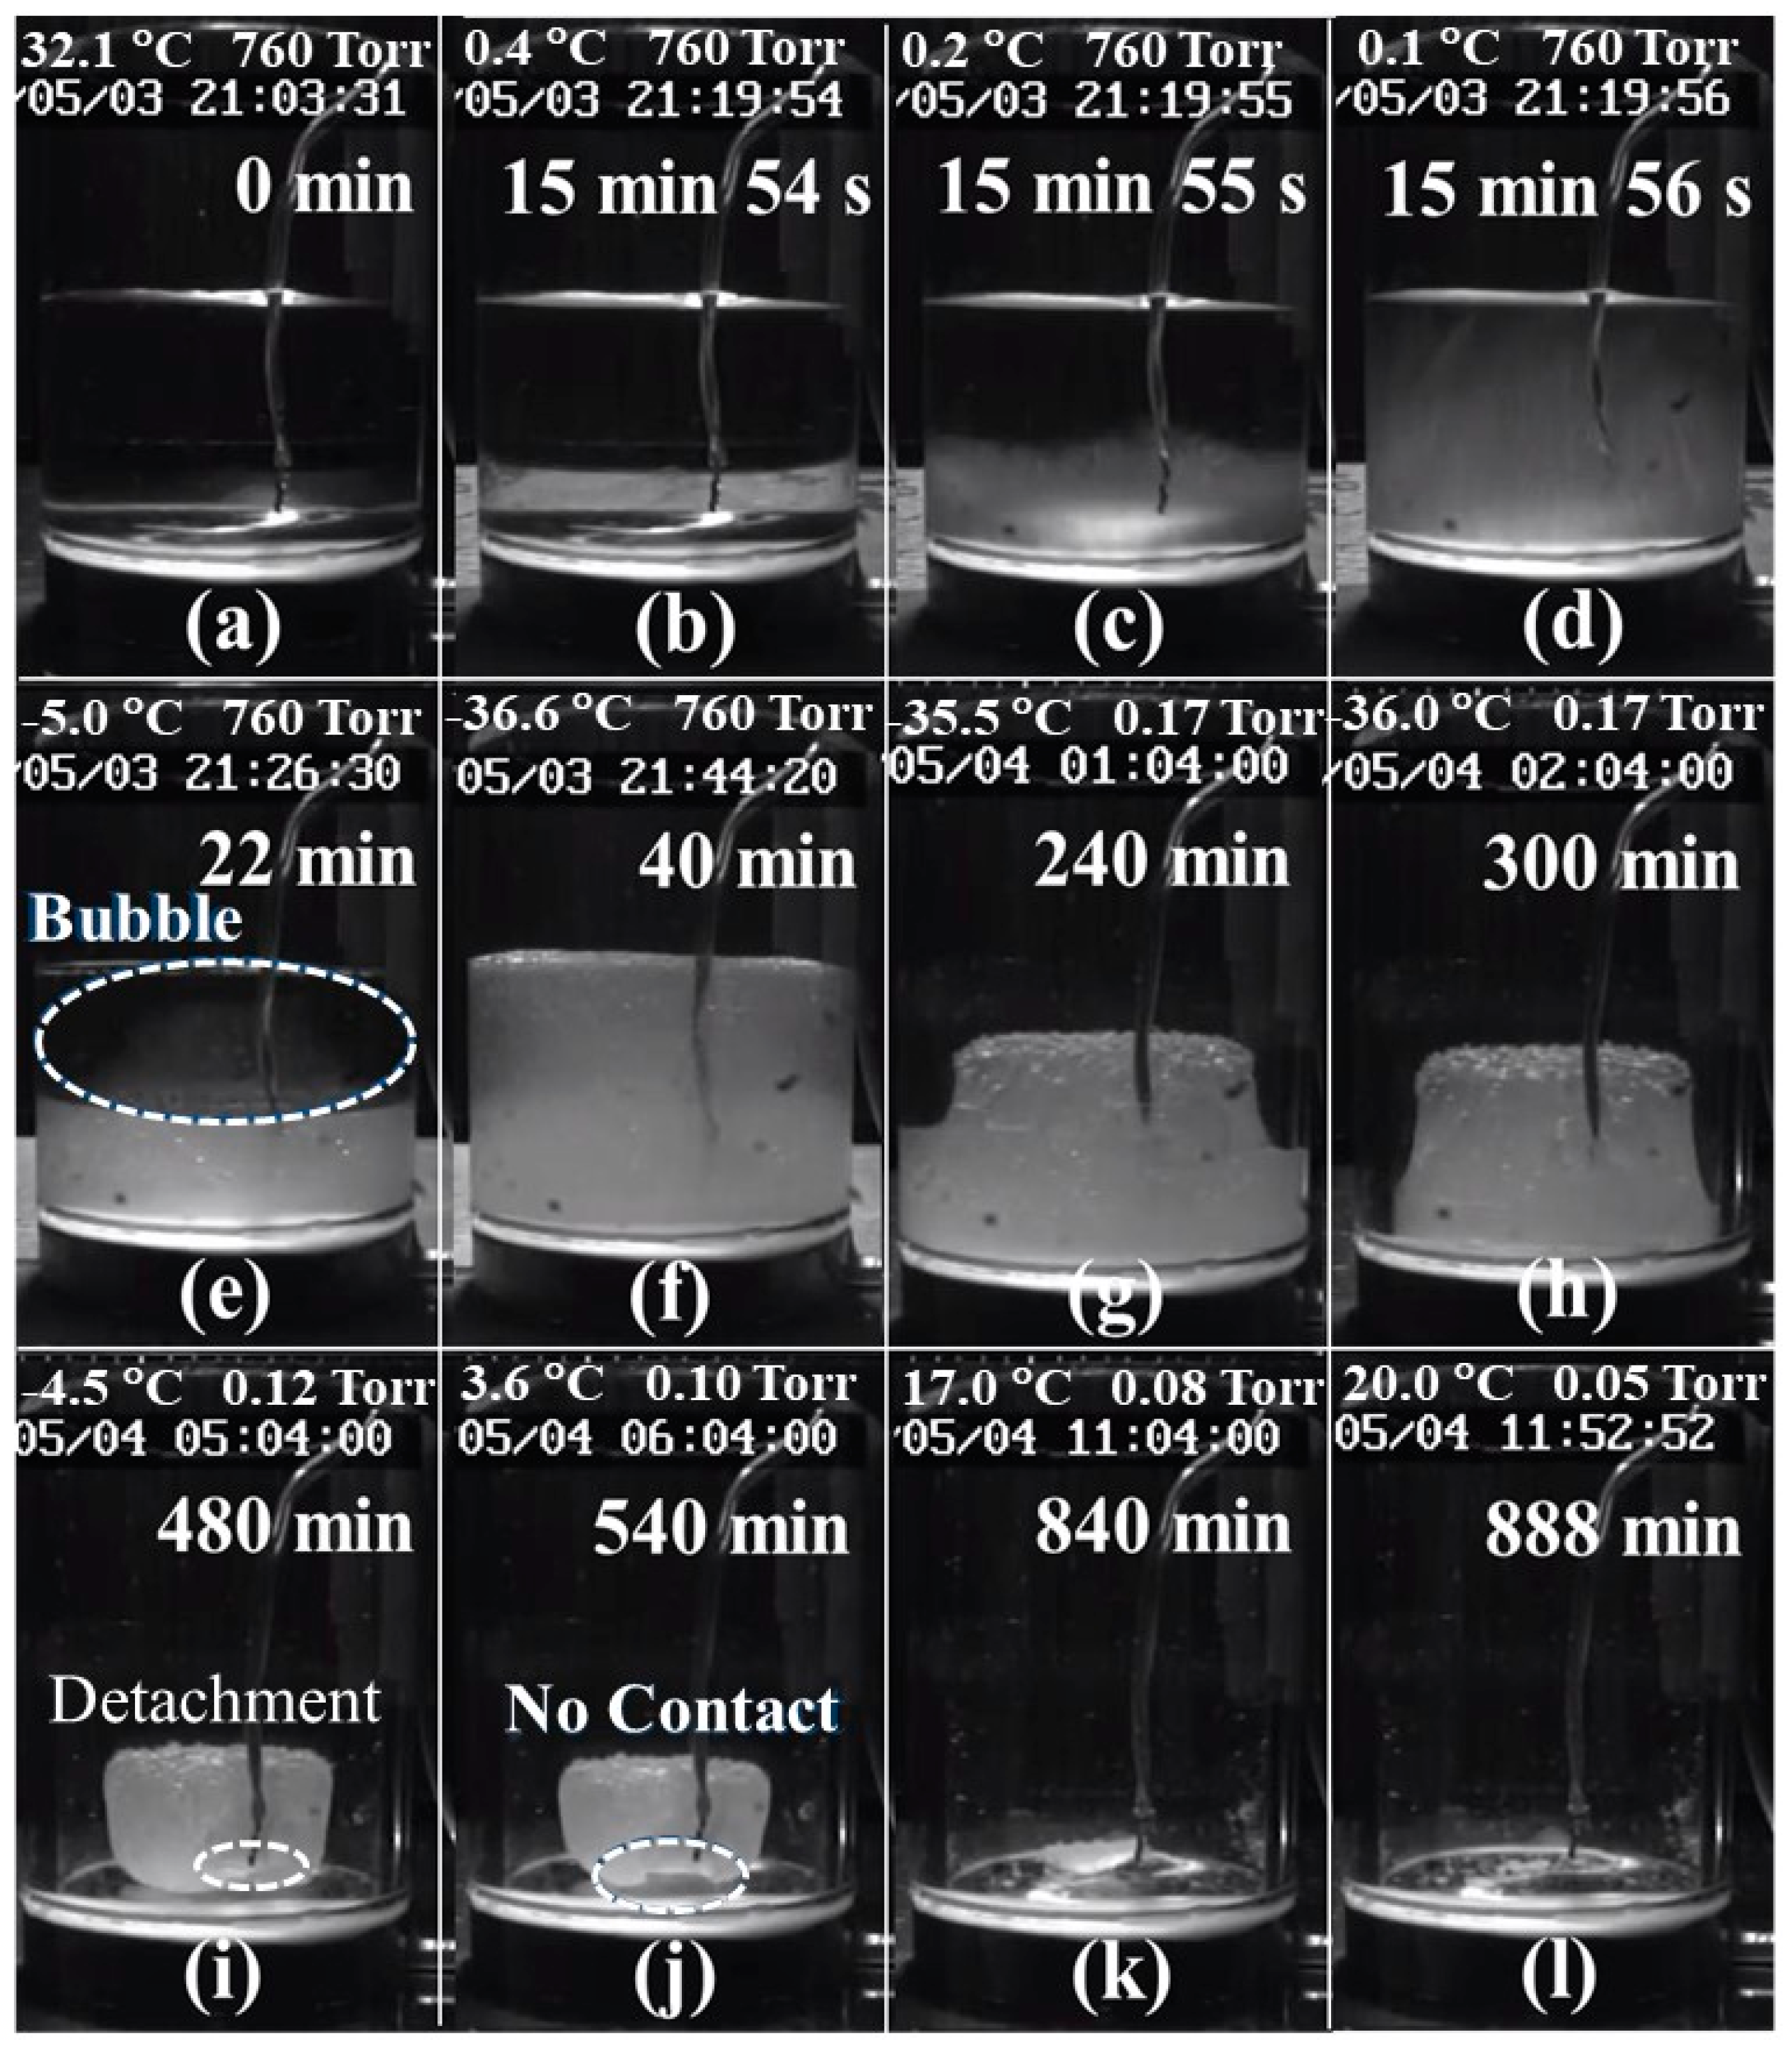
- Figure 8a: Water was poured into the container that had a thermocouple in the middle and then the container was set on the shelf of the freeze-drying machine.
- (2)
- Figure 8b–d: Most of the water was still in a liquid state. However, the water close to the bottom of the container started to become opaque and some ice crystals began to form beside the thermocouple. The ice crystals increased gradually from the bottom to the top of the container. This was an indication that the water started to freeze.
- (3)
- Figure 8e: Half of the water became very slushy and the visibility became worse. Some air bubbles also appeared within the slush.
- (4)
- Figure 8f: Most of the water had become frozen into ice. Some air bubbles were pushed up from the bottom to the top. The ice surface was flat, which indicated that the stress on the ice during the freezing process was reduced.
- (5)
- Figure 8g–h: The chamber was exhausted and a vacuum was created. The ice sublimated from the top progressing downwards towards the bottom of the container and from the exterior inwards towards the interior of the container. The ice surface was composed of porous structure and appeared rough.
- (6)
- Figure 8i–j: The ice shrank more due to further sublimation. The contact surface between the ice and the steel plate was also reduced. The thermocouple seemed to detach from the ice at the 480-min mark of the process. This could explain why the sample temperature increased suddenly from −36 to −10 °C at 390.5-min mark. At the 540-min mark, the contact surface between the ice and the steel plate was reduced even further, which may diminish the conduction of heat being transferred from the shelf to the ice.
- (7)
- Figure 8k–l: There was tiny amount of residual ice that remained on the surface of the steel plate at the 840-min mark. Finally, at the 888-min mark, only a little of ice crystals remained on the surface of the steel plate.
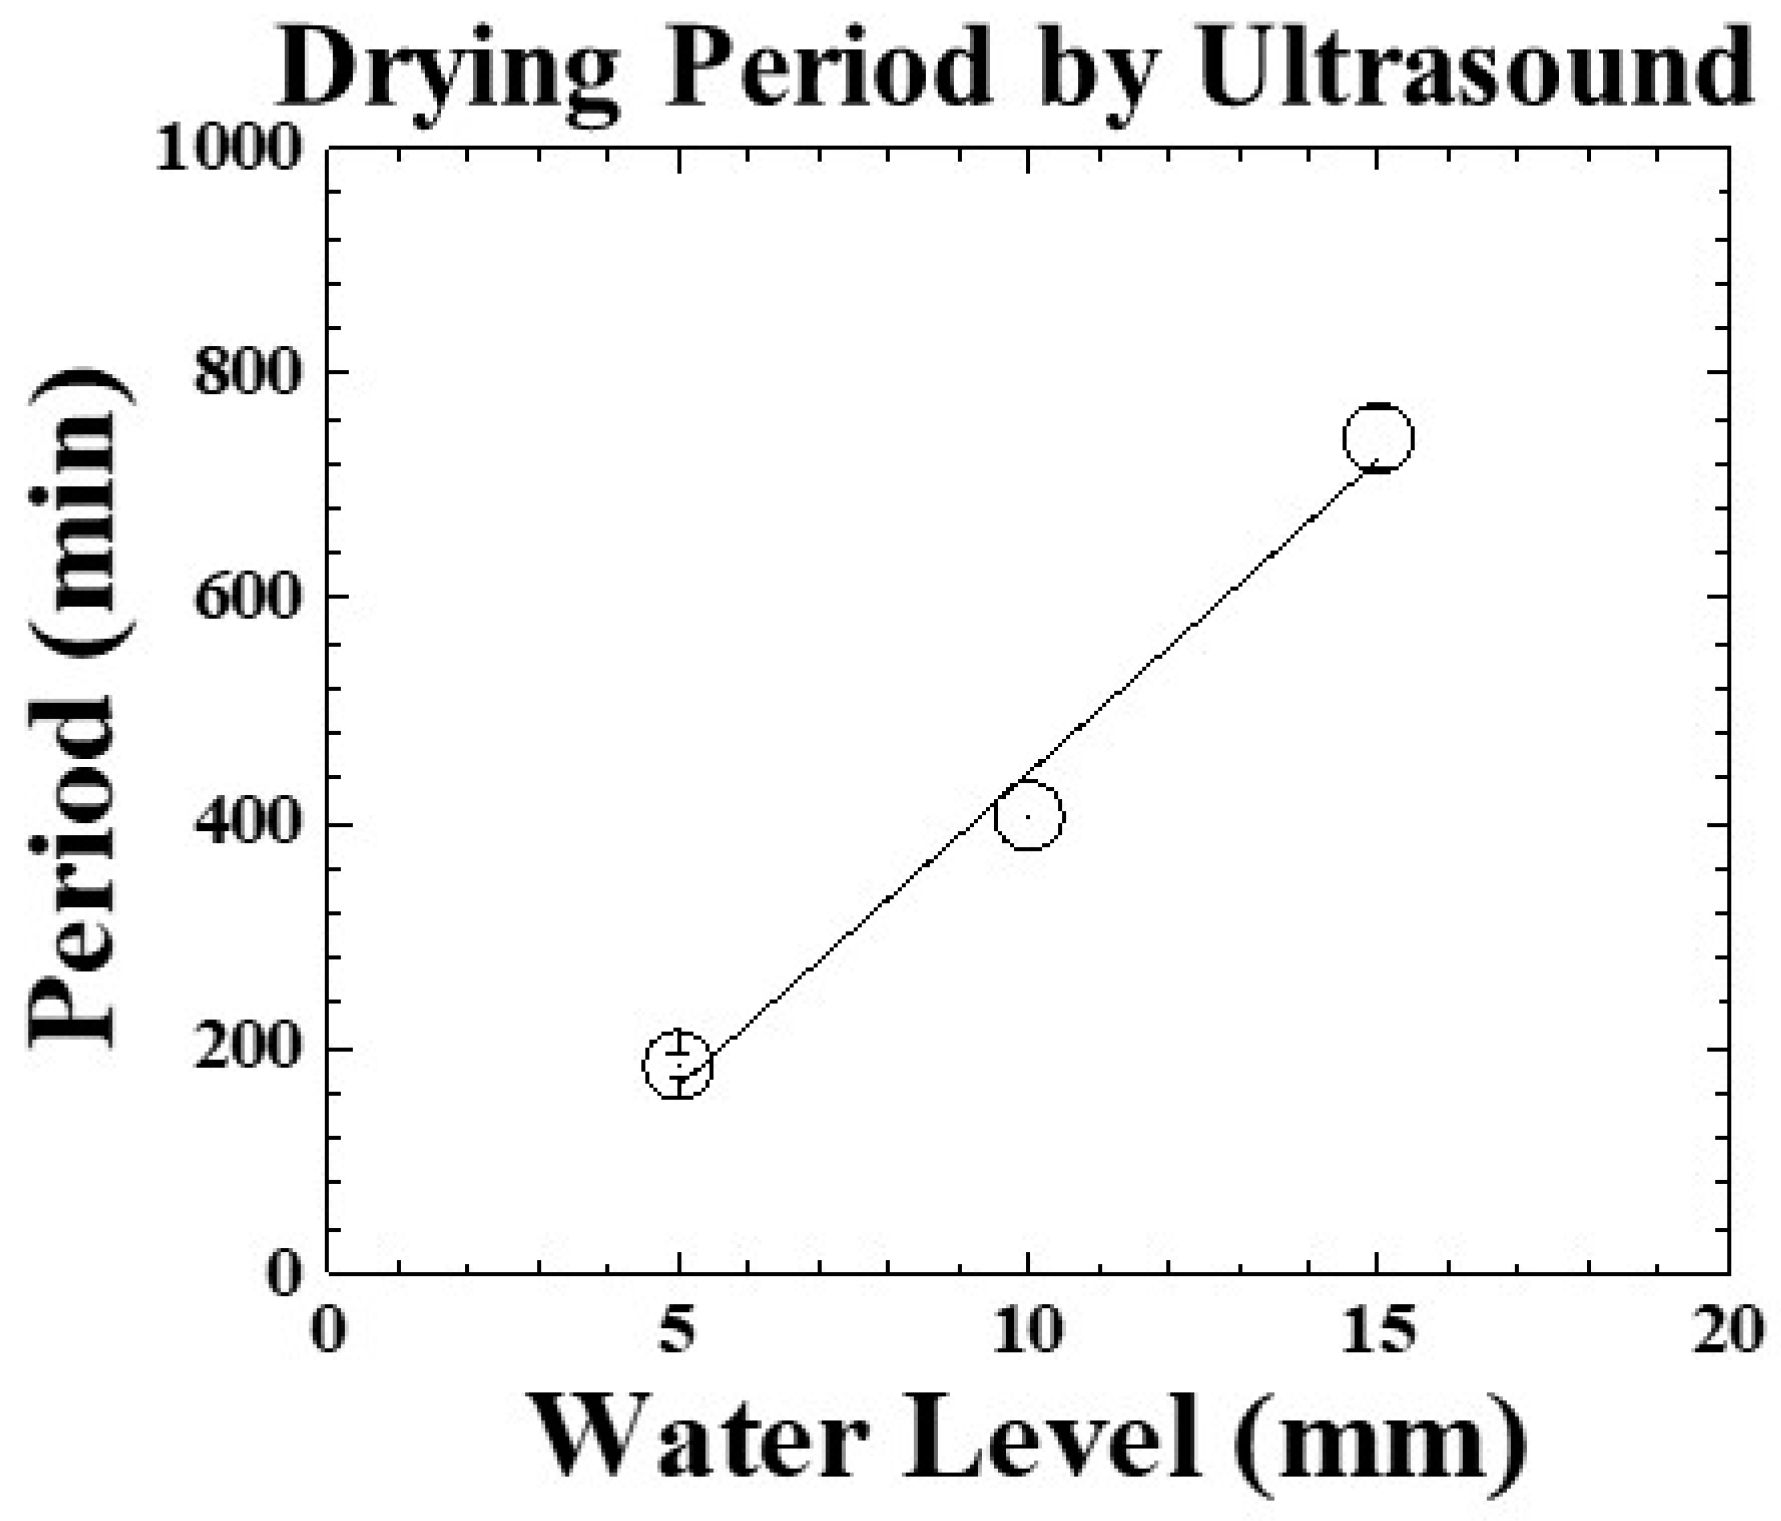
4.5. Freeze-Drying Processes of Various Water Levels
5. Conclusions
Author Contributions
Funding
Acknowledgments
Conflicts of Interest
References
- Zhao, J.H.; Liu, F.; Wen, X.; Xiao, H.W.; Ni, Y.Y. State diagram for freeze-dried mango: Freezing curve, glass transition line and maximal-freeze-concentration condition. J. Food Eng. 2015, 157, 49–56. [Google Scholar] [CrossRef]
- Chizoba Ekezie, F.G.; Sun, D.W.; Han, Z.; Cheng, J.H. Microwave-assisted food processing technologies for enhancing product quality and process efficiency: A review of recent developments. Trends Food Sci. Technol. 2017, 67, 58–69. [Google Scholar] [CrossRef]
- Ishwarya, S.P.; Anandharamakrishnan, C. Spray-Freeze-Drying approach for soluble coffee processing and its effect on quality characteristics. J. Food Eng. 2015, 149, 171–180. [Google Scholar] [CrossRef]
- Monteiro, R.L.; Link, J.V.; Tribuzi, G.; Carciofi, B.A.M.; Laurindo, J.B. Microwave vacuum drying and multi-flash drying of pumpkin slices. J. Food Eng. 2018, 232, 1–10. [Google Scholar] [CrossRef]
- Senadeera, W.; Alves-Filho, O.; Eikevik, T. Influence of drying conditions on the moisture diffusion and fluidization quality during multi-stage fluidized bed drying of bovine intestine for pet food. Food Bioprod. Process. 2013, 91, 549–557. [Google Scholar] [CrossRef]
- Maisnam, D.; Rasane, P.; Dey, A.; Kaur, S.; Sarma, C. Recent advances in conventional drying of foods. J. Food Technol. Preserv. 2016, 1, 25–34. [Google Scholar]
- Ahrens, D.C.; Villela, F.A.; Doni Filho, L. Physiological and industrial quality of white-oat (Avena sativa L.) seeds in intermittent drying. Rev. Bras. Sementes 2000, 22, 12–20. [Google Scholar] [CrossRef]
- Toshniwal, U.; Karal, S. A review paper on Solar Dryer. Int. J. Eng. Res. Appl. 2013, 3, 896–902. [Google Scholar]
- Kasper, J.C.; Friess, W. The freezing step in lyophilization: Physico-chemical fundamentals, freezing methods and consequences on process performance and quality attributes of biopharmaceuticals. Eur. J. Pharm. Biopharm. 2011, 78, 248–263. [Google Scholar] [CrossRef]
- Siew, A. Freeze-drying process optimization. Pharm. Technol. 2018, 42, 18–23. [Google Scholar]
- Ratti, C. Hot air and freeze-drying of high-value foods: A review. J. Food Eng. 2001, 49, 311–319. [Google Scholar] [CrossRef]
- Rahman, M.S.; Guizani, N.; Al-Khaseibi, M.; Al-Hinai, S.A.; Al-Maskri, S.S.; Al-Hamhami, K. Analysis of cooling curve to determine the end point of freezing. Food Hydrocoll. 2002, 16, 653–659. [Google Scholar] [CrossRef]
- Mellor, J.D.; Bell, G.A. Freeze-Drying—The Basic Process. In Encyclopedia of Food Sciences and Nutrition; Elsevier: Amsterdam, The Netherlands, 2003; pp. 2697–2701. ISBN 9780122270550. [Google Scholar]
- Wang, D.Q.; Hey, J.M.; Nail, S.L. Effect of Collapse on the Stability of Freeze-Dried Recombinant Factor VIII and α-Amylase. J. Pharm. Sci. 2004, 93, 1253–1263. [Google Scholar] [CrossRef]
- Tang, X.; Nail, S.L.; Pikal, M.J. Freeze-drying process design by manometric temperature measurement: Design of a smart freeze-dryer. Pharm. Res. 2005, 22, 685–700. [Google Scholar] [CrossRef]
- Chang, B.S.; Patro, S.Y. Freeze-drying Process Development for Protein Pharmaceuticals. In Lyophilization of Biopharmaceuticals; American Association of Pharmaceutical Scientists: Arlington, VA, USA, 2004; pp. 113–138. ISBN 978-0-9711767-6-8. [Google Scholar]
- Pikal, M.J.; Shah, S.; Roy, M.L.; Putman, R. The secondary drying stage of freeze drying: Drying kinetics as a function of temperature and chamber pressure. Int. J. Pharm. 1990, 60, 203–207. [Google Scholar] [CrossRef]
- Breen, E.D.; Curley, J.G.; Overcashier, D.E.; Hsu, C.C.; Shire, S.J. Effect of moisture on the stability of a lyophilized humanized monoclonal antibody formulation. Pharm. Res. 2001, 18, 1345–1353. [Google Scholar] [CrossRef]
- Rahman, M.S. Handbook of Food Preservation, 2nd ed.; Rahman, M.S., Ed.; Taylor & Francis Group: Milton Park, UK, 2007; ISBN 9781845697587. [Google Scholar]
- Nail, S.; Tchessalov, S.; Shalaev, E.; Ganguly, A.; Renzi, E.; Dimarco, F.; Wegiel, L.; Ferris, S.; Kessler, W.; Pikal, M.; et al. Recommended Best Practices for Process Monitoring Instrumentation in Pharmaceutical Freeze Drying—2017. AAPS PharmSciTech 2017, 18, 2379–2393. [Google Scholar] [CrossRef]
- Malik, N.; Gouseti, O.; Bakalis, S. Effect of freezing with temperature fluctuations on microstructure and dissolution behavior of freeze-dried high solid systems. Energy Procedia 2017, 123, 2–9. [Google Scholar] [CrossRef]
- Tseng, Y.H.; Cheng, C.C.; Cheng, H.P.; Lee, D. Novel Real-Time Diagnosis of the Freezing Process Using an Ultrasonic Transducer. Sensors 2015, 15, 10332–10349. [Google Scholar] [CrossRef]
- Hellier, C.J. Handbook of Nondestructive Evaluation; McGraw-Hill Companies, Inc.: New York, NY, USA, 2003; ISBN 007139947X. [Google Scholar]
- Cheng, C.C.; Yang, S.Y.; Lee, D. Novel real-time temperature diagnosis of conventional hot-embossing process using an ultrasonic transducer. Sens. Switz. 2014, 14, 19493–19506. [Google Scholar] [CrossRef] [PubMed]
- Wu, Y.L.; Cheng, C.C.; Kobayashi, M.; Yang, C.H. Novel design of extension nozzle and its application on real-time injection molding process diagnosed by ultrasound. Sens. Actuators A Phys. 2017, 263, 430–438. [Google Scholar] [CrossRef]
- Cheng, C.-C.; Wu, C.-L.; Wu, K.-T.; Yang, S.-Y. Real-time diagnosis of gas-assisted hot embossing process by ultrasound. Polym. Eng. Sci. 2013, 53, 2175–2182. [Google Scholar] [CrossRef]
- Kažys, R.; Voleišis, A.; Voleišienė, B. High temperature ultrasonic transducers: Review. Ultrasound 2008, 63, 7–17. [Google Scholar]
- Takahashi, M.; Ihara, I. Ultrasonic monitoring of internal temperature distribution in a heated material. Jpn. J. Appl. Phys. 2008, 47, 3894–3898. [Google Scholar] [CrossRef]
- Cheng, C.C. Micromolding of polymer nanocomposites diagnosed by ultrasound. J. Polym. Eng. 2010, 30, 95–108. [Google Scholar] [CrossRef]
- Passot, S.; Tréléa, I.C.; Marin, M.; Galan, M.; Morris, G.J.; Fonseca, F. Effect of controlled ice nucleation on primary drying stage and protein recovery in vials cooled in a modified freeze-dryer. J. Biomech. Eng. 2009, 131, 074511. [Google Scholar] [CrossRef] [PubMed]
- Cheng, C.-C.; Young, S.-L.; Chen, H.-Z.; Yang, S.-Y. Substrate Effect on Characteristics of PbZrxTi1−xO3 (PZT) Film. Integr. Ferroelectr. 2014, 150, 51–58. [Google Scholar] [CrossRef]
- Shuyu, L. Load characteristics of high power sandwich piezoelectric ultrasonic transducers. Ultrasonics 2005, 43, 365–373. [Google Scholar] [CrossRef]
- Arnold, F.J.; Roger, L.L.B.; Gonçalves, M.S.; Mühlen, S.S. Electrical Impedance of Piezoelectric Ceramics under Acoustic Loads. Ecti Trans. Electr. Eng. Electron. Commun. 2014, 12, 48–54. [Google Scholar]
- Bilaniuk, N.; Wong, G.S.K. Speed of sound in pure water as a function of temperature. J. Acoust. Soc. Am. 1993, 93, 1609–1612. [Google Scholar] [CrossRef]


| Freezing Temp. (°C) | Freezing Period (min) | Chamber Pressure (Torr) | Drying Temp. (°C) | Heating Period (min) | Pausing Period (min) |
|---|---|---|---|---|---|
| −30 | 120 | 760 | 0.17 | −20 | 60 | 120 |
| −10 | 60 | 120 | |||
| 0 | 60 | 300 | |||
| 10 | 60 | 120 |
| Water Level (mm) | Items | Watering Point | Freezing Point | Phase Change End | Drying End |
|---|---|---|---|---|---|
| 5 | TimeTemp (min) | 3.0 | 16.3 | 24.4 | N/A |
| TimeUT (min) | 3.0 | 15.8 | 20.6 | 329.8 | |
| Temperature (°C) | 29.8 | −2.8 | −10.8 | N/A | |
| 10 | TimeTemp (min) | 3.0 | 14.0 | 28.9 | N/A |
| TimeUT (min) | 3.0 | 13.7 | 27.1 | 526.7 | |
| Temperature (°C) | 30.4 | −2.4 | −14.9 | N/A | |
| 15 | TimeTemp (min) | 3.0 | 19.2 | 46.7 | N/A |
| TimeUT (min) | 3.0 | 19.5 | 45.8 | 885.6 | |
| Temperature (°C) | 32.1 | −0.4 | −16.5 | N/A |
© 2019 by the authors. Licensee MDPI, Basel, Switzerland. This article is an open access article distributed under the terms and conditions of the Creative Commons Attribution (CC BY) license (http://creativecommons.org/licenses/by/4.0/).
Share and Cite
Cheng, C.-C.; Tseng, Y.-H.; Huang, S.-C. An Innovative Ultrasonic Apparatus and Technology for Diagnosis of Freeze-Drying Process. Sensors 2019, 19, 2181. https://doi.org/10.3390/s19092181
Cheng C-C, Tseng Y-H, Huang S-C. An Innovative Ultrasonic Apparatus and Technology for Diagnosis of Freeze-Drying Process. Sensors. 2019; 19(9):2181. https://doi.org/10.3390/s19092181
Chicago/Turabian StyleCheng, Chin-Chi, Yen-Hsiang Tseng, and Shih-Chang Huang. 2019. "An Innovative Ultrasonic Apparatus and Technology for Diagnosis of Freeze-Drying Process" Sensors 19, no. 9: 2181. https://doi.org/10.3390/s19092181
APA StyleCheng, C.-C., Tseng, Y.-H., & Huang, S.-C. (2019). An Innovative Ultrasonic Apparatus and Technology for Diagnosis of Freeze-Drying Process. Sensors, 19(9), 2181. https://doi.org/10.3390/s19092181