Experimental Evaluation of UWB Indoor Positioning for Indoor Track Cycling

 , , , , and
Abstract
:1. Introduction
- The field evaluation of received power (RP) level, accuracy, number of line-of-sight (LOS) anchors, and the open area communication range for different tag positions on bike and cyclist, considering different postures, different anchor heights, and the comfort of the cyclist.
- Evaluation of the energy consumption of the utilized hardware.
- All measured data and results were made publicly available [8].
2. Related Work
2.1. Accurate Localization in Sports
2.2. Ultra-Wideband Localization
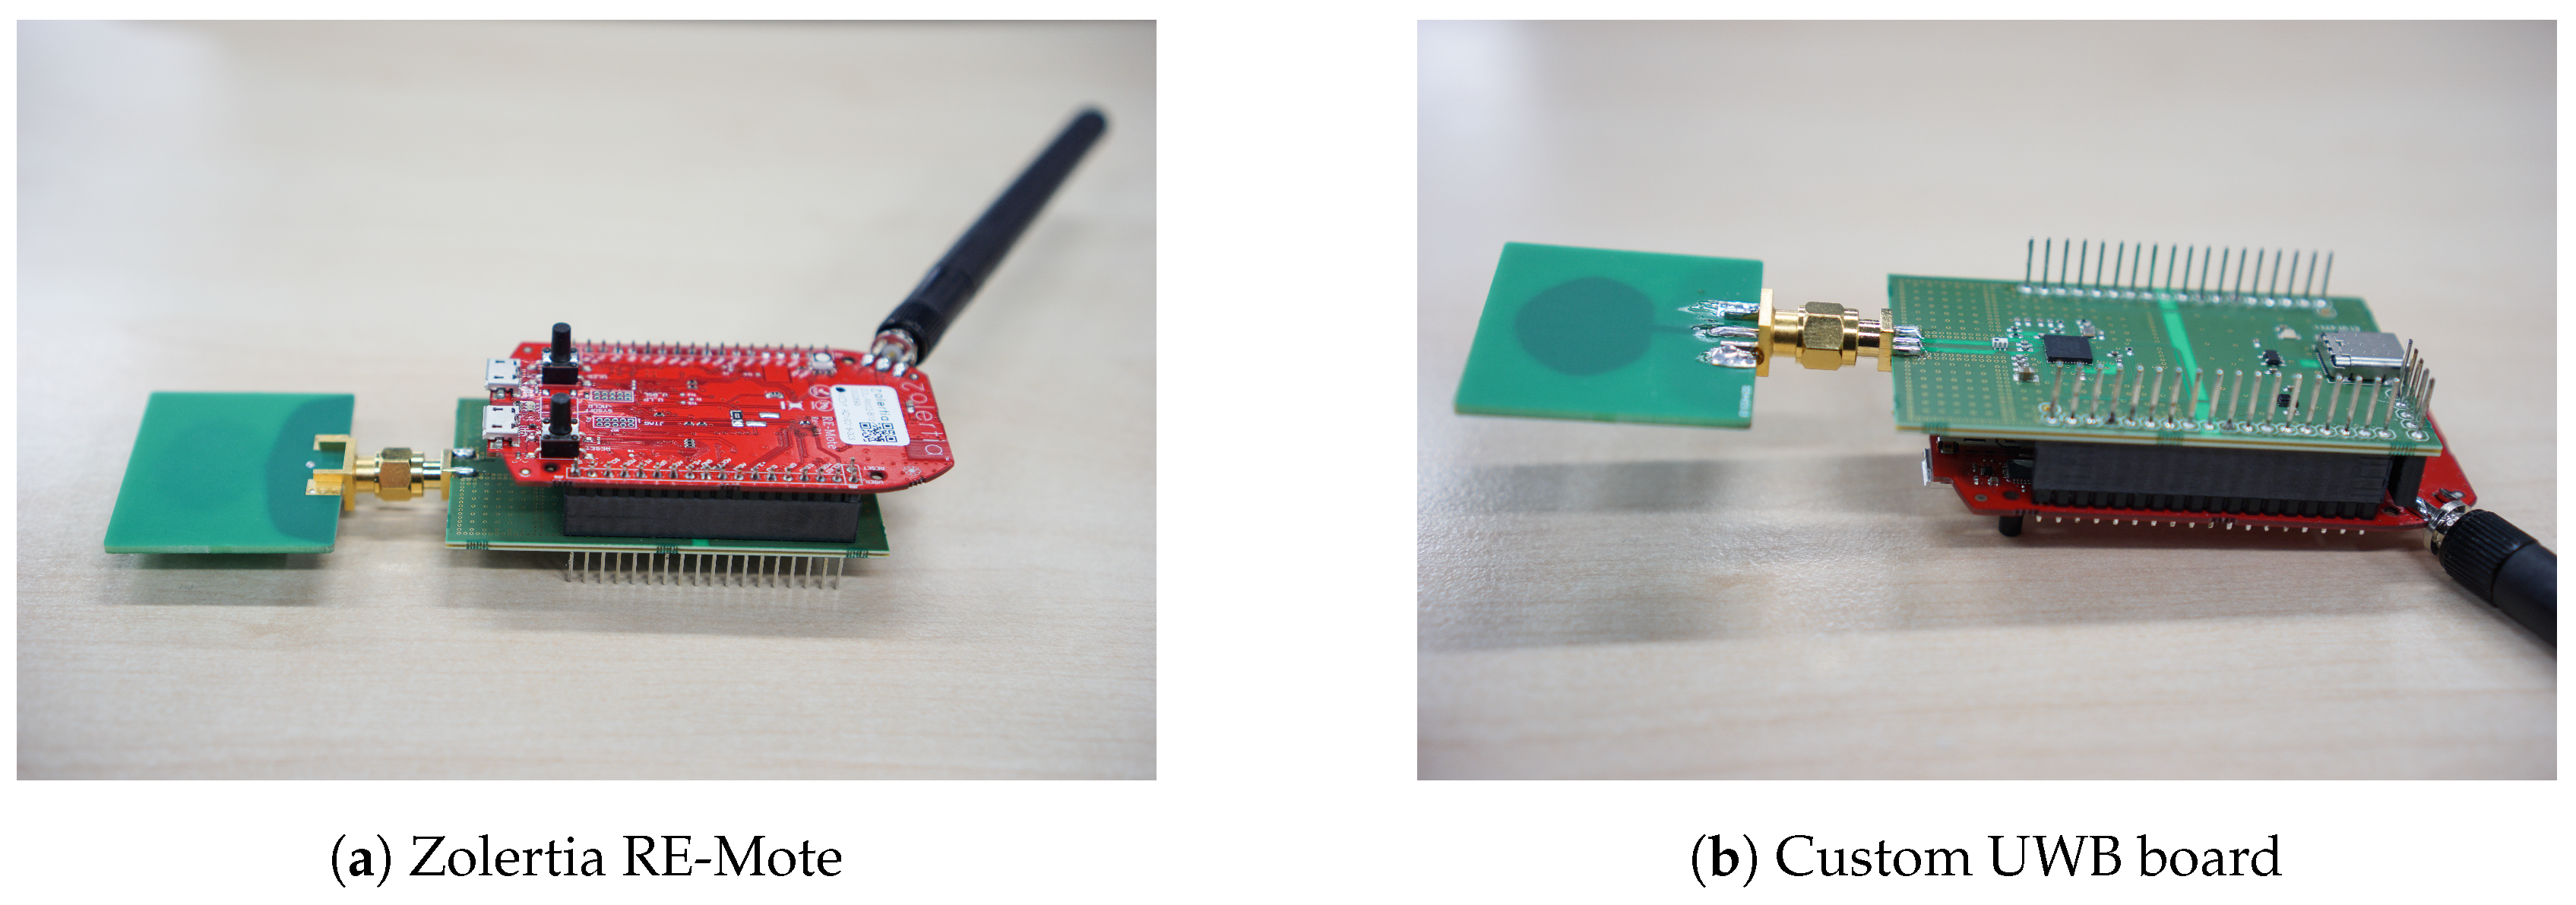
3. Hardware
3.1. Wi-Pos System
3.2. UWB Antenna
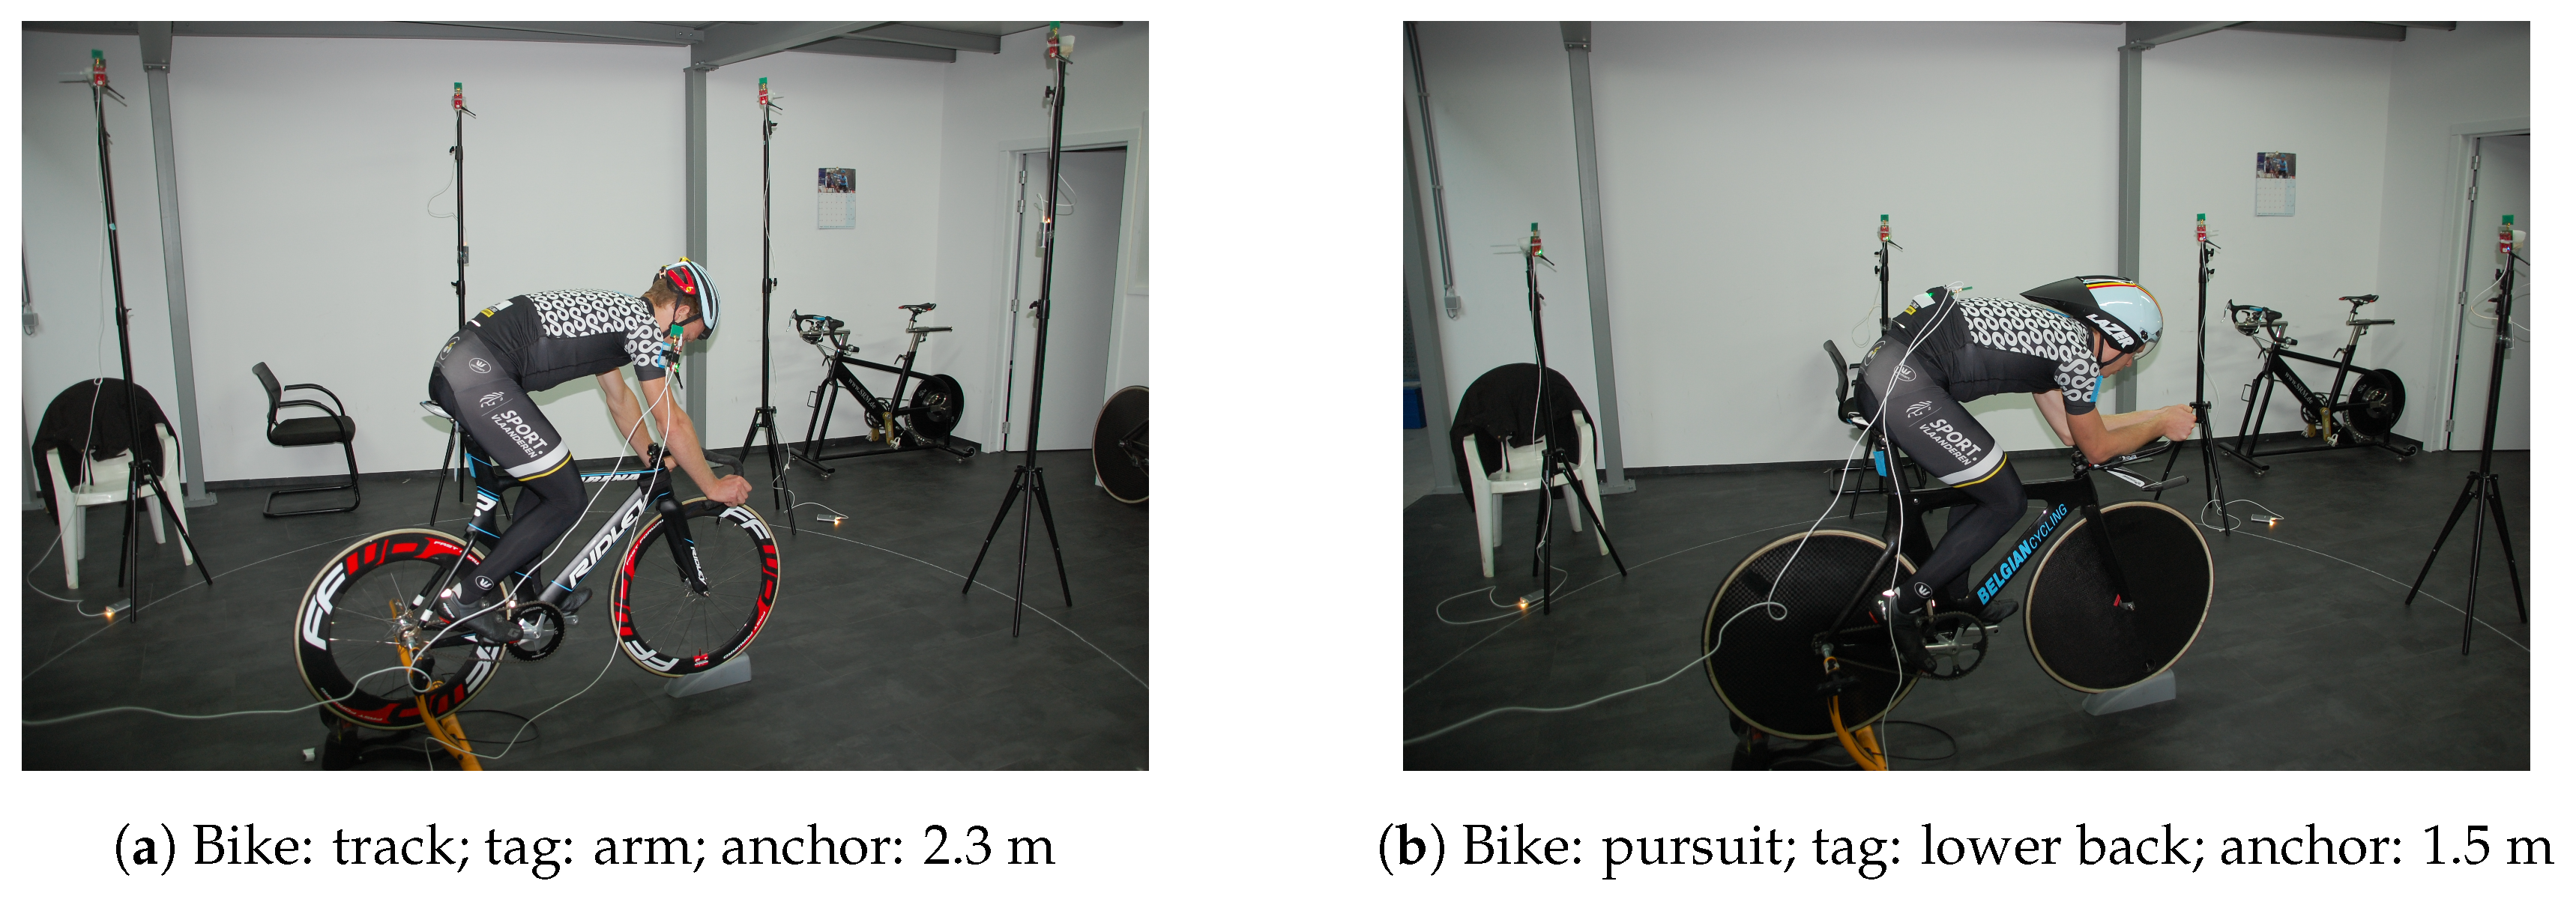
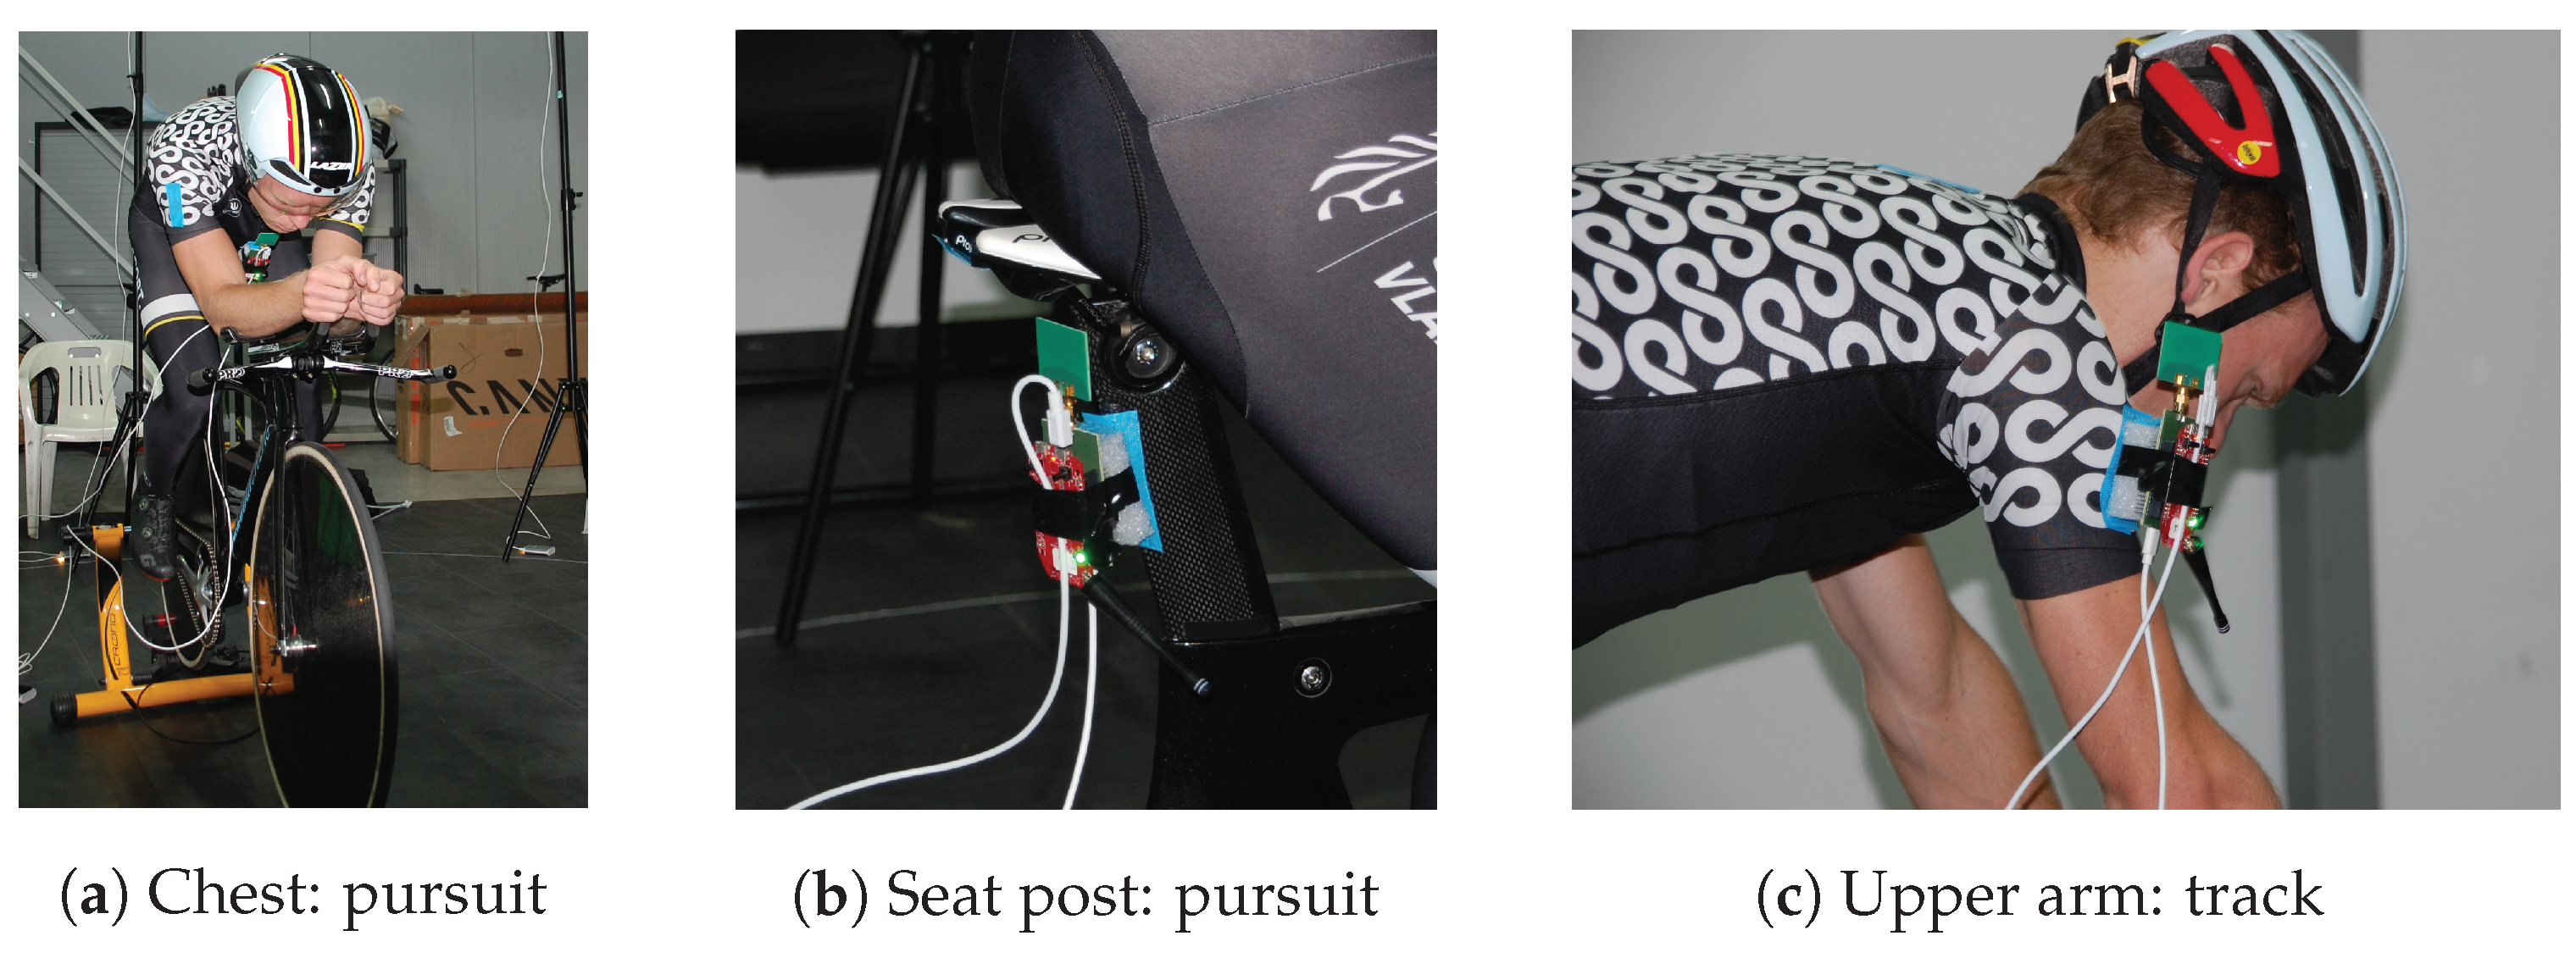
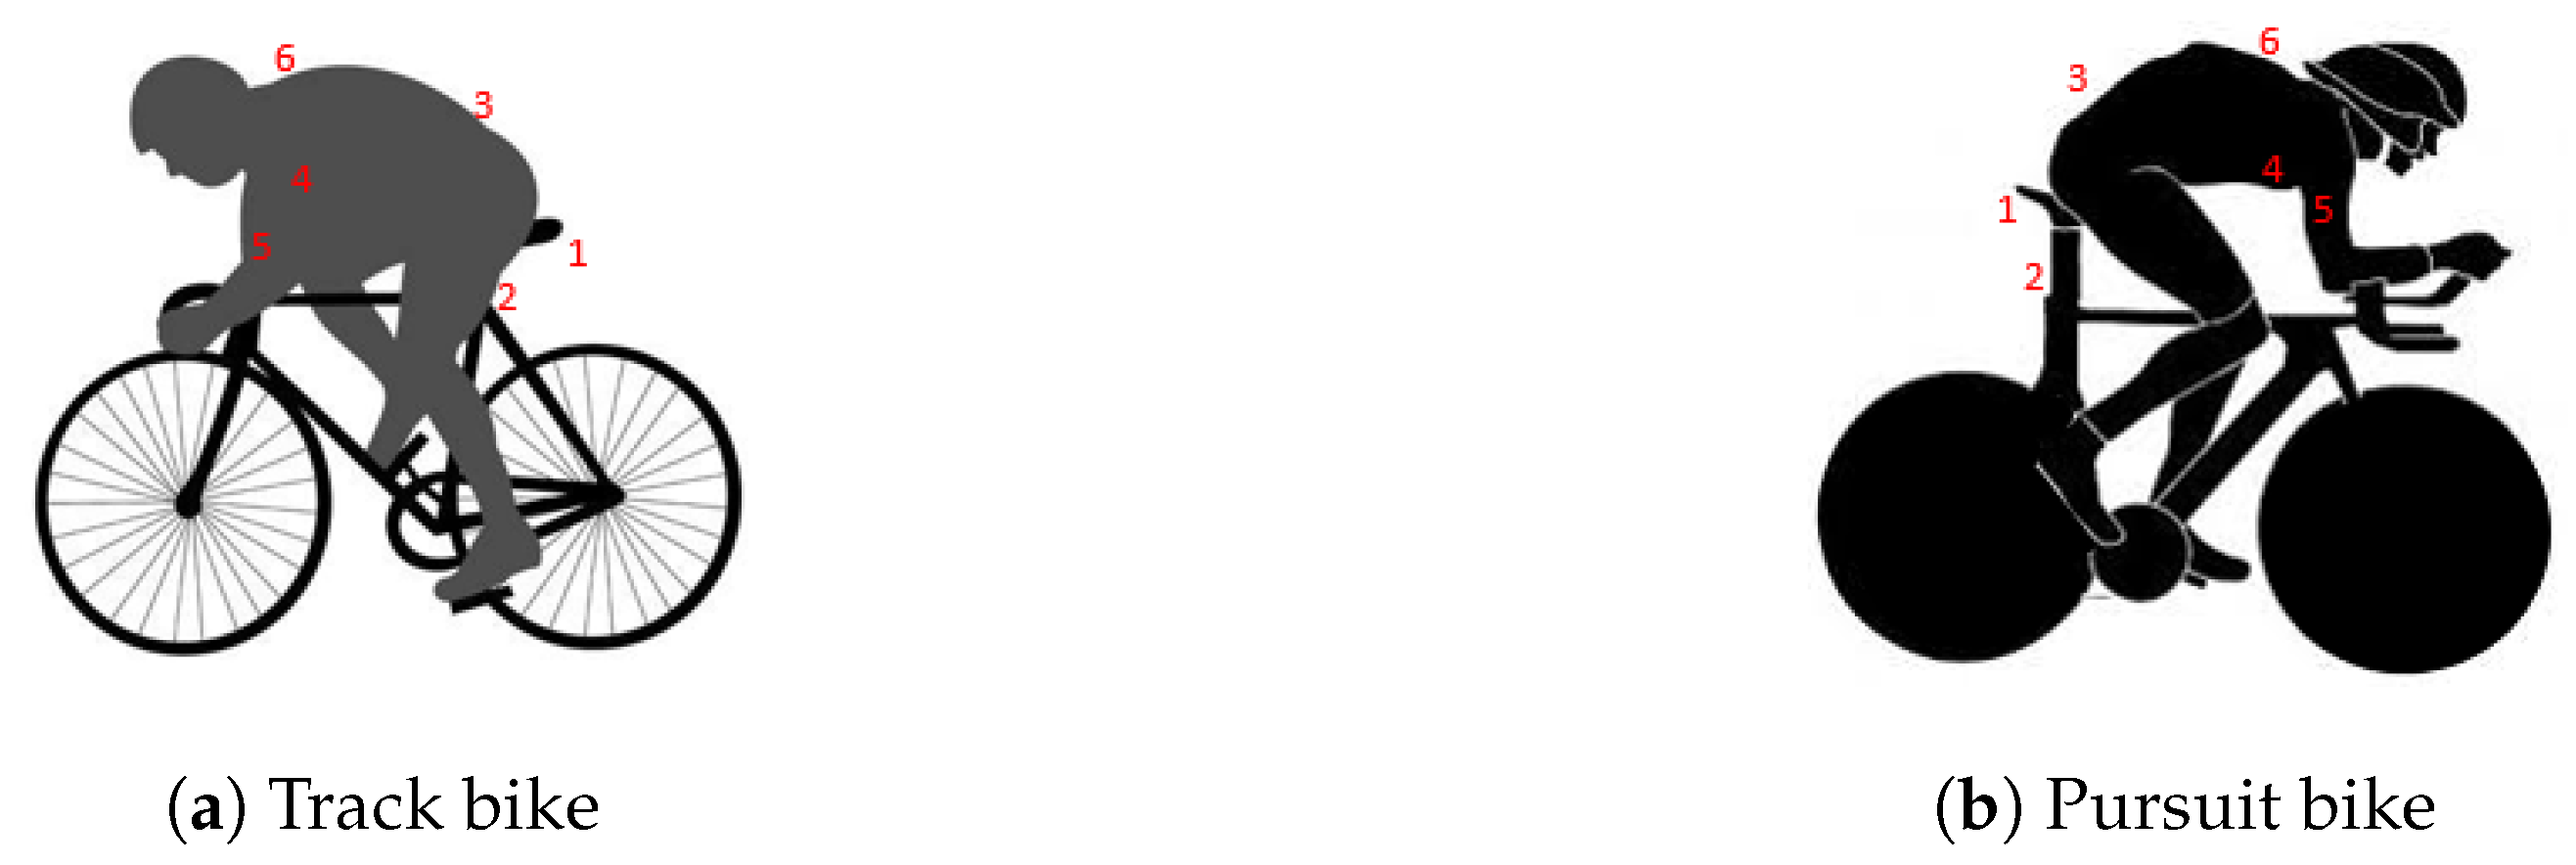
4. Test Setup
- Underneath the saddle
- Seat post
- Lower back
- Chest
- Upper arm
- Upper back
5. Evaluation
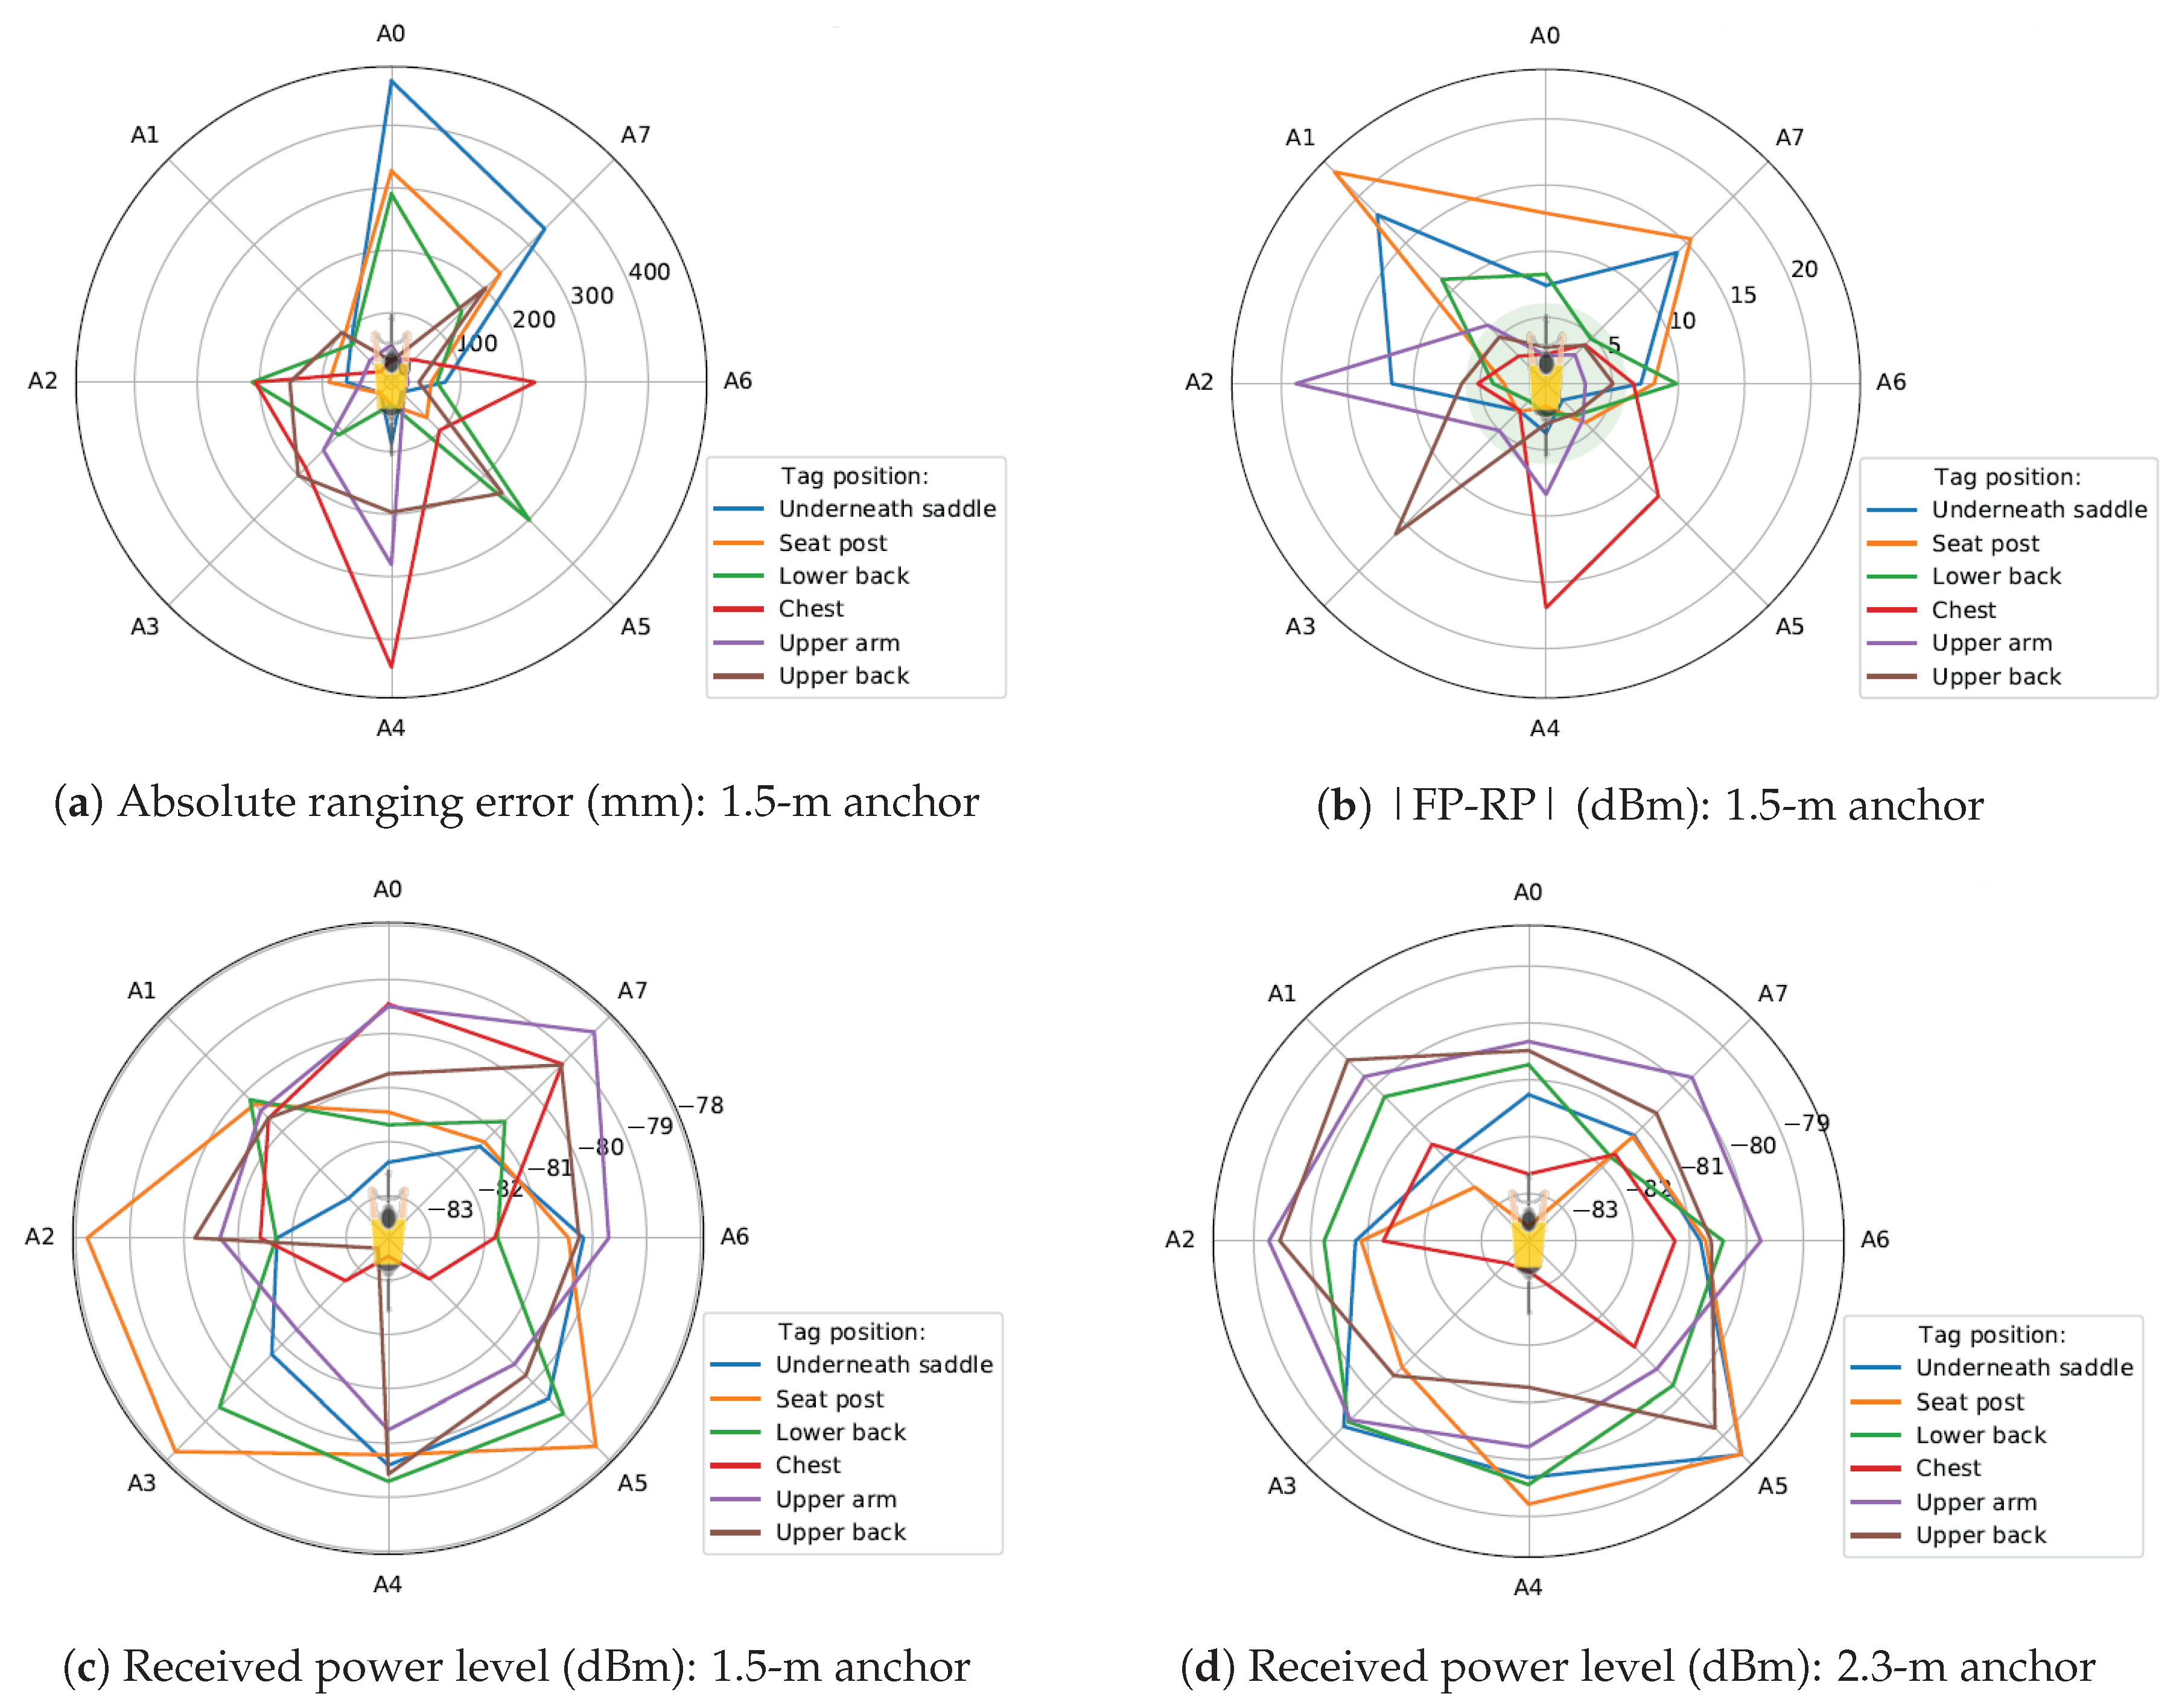
5.1. Accuracy
5.1.1. Absolute Ranging Error
5.1.2. Cumulative Distribution Function of the Ranging Error
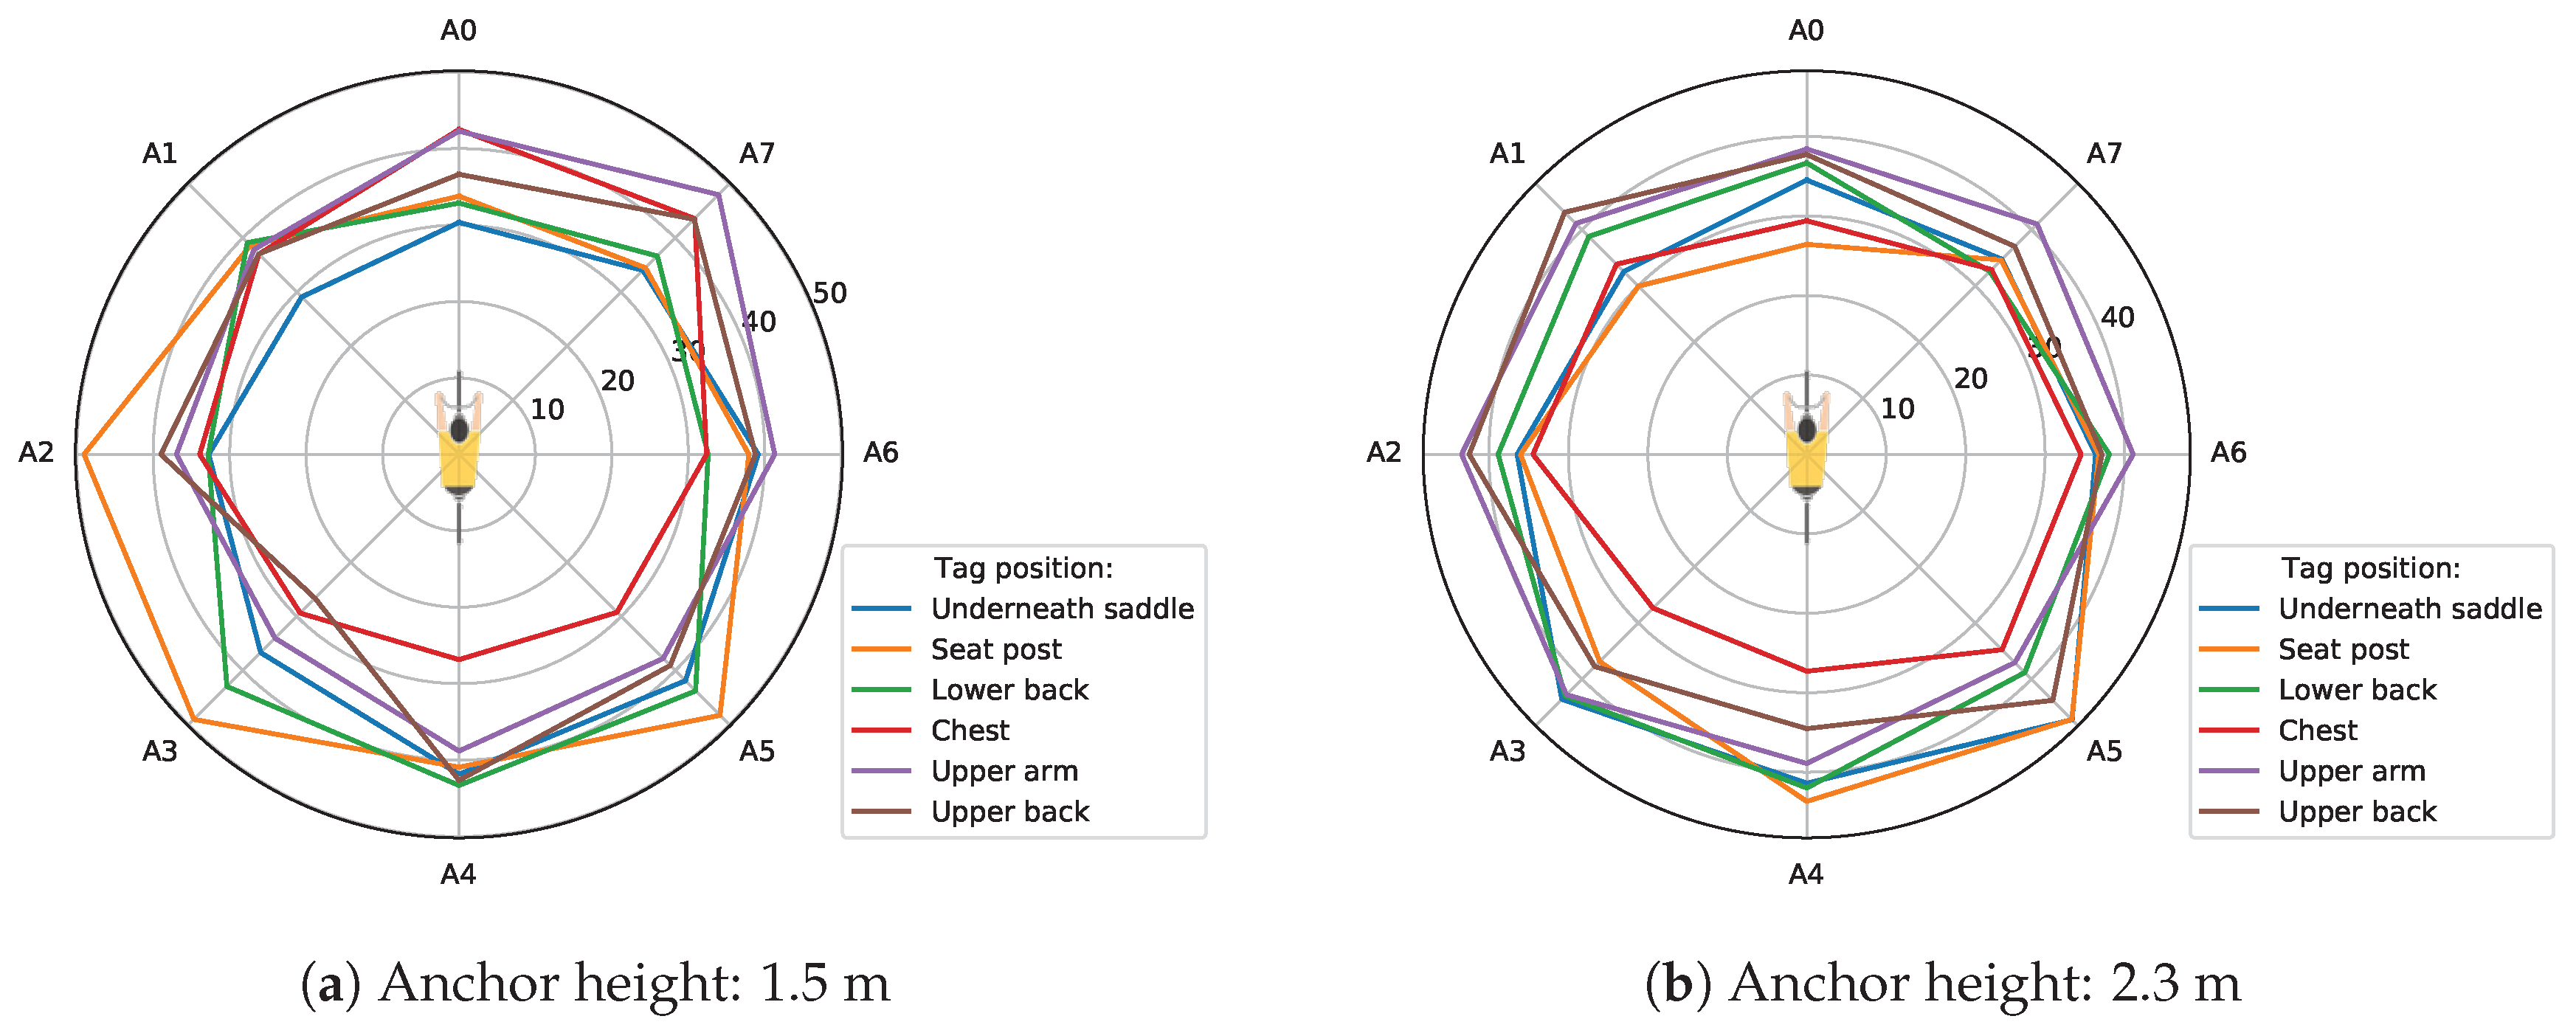
5.2. Received Power Level
5.3. Line-of-Sight Detection
If the absolute value of the difference between the first path power (FP) level and the received power (RP) level was smaller than or equal to 6 dBm, the anchor was likely to be in the line-of-sight (LOS). If this value was greater or equal to 10 dBm, the anchor node was likely to be in the non-line-of-sight (NLOS). If the difference lied between 6 and 10 dBm, we did not know if the anchor was LOS or NLOS.
5.4. Comfort
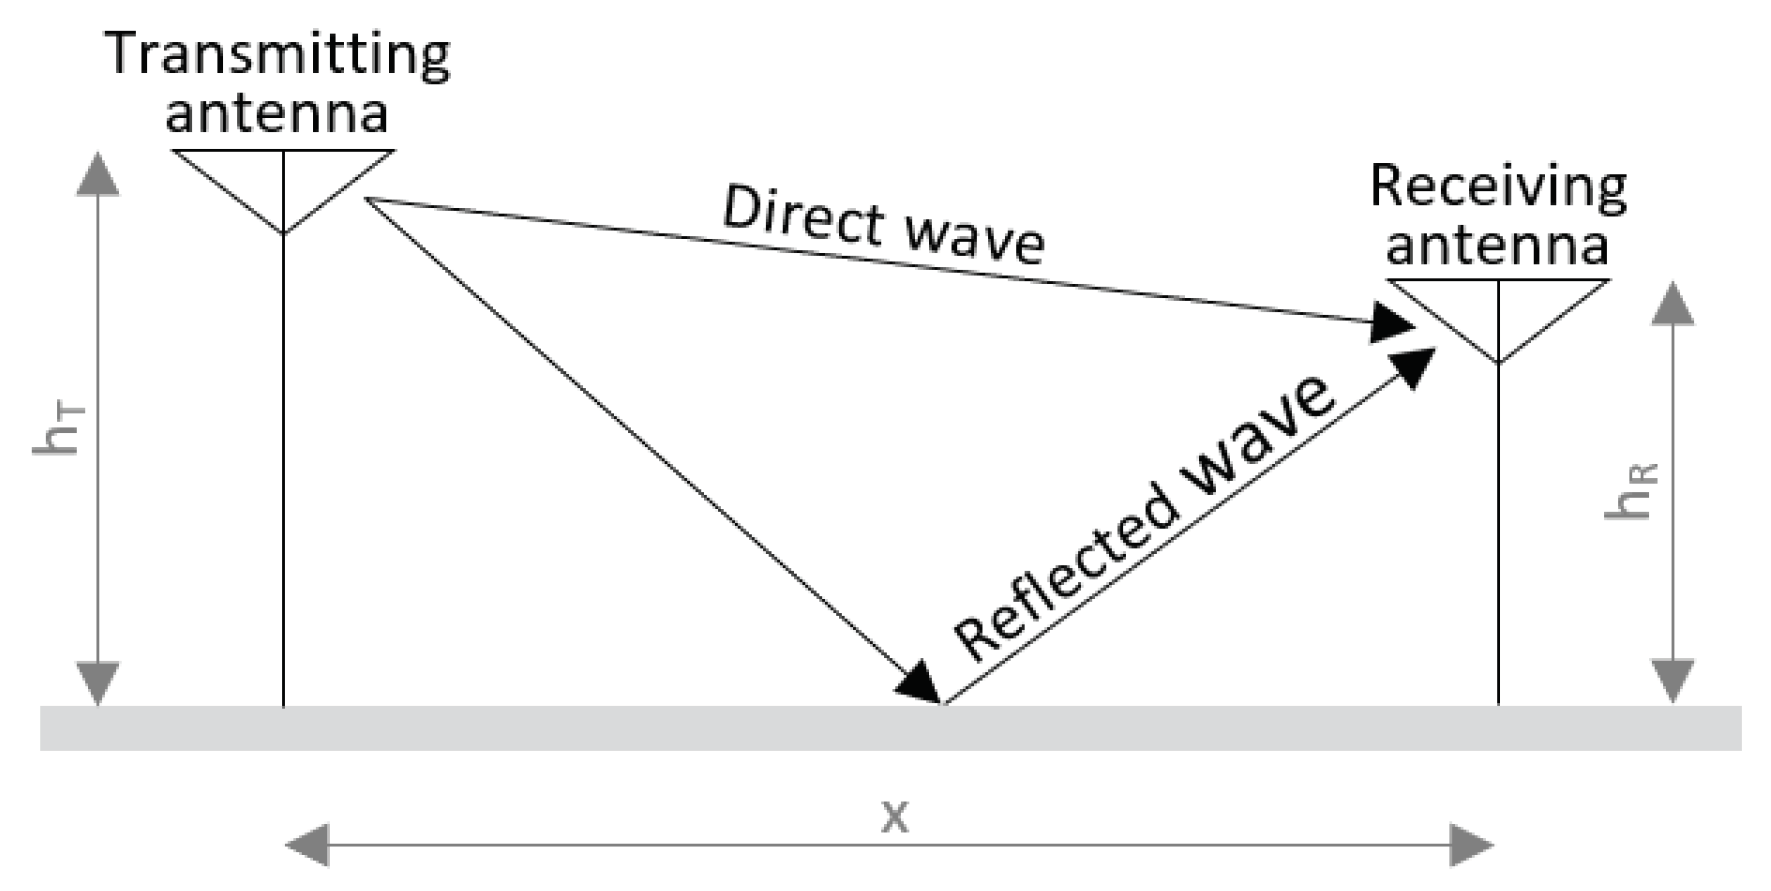
5.5. Maximum Communication Range
- transmitted power in dBm
- received power in dBm
- path loss at reference distance in dB
- path loss exponent
- distance in m,
- reference distance in m
- shadowing term ∼
5.6. Energy Consumption
5.7. Summary of the Main Results
6. Future Work
7. Conclusions
Author Contributions
Funding
Conflicts of Interest
References
- Leser, R.; Baca, A.; Ogris, G. Local Positioning Systems in (Game) Sports. Sensors 2011, 11, 9778–9797. [Google Scholar] [CrossRef] [PubMed]
- Gharghan, S.K.; Nordin, R.; Ismail, M. A wireless sensor network with soft computing localization techniques for track cycling applications. Sensors 2016, 16, 1043. [Google Scholar] [CrossRef] [PubMed]
- Gharghan, S.K.; Nordin, R.; Ismail, M.; Ali, J.A. Accurate Wireless Sensor Localization Technique Based on Hybrid PSO-ANN Algorithm for Indoor and Outdoor Track Cycling. IEEE Sens. J. 2016, 16, 529–541. [Google Scholar] [CrossRef]
- Liang, J.; Godsill, S. A Particle Filter Localisation System for Indoor Track Cycling Using an Intrinsic Coordinate Model. In Proceedings of the 2018 21st International Conference on Information Fusion (FUSION), Cambridge, UK, 10–13 July 2018; pp. 1896–1903. [Google Scholar]
- Ullah, S.; Ali, M.; Hussain, A.; Kwak, K. Applications of UWB Technology. arXiv 2009, arXiv:0911.1681. [Google Scholar]
- Allen, B.; Brown, T.; Schwieger, K.; Zimmermann, E.; Edwards, D.; Ouvry, L.; Oppermann, I. Ultra wideband: Applications, technology and future perspectives. In Proceedings of the International Workshop on Convergent Technologies (IWCT), Oulu, Finland, 6–10 June 2005. [Google Scholar]
- Alarifi, A.; Al-Salman, A.; Alsaleh, M.; Alnafessah, A.; Al-Hadhrami, S.; Al-Ammar, M.A.; Al-Khalifa, H.S. Ultra wideband indoor positioning technologies: Analysis and recent advances. Sensors 2016, 16, 707. [Google Scholar] [CrossRef] [PubMed]
- Related Data Set. Available online: http://dx.doi.org/10.17632/fkhfjfspkr.1 (accessed on 30 April 2019).
- MyLaps. Available online: https://www.mylaps.com/ (accessed on 2 October 2018).
- MyLaps Sporthive. Available online: https://sporthive.com/practice (accessed on 2 October 2018).
- Ridolfi, M.; Vandermeeren, S.; Defraye, J.; Steendam, H.; Gerlo, J.; De Clercq, D.; Hoebeke, J.; De Poorter, E. Experimental evaluation of UWB indoor positioning for sport postures. Sensors 2018, 18, 168. [Google Scholar] [CrossRef] [PubMed]
- Perrat, B.; Smith, M.J.; Mason, B.S.; Rhodes, J.M.; Goosey-Tolfrey, V.L. Quality assessment of an Ultra-Wide Band positioning system for indoor wheelchair court sports. Proc. Inst. Mech. Eng. Part P J. Sports Eng. Technol. 2015, 229, 81–91. [Google Scholar] [CrossRef]
- Serpiello, F.; Hopkins, W.; Barnes, S.; Tavrou, J.; Duthie, G.; Aughey, R.; Ball, K. Validity of an ultra-wideband local positioning system to measure locomotion in indoor sports. J. Sports Sci. 2018, 36, 1727–1733. [Google Scholar] [CrossRef] [PubMed]
- Mucchi, L.; Trippi, F.; Carpini, A. Ultra Wide Band real-time location system for cinematic survey in sports. In Proceedings of the 2010 3rd International Symposium on Applied Sciences in Biomedical and Communication Technologies (ISABEL), Rome, Italy, 7–10 November 2010; pp. 1–6. [Google Scholar]
- Hoppe, M.W.; Baumgart, C.; Polglaze, T.; Freiwald, J. Validity and reliability of GPS and LPS for measuring distances covered and sprint mechanical properties in team sports. PLoS ONE 2018, 13, e0192708. [Google Scholar] [CrossRef] [PubMed]
- Figueira, B.; Gonçalves, B.; Folgado, H.; Masiulis, N.; Calleja-González, J.; Sampaio, J. Accuracy of a Basketball Indoor Tracking System Based on Standard Bluetooth Low Energy Channels (NBN23®). Sensors 2018, 18, 1940. [Google Scholar] [CrossRef] [PubMed]
- Van der Kruk, E.; Reijne, M. Accuracy of human motion capture systems for sport applications; state-of-the-art review. Eur. J. Sport Sci. 2018, 18, 1–14. [Google Scholar] [CrossRef] [PubMed]
- Spörri, J.; Schiefermüller, C.; Müller, E. Collecting kinematic data on a ski track with optoelectronic stereophotogrammetry: A methodological study assessing the feasibility of bringing the biomechanics lab to the field. PLoS ONE 2016, 11, e0161757. [Google Scholar] [CrossRef] [PubMed]
- Maalek, R.; Sadeghpour, F. Accuracy assessment of ultra-wide band technology in locating dynamic resources in indoor scenarios. Autom. Construct. 2016, 63, 12–26. [Google Scholar] [CrossRef]
- Sato, S.; Kobayashi, T. Path-loss exponents of ultra wideband signals in line-of-sight environments. In Proceedings of the Eighth IEEE International Symposium on Spread Spectrum Techniques and Applications—Programme and Book of Abstracts (IEEE Cat. No. 04TH8738), Sydney, NSW, Australia, 30 August–2 September 2004; pp. 488–492. [Google Scholar] [CrossRef]
- Muqaibel, A.; Safaai-Jazi, A.; Attiya, A.; Woerner, B.; Riad, S. Path-loss and time dispersion parameters for indoor UWB propagation. IEEE Trans. Wirel. Commun. 2006, 5, 550–559. [Google Scholar] [CrossRef]
- Großwindhager, B.; Boano, C.A.; Rath, M.; Römer, K. Enabling runtime adaptation of physical layer settings for dependable uwb communications. In Proceedings of the 2018 IEEE 19th International Symposium on “A World of Wireless, Mobile and Multimedia Networks” (WoWMoM), Chania, Greece, 12–15 June 2018; pp. 1–11. [Google Scholar]
- Zolertia RE-MOTE. Available online: http://zolertia.io/product/hardware/re-mote (accessed on 25 October 2018).
- Van Herbruggen, B.; Jooris, B.; Rossey, J.; Ridolfi, M.; Macoir, N.; Van den Brande, Q.; Lemey, S.; De Poorter, E. Wi-PoS: A Low-Cost, Open Source Ultra-Wideband (UWB) Hardware Platform with Long Range Sub-GHz Backbone. Sensors 2019, 19, 1548. [Google Scholar] [CrossRef] [PubMed]
- Decawave Reference Planar Monopole Antenna. Available online: https://decaforum.decawave.com/uploads/default/original/1X/06a20e5883f93f45e40abb49cf1986d44484736a.pdf (accessed on 30 April 2019).
- Isola. High Performance Laminate and Prepreg. Available online: https://www.isola-group.com/products/all-printed-circuit-materials/is400/ (accessed on 30 April 2019).
- IEEE Standard. IEEE Standard for Information technology—Local and metropolitan area networks—Specific requirements—Part 15.4: Wireless Medium Access Control (MAC) and Physical Layer (PHY) Specifications for Low-Rate Wireless Personal Area Networks (WPANs): Amendment 1: Add Alternate PHYs. In IEEE Std 802.15.4a-2007 (Amendment to IEEE Std 802.15.4-2006); IEEE: Piscataway, NJ, USA, 2007; pp. 1–210. [Google Scholar]
- Van den Brande, Q.; Lemey, S.; Vanfleteren, J.; Rogier, H. Highly Efficient Impulse-Radio Ultra-Wideband Cavity-Backed Slot Antenna in Stacked Air-Filled Substrate Integrated Waveguide Technology. IEEE Trans. Antennas Propag. 2018, 66, 2199–2209. [Google Scholar] [CrossRef]
- Kumpuniemi, T.; Hämäläinen, M.; Yekeh Yazdandoost, K.; Iinatti, J. Human Body Shadowing Effect on Dynamic UWB On-Body Radio Channels. IEEE Antennas Wirel. Propag. Lett. 2017, 16, 1871–1874. [Google Scholar] [CrossRef]
- Decawave DW1000 User Manual. Available online: https://www.decawave.com/dw1000/usermanual/ (accessed on 16 November 2018).
- Decawave DW1000 Datasheet. Available online: https://www.decawave.com/dw1000/datasheet/ (accessed on 2 December 2018).
- Transmit Power Calibration & Management. Available online: https://www.decawave.com/application-notes/ (accessed on 14 November 2018).
- Macoir, N.; Bauwens, J.; Jooris, B.; Van Herbruggen, B.; Rossey, J.; Hoebeke, J.; De Poorter, E. UWB Localization with Battery-Powered Wireless Backbone for Drone-Based Inventory Management. Sensors 2019, 19, 467. [Google Scholar] [CrossRef] [PubMed]
- Texas Instruments. CC1200 Low Power, High Performance RF Transceiver Data Sheet Datasheet (Rev. D). Available online: http://www.ti.com/lit/ds/symlink/cc1200.pdf (accessed on 12 January 2019).


| Parameter | Value |
|---|---|
| Channel | 1 |
| Data rate | 110 kbps |
| Pulse repetition frequency (PRF) | 64 MHz |
| Preamble length | 1024 symbols |
| Measurement | Bike | Anchor Height (m) | Tag Position |
|---|---|---|---|
| 9 | Track | 2.3 | Lower back |
| 12 | Track | 2.3 | Upper back |
| 21 | Pursuit | 2.3 | Lower back |
| Underneath Saddle | Seat Post | Lower Back | Chest | Upper Arm | Upper Back | |
|---|---|---|---|---|---|---|
| Comfort Rating | 5 | 5 | 4 | 2 | 2 | 0 |
| Tag Position | Min. Range | Max. Range | ||
|---|---|---|---|---|
| Range (m) | Anchor | Range (m) | Anchor | |
| Underneath saddle | 29.106 | A1 | 48.549 | A5 |
| Seat post | 26.430 | A0 | 49.038 | A2 |
| Lower back | 32.563 | A7 | 43.758 | A5 |
| Chest | 23.987 | A4 | 43.599 | A7 |
| Upper arm | 33.992 | A4 | 48.437 | A6 |
| Upper back | 26.624 | A3 | 43.773 | A5 |
| Order | Tag Position | Comfort | Ranging Error (mm) | RP Level (dBm) | LOS | Max. Range (m) | ||||
|---|---|---|---|---|---|---|---|---|---|---|
| 50% | 90% | 50% | 90% | 50% | 90% | Min. | Max. | |||
| 1 | Upper back | 0 | 23 | 37 | 6 | 6 | ||||
| 2 | Chest | 2 | 26 | 40 | 5 | 5 | ||||
| 3 | Upper arm | 2 | 49 | 68 | 5 | 5 | ||||
| 4 | Lower back | 4 | 290 | 313 | 5 | 5 | ||||
| 5 | Seat post | 5 | 327 | 360 | 4 | 4 | ||||
| 6 | Underneath saddle | 5 | 471 | 554 | 3 | 3 | ||||
| Order | Tag Position | Comfort | Ranging Error (mm) | RP Level (dBm) | LOS | Max. Range (m) | ||||
|---|---|---|---|---|---|---|---|---|---|---|
| 50% | 90% | 50% | 90% | 50% | 90% | Min. | Max. | |||
| 1 | Upper back | 0 | 43 | 62 | 8 | 8 | ||||
| 2 | Lower back | 4 | 220 | 6 | 6 | |||||
| 3 | Upper arm | 2 | 37 | 61 | 5 | 5 | ||||
| 4 | Underneath saddle | 5 | 151 | 4 | 4 | |||||
| 5 | Seat post | 5 | 805 | 838 | 3 | 3 | ||||
| 6 | Chest | 2 | 431 | 487 | 0 | 0 | ||||
© 2019 by the authors. Licensee MDPI, Basel, Switzerland. This article is an open access article distributed under the terms and conditions of the Creative Commons Attribution (CC BY) license (http://creativecommons.org/licenses/by/4.0/).
Share and Cite
Minne, K.; Macoir, N.; Rossey, J.; Van den Brande, Q.; Lemey, S.; Hoebeke, J.; De Poorter, E. Experimental Evaluation of UWB Indoor Positioning for Indoor Track Cycling. Sensors 2019, 19, 2041. https://doi.org/10.3390/s19092041
Minne K, Macoir N, Rossey J, Van den Brande Q, Lemey S, Hoebeke J, De Poorter E. Experimental Evaluation of UWB Indoor Positioning for Indoor Track Cycling. Sensors. 2019; 19(9):2041. https://doi.org/10.3390/s19092041
Chicago/Turabian StyleMinne, Kevin, Nicola Macoir, Jen Rossey, Quinten Van den Brande, Sam Lemey, Jeroen Hoebeke, and Eli De Poorter. 2019. "Experimental Evaluation of UWB Indoor Positioning for Indoor Track Cycling" Sensors 19, no. 9: 2041. https://doi.org/10.3390/s19092041
APA StyleMinne, K., Macoir, N., Rossey, J., Van den Brande, Q., Lemey, S., Hoebeke, J., & De Poorter, E. (2019). Experimental Evaluation of UWB Indoor Positioning for Indoor Track Cycling. Sensors, 19(9), 2041. https://doi.org/10.3390/s19092041