Identification of Vibration Events in Rotating Blades Using a Fiber Optical Tip Timing Sensor


Abstract
1. Introduction
2. Methodology
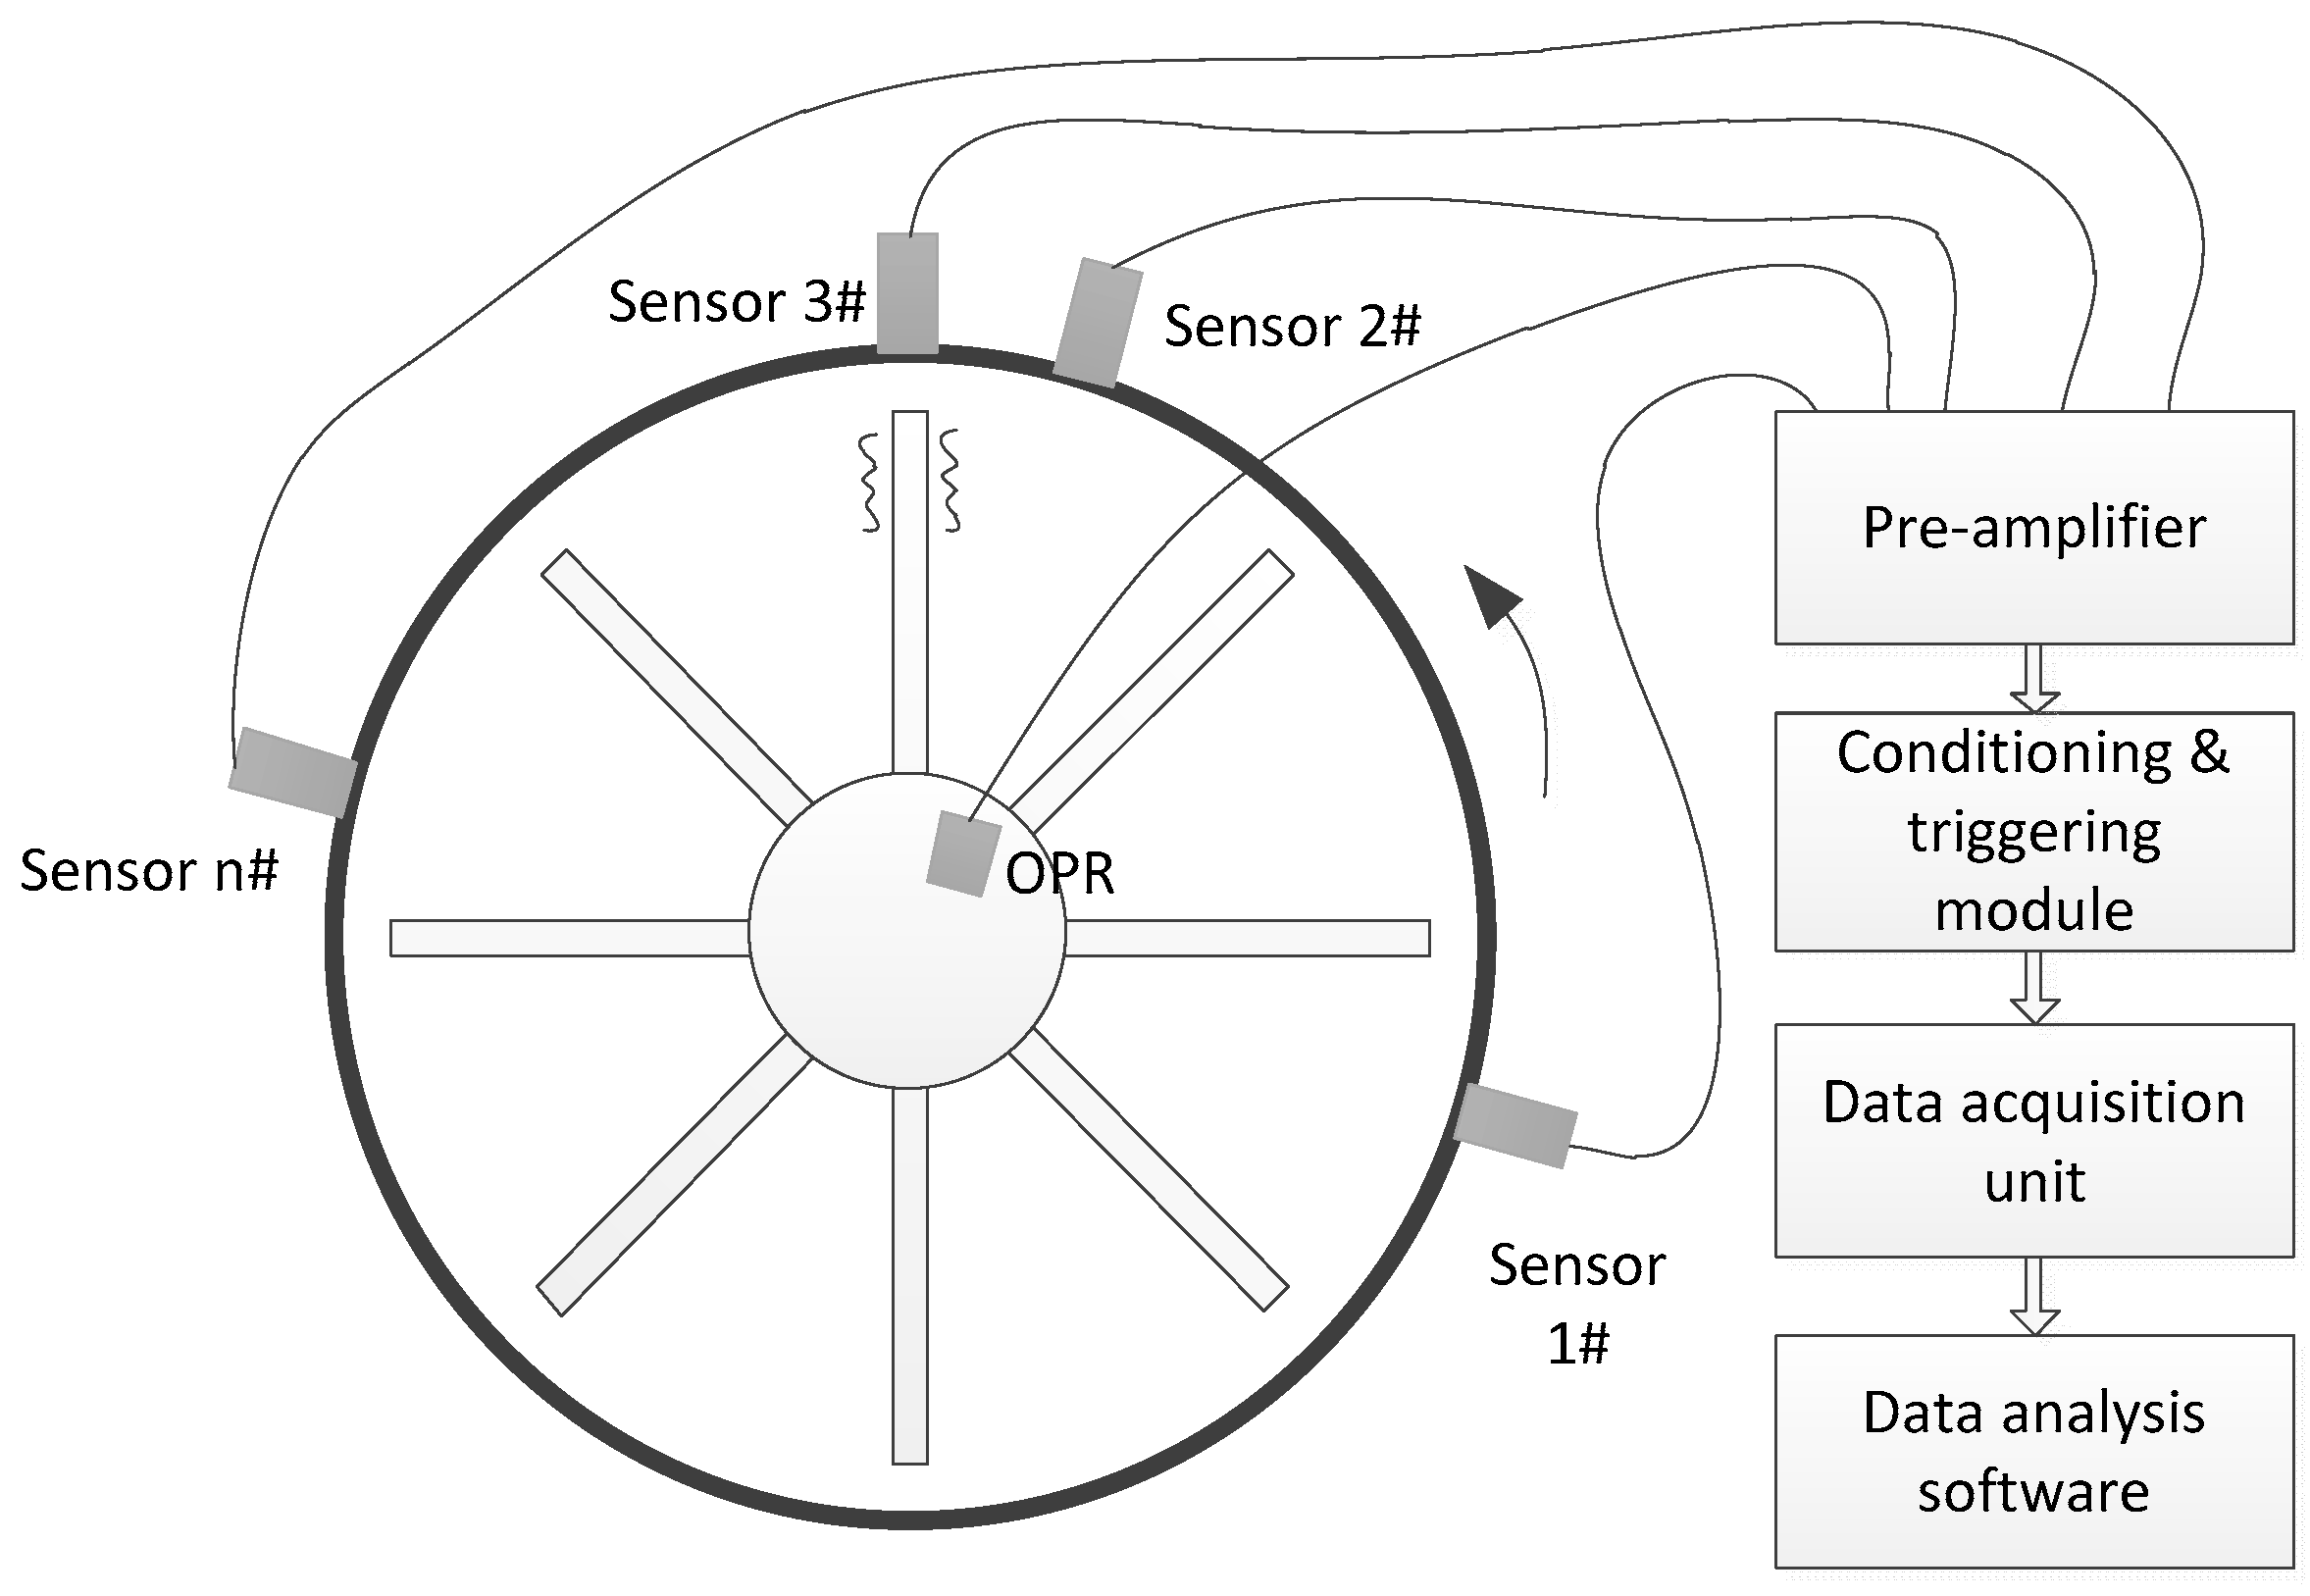
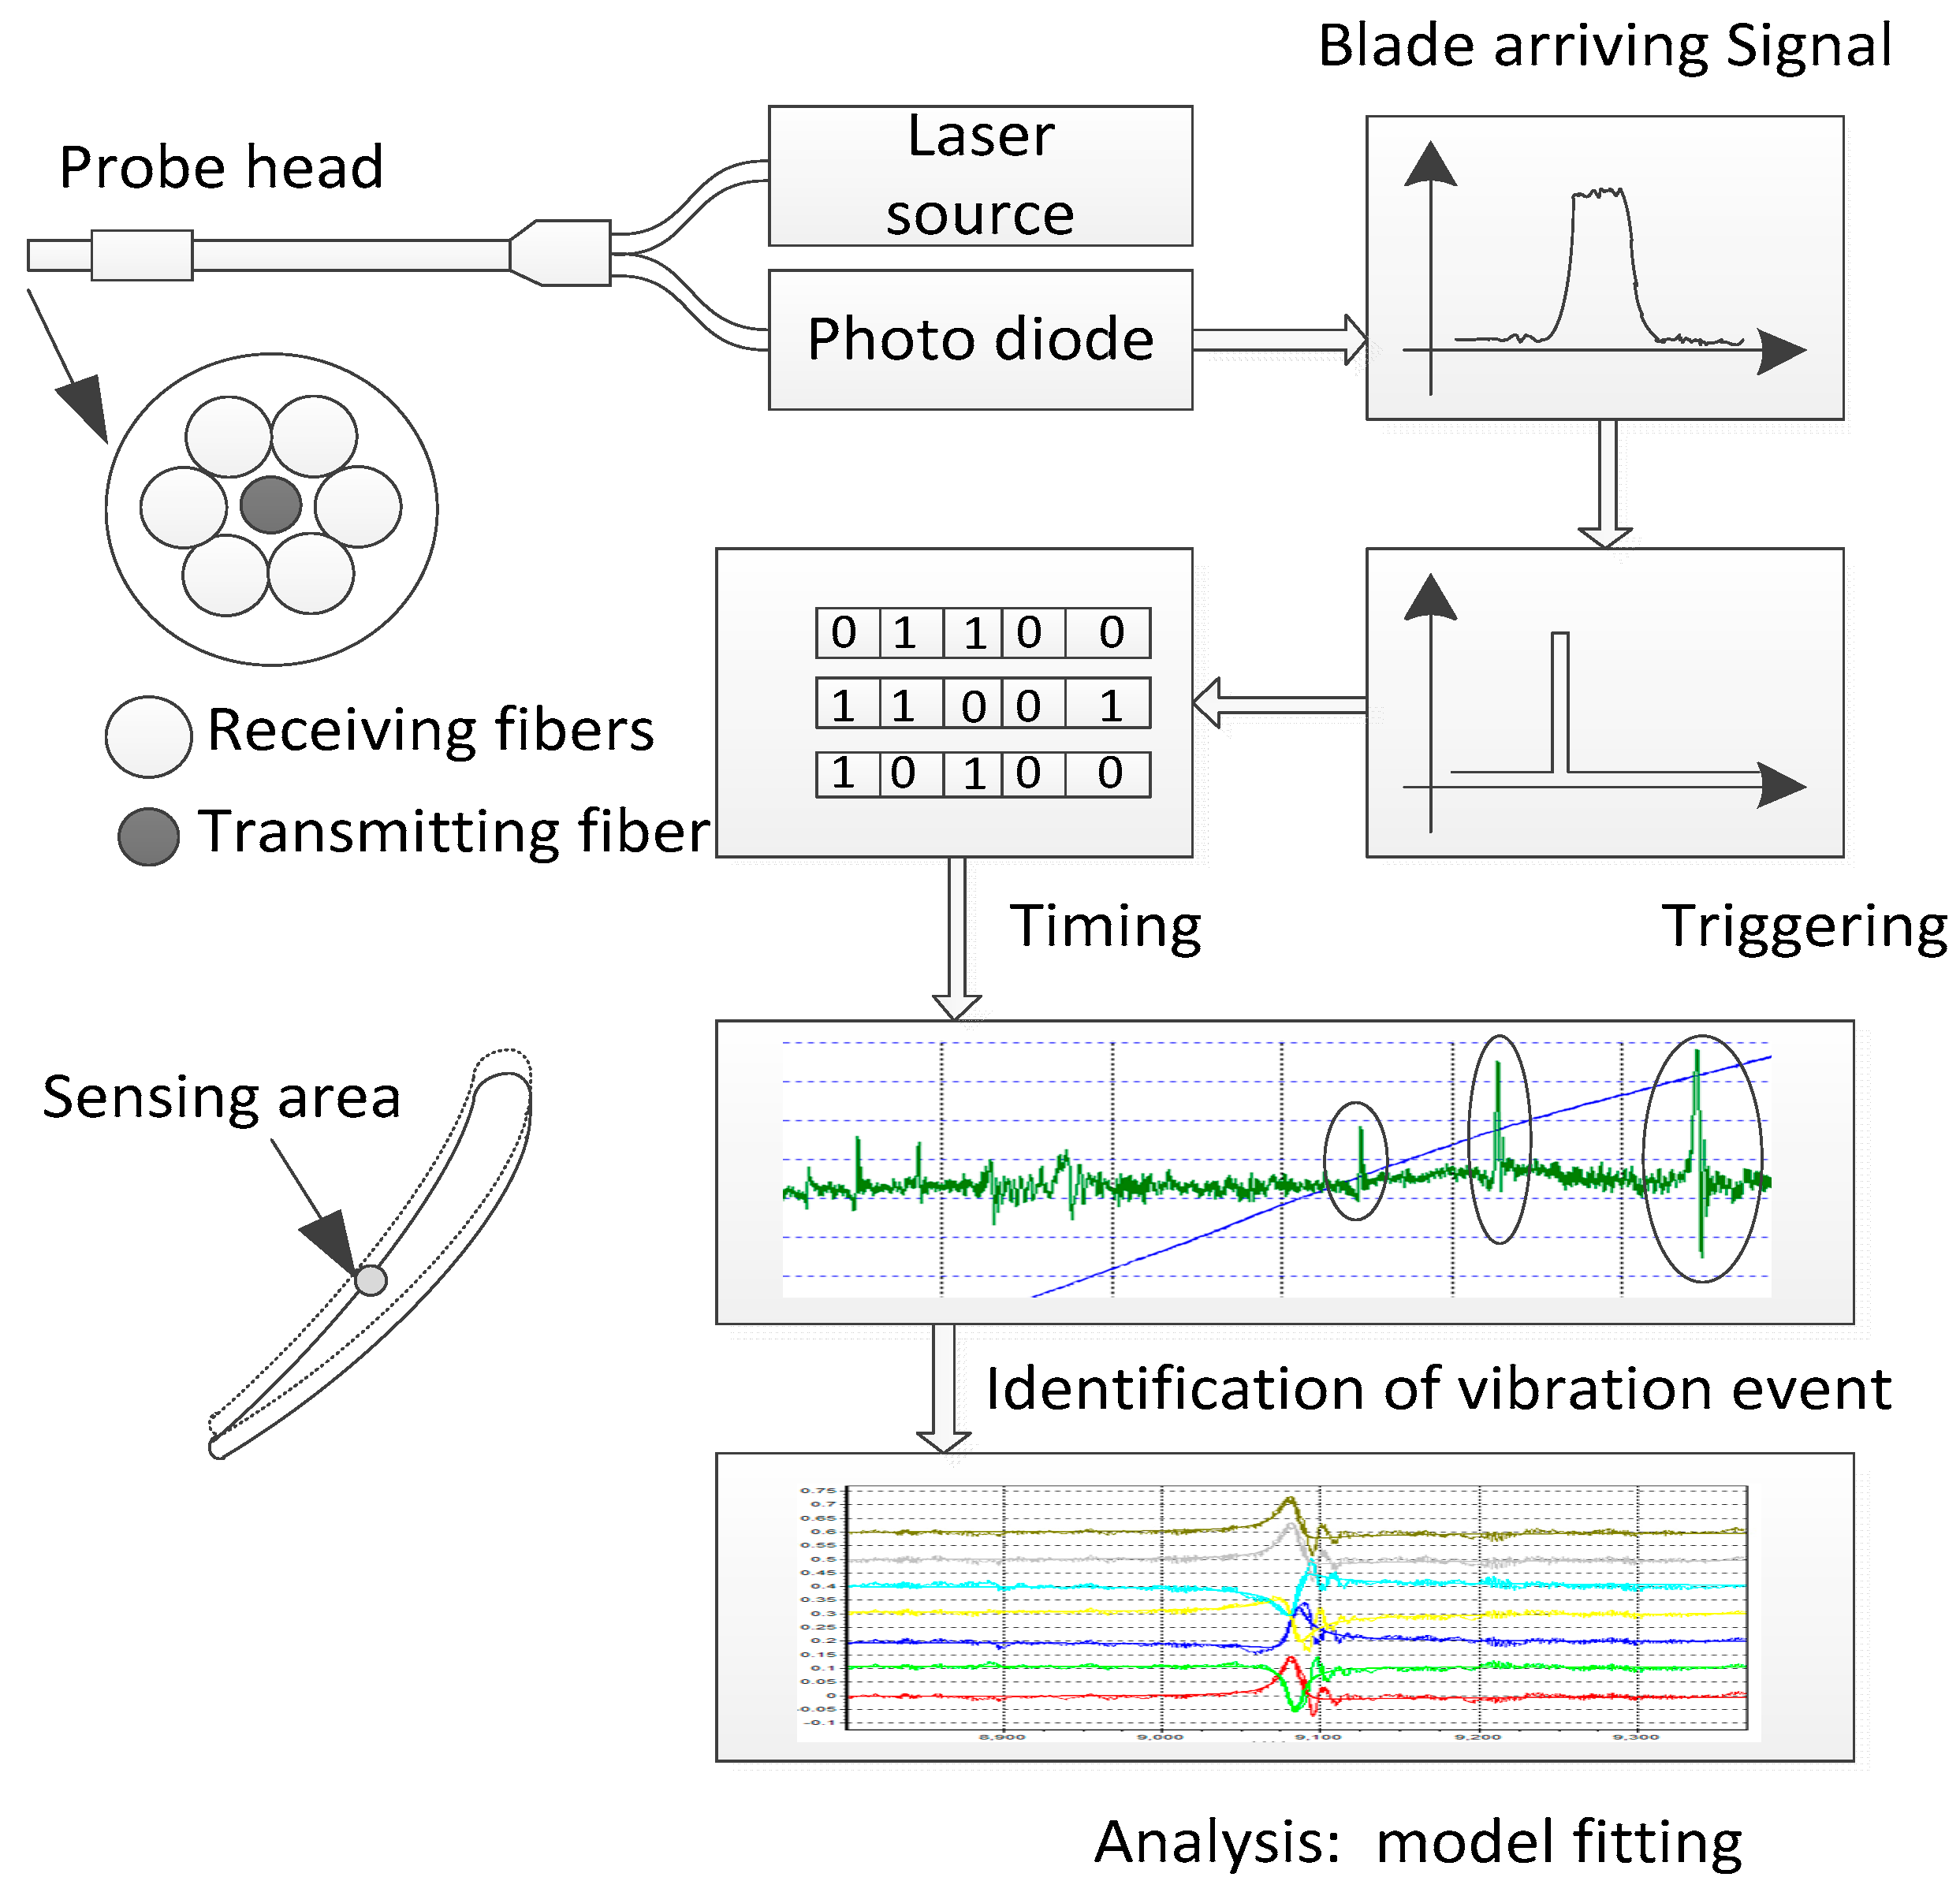
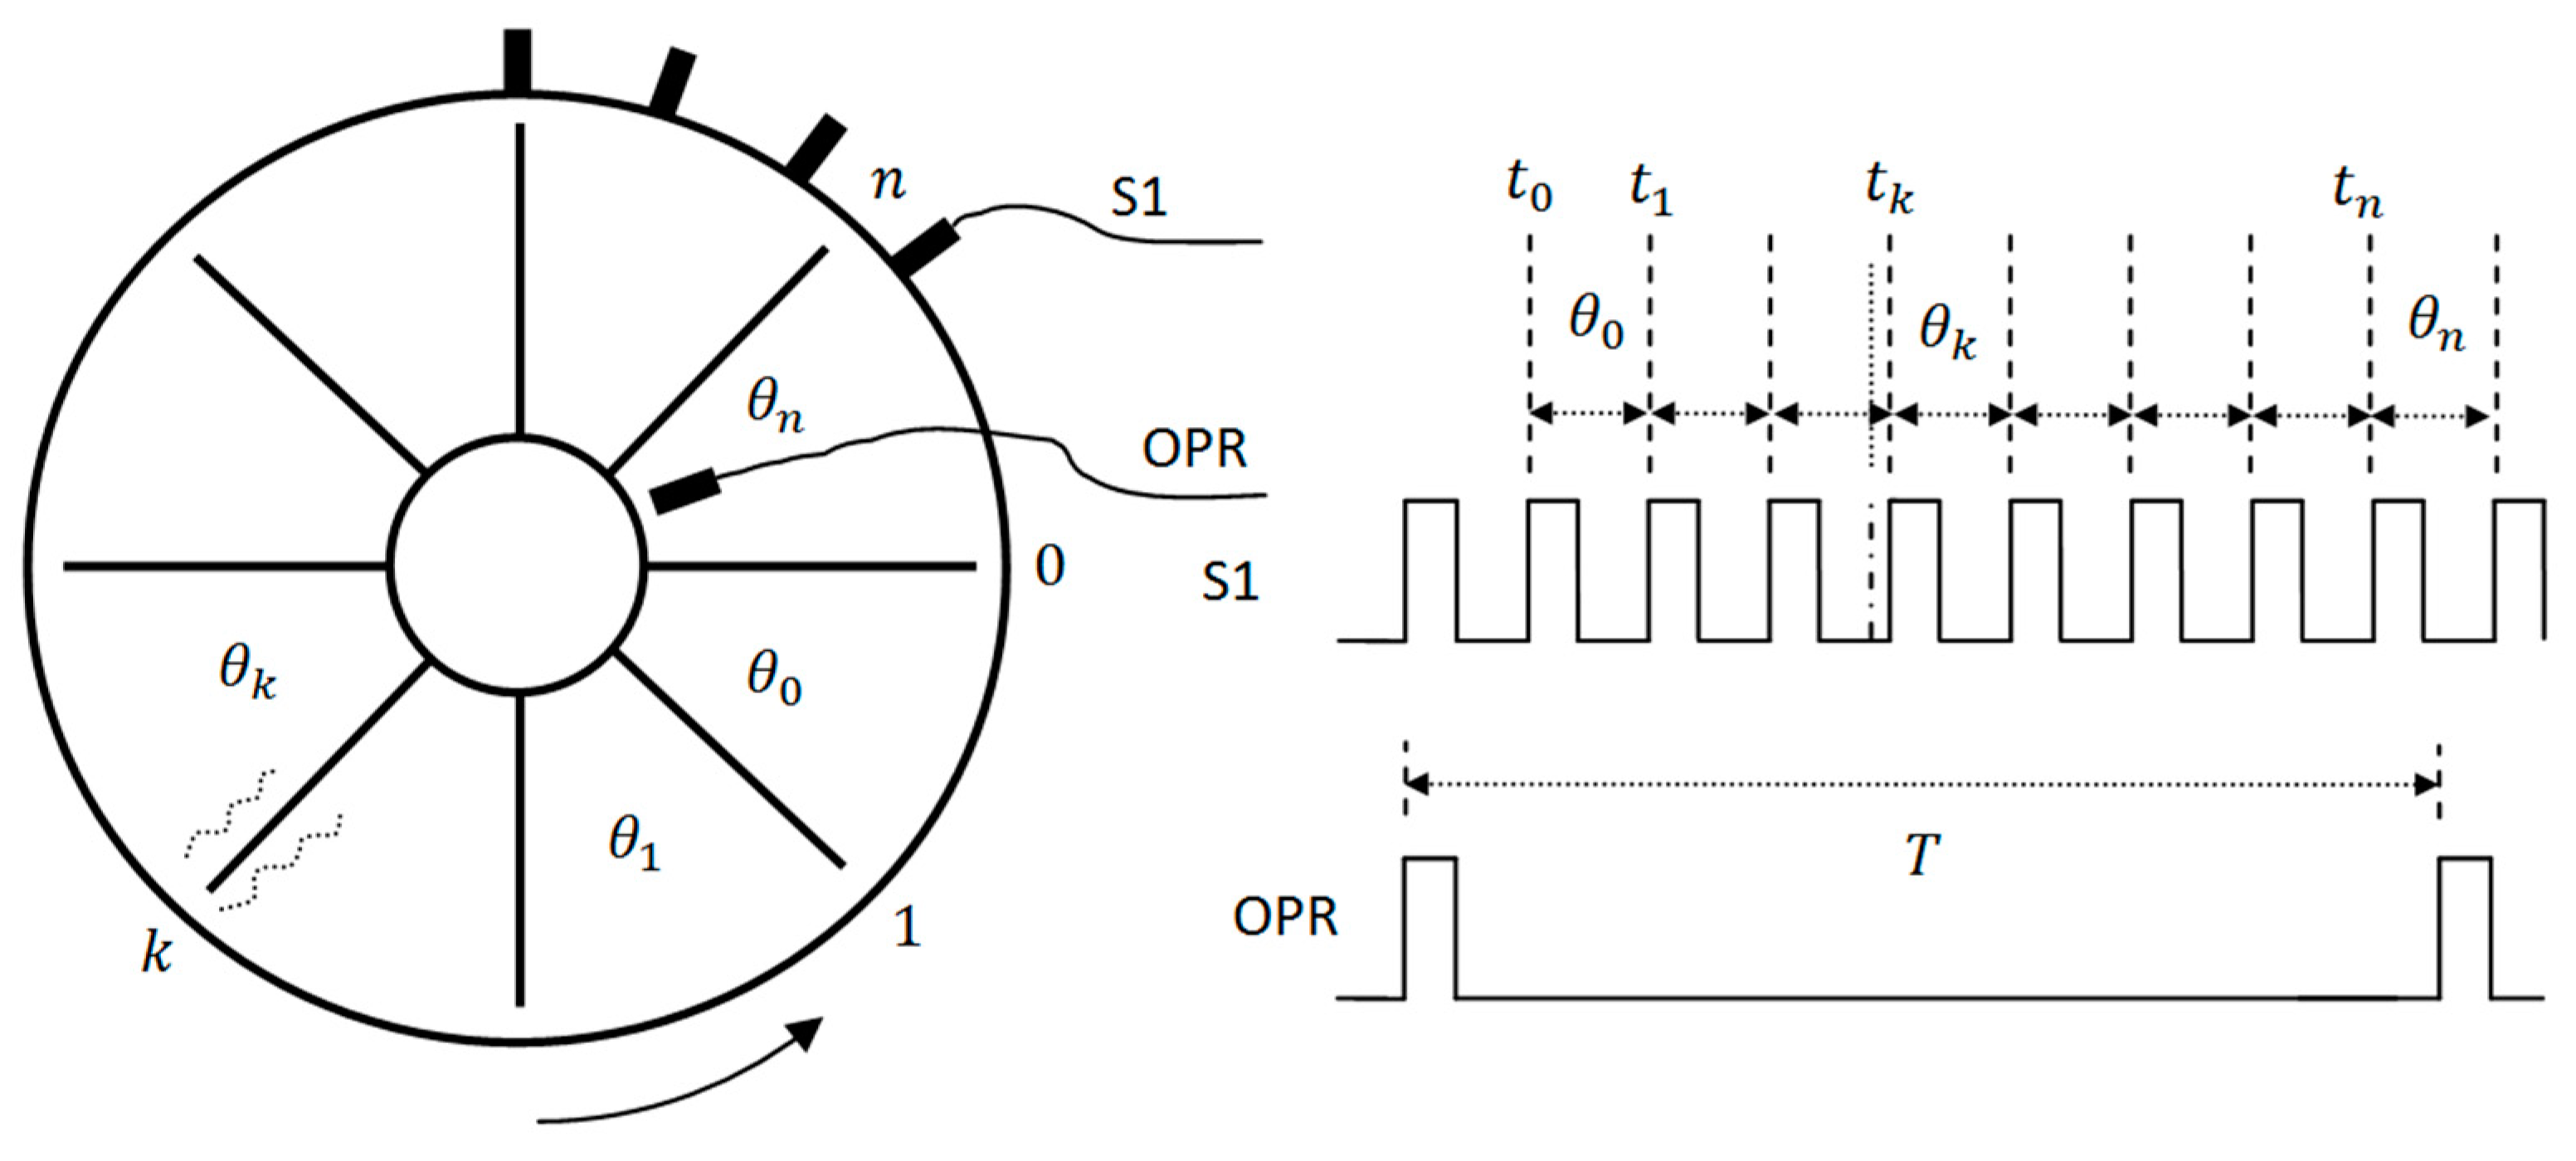
2.1. BTT System Using Fiber Optical Tip Timing Sensor
2.2. IAD Correlation Method to Identify Blade Vibration Events
- Calculate the values of , , and during a period of time when there is no vibration event in the rotating blades, and find their values when the blade deflection’s noise achieves its maximum. Record the values of and simultaneously.
- According to the signal to noise ratio of BTT data and the radius of the blade tip, set the minimum vibration amplitude to be detected, and then calculate the changes of the included angle between the adjacent two blades caused by that vibration. Refresh the values of . It is noteworthy that if the minimum vibration amplitude is set too small, a blade event may be incorrectly identified.
- Recalculate the values of , , and with the updated values of , which can be used as the values of , , and respectively.
2.3. Optimized Calculation Process
3. Experimental Results and Discussion
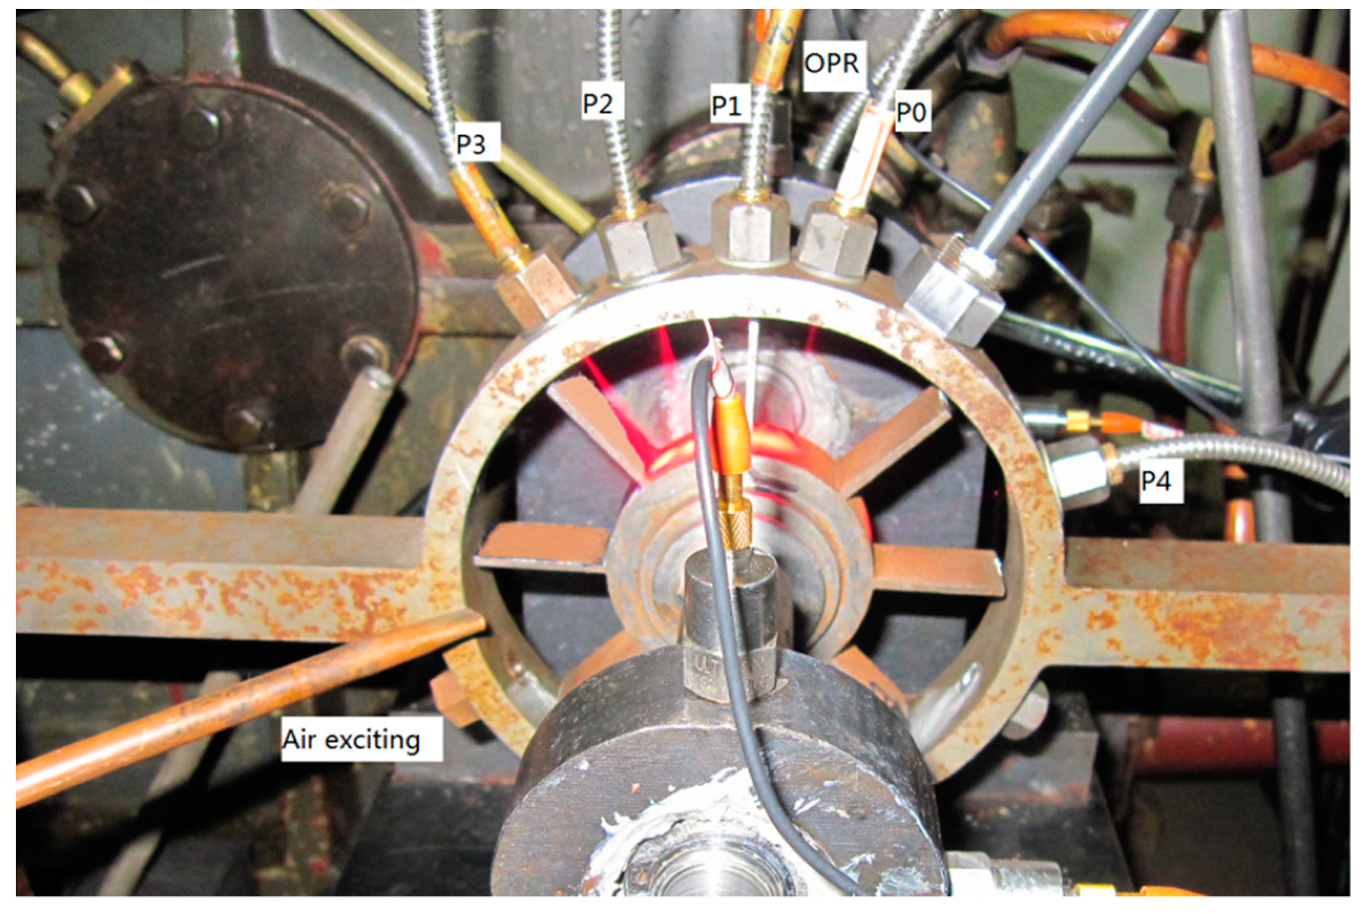
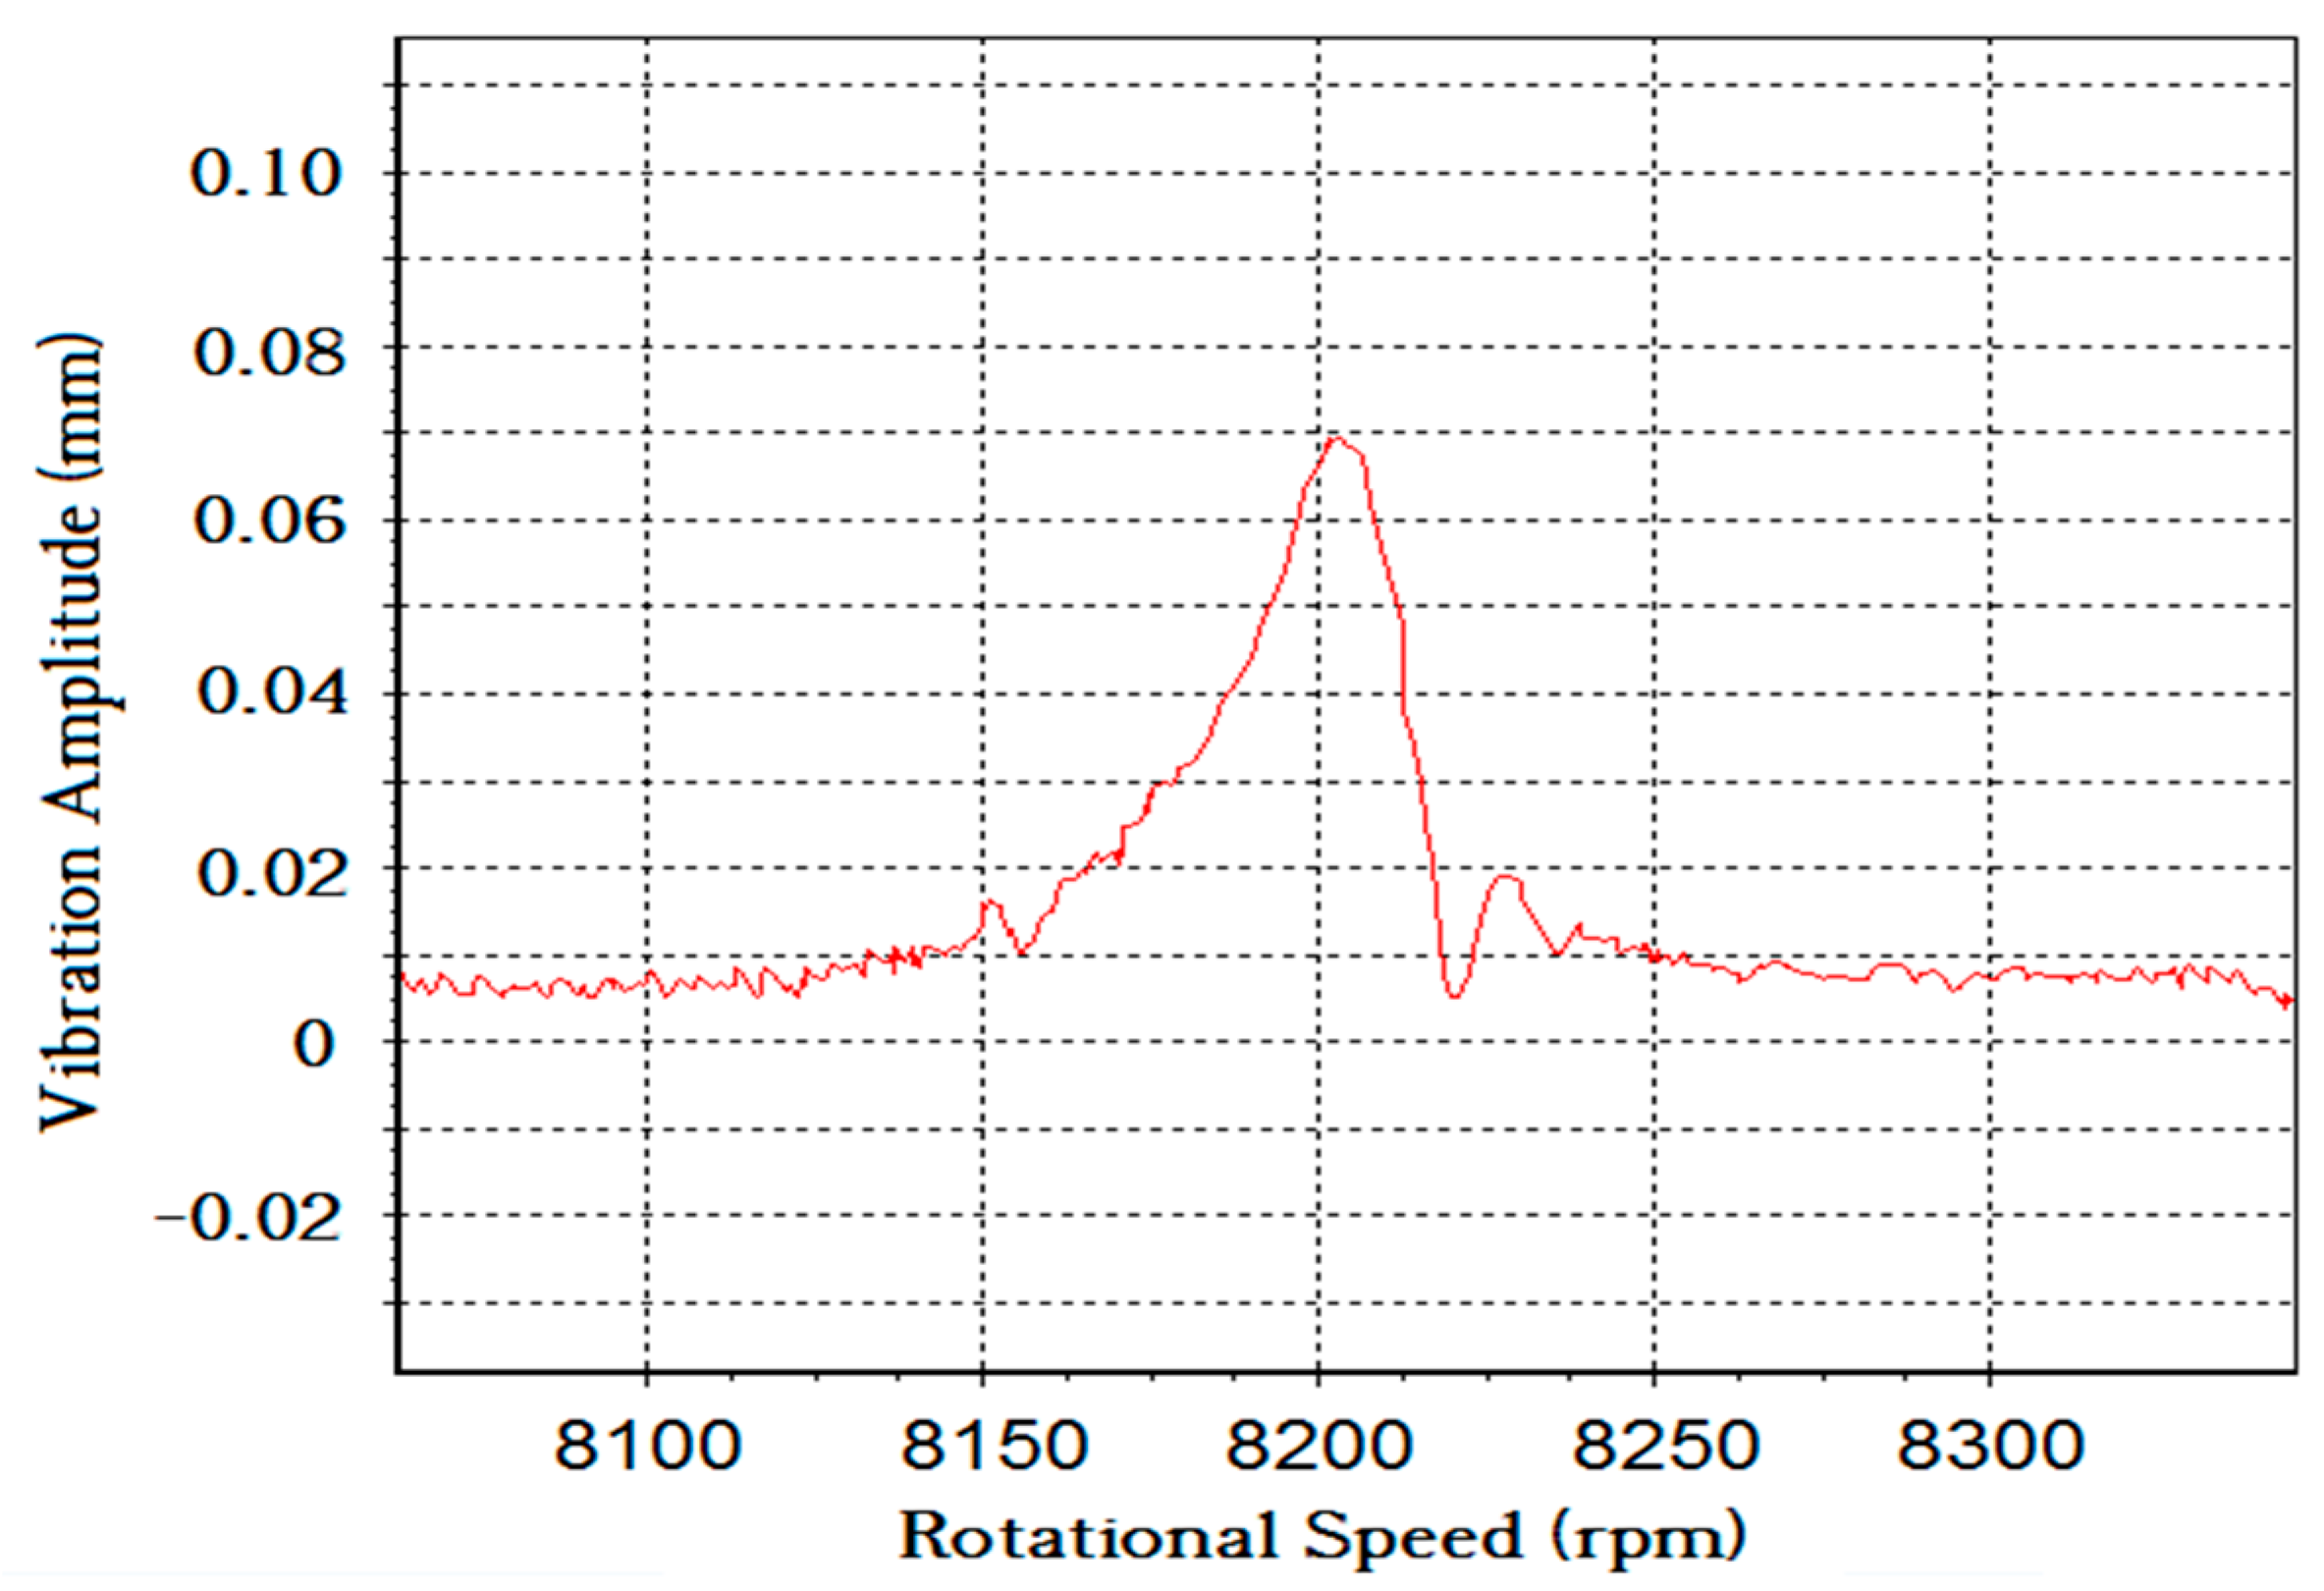
3.1. High-Speed Bench Test
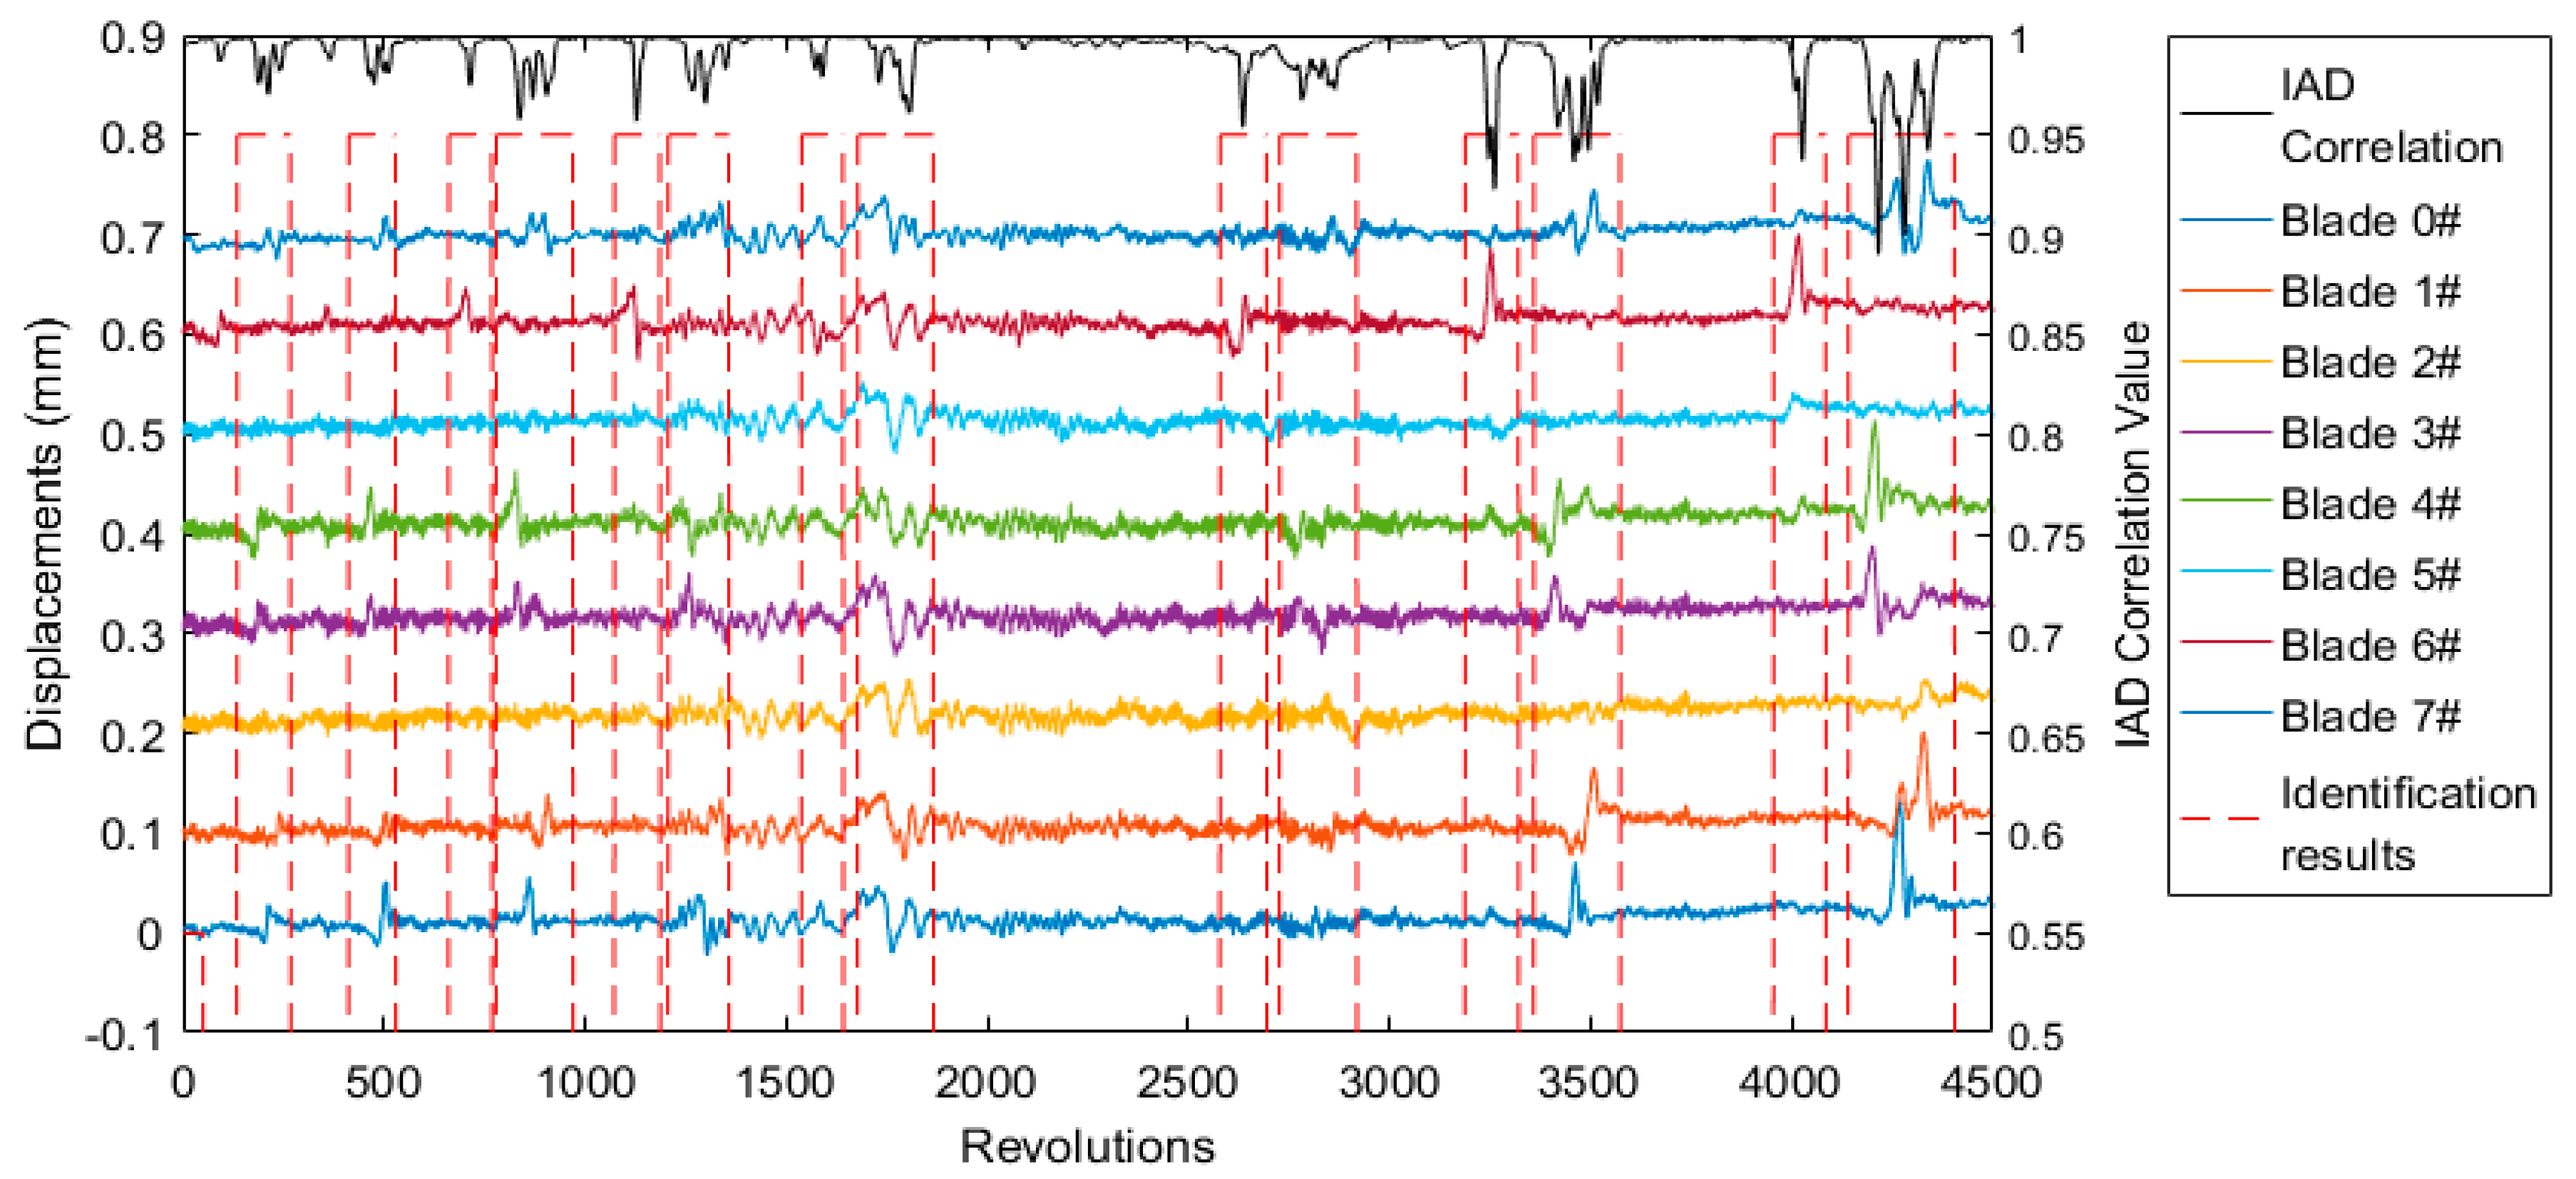
3.2. Identification of Blades’ Overall Vibration Events
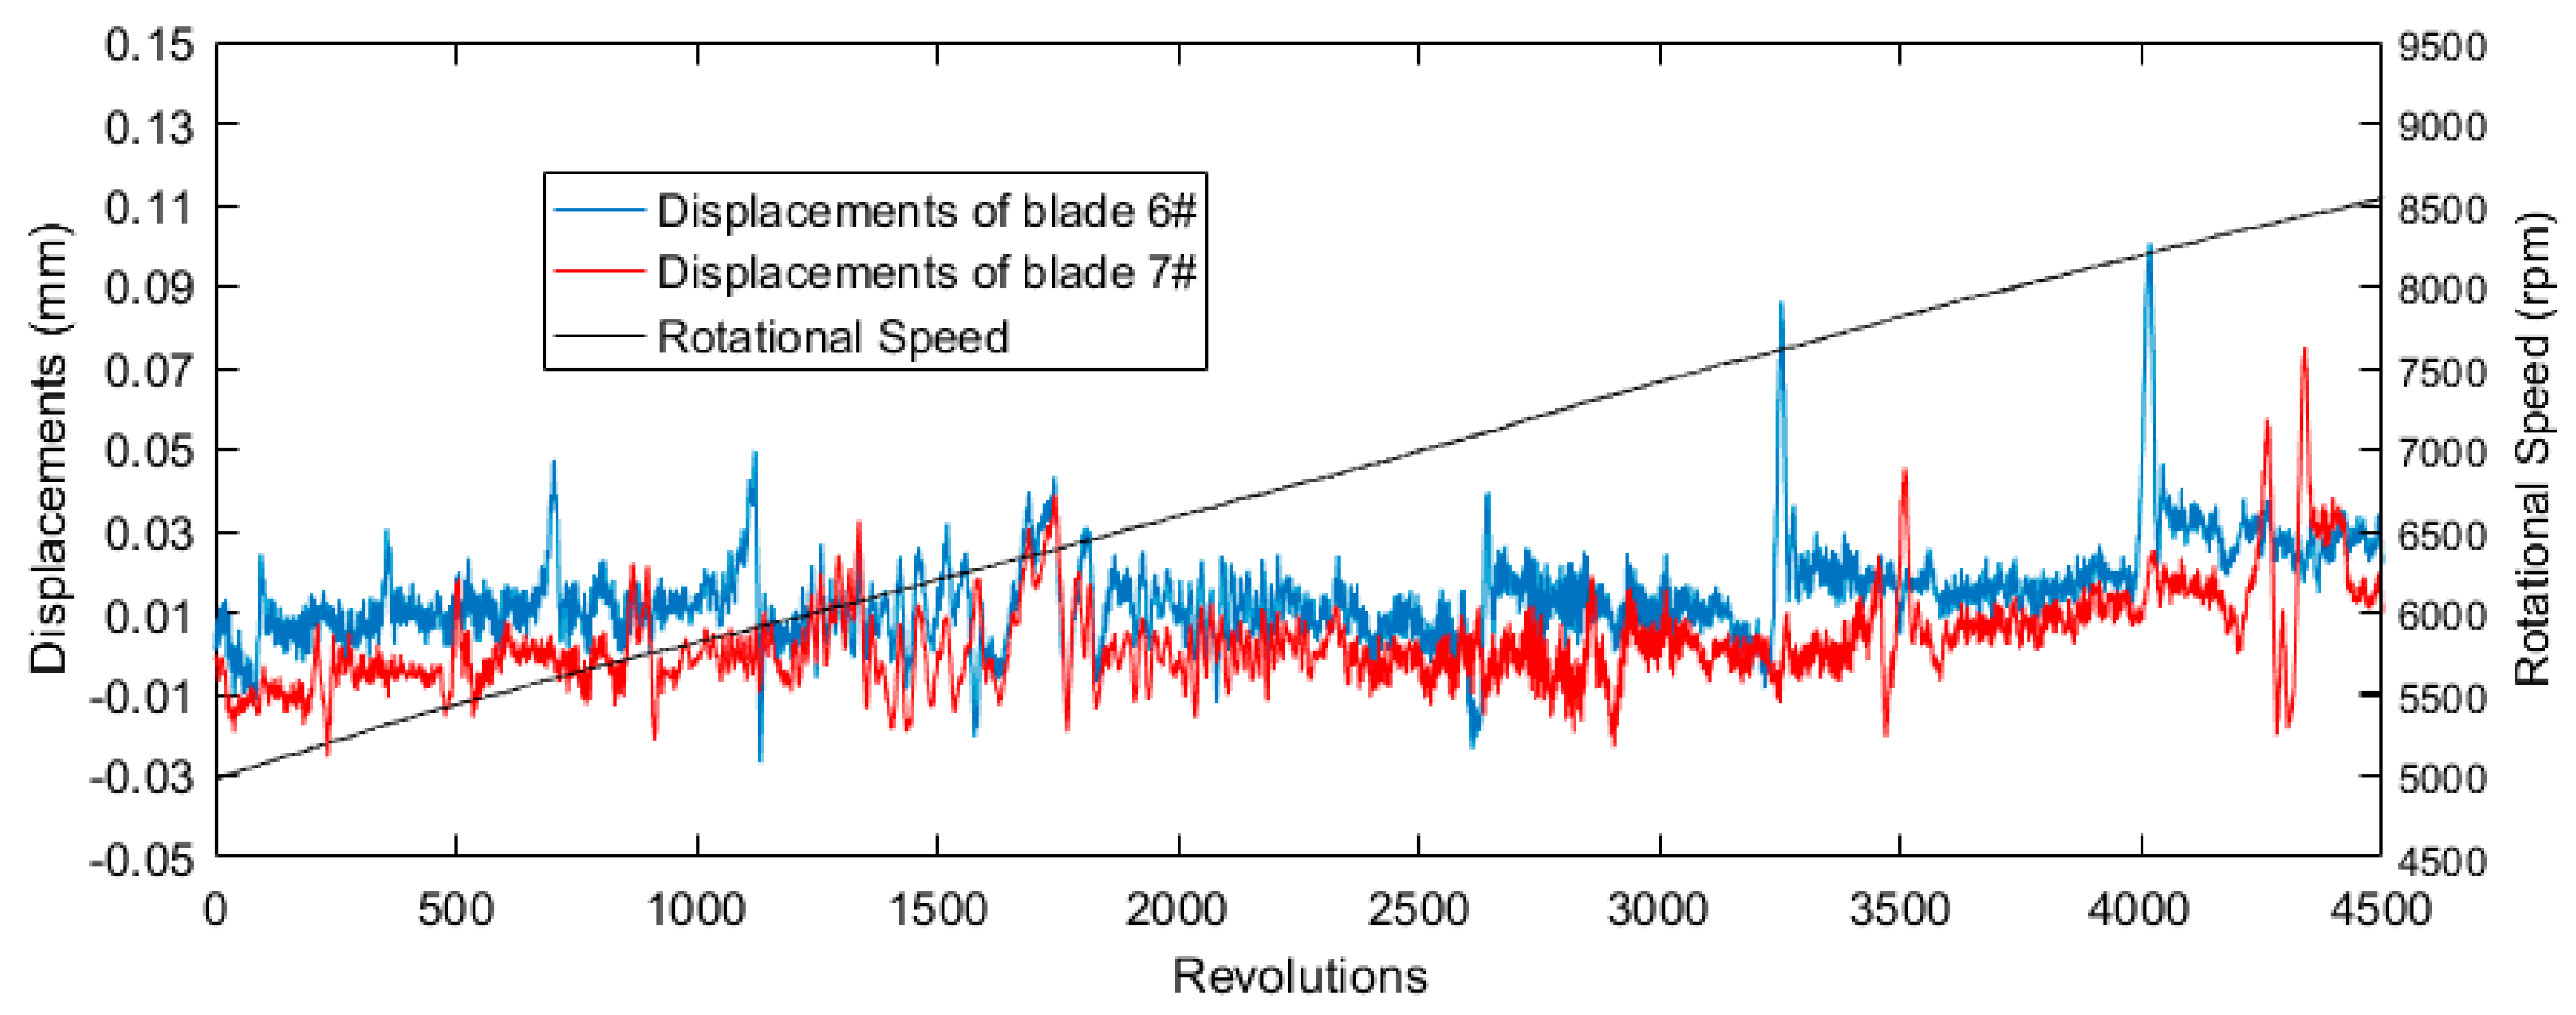
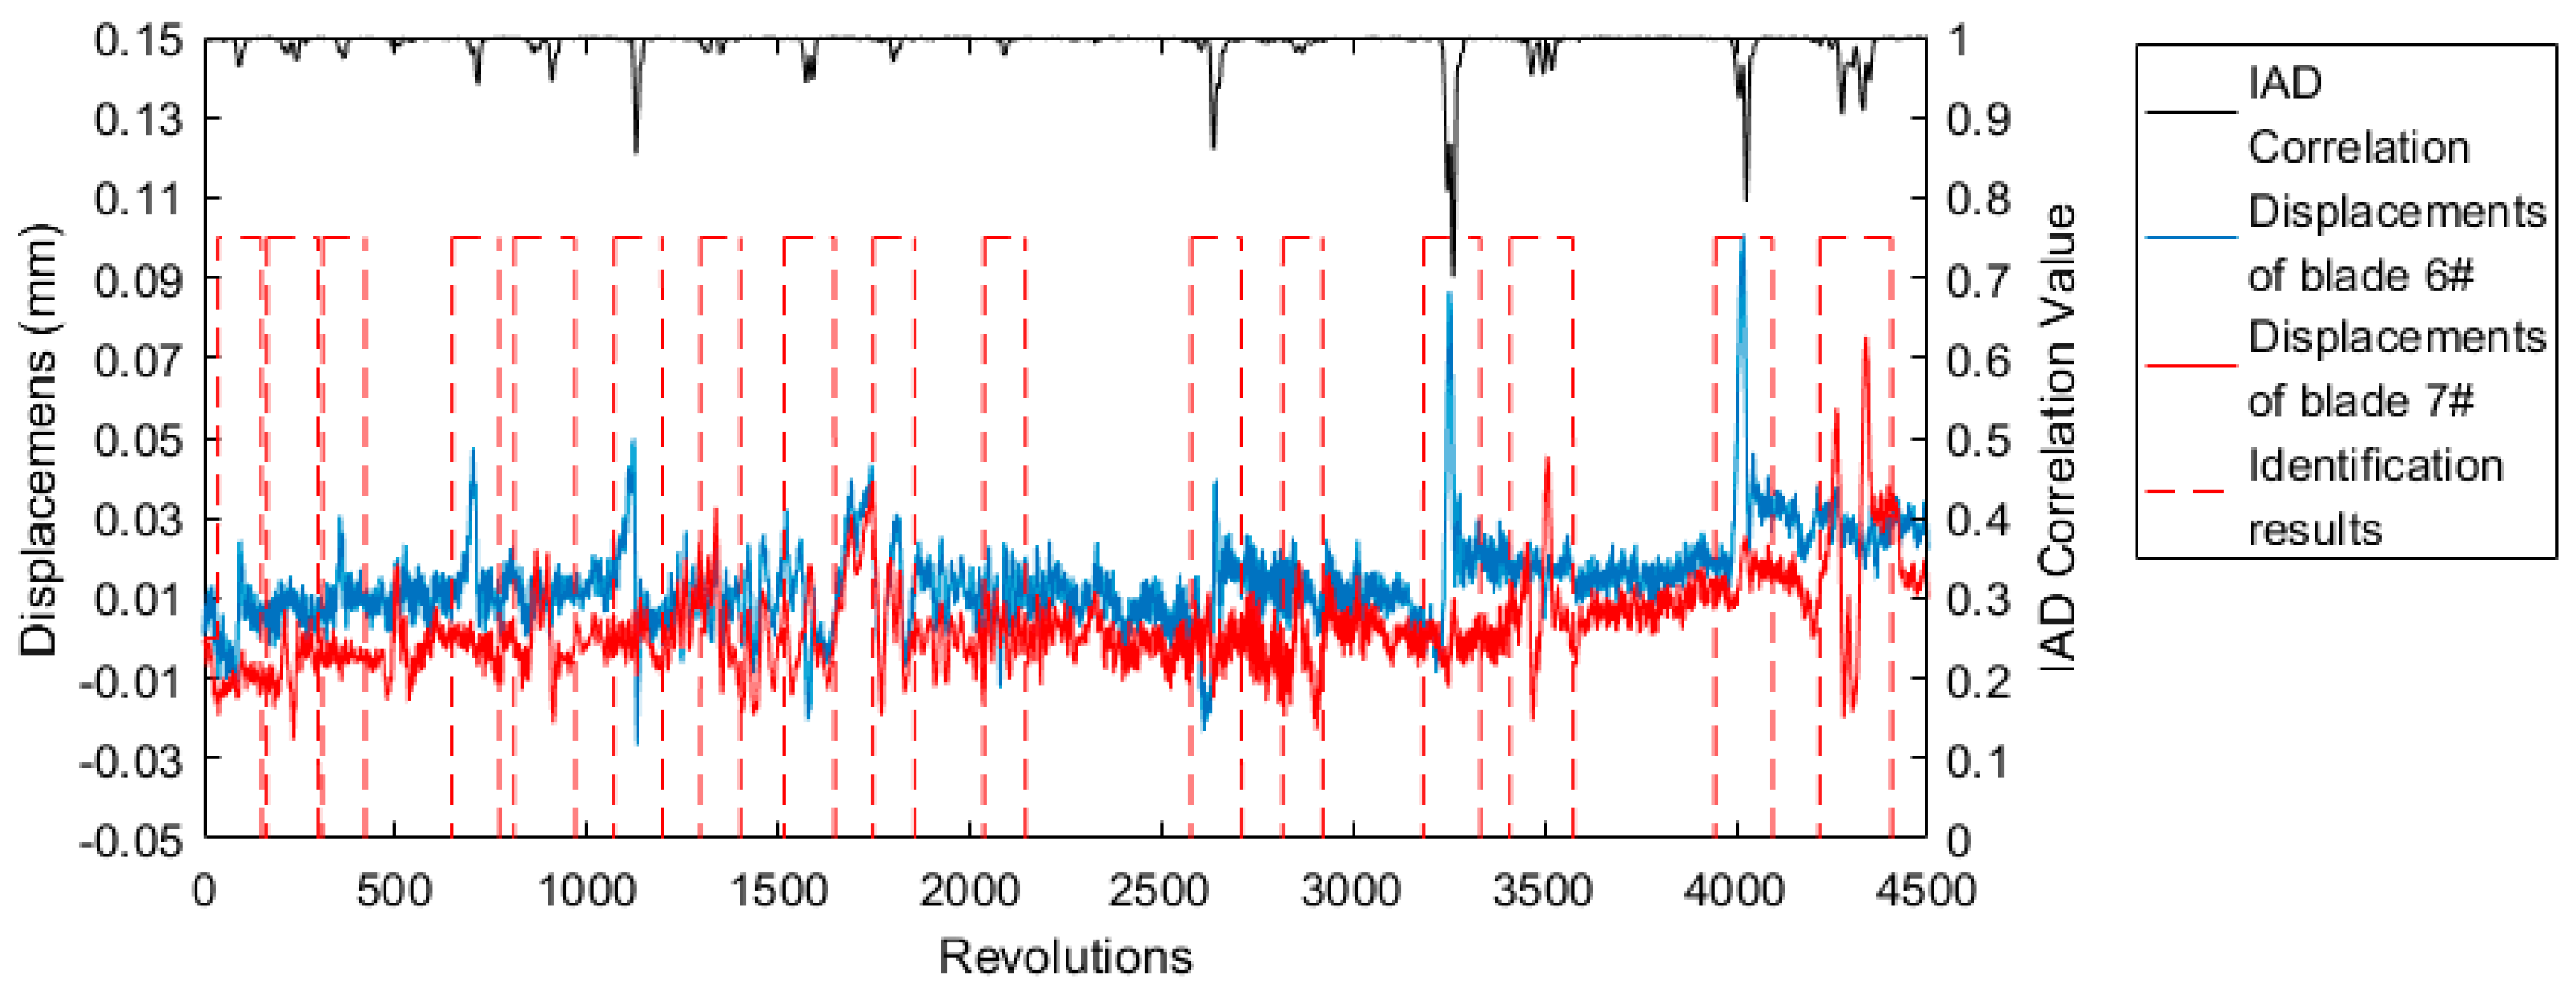
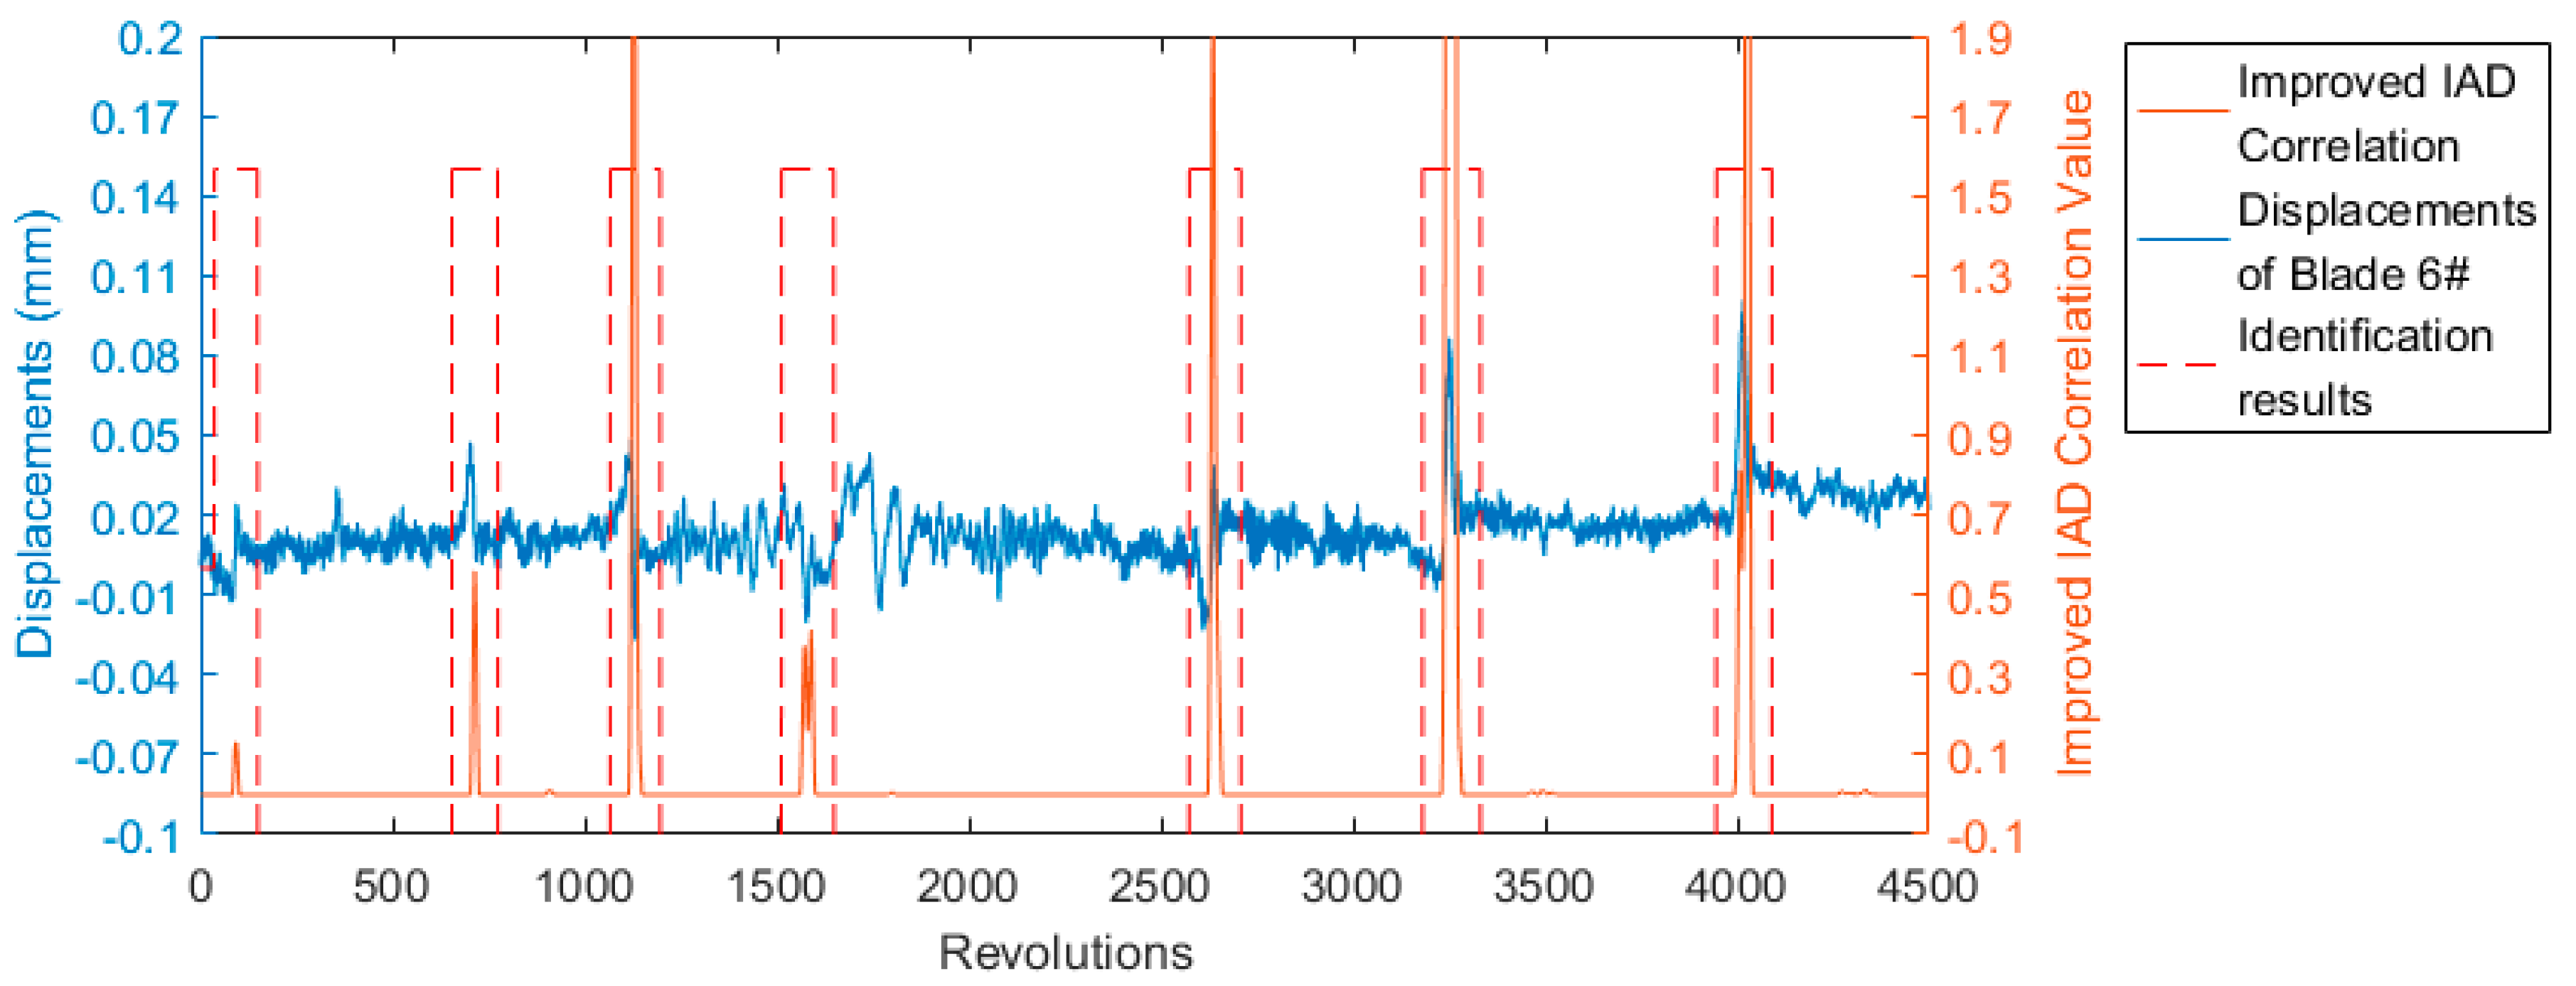
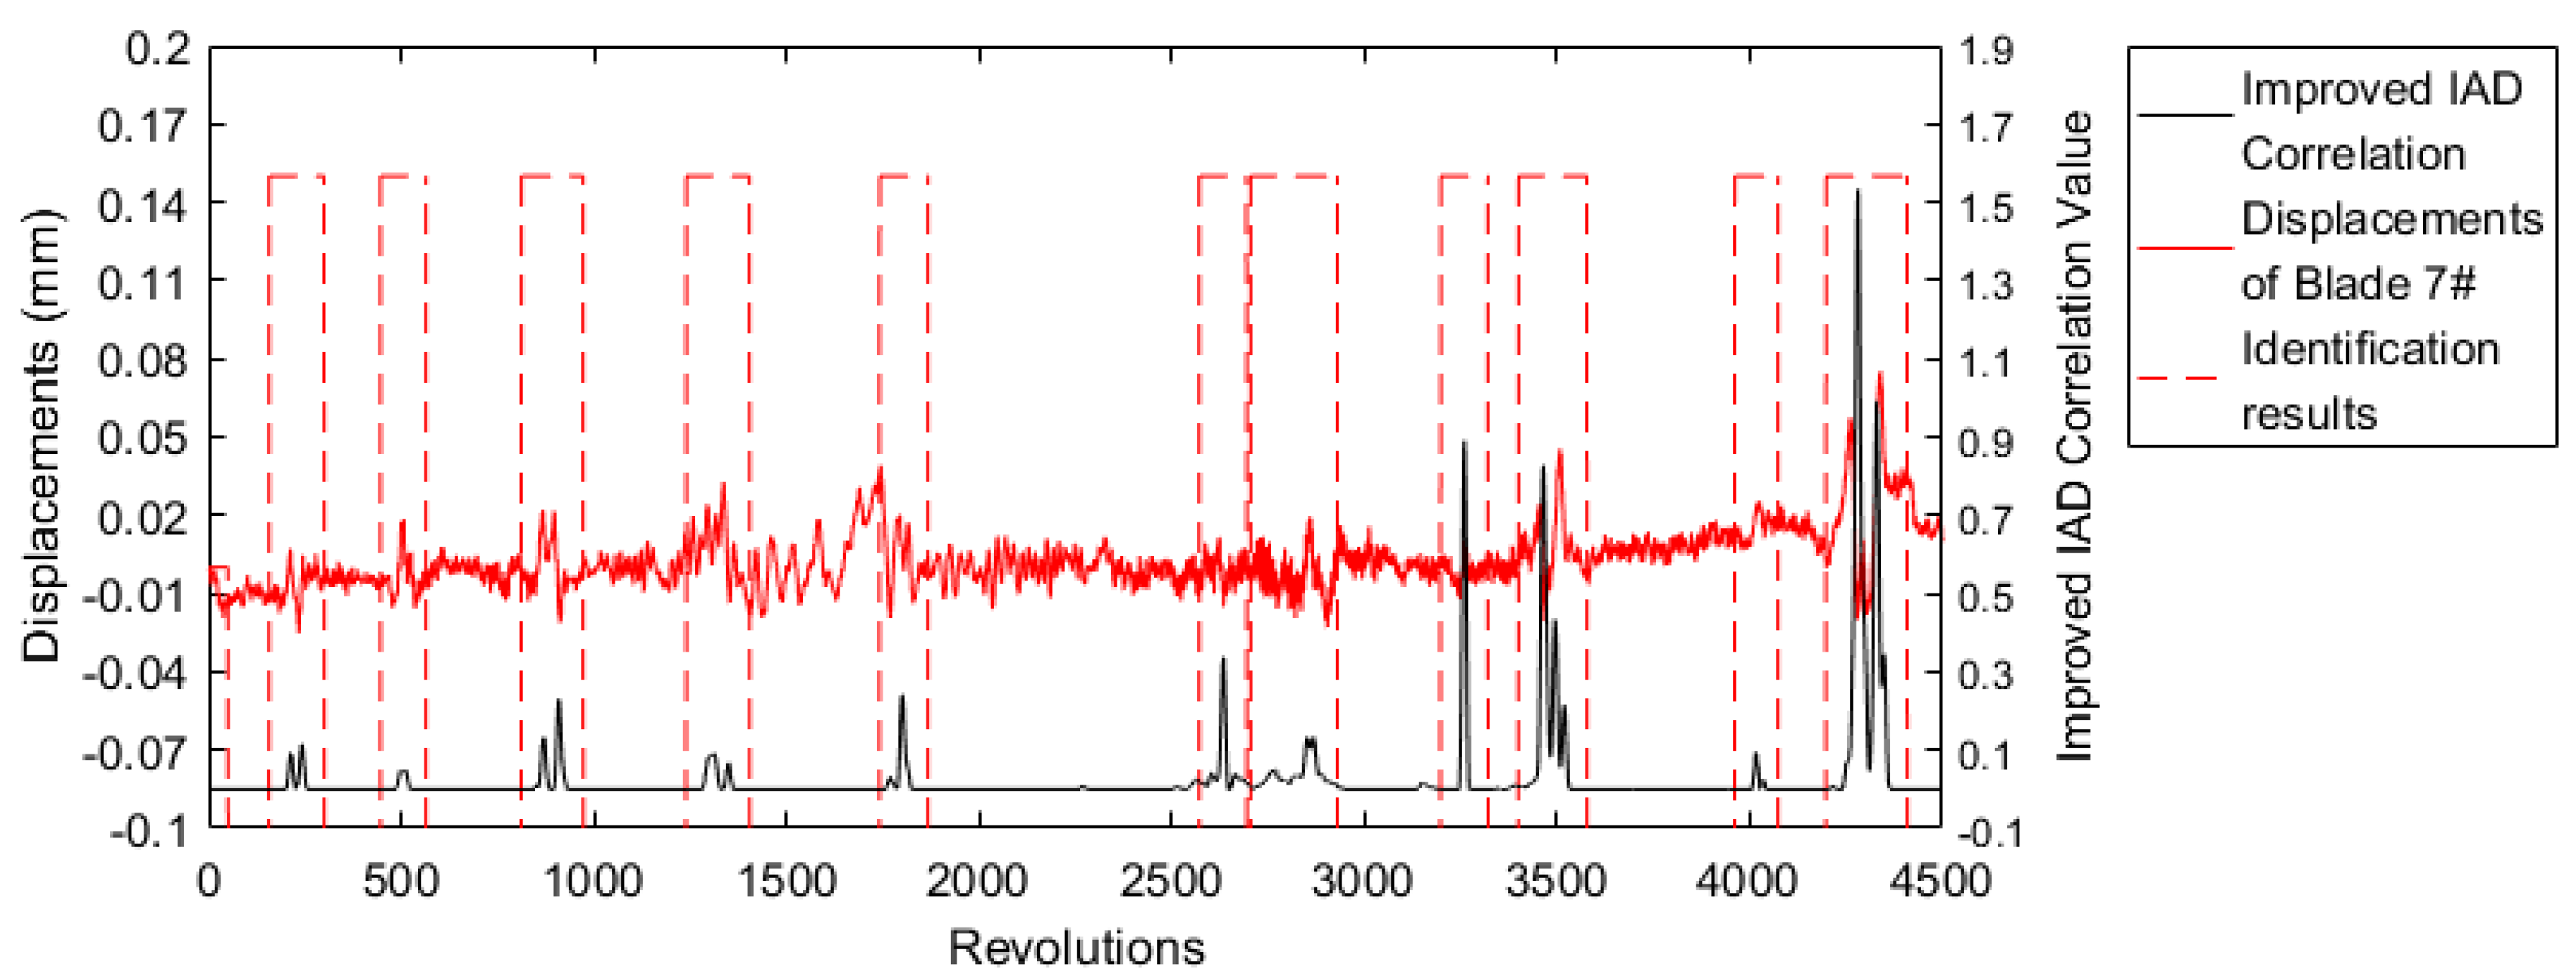
3.3. Identification of Adjacent Two Blades’ and a Specific Blade’s Events
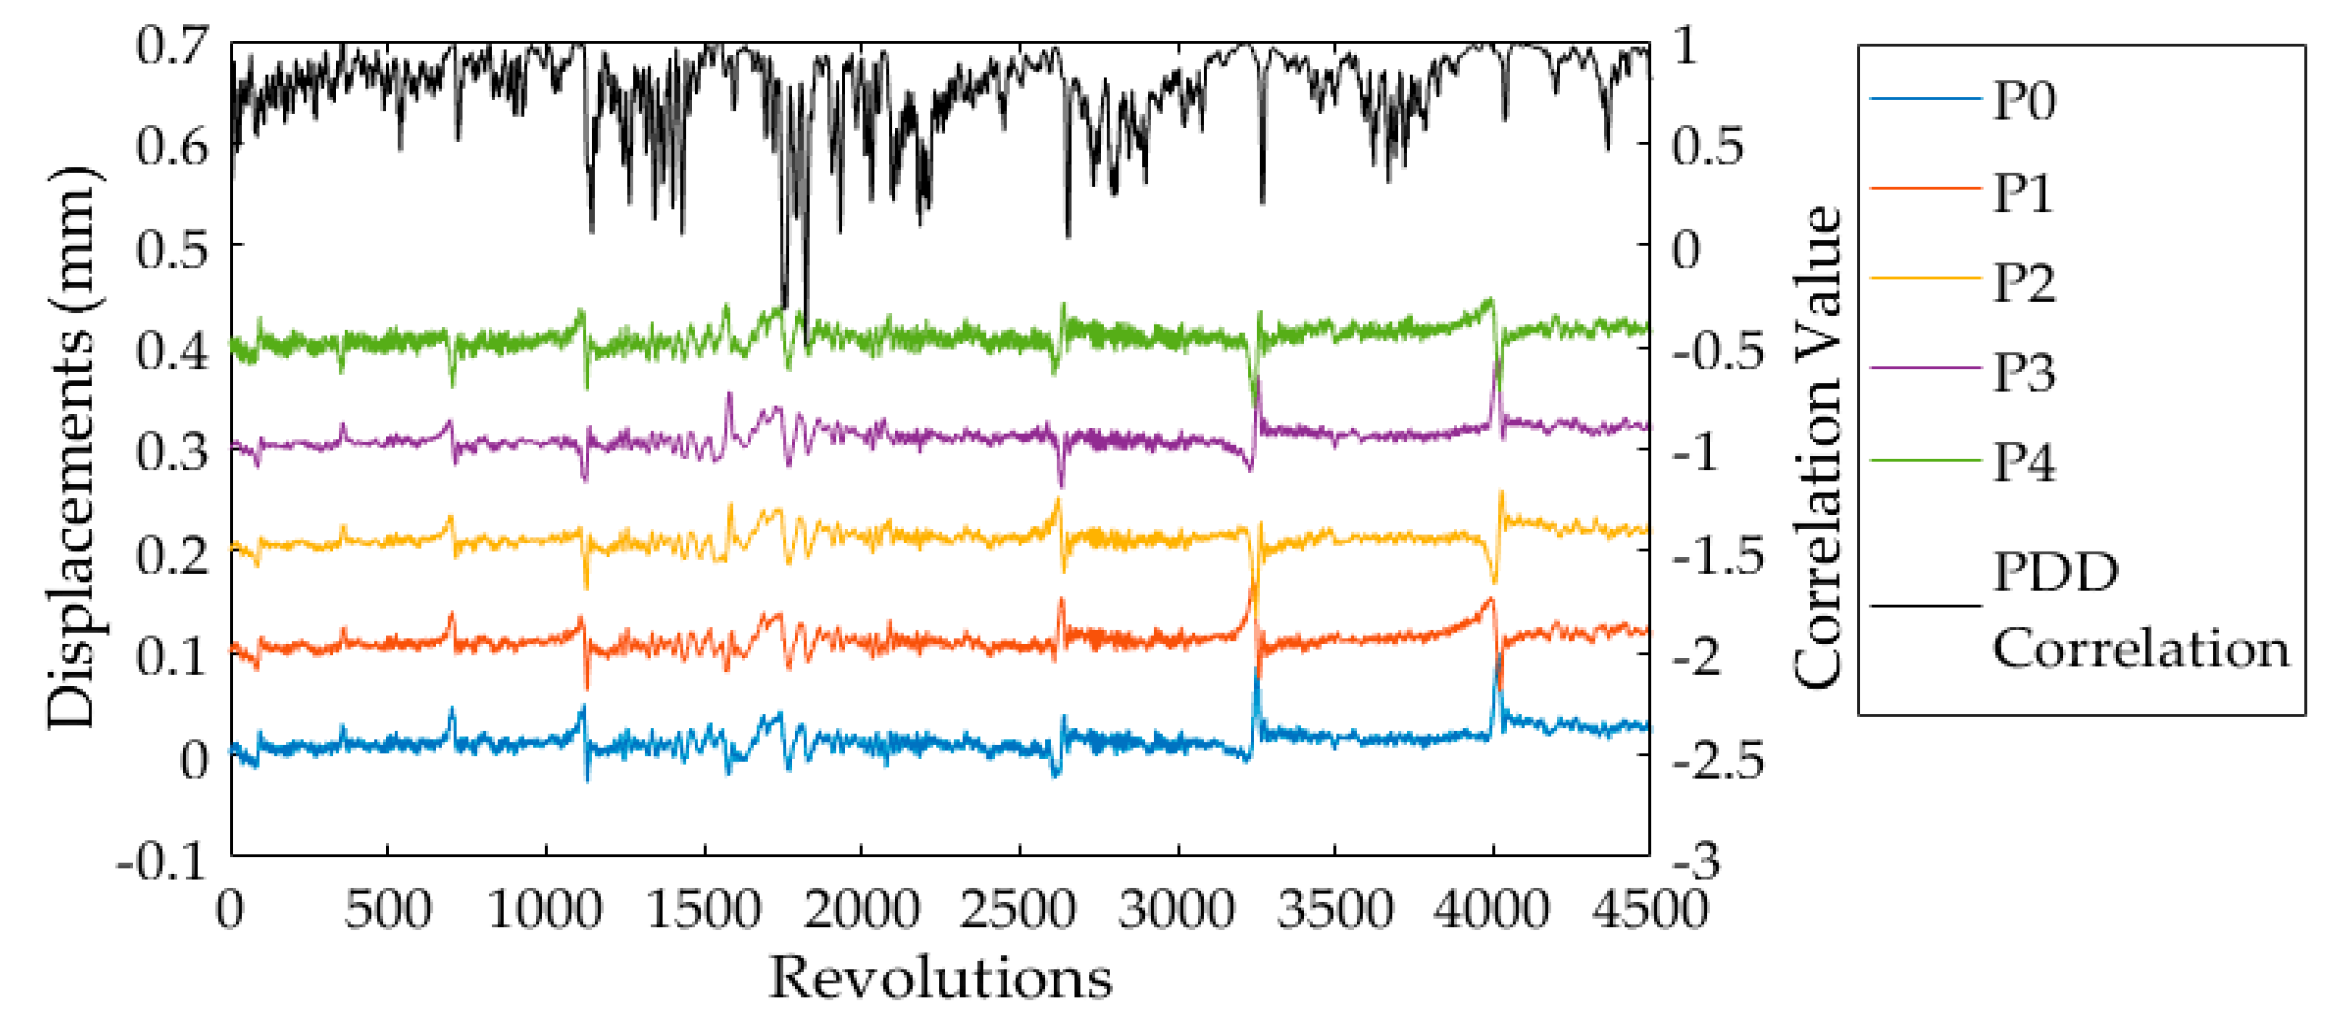
3.4. Comparison of the IAD Correlation Method with the Probe Displacement Distribution (PDD) Correlation Method
4. Conclusions
Author Contributions
Funding
Acknowledgments
Conflicts of Interest
References
- Heath, S.; Imregun, M. A survey of blade tip-timing measurement techniques for turbomachinery vibration. J. Eng. Gas Turbines Power 1998, 120, 784–791. [Google Scholar] [CrossRef]
- Kharyton, V.; Bladh, R. Using tip timing and strain gauge data for the estimation of consumed life in a Comparessor Blisk Subjected to Stall-Induced Loading. In Proceedings of the ASME Turbo Expo 2014: Turbine Technical Conference and Exposition, Düsseldorf, Germany, 16–20 June 2013. [Google Scholar]
- Salhi, B.; Lardiès, J.; Berthillier, M.; Voinis, P.; Bodel, C. Modal parameter identification of mistuned bladed disks using tip timing data. J. Sound Vib. 2008, 314, 885–906. [Google Scholar] [CrossRef]
- García, I.; Beloki, J.; Zubia, J.; Aldabaldetreku, G.; Illarramendi, M.A.; Jiménez, F. An Optical Fiber Bundle Sensor for Tip Clearance and Tip Timing Measurements in a Turbine Rig. Sensors 2013, 13, 7385–7398. [Google Scholar] [CrossRef] [PubMed]
- Guo, H.; Duan, F.; Cheng, Z. Numerical analysis of the blade tip-timing signal of a fiber bundle sensor probe. Opt. Eng. 2015, 54, 034103. [Google Scholar] [CrossRef]
- Vercoutter, A.; Lardies, J.; Berthillier, M.; Talon, A.; Burgardt, B. Improvement of compressor blade vibrations spectral analysis from tip timing data: Aliasing reduction. In Proceedings of the ASME Turbo Expo 2013: Turbine Technical Conference and Exposition, San-Antonio, TX, USA, 3–7 June 2013. [Google Scholar]
- Heath, S. A new technique for identifying synchronous resonances using tip-timing. J. Eng. Gas Turbines Power 2000, 122, 219–225. [Google Scholar] [CrossRef]
- Dimitriadis, G.; Carrington, I.; Wright, J.; Cooper, J. Blade tip timing measurement of synchronous vibrations of rotating bladed assemblies. Mech. Syst. Signal Process. 2002, 16, 599–622. [Google Scholar] [CrossRef]
- Dimitriadis, G.; Gallego-Garrido, J.; Wright, J. A class of methods for the analysis of Blade Tip Timing Data from bladed assemblies undergoing simultaneous resonances-Part I: Theoretical Development. Int. J. Rotating Mach. 2007, 2007, 27247. [Google Scholar]
- Hu, Z.; Lin, J.; Chen, Z.; Yang, Y.; Li, X. A non-uniformly under-sampled blade tip-timing signal reconstruction method for blade vibration monitoring. Sensors 2015, 15, 2419–2437. [Google Scholar] [CrossRef] [PubMed]
- Diamond, D.H.; Heyns, P.S.; Oberholster, A.J. A comparison between three blade tip Timing algorithms for estimating synchronous turbomachine blade vibration. In Proceedings of the 9th World Congress on Engineering Asset Management (WCEAM), Pretoria, South Africa, 28–31 October 2014; pp. 215–225. [Google Scholar]
- Prochazka, P.; Vanek, F. New methods of noncontact sensing of blade vibrations and deflections in turbomachinery. IEEE Trans. Instrum. Meas. 2014, 63, 1583–1592. [Google Scholar] [CrossRef]
- Kharyton, V.; Dimitriadis, G.; Defise, C. A discussion on the advancement of blade tip timing data processing. In Proceedings of the ASME Turbo Expo 2017: Turbomachinery Technical Conference and Exposition, Charlotte, NC, USA, 26–27 June 2017. [Google Scholar]
- Wang, P.; Karg, D.; Fan, Z.; Gao, R.X.; Kwolek, K.; Consilio, A. Non-contact identification of rotating blade vibration. Mech. Eng. J. 2015, 2, 15–25. [Google Scholar] [CrossRef]
- Guo, H.; Duan, F.; Zhang, J. Blade resonance parameter identification based on tip-timing method without the once-per revolution sensor. Mech. Syst. Signal Process. 2016, 66–67, 625–639. [Google Scholar] [CrossRef]
- Russhard, P.; Back, J.D. Method for Analyzing Vibration in Rotor Blades. Patent EP2136189A2, 15 May 2009. [Google Scholar]
- Lawson, C.P.; Ivey, P.C. Tubomachinery blade vibration amplitude measurement through tip timing with capacitance tip clearance probes. Sens. Actuators A Phys. 2005, 118, 14–24. [Google Scholar] [CrossRef]
- Zhang, J.; Duan, F.; Niu, G.; Jiang, J.; Li, J. A Blade Tip Timing Method Based on a Microwave Sensor. Sensors 2017, 17, 1097. [Google Scholar] [CrossRef] [PubMed]
- Chana, K.S.; Cardwell, D.N. The use of eddy current sensor based blade tip timing for FOD detection. In Proceedings of the ASME Turbo Expo 2008: Power for Land, Sea, and Air, Berlin, Germany, 9–13 June 2008; pp. 169–178. [Google Scholar]


| +(−)−(−) | + (−)−(−) | +(−)(+)−(−)(+) | |||
| … | … | … | … | … | … |
| +(−)−(−) | + (−)−(−) | +(−)(+)−(−)(+) | |||
| … | … | … | … | … | … |
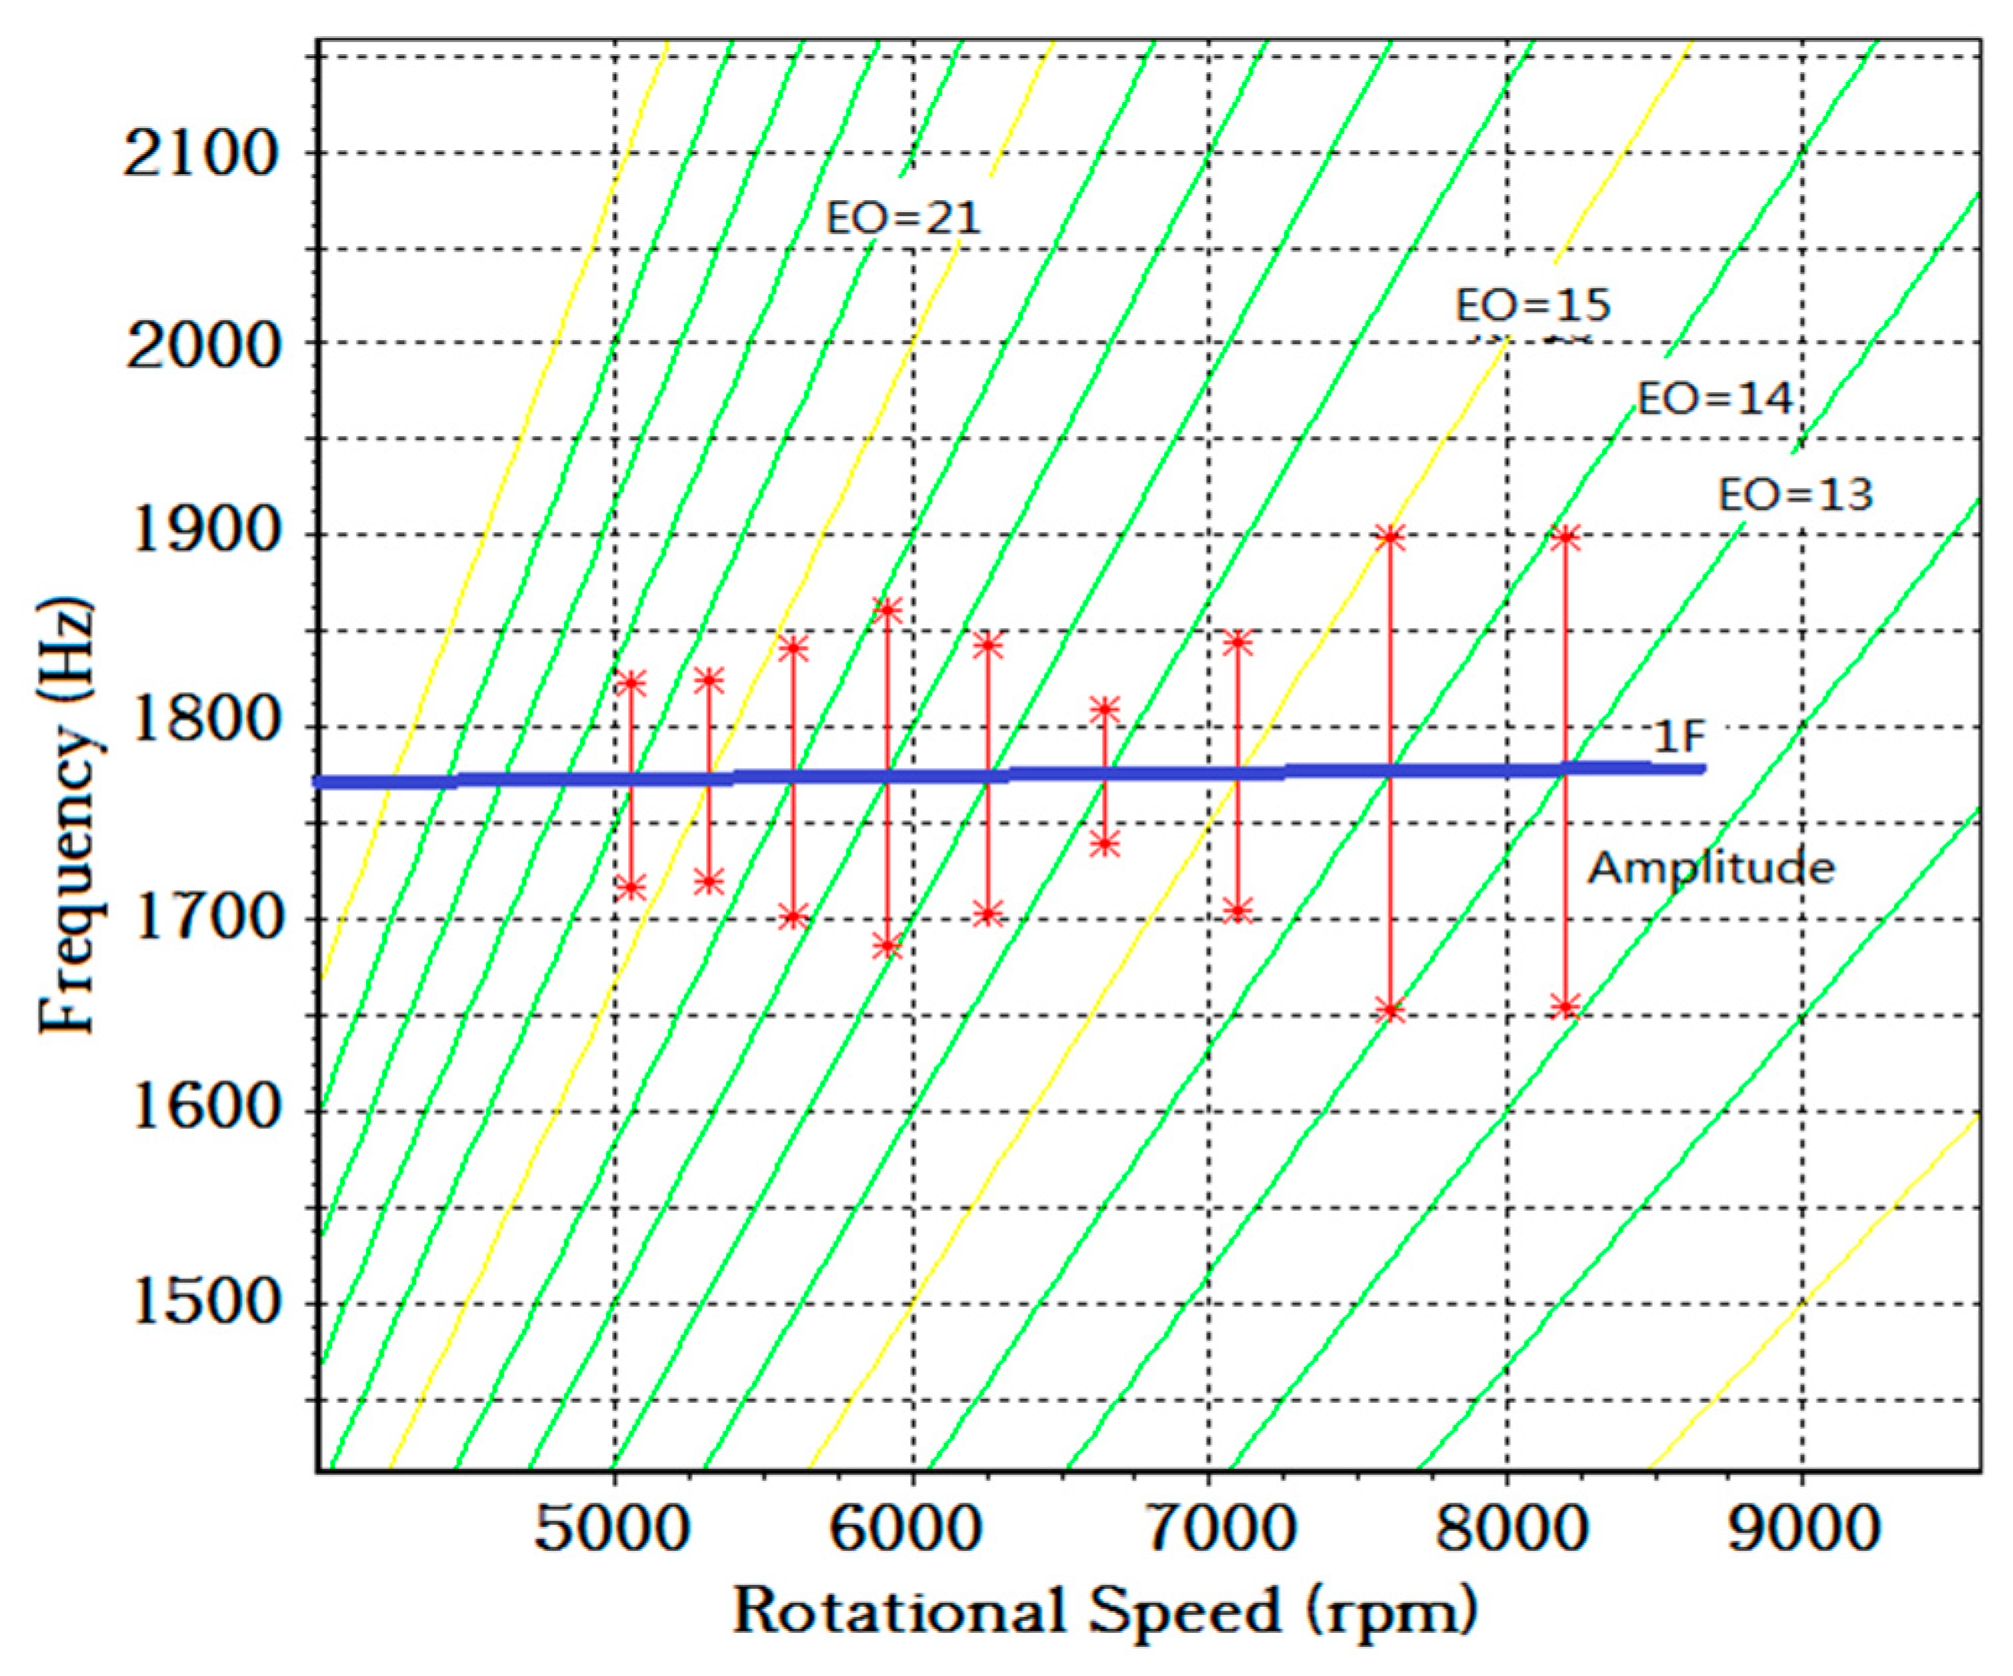
| Engine Order | Amplitude (mm) | Frequency (Hz) | Center Speed (rpm) |
|---|---|---|---|
| 13 | 0.07 | 1777.02 | 8201.61 |
| 14 | 0.07 | 1776.07 | 7611.72 |
| 15 | 0.04 | 1775.02 | 7100.07 |
| 16 | 0.02 | 1774.22 | 6653.32 |
| 17 | 0.04 | 1773.28 | 6258.62 |
| 18 | 0.05 | 1773.38 | 5911.26 |
| 19 | 0.04 | 1772.00 | 5595.79 |
| 20 | 0.03 | 1772.59 | 5317.77 |
| 21 | 0.03 | 1770.06 | 5057.30 |
© 2019 by the authors. Licensee MDPI, Basel, Switzerland. This article is an open access article distributed under the terms and conditions of the Creative Commons Attribution (CC BY) license (http://creativecommons.org/licenses/by/4.0/).
Share and Cite
Ye, D.; Duan, F.; Jiang, J.; Niu, G.; Liu, Z.; Li, F. Identification of Vibration Events in Rotating Blades Using a Fiber Optical Tip Timing Sensor. Sensors 2019, 19, 1482. https://doi.org/10.3390/s19071482
Ye D, Duan F, Jiang J, Niu G, Liu Z, Li F. Identification of Vibration Events in Rotating Blades Using a Fiber Optical Tip Timing Sensor. Sensors. 2019; 19(7):1482. https://doi.org/10.3390/s19071482
Chicago/Turabian StyleYe, Dechao, Fajie Duan, Jiajia Jiang, Guangyue Niu, Zhibo Liu, and Fangyi Li. 2019. "Identification of Vibration Events in Rotating Blades Using a Fiber Optical Tip Timing Sensor" Sensors 19, no. 7: 1482. https://doi.org/10.3390/s19071482
APA StyleYe, D., Duan, F., Jiang, J., Niu, G., Liu, Z., & Li, F. (2019). Identification of Vibration Events in Rotating Blades Using a Fiber Optical Tip Timing Sensor. Sensors, 19(7), 1482. https://doi.org/10.3390/s19071482