A Review of NDT/Structural Health Monitoring Techniques for Hot Gas Components in Gas Turbines


Abstract
1. Introduction
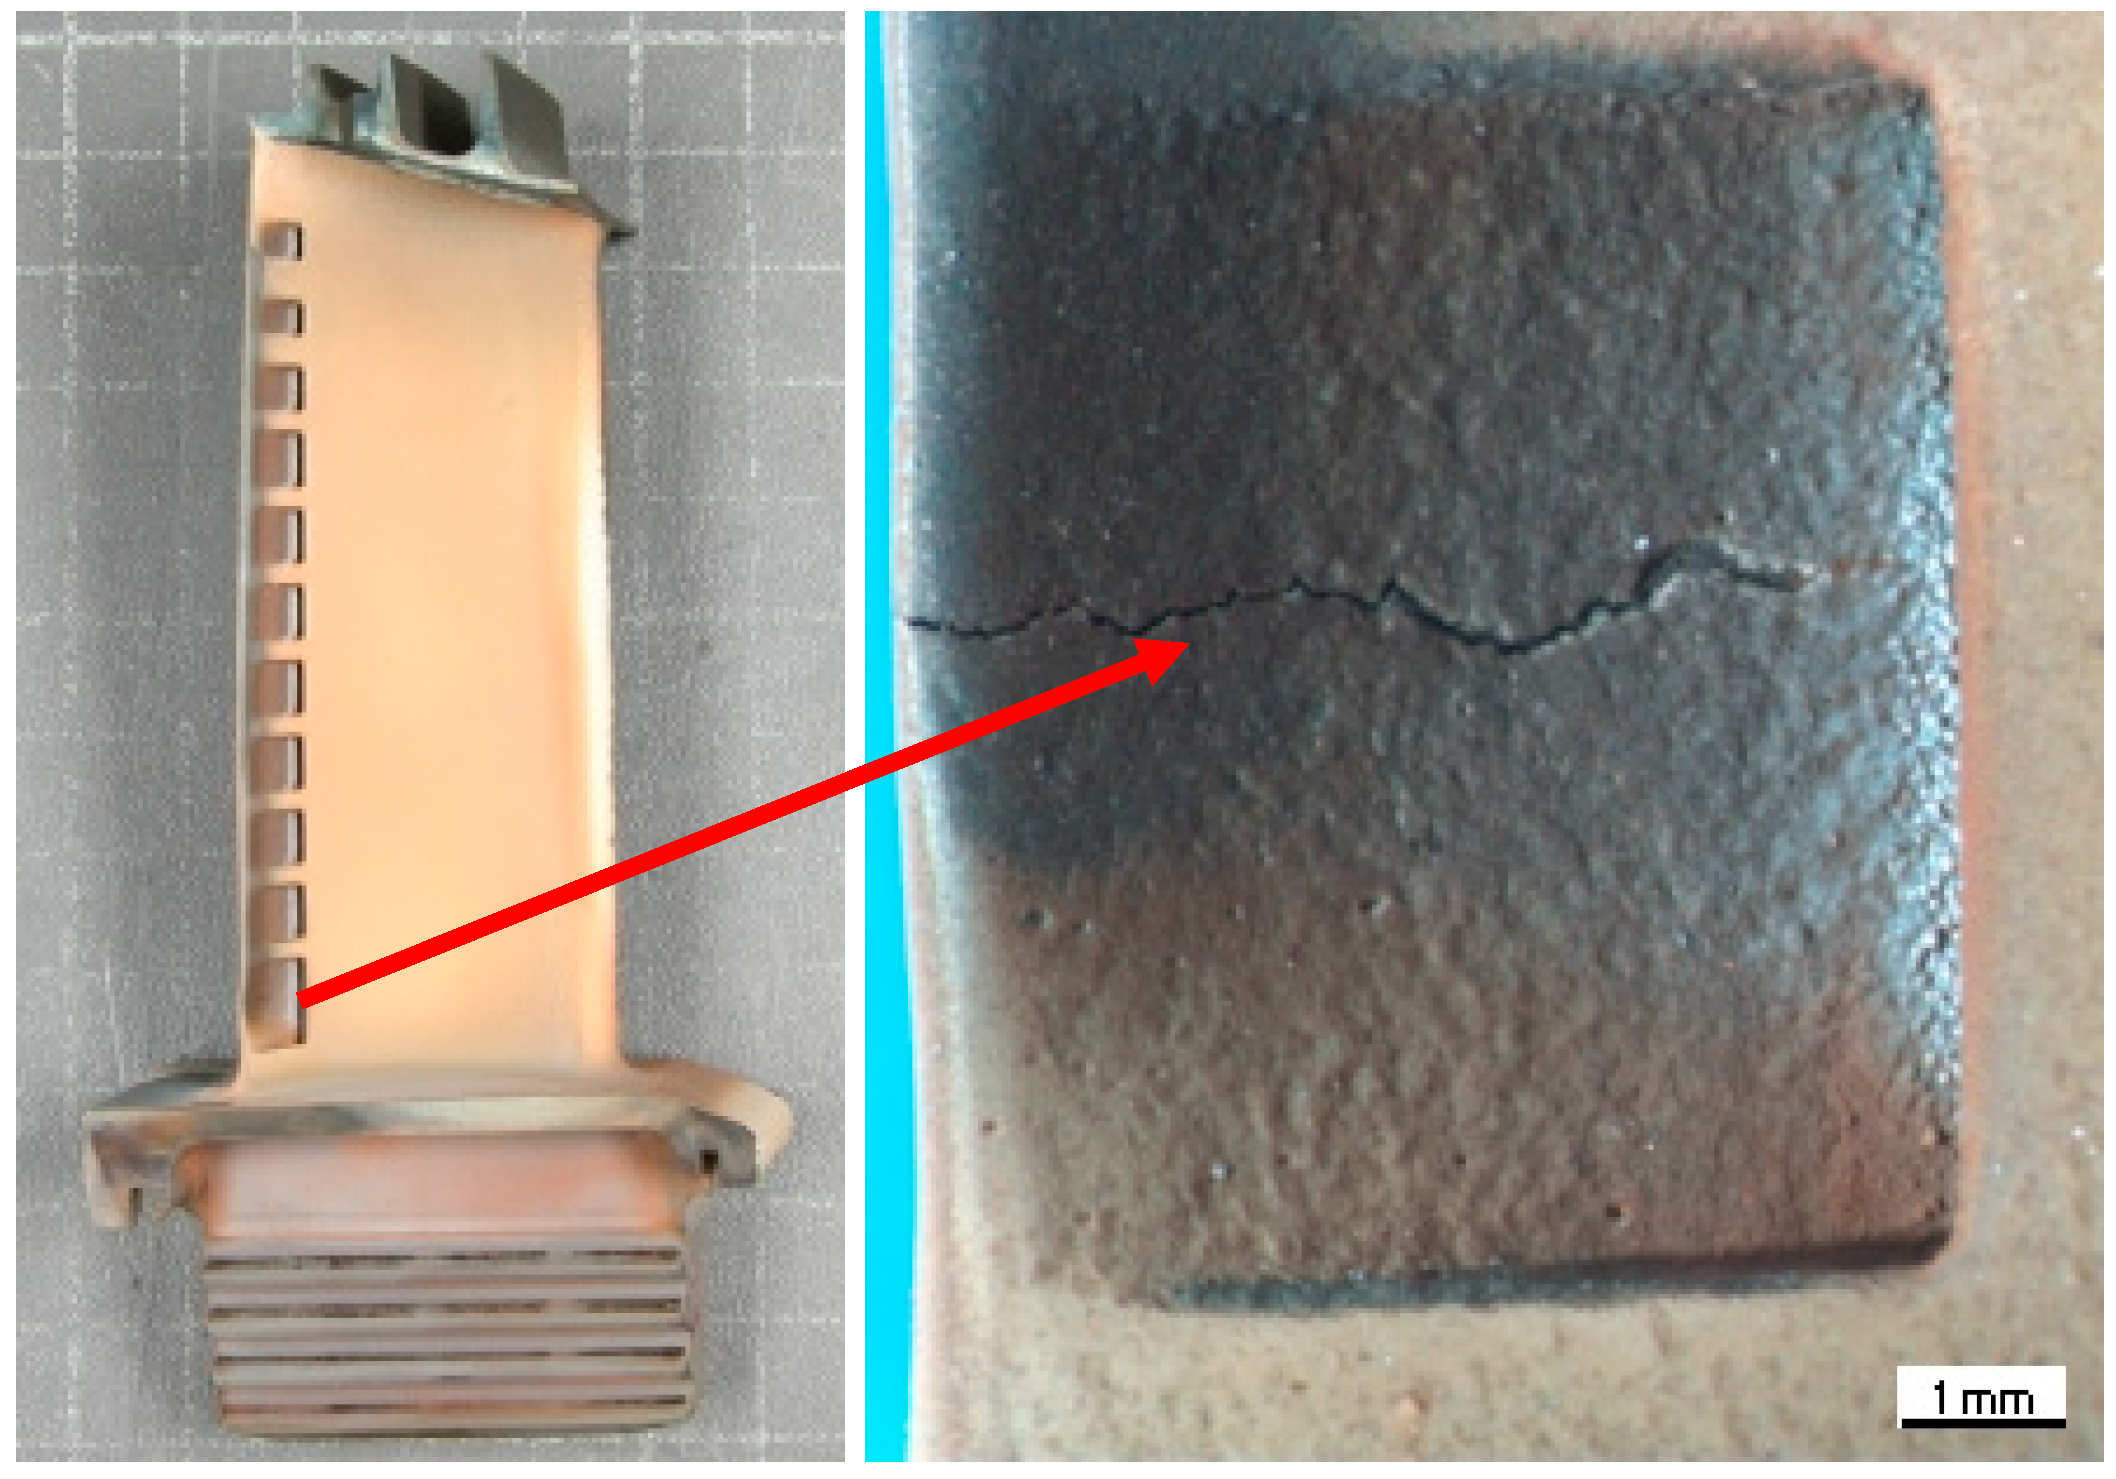
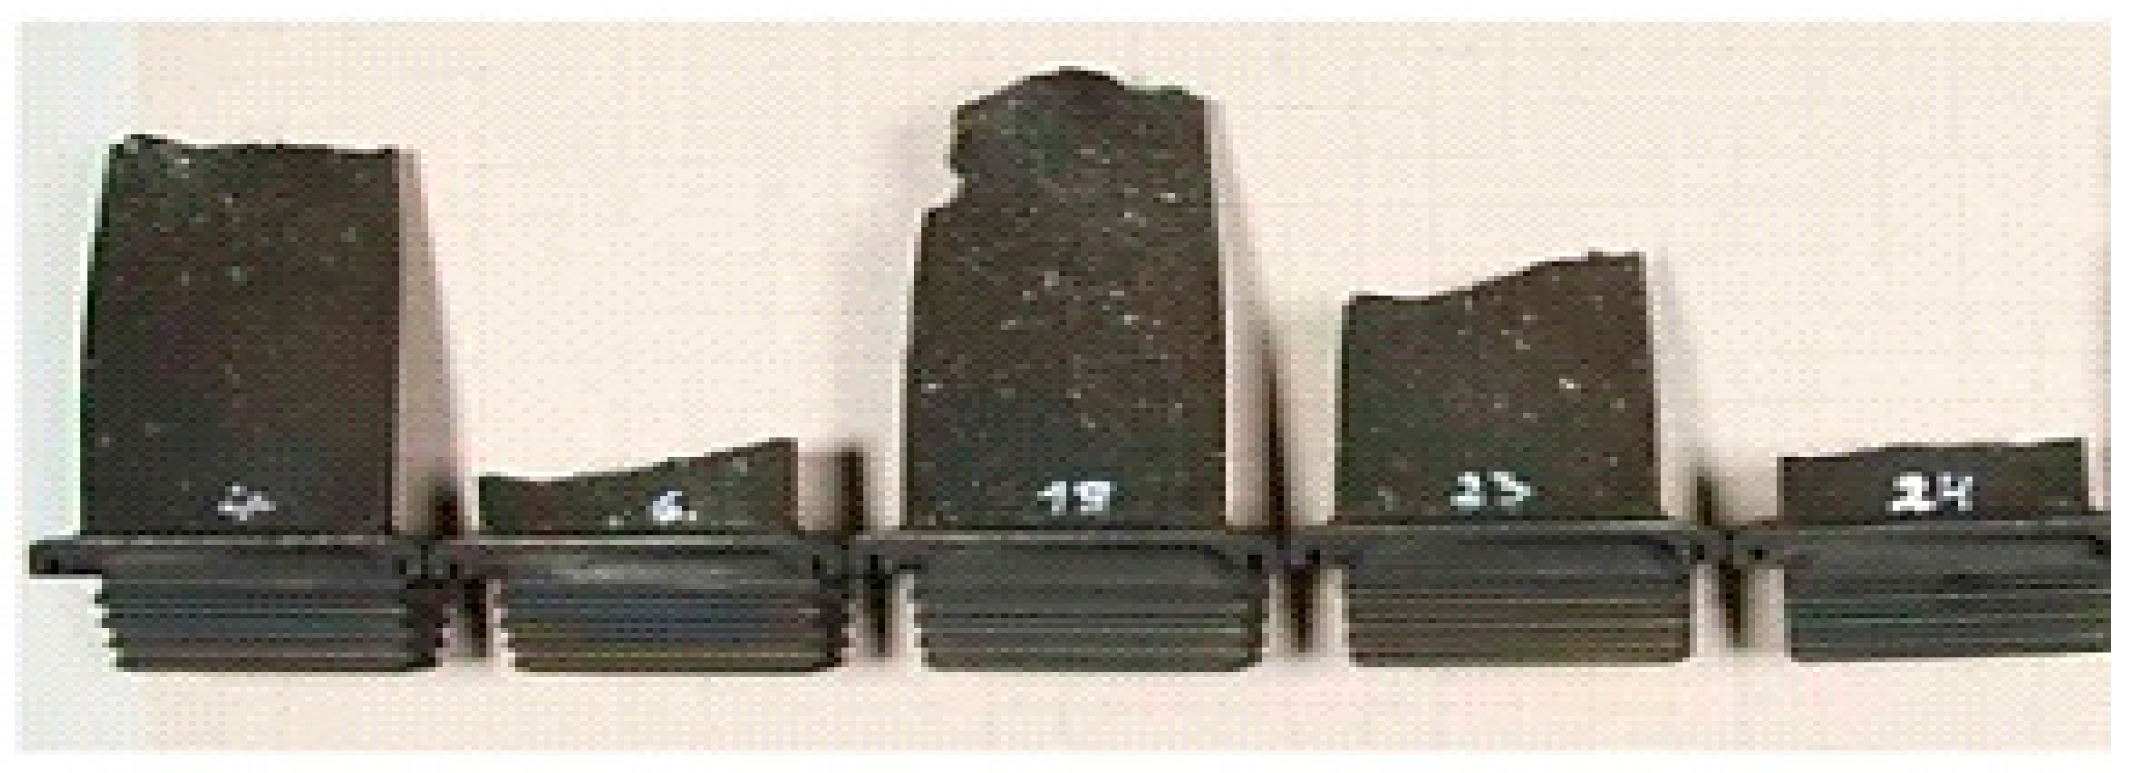
2. Failure Modes
3. Hot Gas Component Monitoring
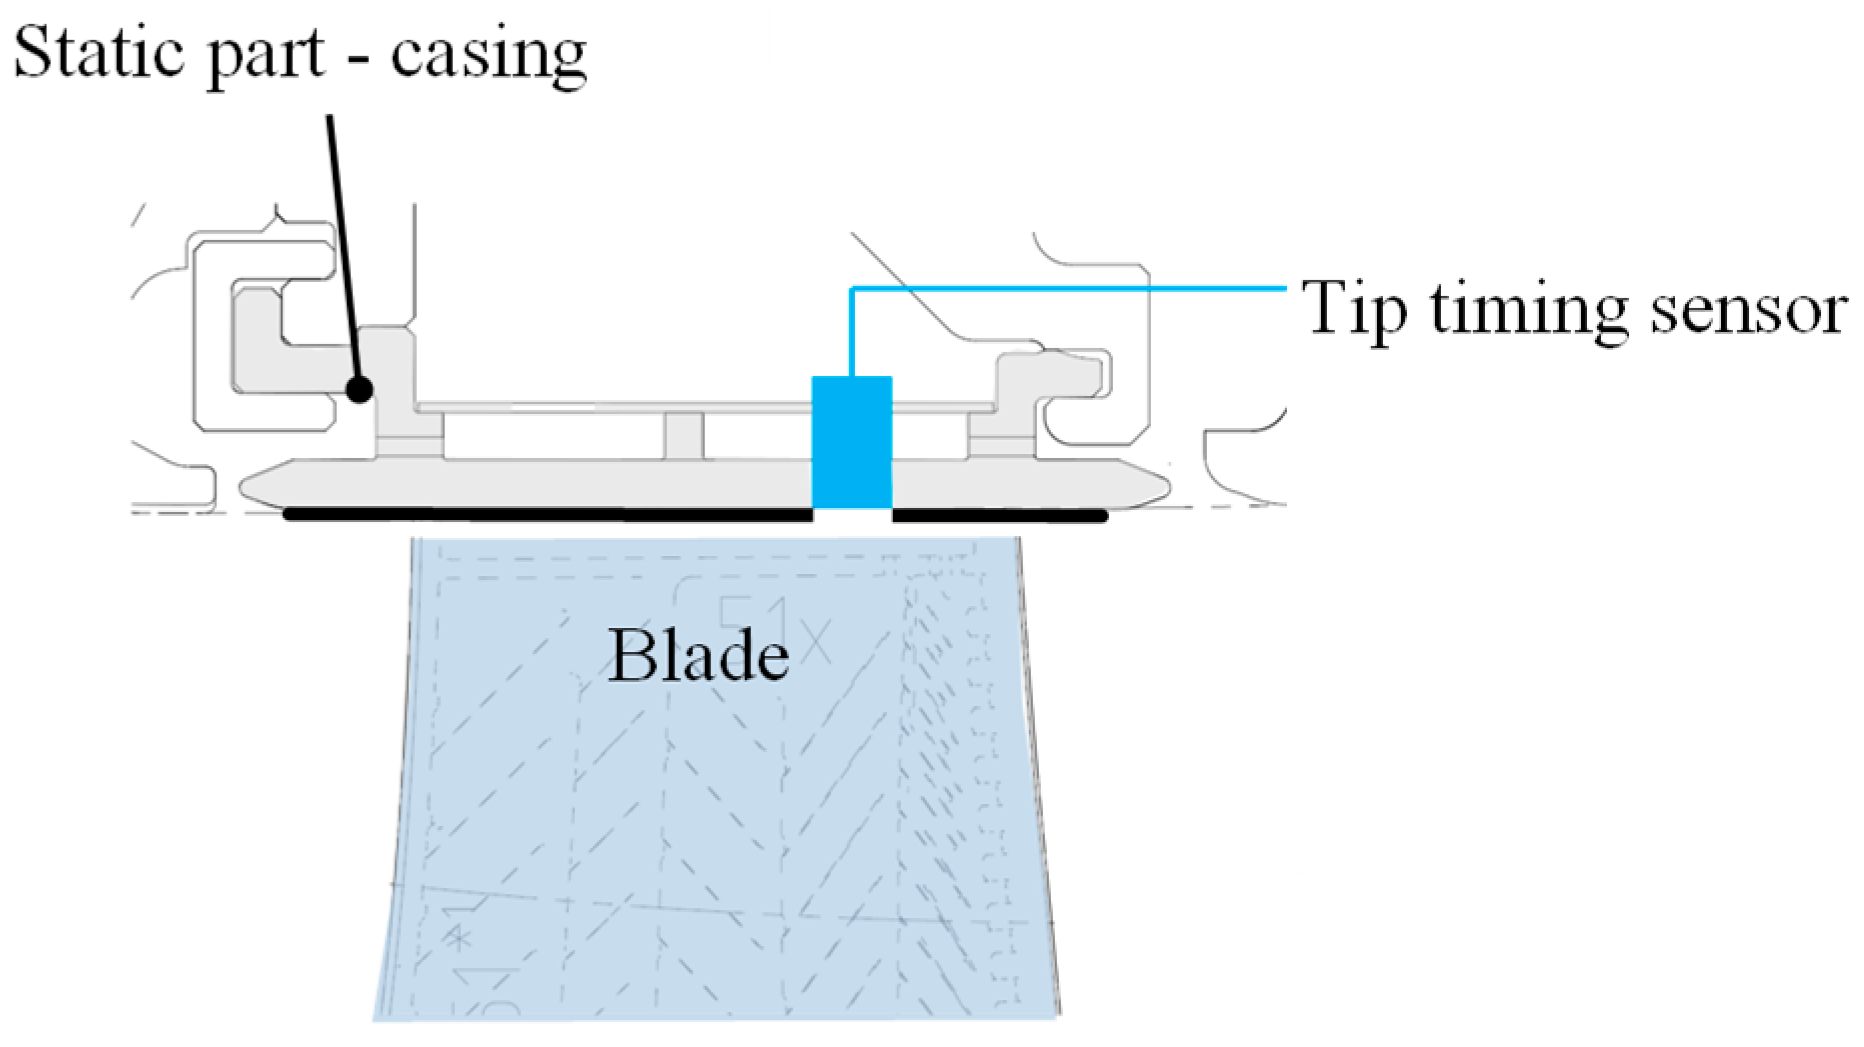
3.1. Tip Timing Method
- Crack detection
- Creep deflection
- Rubbing/wear
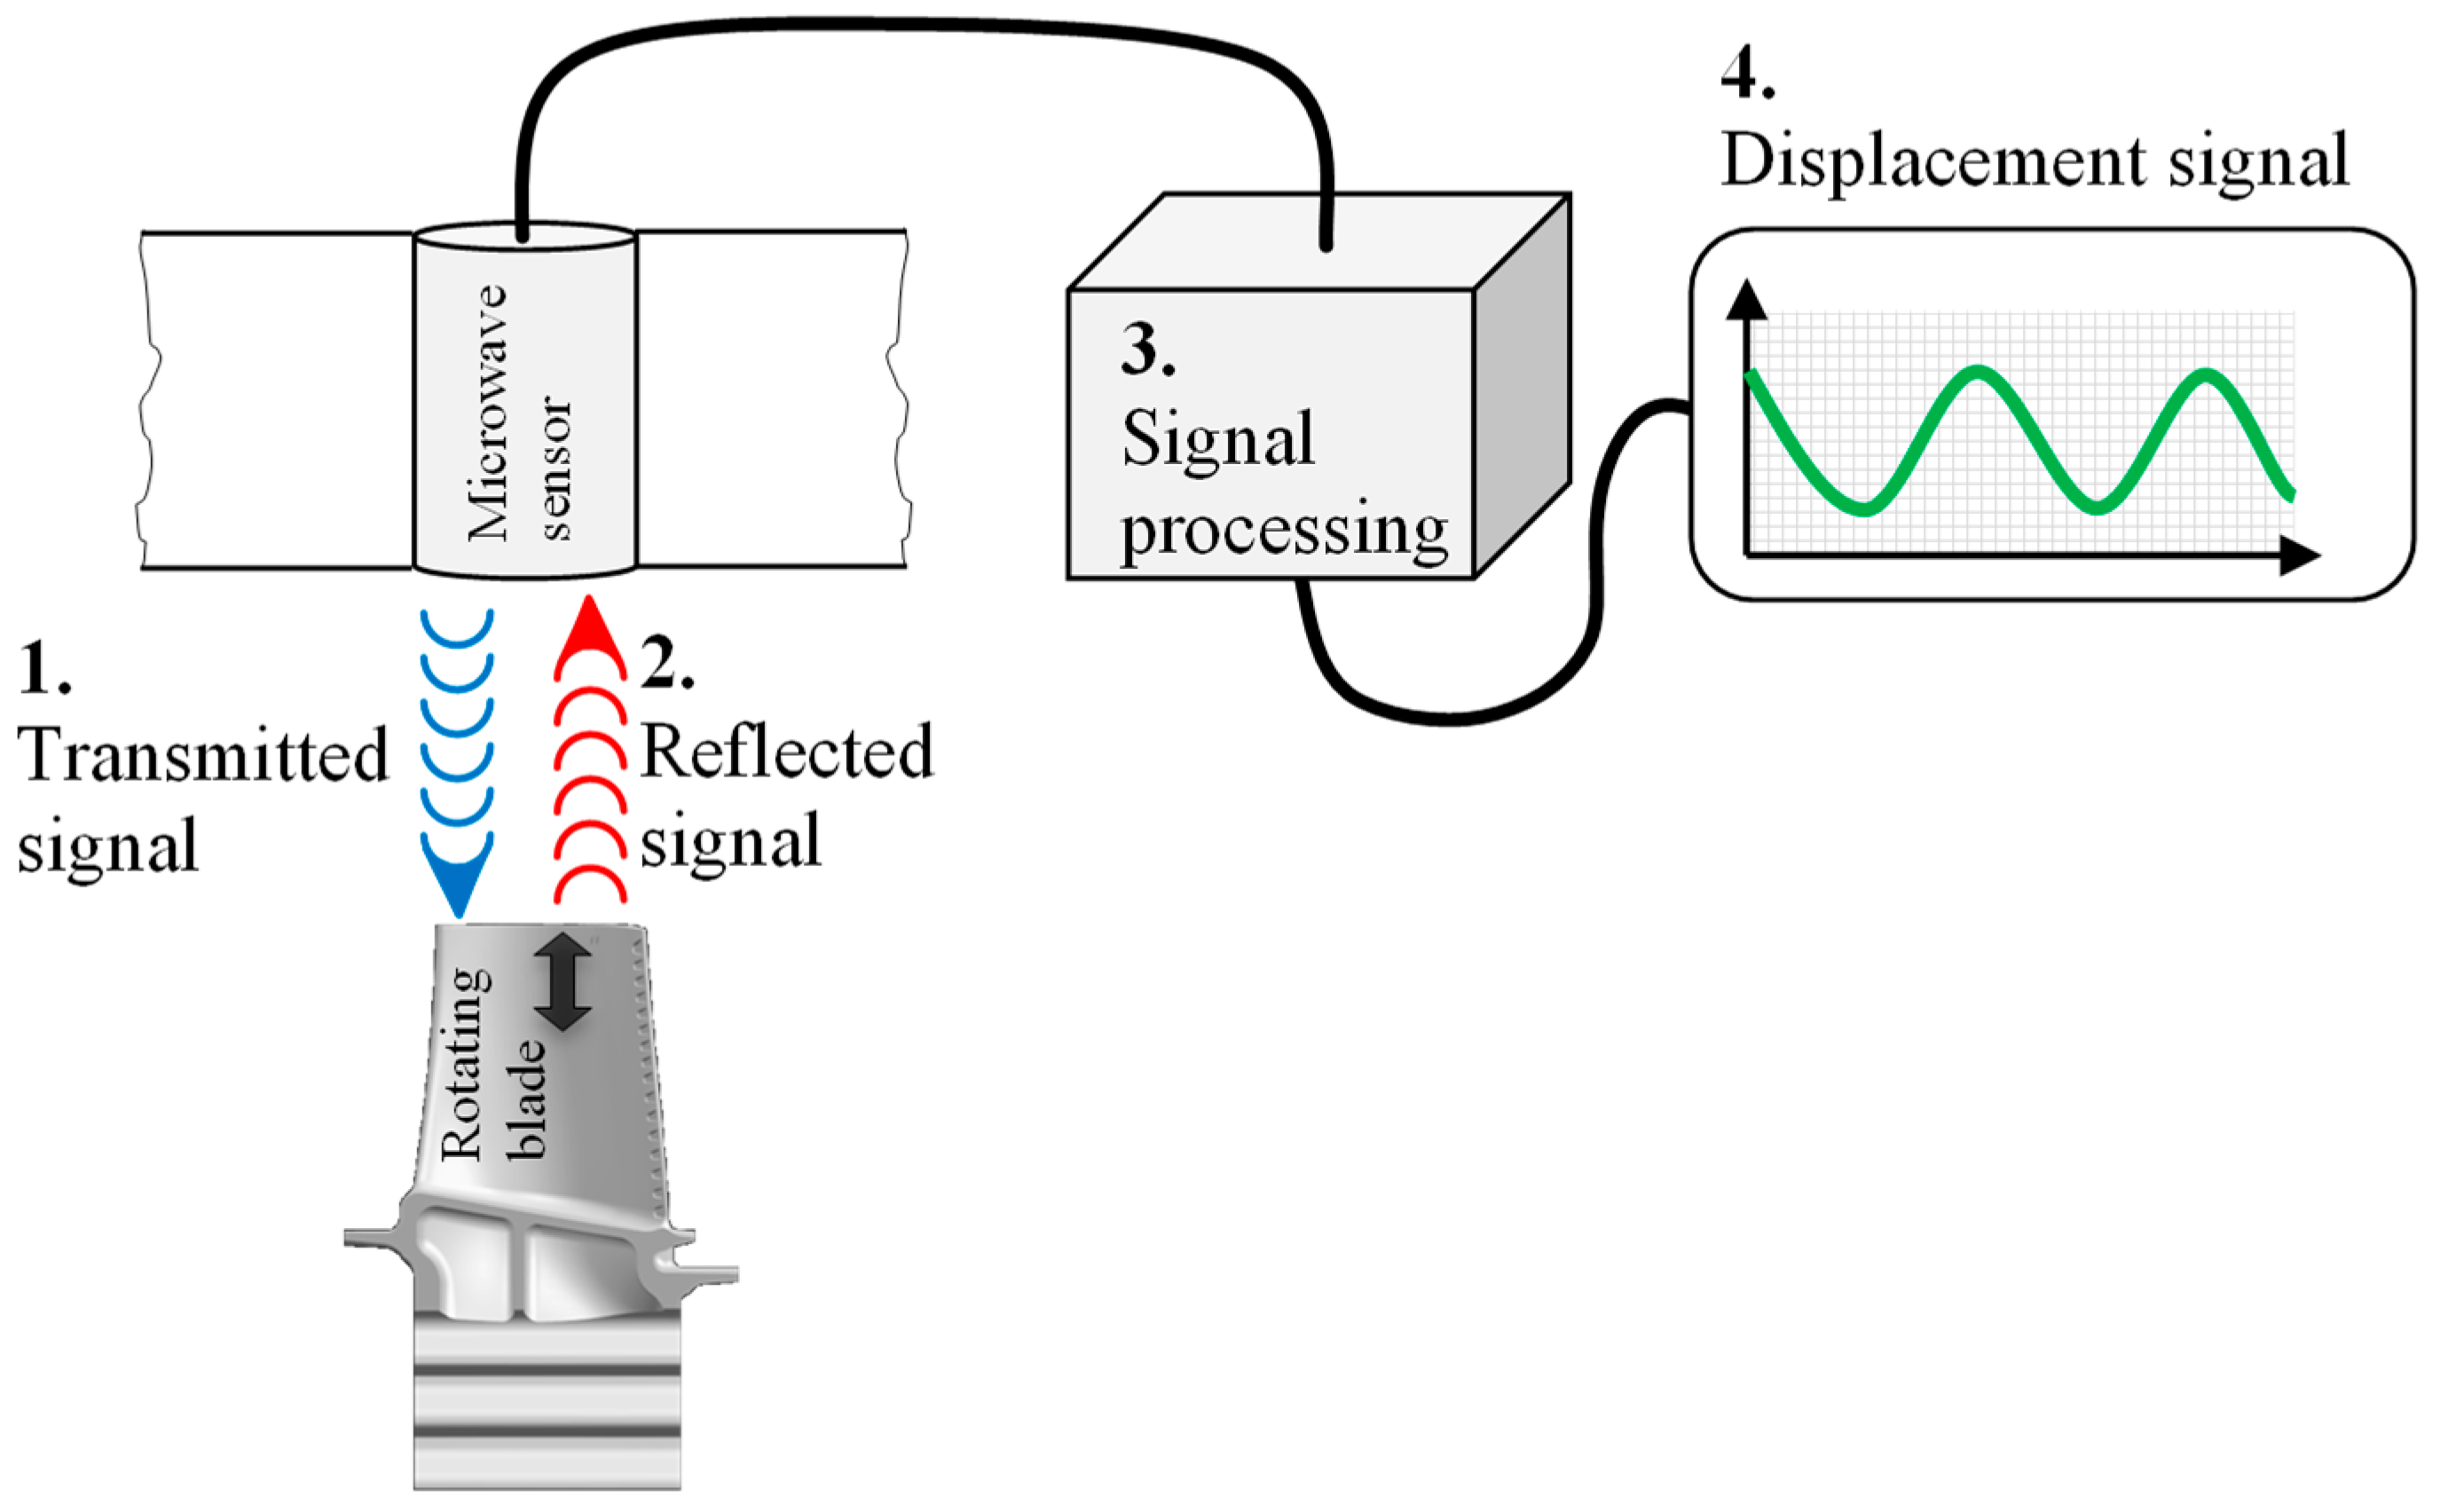
3.1.1. Microwave Probes
- Drifts in electronic component
- Sensor material (change due to temperature effect)
- Contamination of the probe
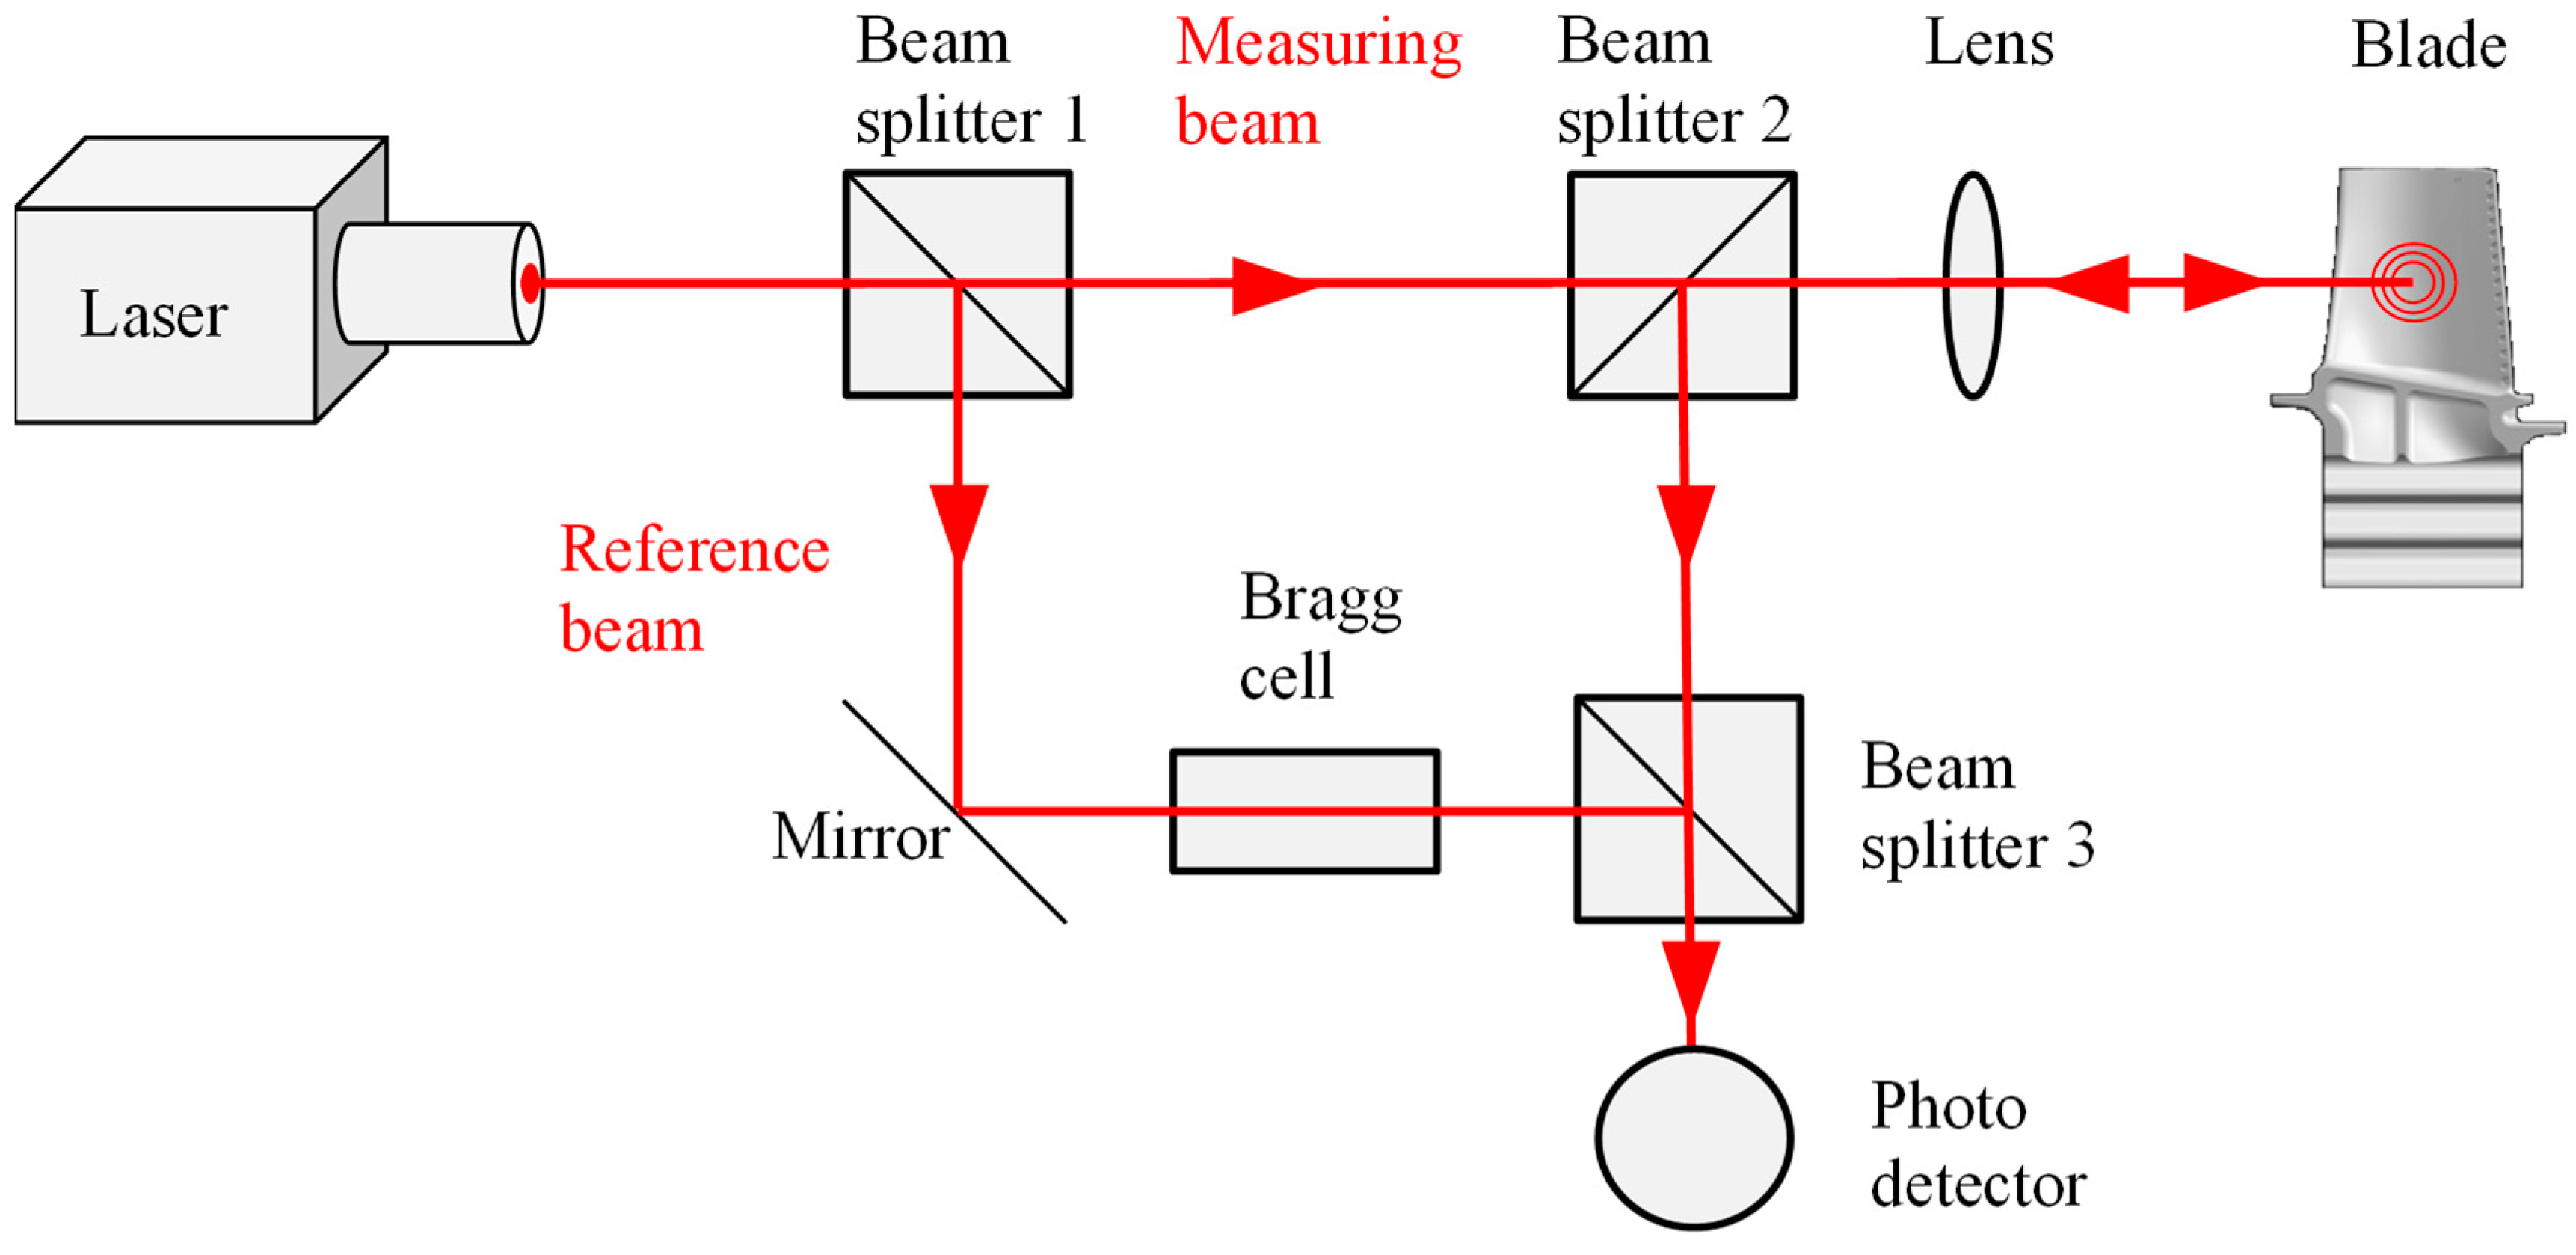
3.1.2. Optical Sensors
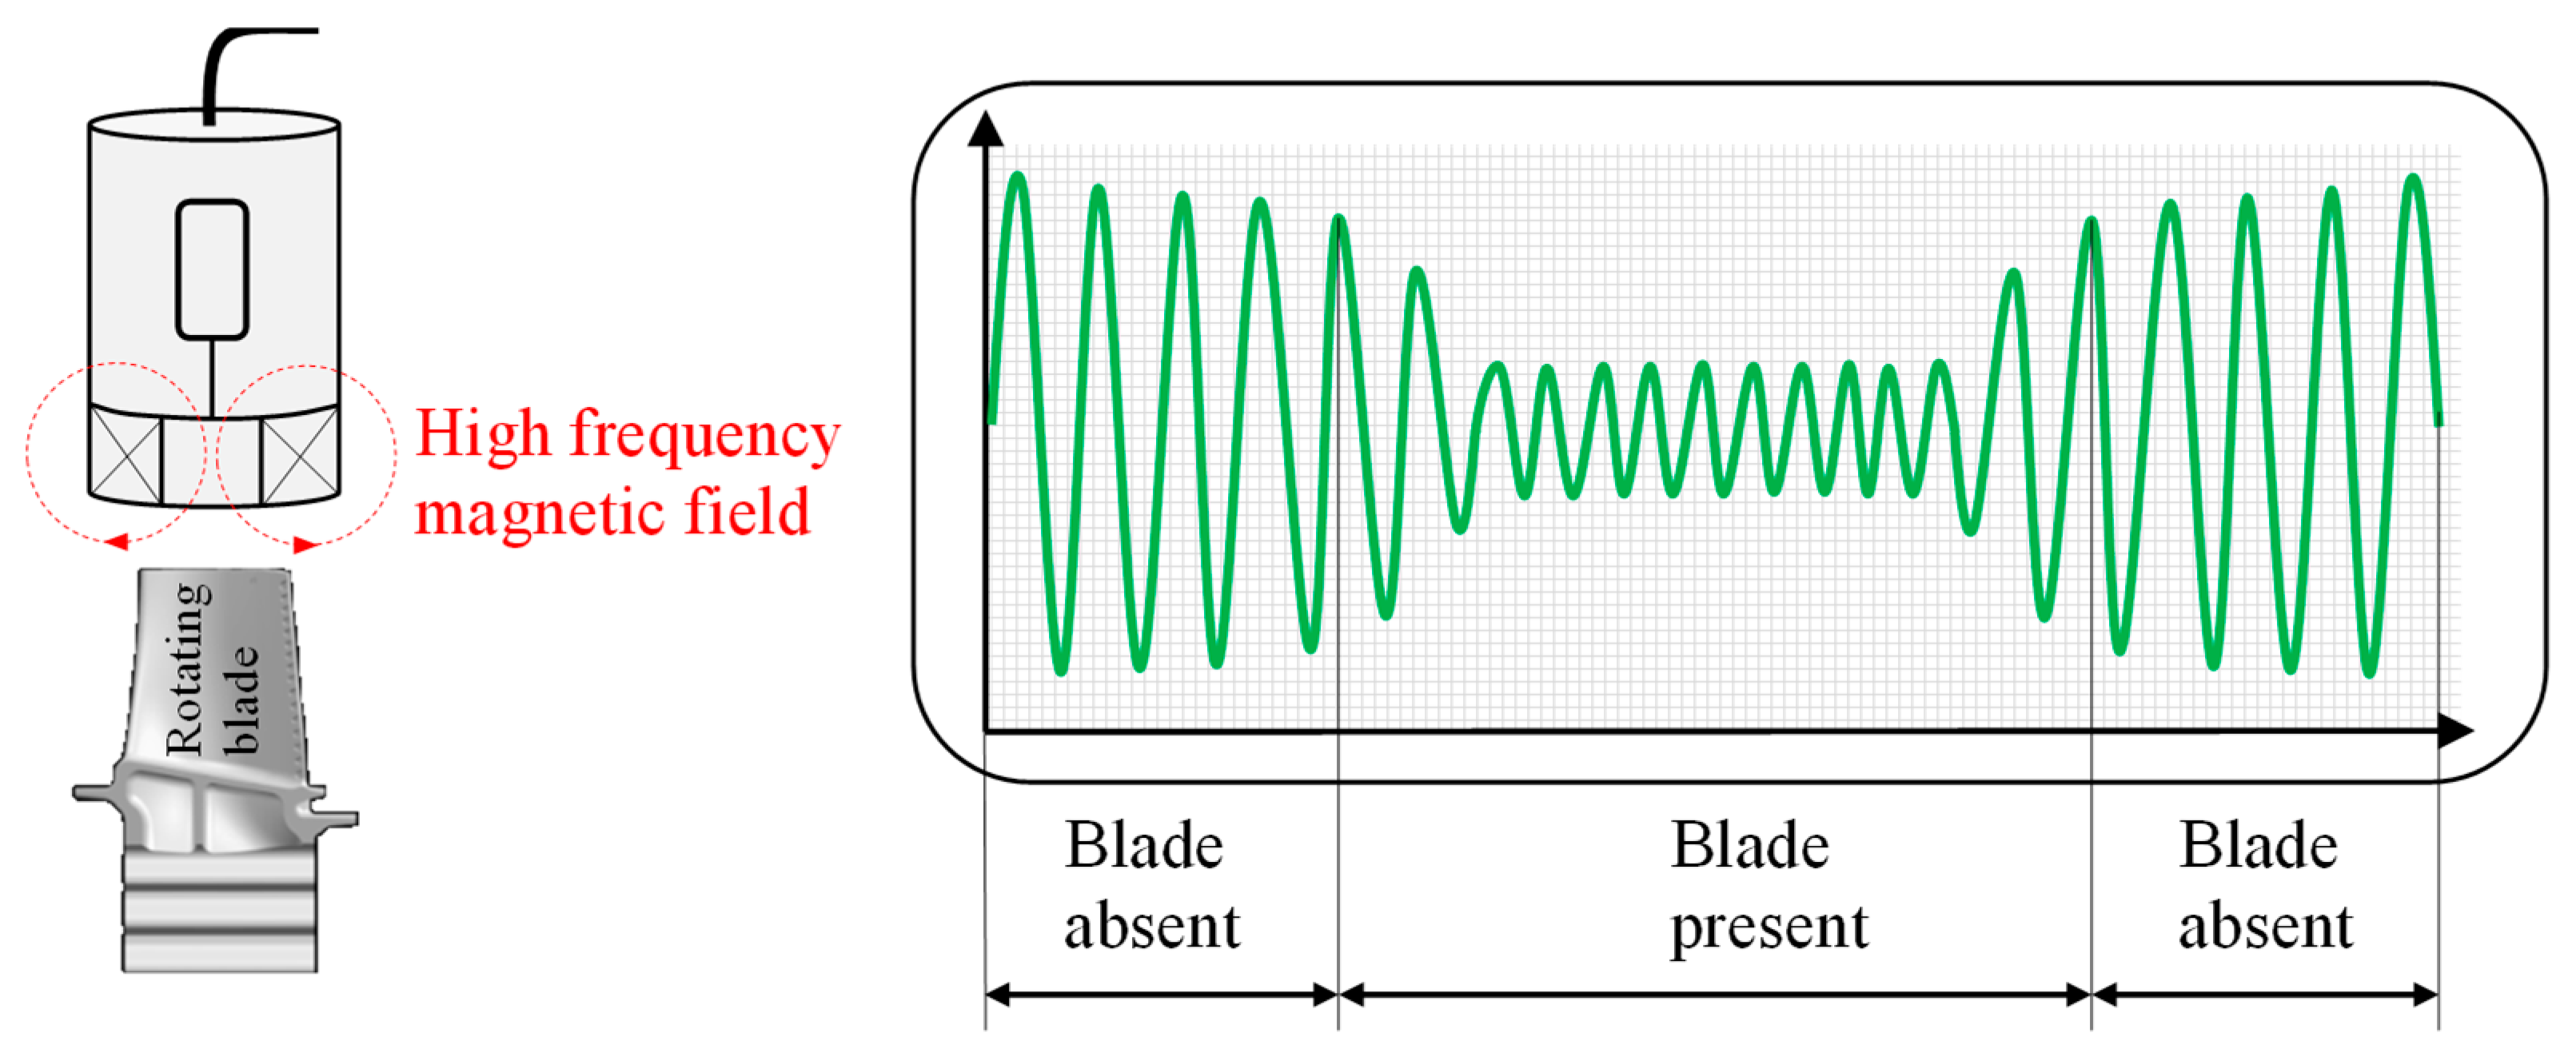
3.1.3. Inductive Sensors
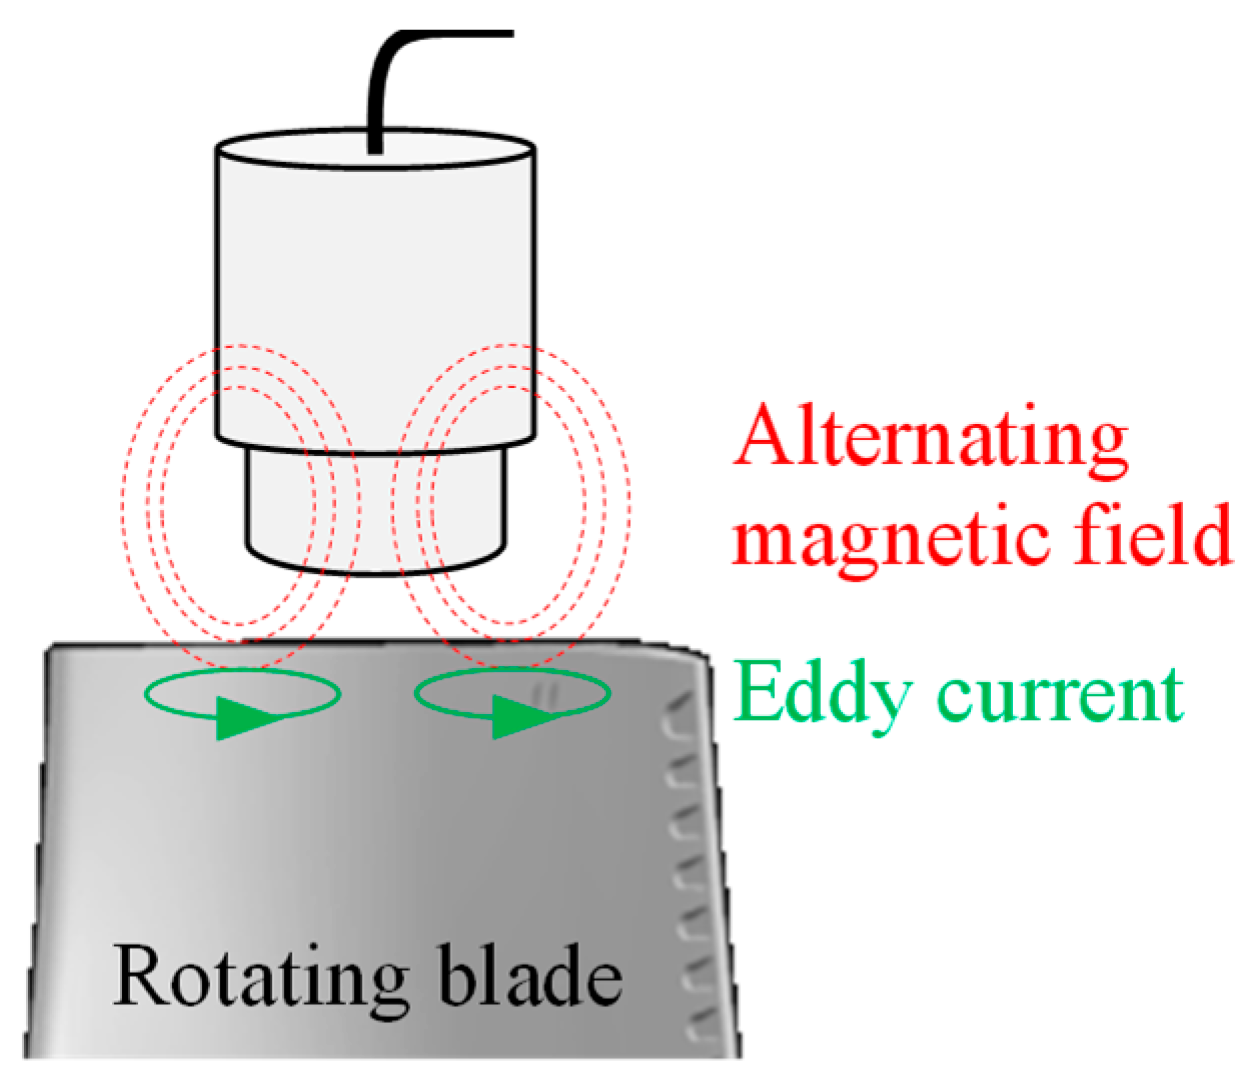
3.1.4. Eddy Current Sensors
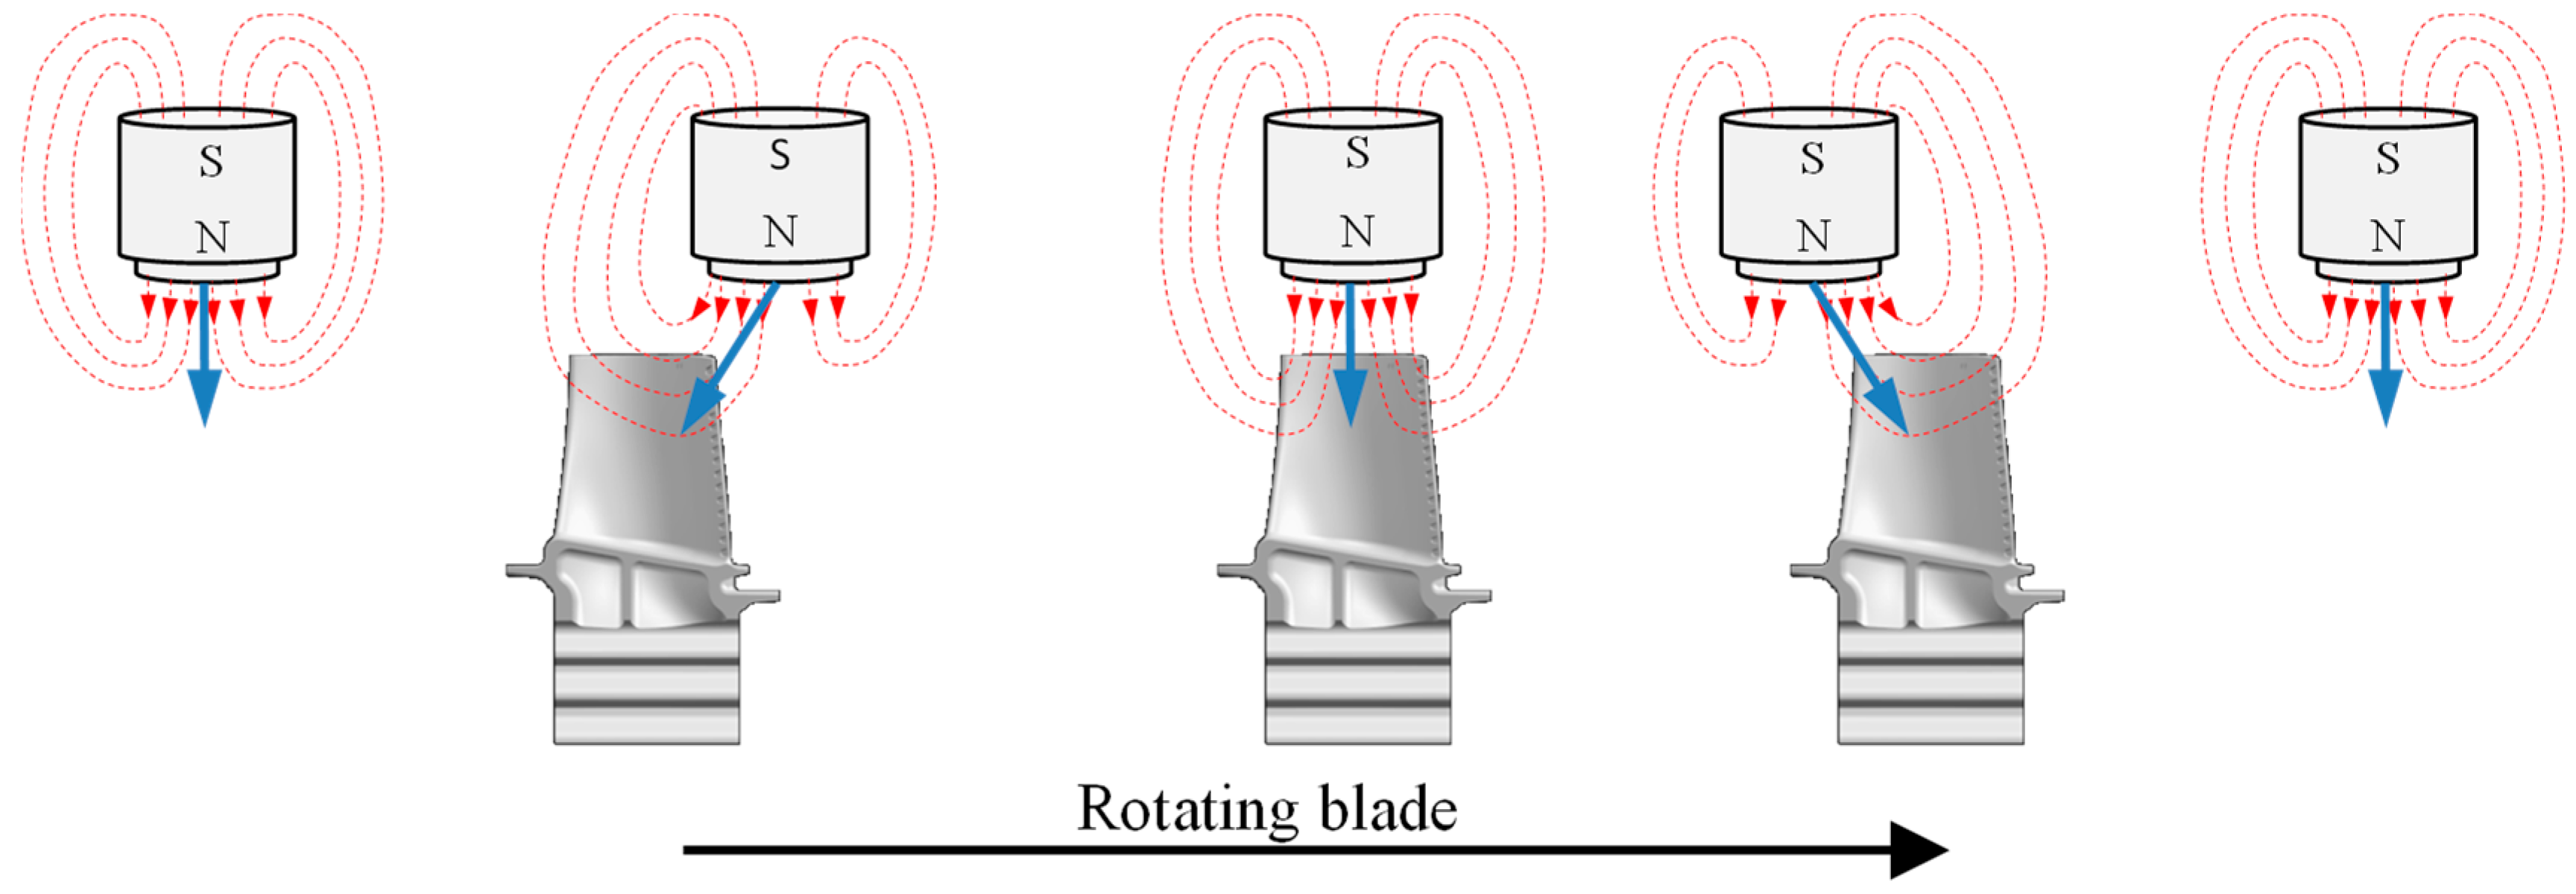
3.1.5. Magnetoresistive Sensors
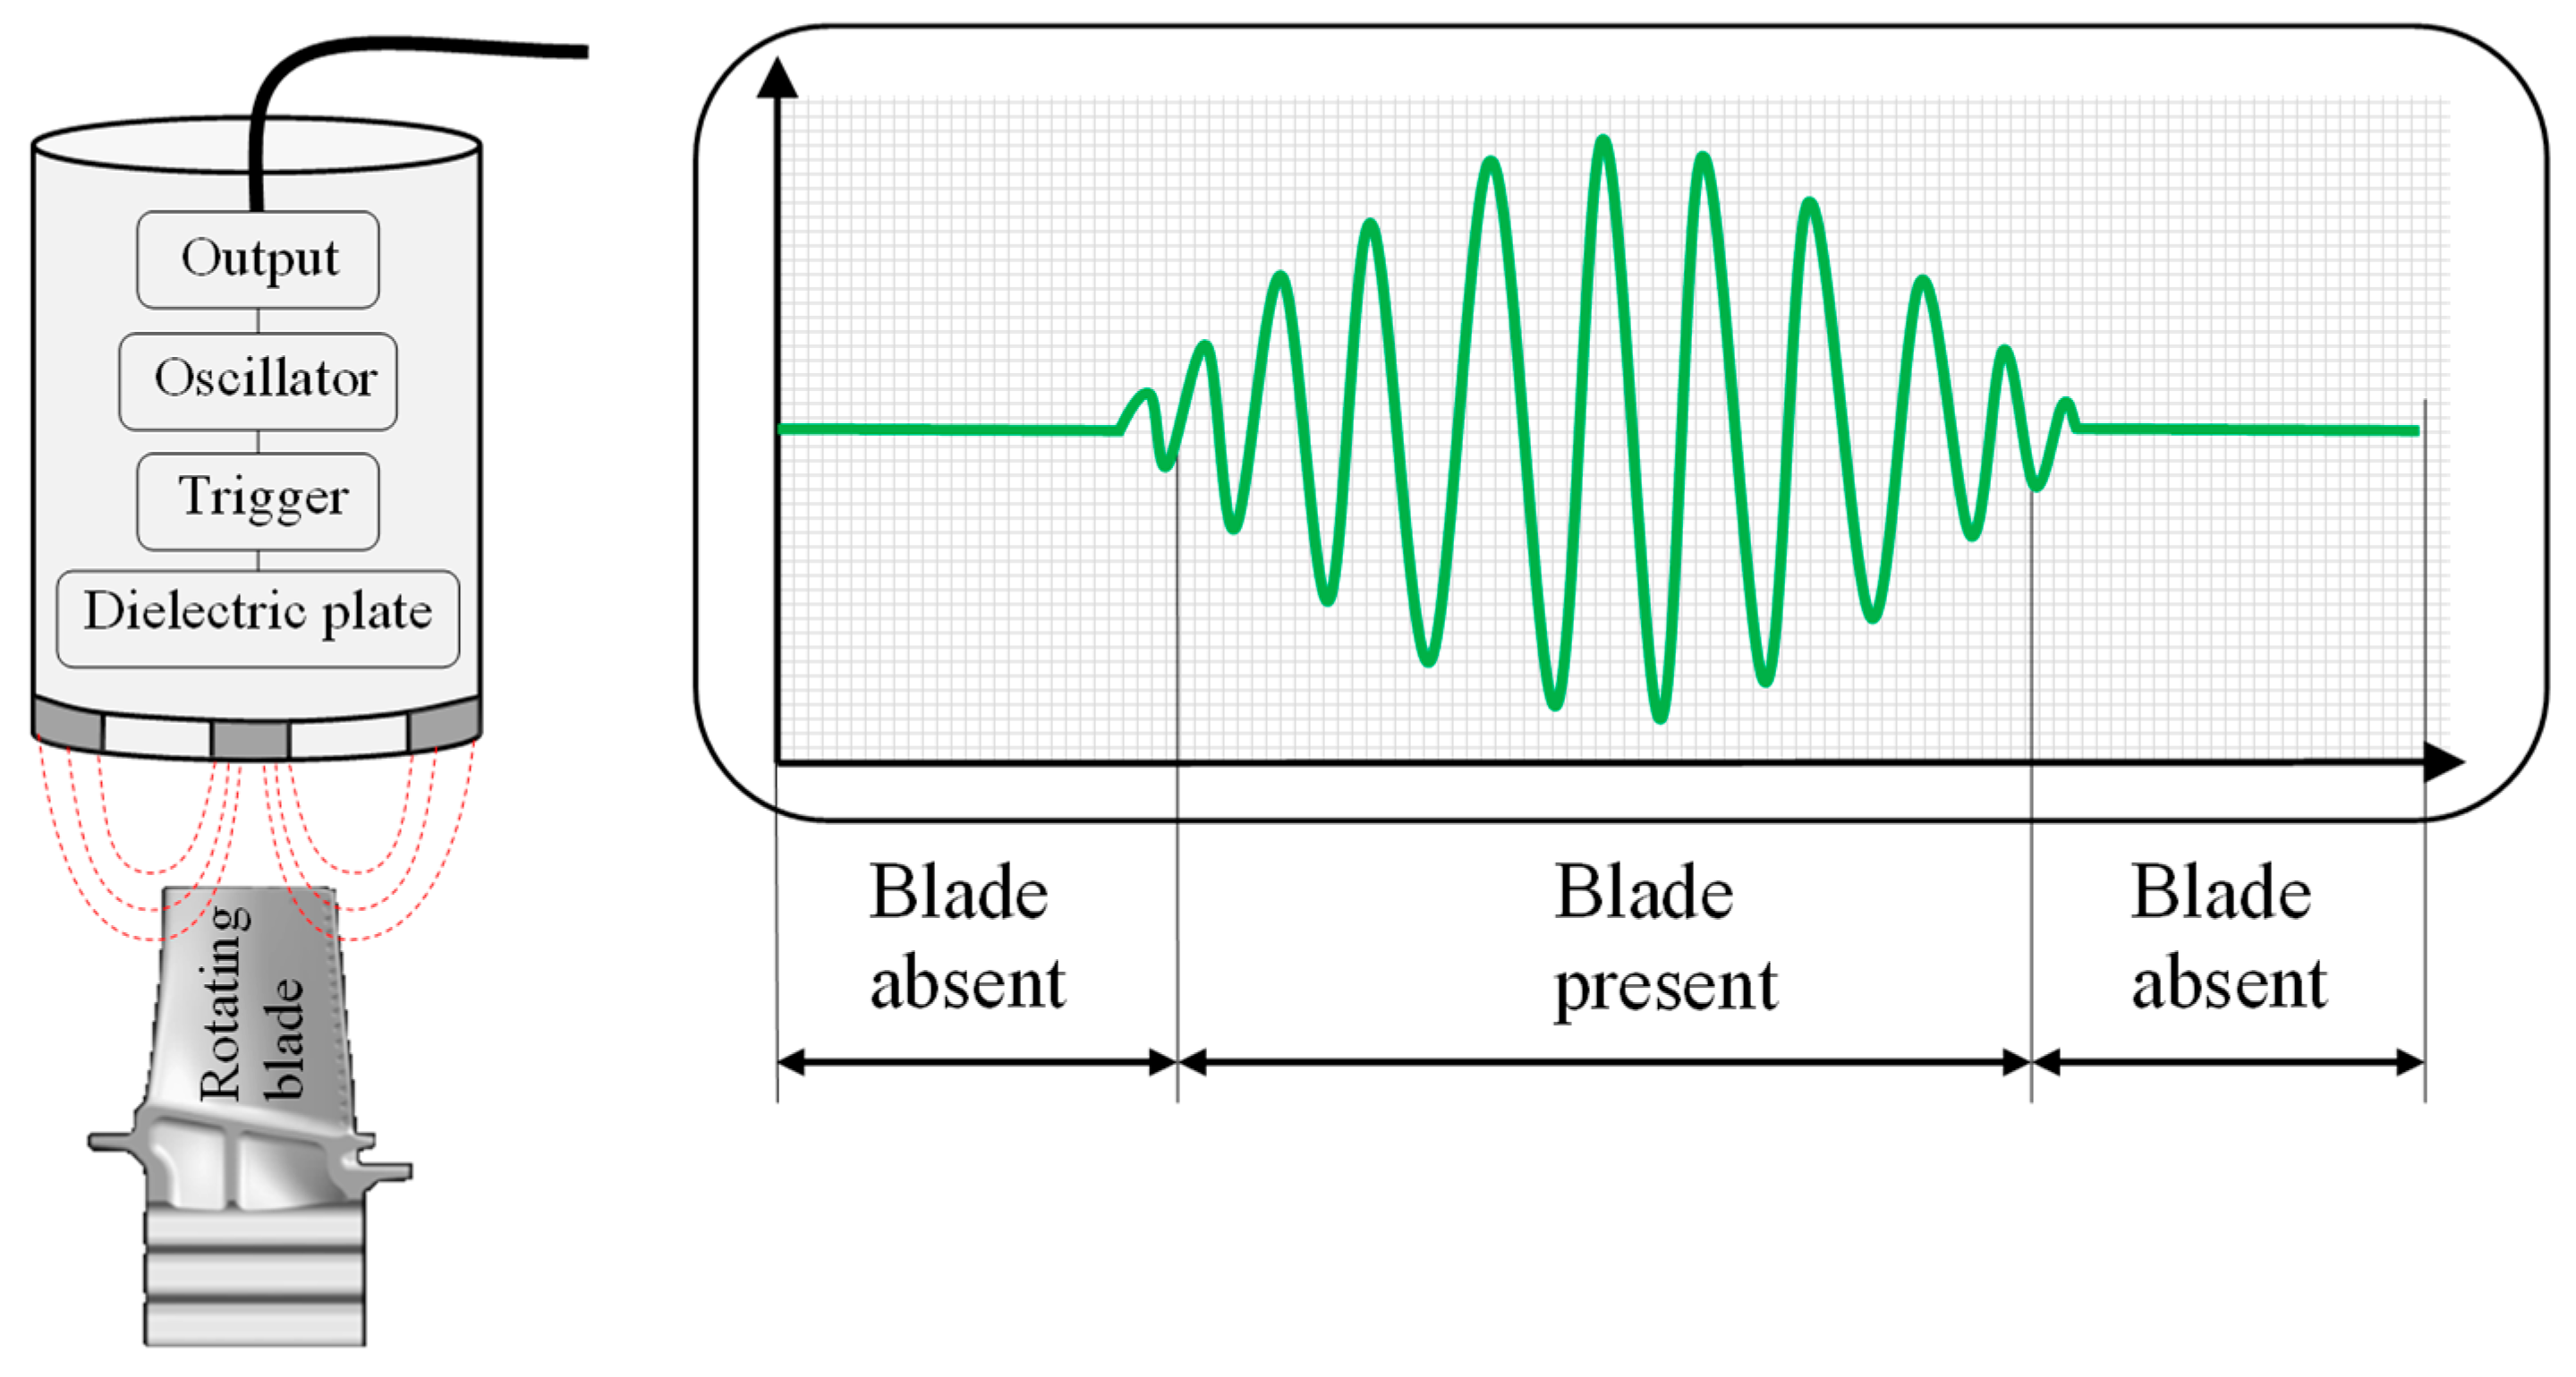
3.1.6. Capacitance Sensors
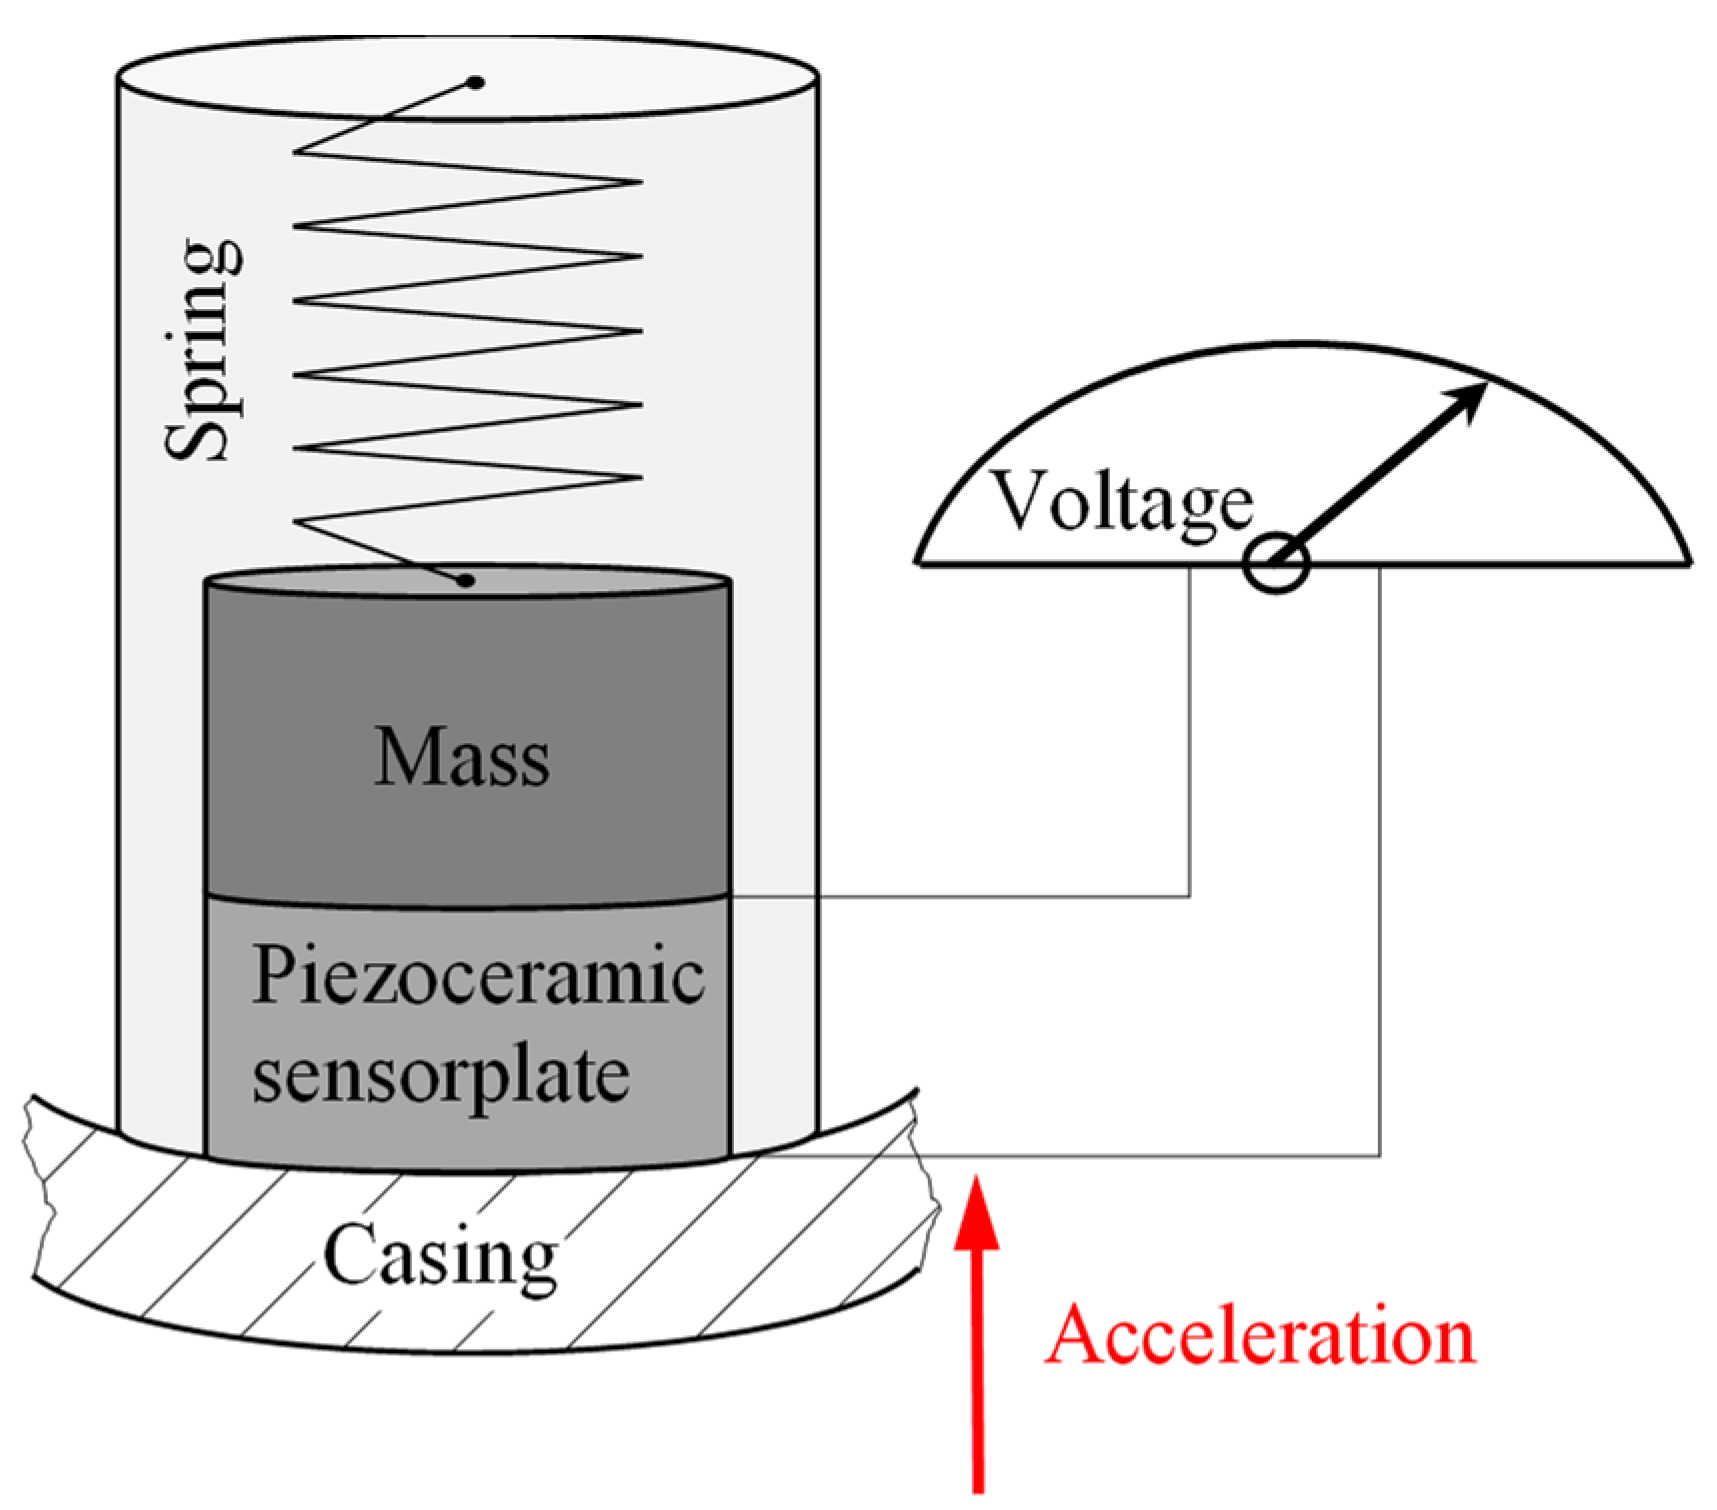
3.2. Vibrational Monitoring
3.3. Ultrasound
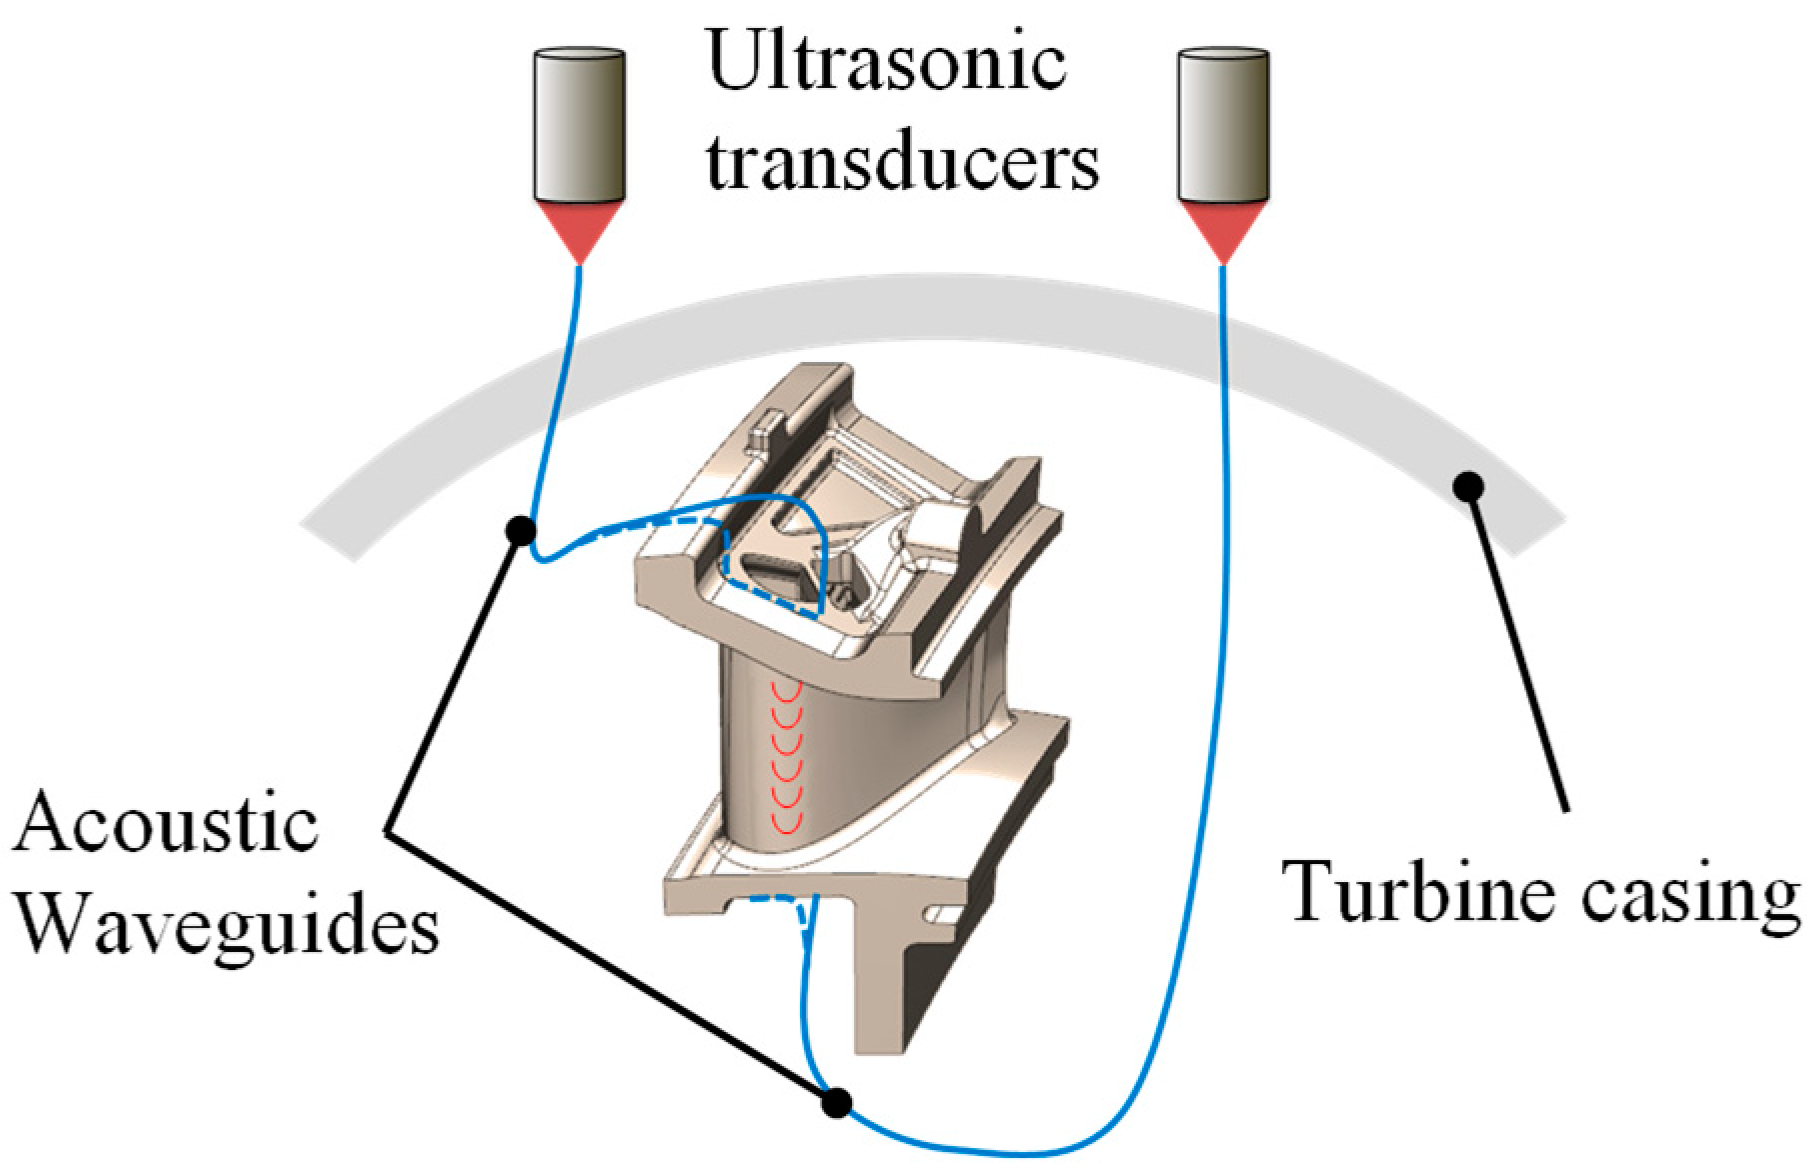
3.3.1. Waveguides
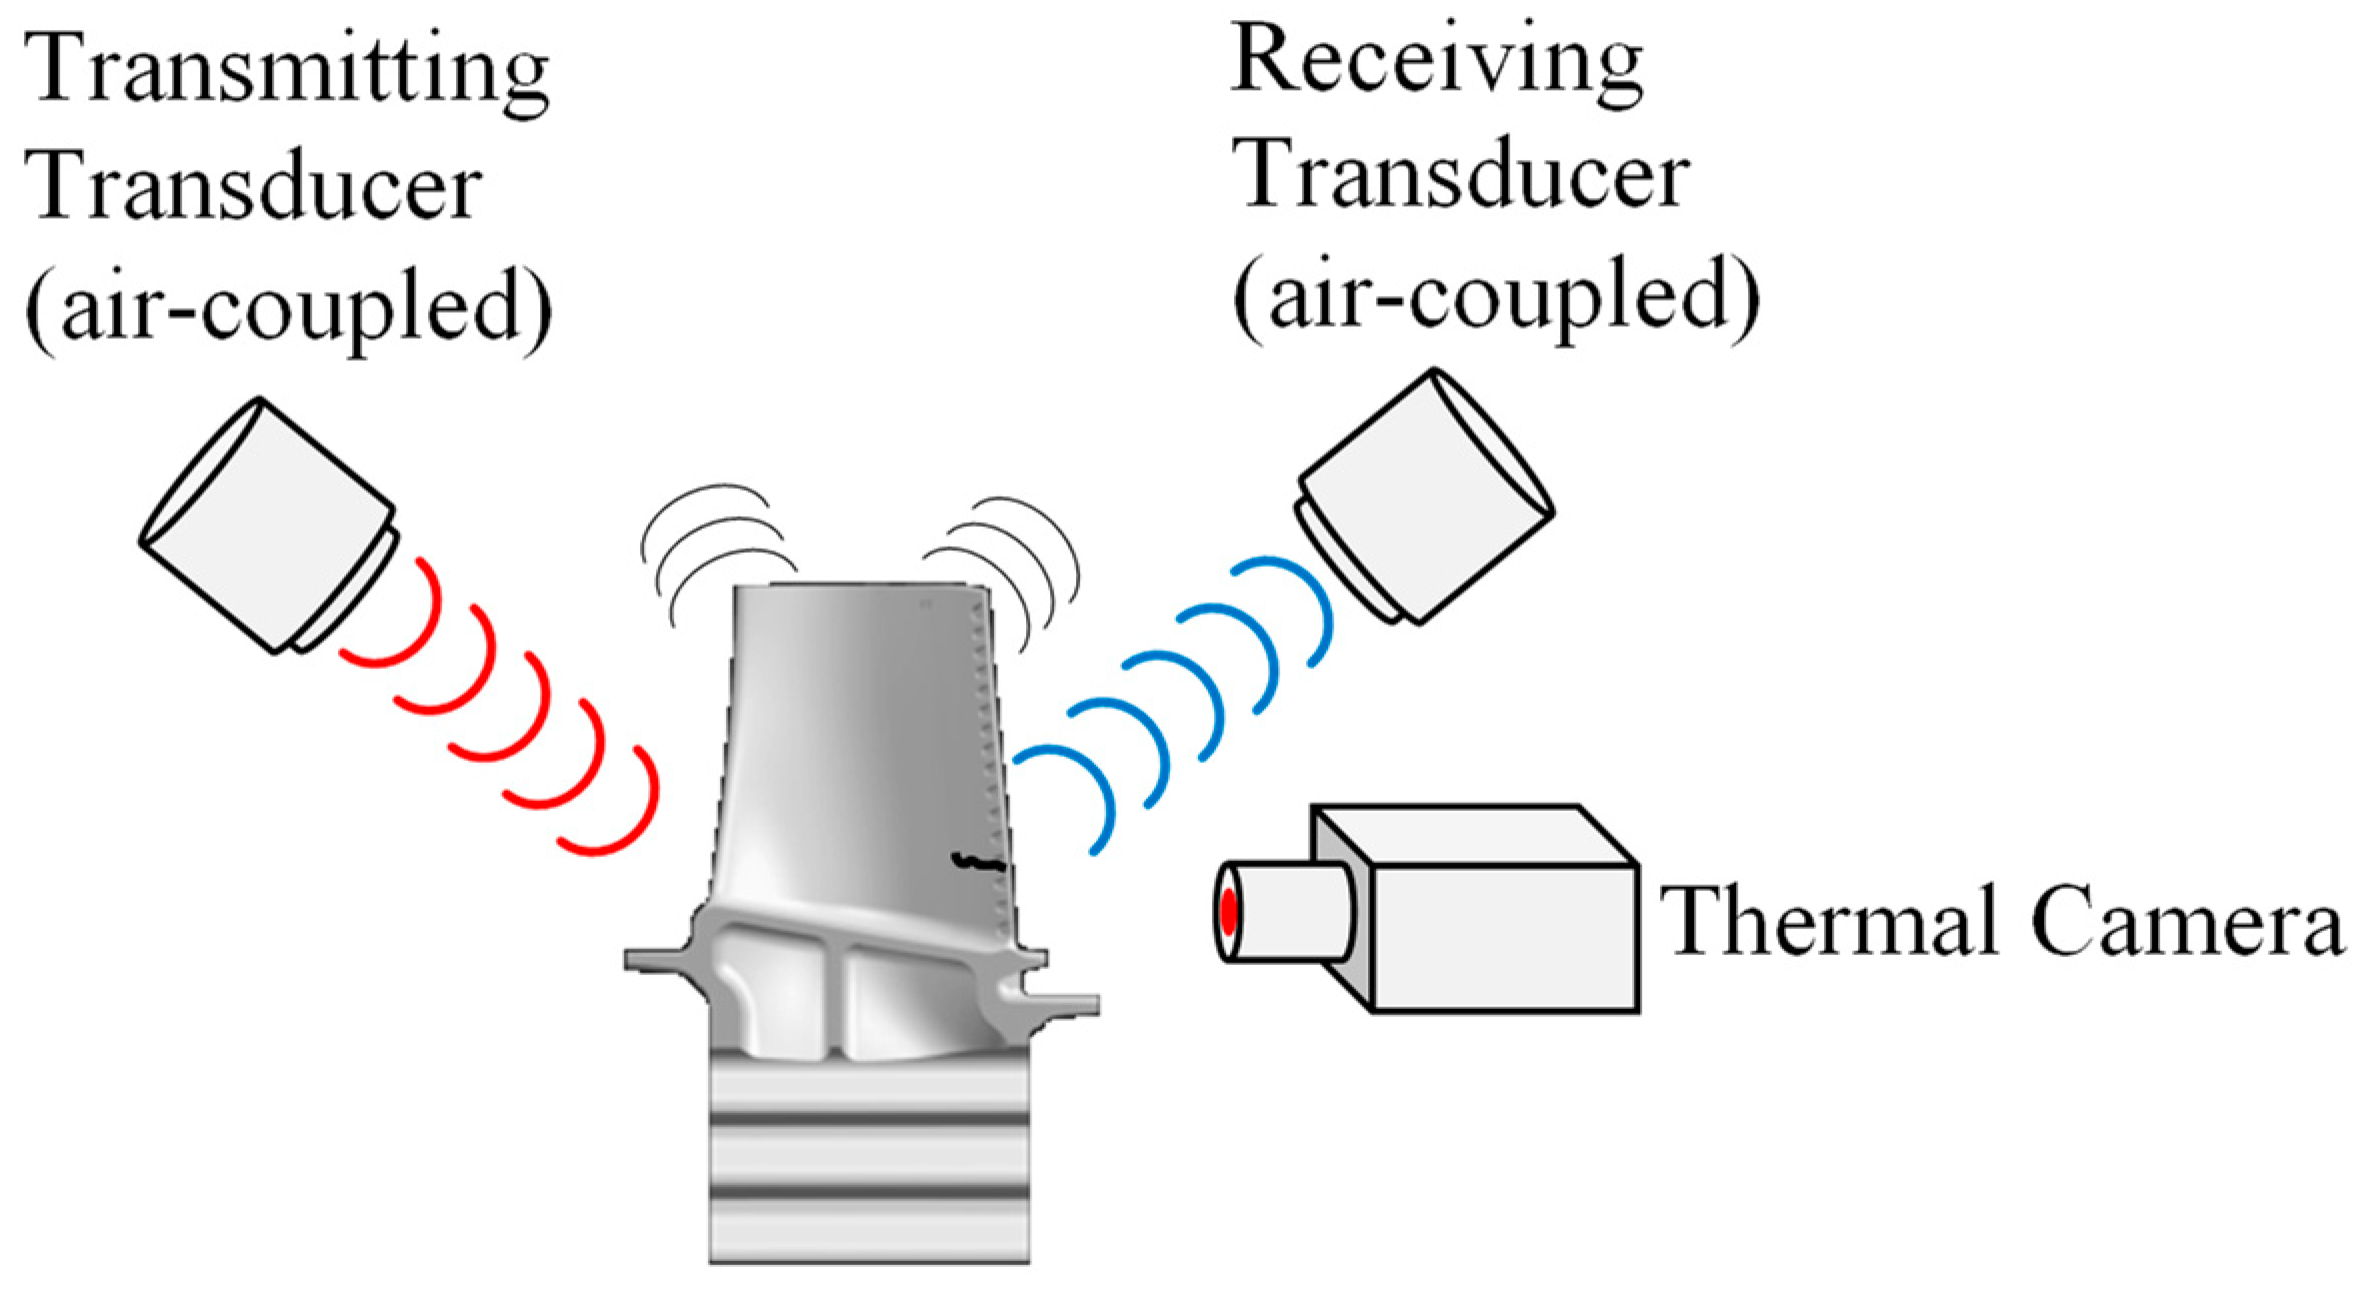
3.3.2. Thermosonic or Ultrasonic Stimulated Thermography
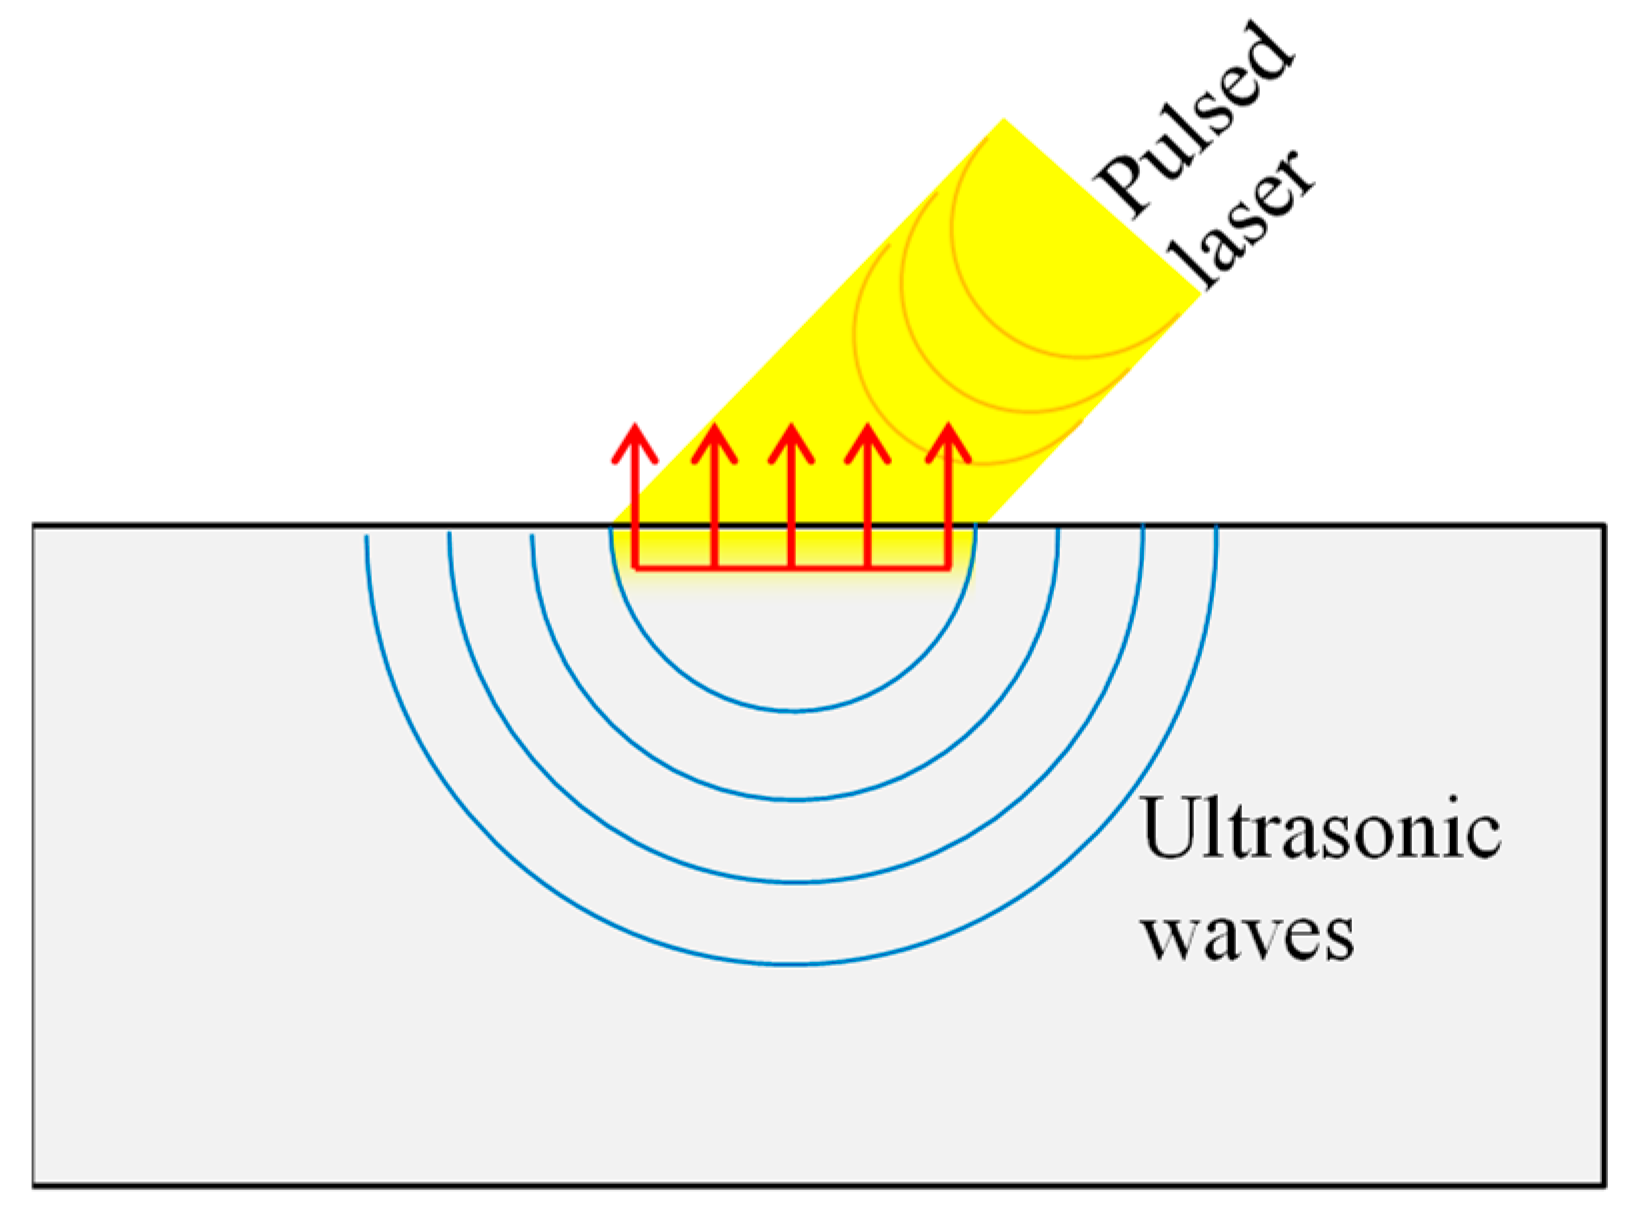
3.3.3. Laser Ultrasonic
3.3.4. High Temperature Transducers
3.3.5. EMAT
3.4. Temperature Measurements
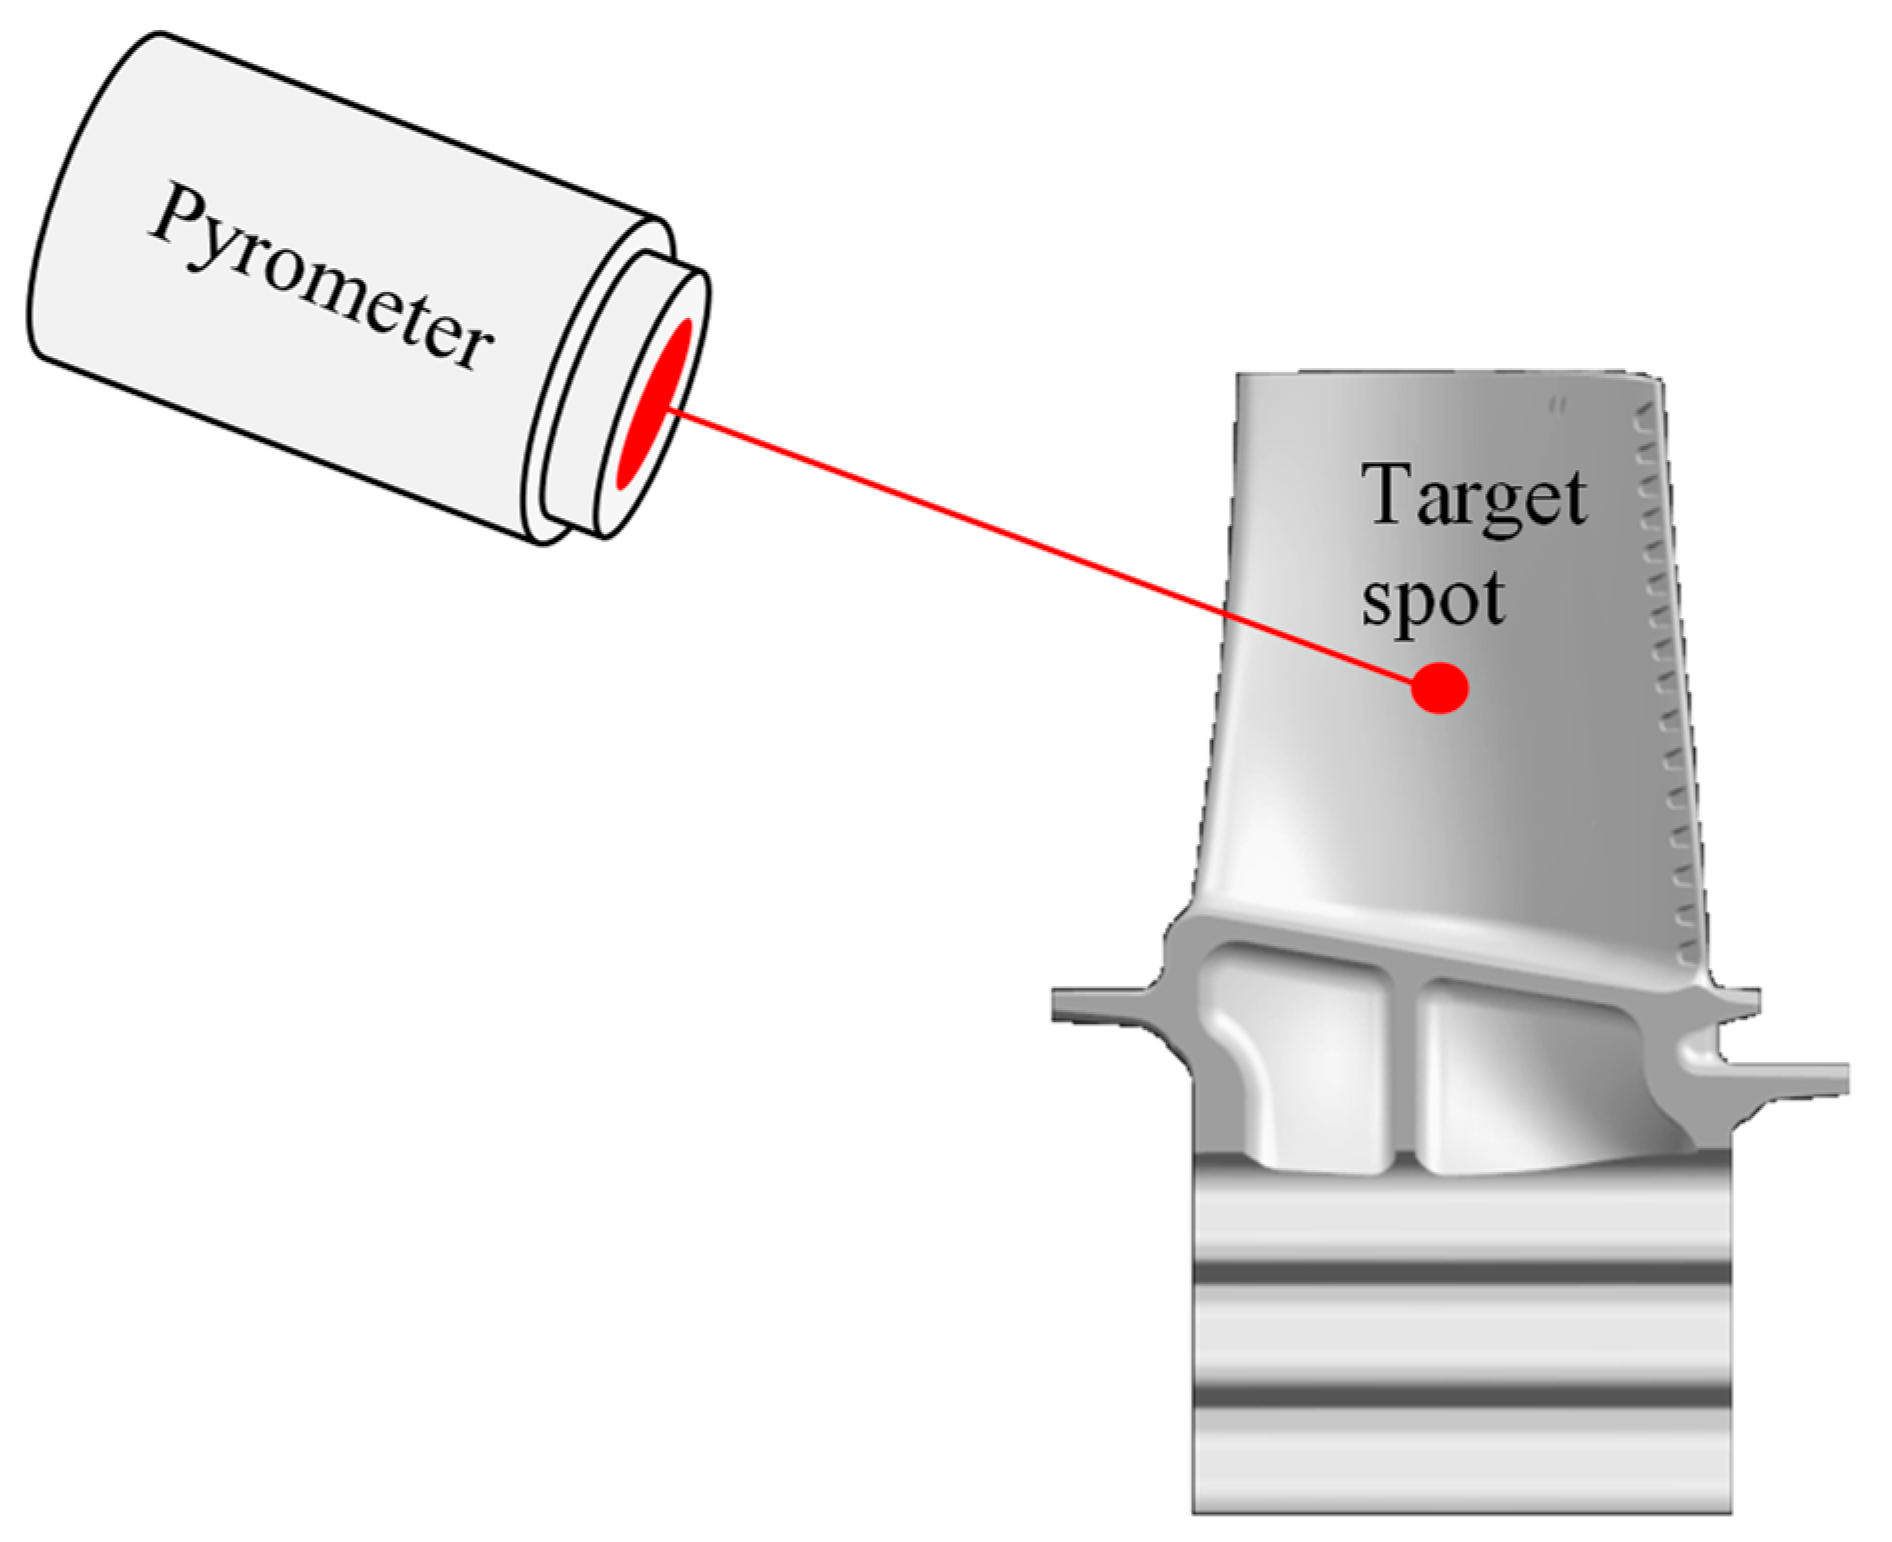
3.4.1. Pyrometry
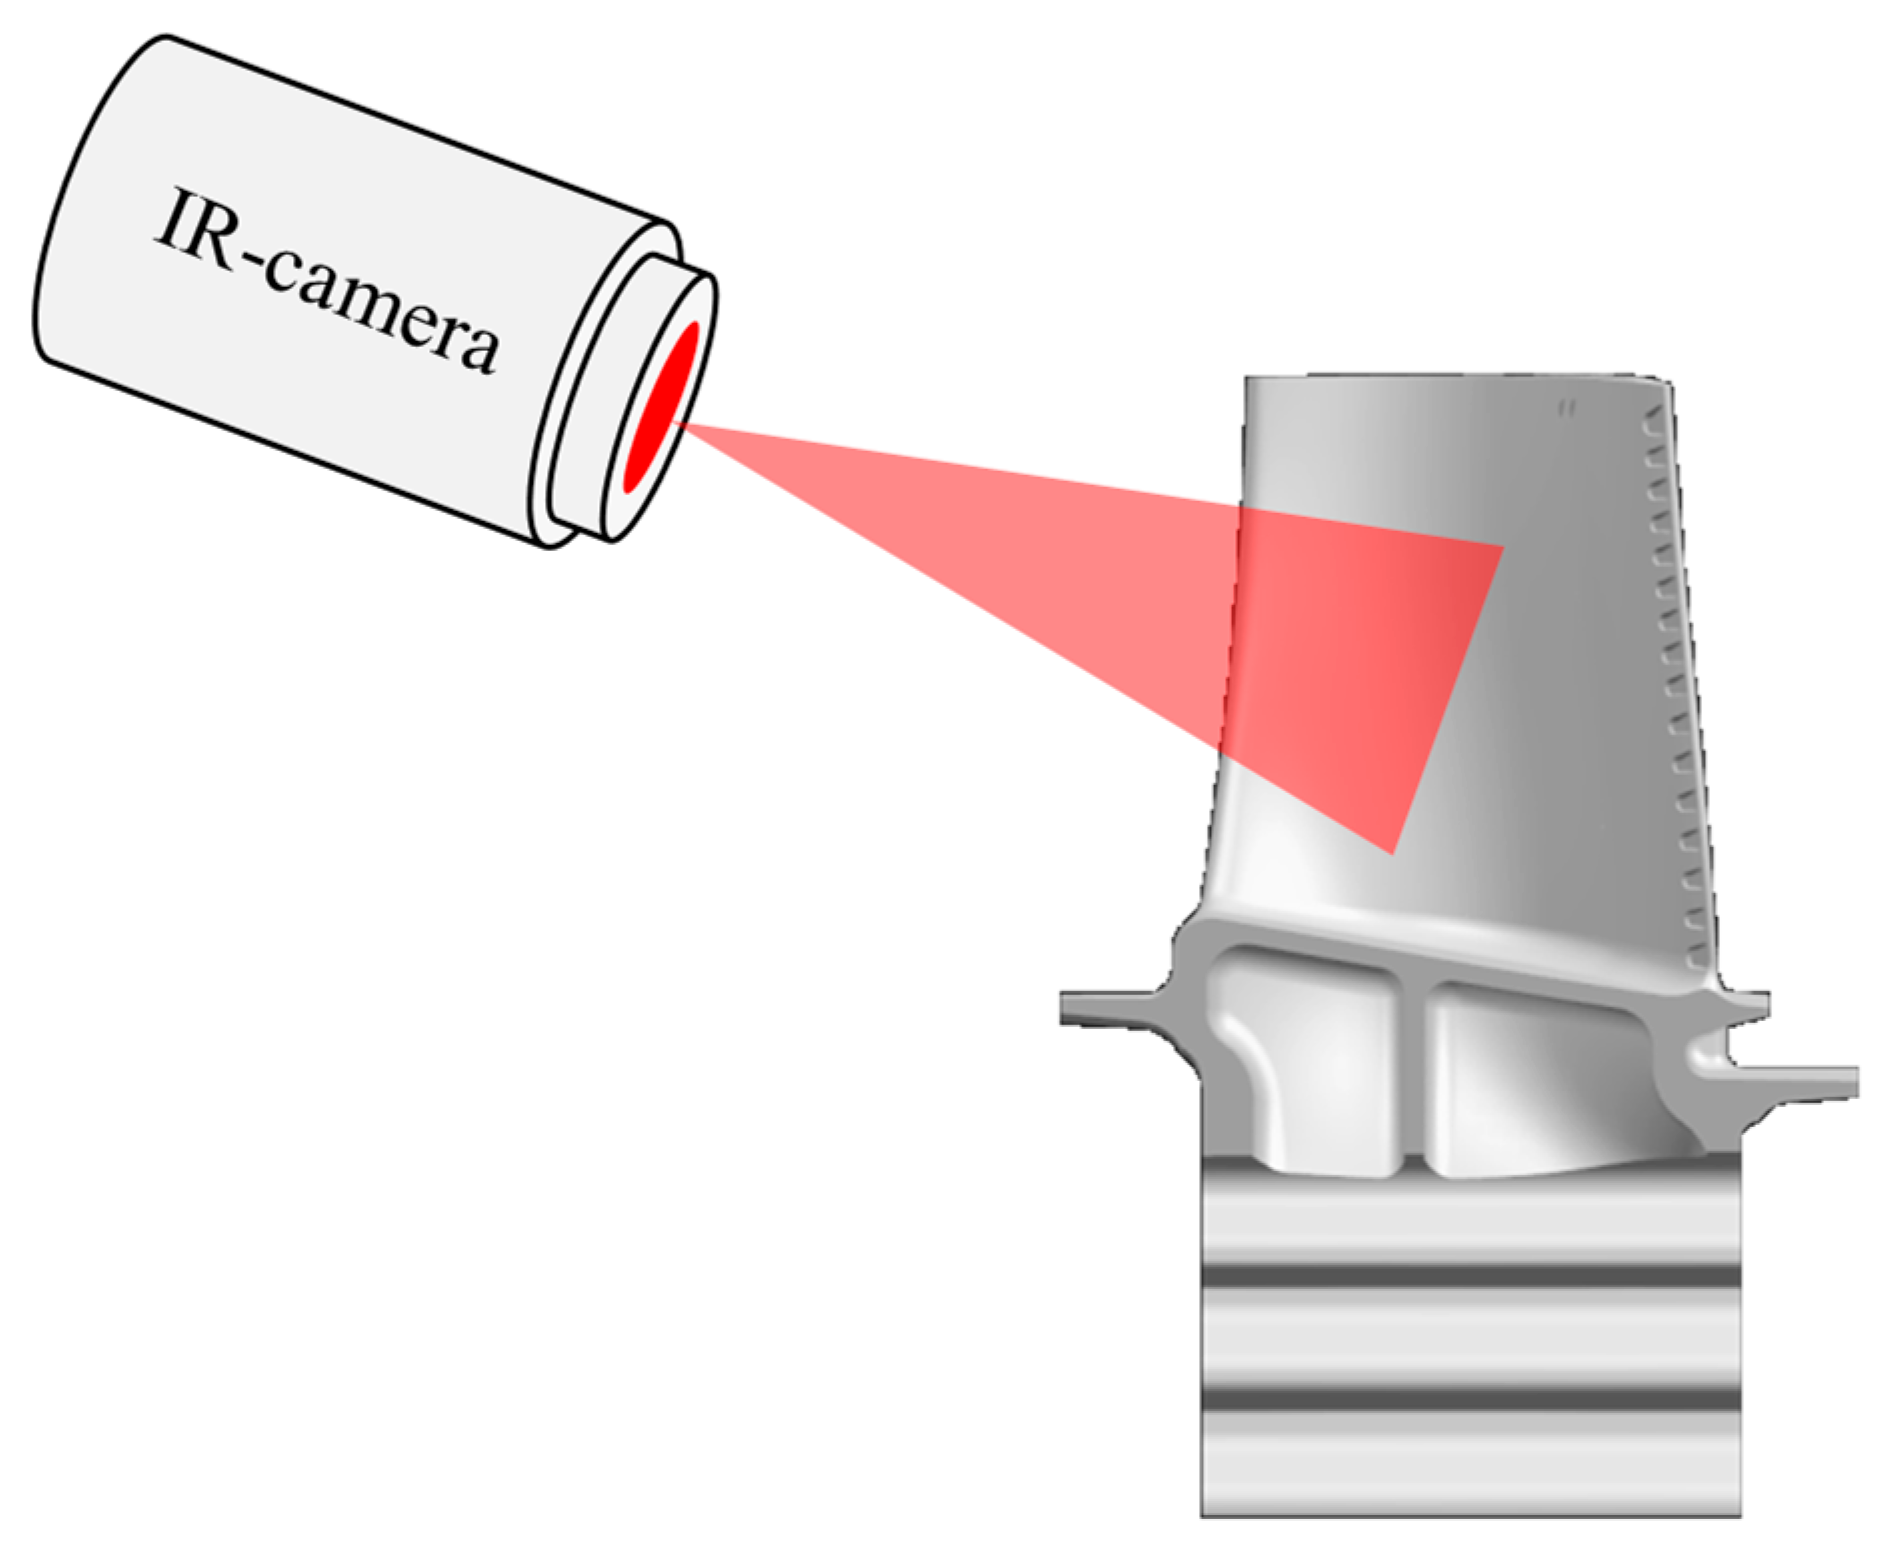
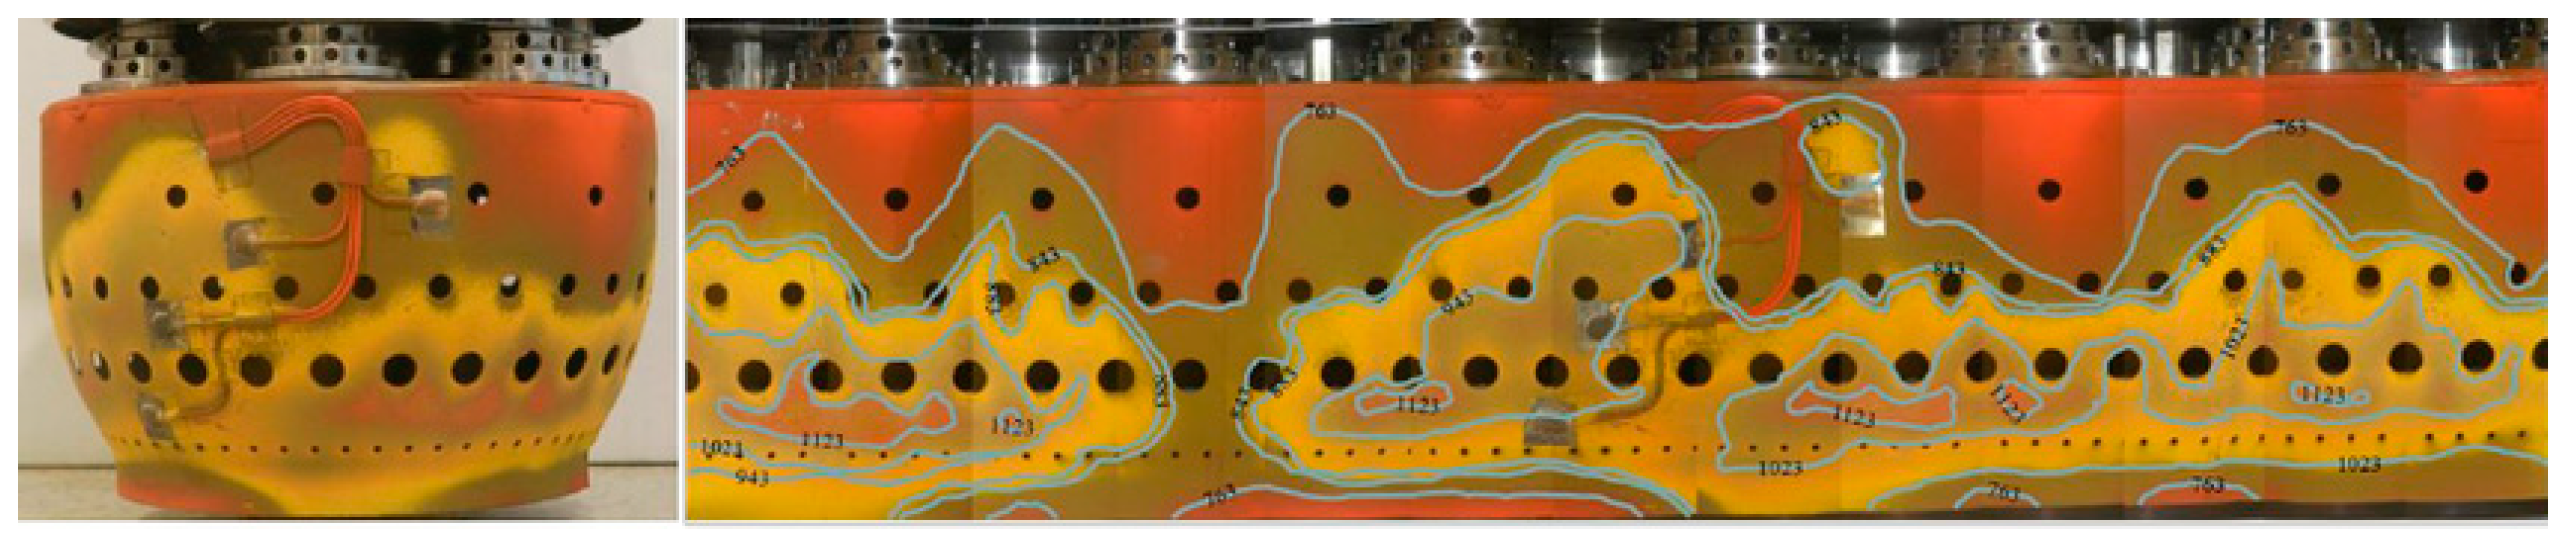
3.4.2. Infrared Thermography
3.4.3. Phosphor Thermometry
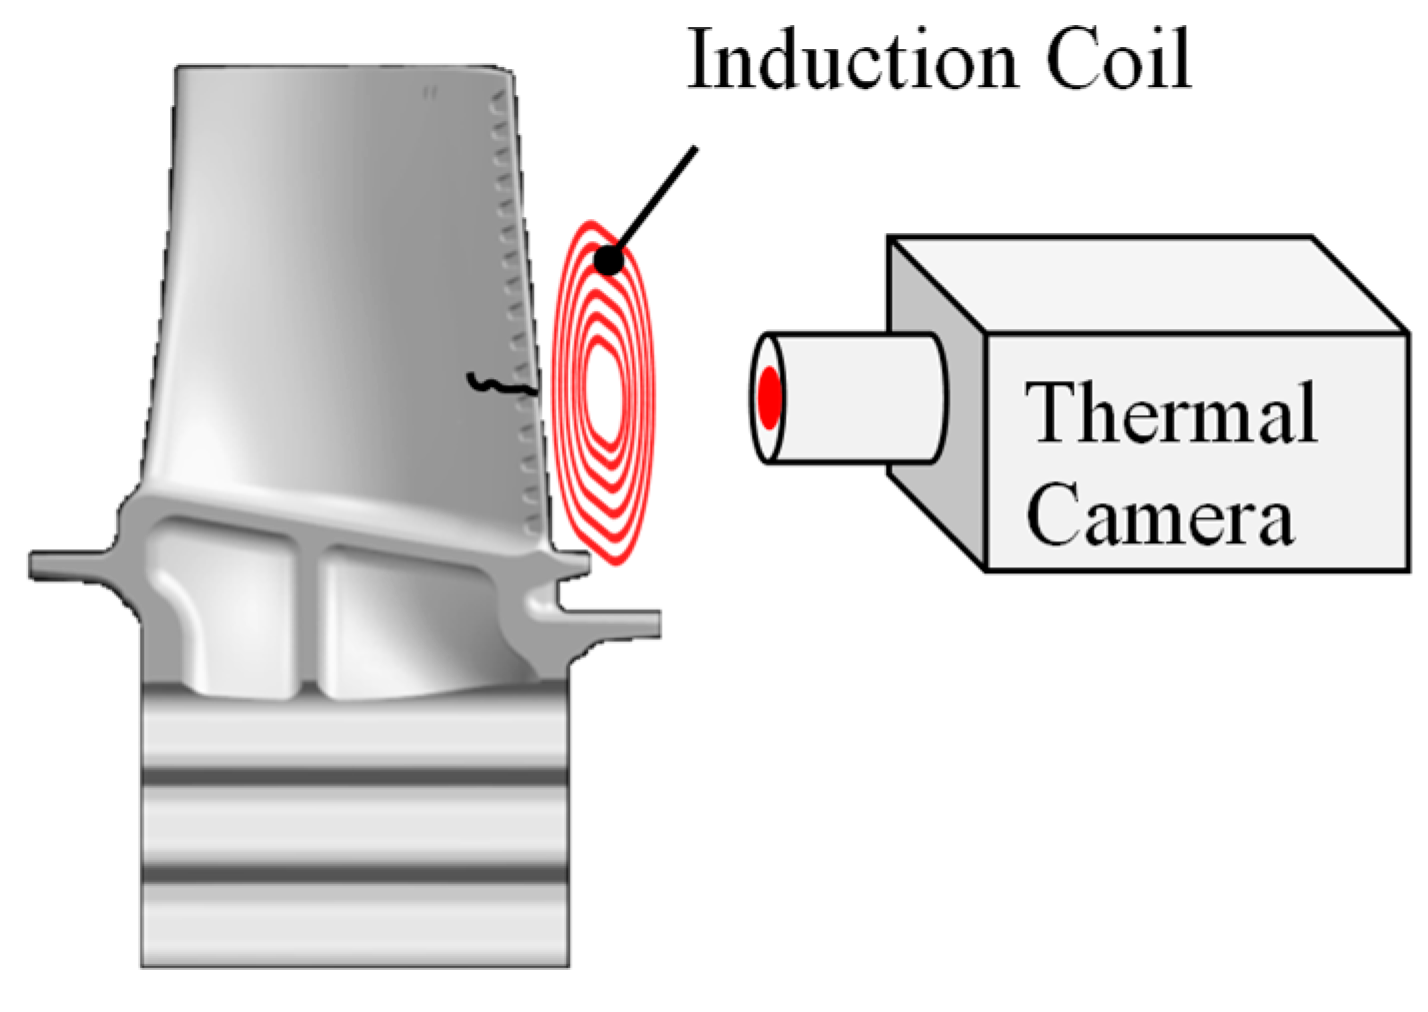
3.5. Induction Thermography
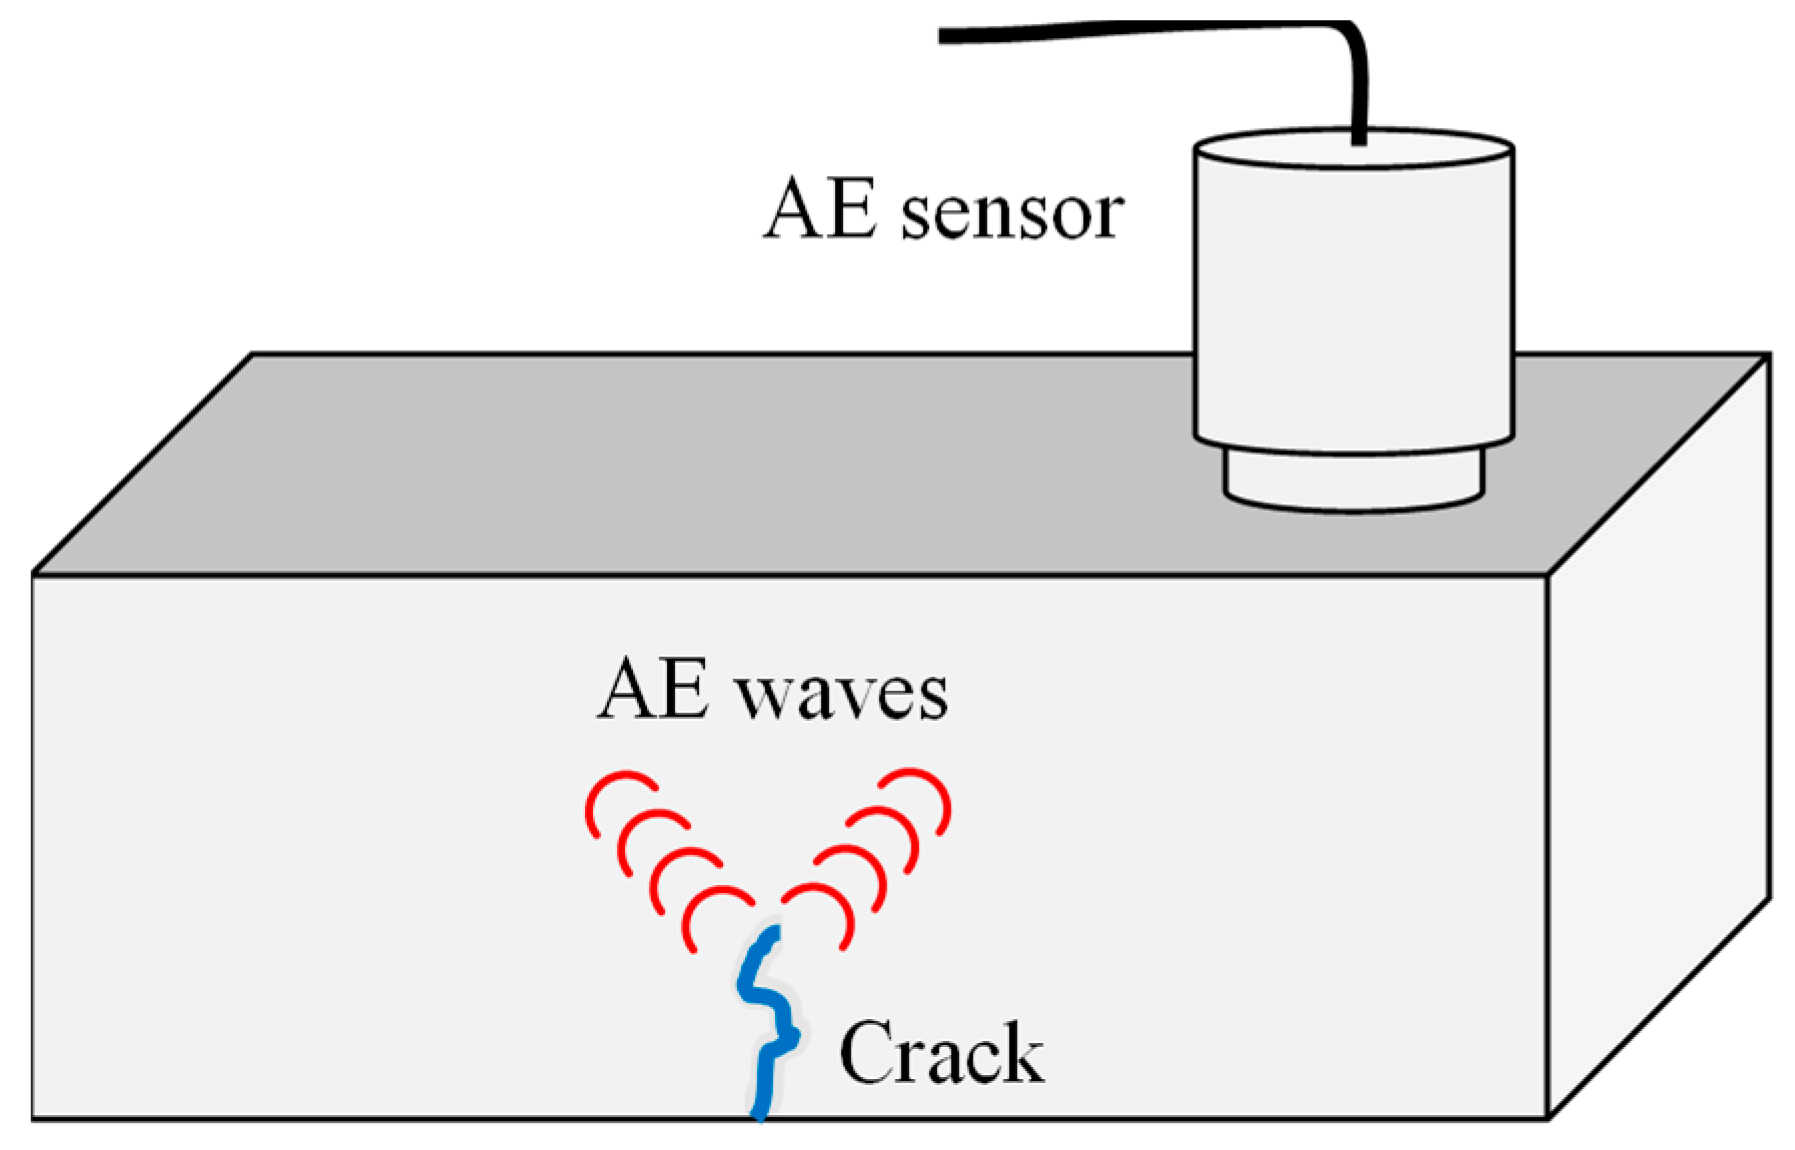
3.6. Acoustic Emission (AE)
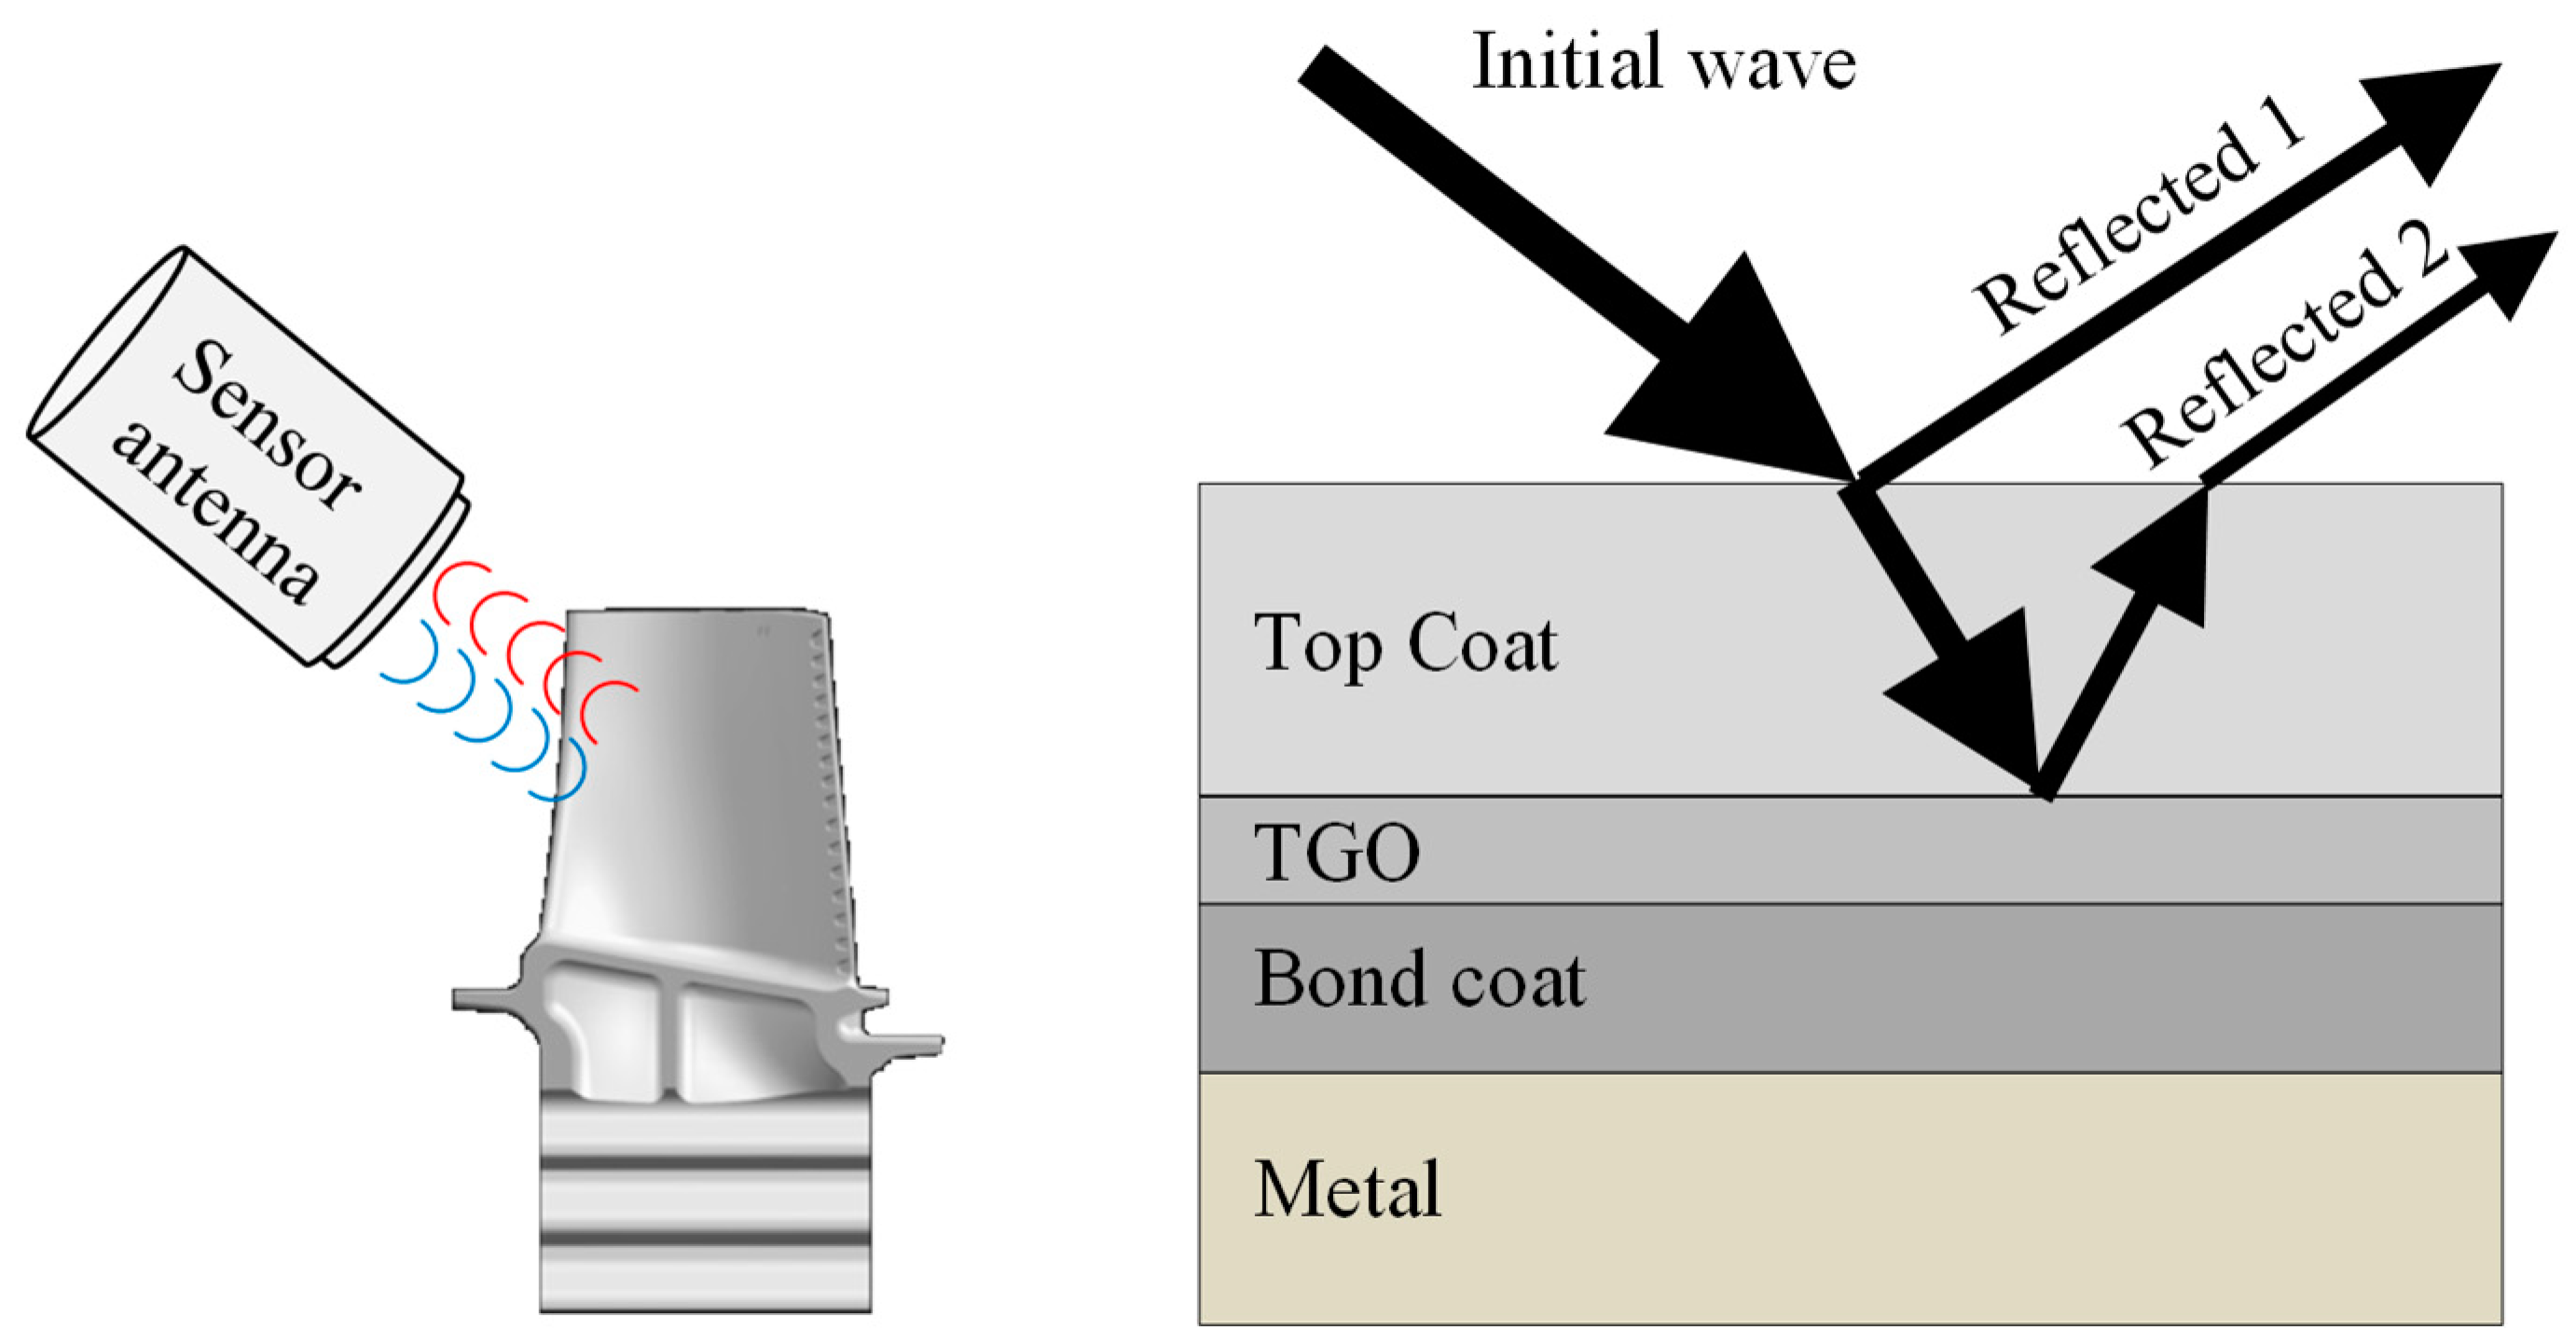
3.7. Mm-Waves
3.8. Pressure Measurements
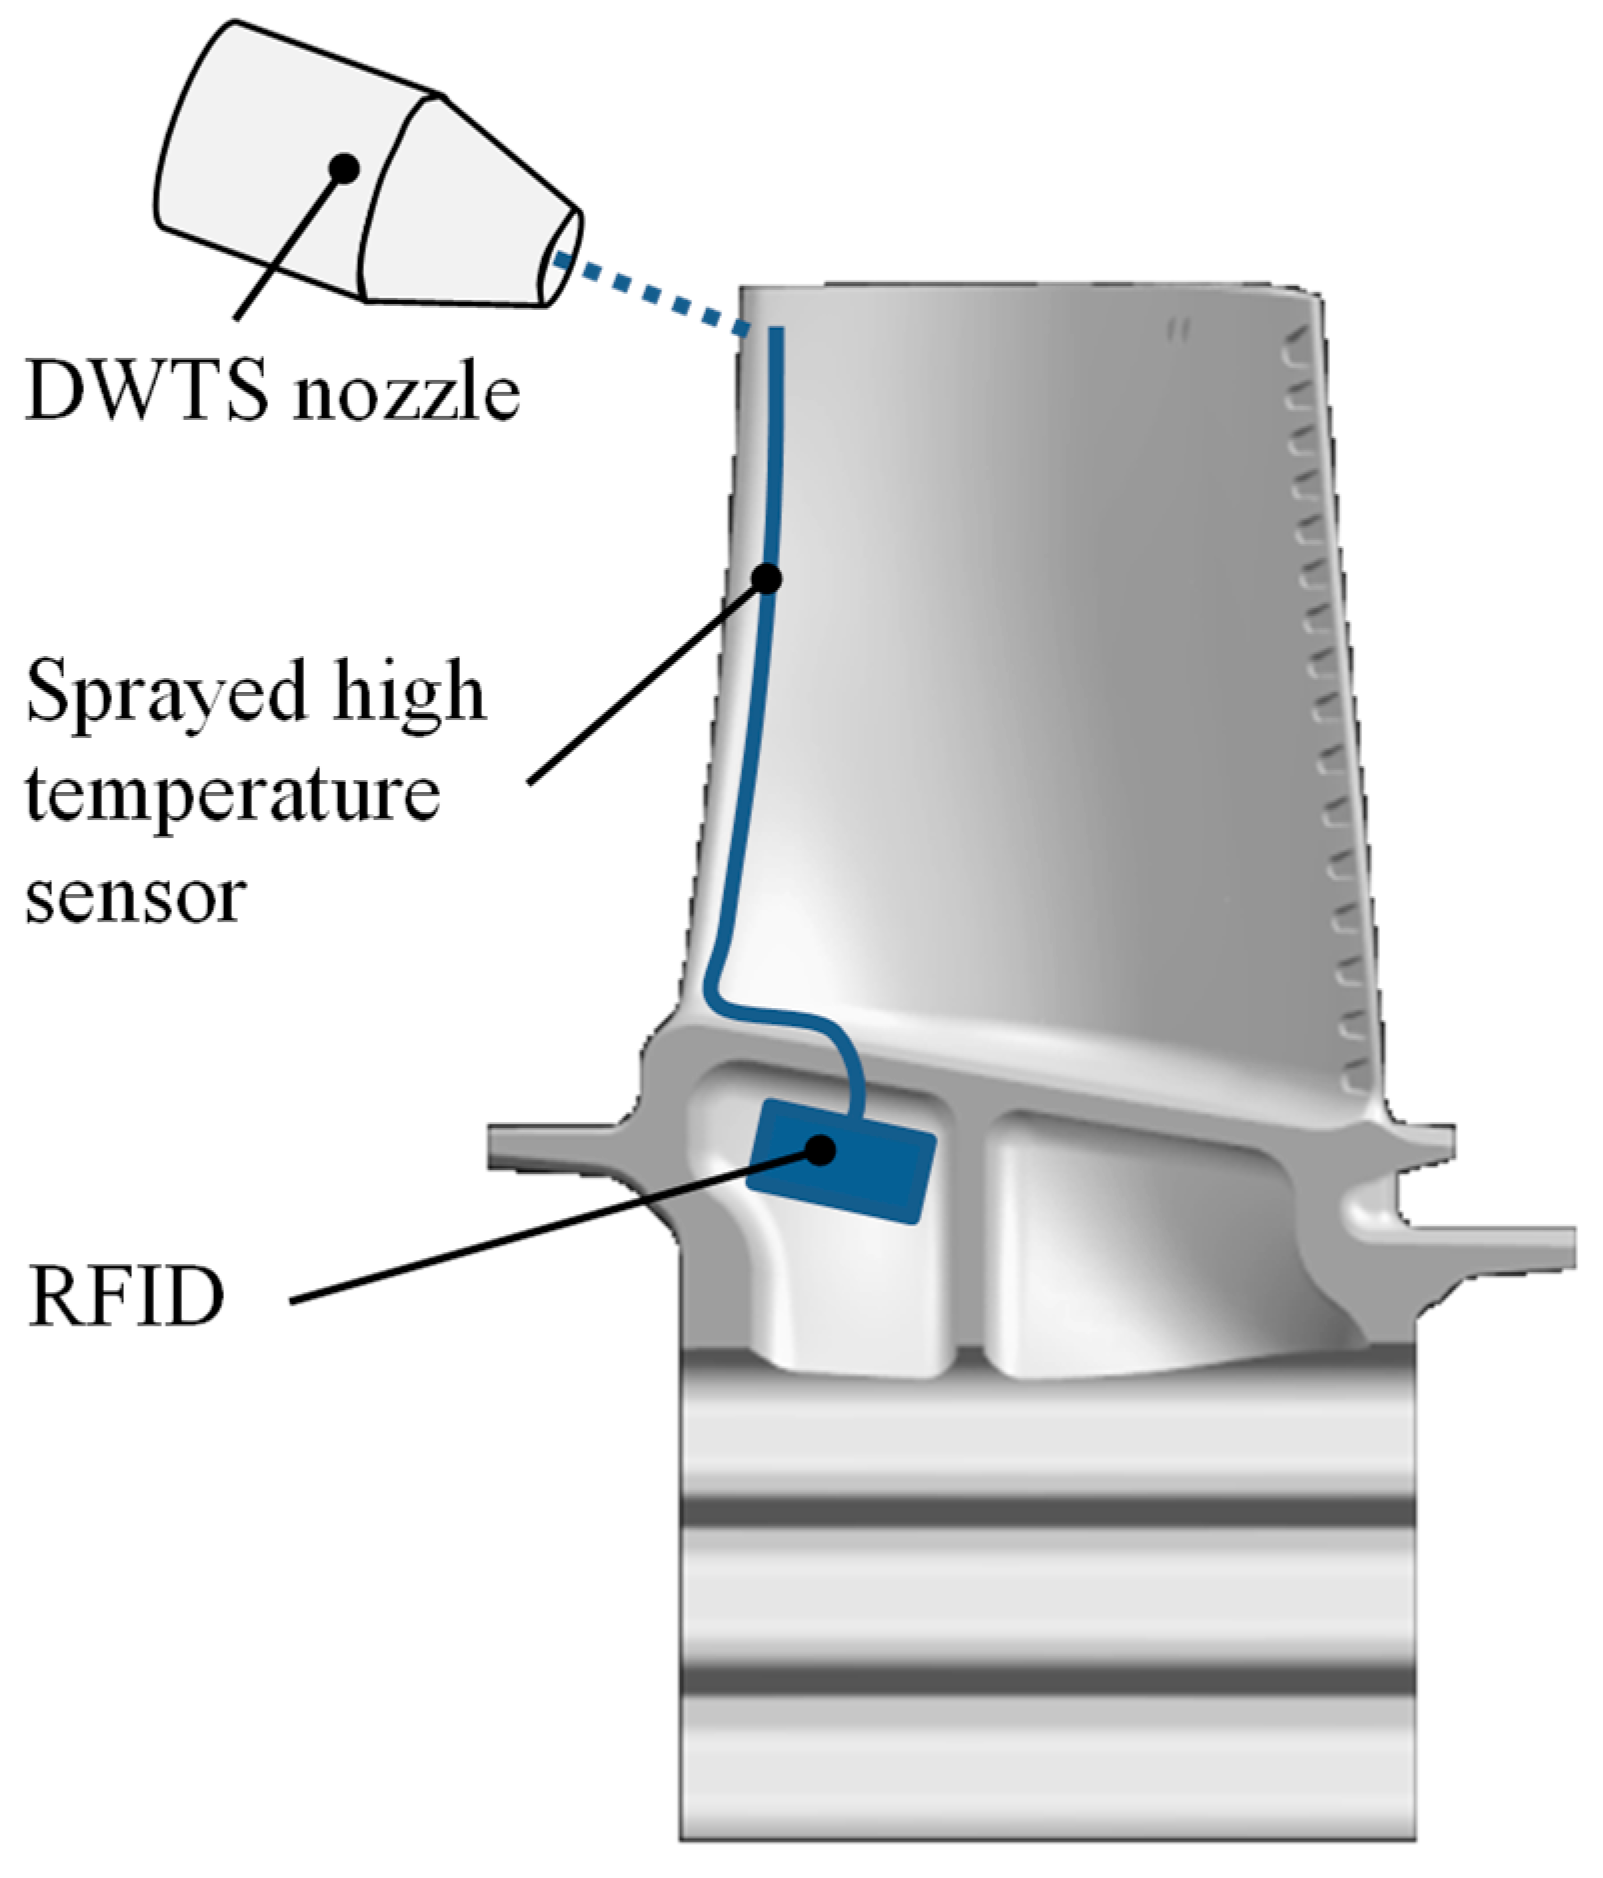
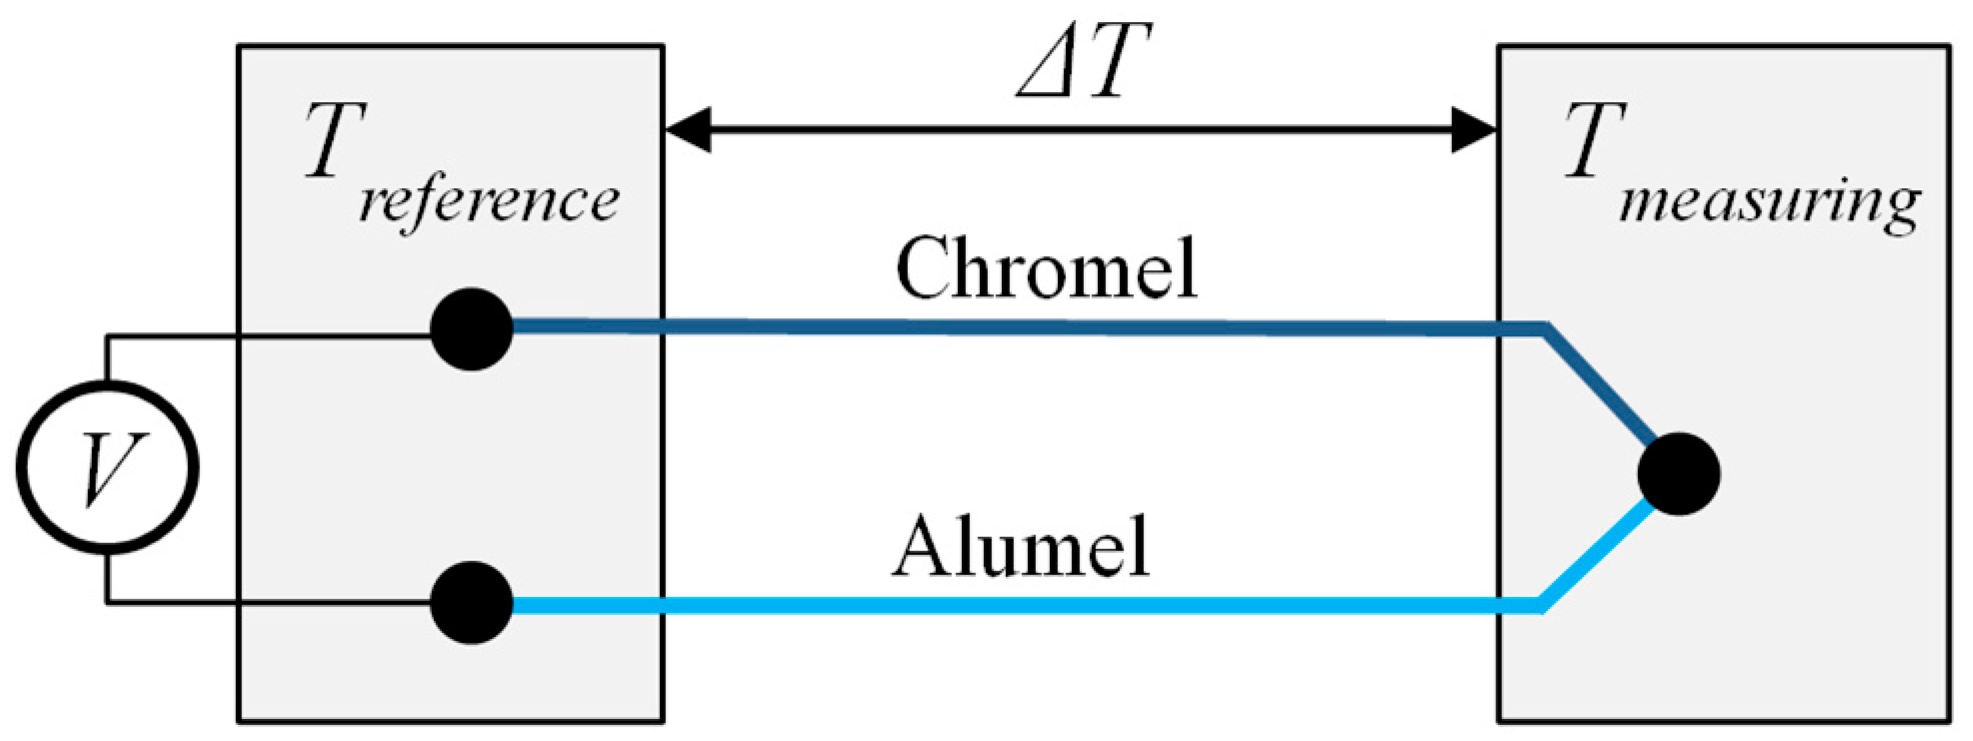
3.9. Direct-Write Thermal Spray (DWTS) Sensors
3.10. Uniform Crystal Temperature Sensor (UCTS)
3.11. Performance Monitoring
4. Conclusions
Funding
Acknowledgments
Conflicts of Interest
References
- Mitra, M.; Gopalakrishnan, S. Guided wave based structural health monitoring: A review. Smart Mater. Struct. 2016, 25, 53001. [Google Scholar] [CrossRef]
- Proulx, T. Rotating Machinery, Structural Health Monitoring, Shock and Vibration, Volume 5, Proceedings of the 29th IMAC, A Conference on Structural Dynamics 2011; Springer: New York, NY, USA, 2011. [Google Scholar]
- Mukhopadhyay, S.C. New Developments in Sensing Technology for Structural Health Monitoring; Springer: Berlin/Heidelberg, Germany, 2011. [Google Scholar]
- Niezrecki, C. Structural Health Monitoring & Damage Detection, Volume 7: Proceedings of the 35th IMAC, A Conference and Exposition on Structural Dynamics 2017; Springer: Cham, Switzerland, 2017. [Google Scholar]
- Ostachowicz, W. New Trends in Structural Health Monitoring; Springer: London, UK; Wien, NY, USA, 2013. [Google Scholar]
- Jansohn, P. (Ed.) Modern Gas Turbine Systems: High Efficiency, Low Emission, Fuel Flexible Power Generation; Woodhead Publishing: Cambridge, UK, 2013. [Google Scholar]
- Pallos, K.J. GER-3957B—Gas Turbine Repair Technology; GE Energy Services Technology: Atlanta, GA, USA, 2001. [Google Scholar]
- Meher-Homji, C.B. Blading Vibration and Failures in Gas Turbines: Part A—Blading Dynamics and the Operating Environment. In ASME 1995 International Gas Turbine and Aeroengine Congress and Exposition: Volume 4: Heat Transfer; Electric Power; Industrial and Cogeneration, Houston, TX, USA, 5 June 1995; American Society of Mechanical Engineers: New York, NY, USA, 1995; p. V004T11A014. [Google Scholar]
- Jaw, L.C.; Wu, D.N.; Bryg, D.J. Tracking and Control of Gas Turbine Engine Component Damage/Life. In RTO A VT Symposium on “Ageing Mechanisms and Control”; RTO: Manchester, UK, 2001. [Google Scholar]
- Mishra, R.K.; Srinivasan, K. Failure of Low-Pressure Turbine Blades in Military Turbofan Engines: Causes and Remedies. J. Fail. Anal. Prev. 2016, 16, 622–628. [Google Scholar] [CrossRef]
- Mishra, R.K.; Thomas, J.; Srinivasan, K.; Nandi, V.; Bhatt, R.R. Failure analysis of an un-cooled turbine blade in an aero gas turbine engine. Eng. Fail. Anal. 2017, 79, 836–844. [Google Scholar] [CrossRef]
- Park, M.; Hwang, Y.-H.; Choi, Y.-S.; Kim, T.-G. Analysis of a J69-T-25 engine turbine blade fracture. Eng. Fail. Anal. 2002, 9, 593–601. [Google Scholar] [CrossRef]
- Russhard, P. The rise and fall of the rotor blade strain gauge. Mech. Mach. Sci. 2015, 23, 27–37. [Google Scholar]
- Kestner, B.; Lieuwen, T.; Hill, C.; Angello, L.; Barron, J.; Perullo, C.A. Correlation analysis of multiple sensors for industrial gas turbine compressor blade health monitoring. J. Eng. Gas Turb. Power 2015, 137, 112605. [Google Scholar] [CrossRef]
- Guo, H.; Duan, F.; Zhang, J. Blade resonance parameter identification based on tip-timing method without the once-per revolution sensor. Mech. Syst. Signal Process. 2016, 66–67, 625–639. [Google Scholar] [CrossRef]
- Geisheimer, J.L.; Kwapisz, D.; Holst, T.; Hafner, M. Blade Tip Clearance Sensors for Use in Engine Health Monitoring Applications. SAE Int. J. Aerosp. 2013, 6, 417–423. [Google Scholar] [CrossRef]
- Du, L.; Zhu, X.; Zhe, J. A high sensitivity inductive sensor for blade tip clearance measurement. Smart Mater. Struct. 2014, 23, 065018. [Google Scholar] [CrossRef]
- Kwapisz, D.; Hafner, M.; Queloz, S. Calibration and characterization of a CW radar for blade tip clearance measurement. In Proceedings of the 7th European Radar Conference, Paris, France, 30 September–1 October 2010. [Google Scholar]
- Witos, M.; Wisnioch, M. Compressor Blade Health Monitoring with Use of Tip Timing and Modal Analysis Method. PAMM 2009, 9, 209–212. [Google Scholar] [CrossRef]
- Witos, M.; Wachlaczenko, M. Structural Health Monitoring of Compressor and Turbine Blades with the Use of Variable Reluctance Sensor and Tip Timing Method. In Proceedings of the 19th World Conference on Non-Destructive Testing, Munich, Germany, 13–17 June 2016. [Google Scholar]
- Rokicki, E.; Majewski, P.; Rzadkowski, R.; Szczepanik, R.; Spychała, J.; Drewczyński, M. Analysis of Middle Bearing Failure in Rotor Jet Engine Using Tip-Timing and Tip-Clearance Technique. In Proceedings of the ASME Turbo Expo: Turbine Technical Conference and Exposition, Düsseldorf, Germany, 16–20 June 2014; American Society of Mechanical Engineers: Düsseldorf, Germany, 2014; p. V07AT31A014. [Google Scholar]
- Tamura, K.; Ono, M.; Torii, S.; Morimoto, K. Non-contact Vibration Measurement of the Rotor Blades that Play a Pivotal Role in the Reliability of Gas Turbines. Mitsubishi Heavy Ind. Tech. Rev. 2014, 51, 10. [Google Scholar]
- Dimitriadis, G.; Carrington, I.B.; Wright, J.R.; Cooper, J.E. Blade-tip timing measurement of synchronous vibrations of rotating bladed assemblies. Mech. Syst. Signal Process. 2002, 16, 599–622. [Google Scholar] [CrossRef]
- Gallego-Garrido, J.; Dimitriadis, G.; Wright, J.R. A Class of Methods for the Analysis of Blade Tip Timing Data from Bladed Assemblies Undergoing Simultaneous Resonances—Part I: Theoretical Development. Int. J. Rotating Mach. 2007, 2007, 1–11. [Google Scholar] [CrossRef]
- Gallego-Garrido, J.; Dimitriadis, G.; Carrington, I.B.; Wright, J.R. A Class of Methods for the Analysis of Blade Tip Timing Data from Bladed Assemblies Undergoing Simultaneous Resonances—Part II: Experimental Validation. Int. J. Rotating Mach. 2007, 2007, 1–10. [Google Scholar] [CrossRef]
- Russhard, P. Blade tip timing (BTT) uncertainties. In AIP Conference Proceedings; AIP Publishing: Melville, NY, USA, 2016; Volume 1740. [Google Scholar]
- Satish, T.N.; Murthy, R.; Singh, A.K. Analysis of uncertainties in measurement of rotor blade tip clearance in gas turbine engine under dynamic condition. Proc. Inst. Mech. Eng. Part G J. Aerosp. Eng. 2014, 228, 652–670. [Google Scholar] [CrossRef]
- Roeder, J.W.; Bencic, T.J.; Hughes, C.E.; Woike, M.R. Testing of a Microwave Blade Tip Clearance Sensor at the NASA Glenn Research Center—NASA/TM-2009-215589. In 47th Aerospace Sciences Meeting; Sponsoring Organization; NASA Glenn Research Center: Cleveland, OH, USA, 2009. [Google Scholar]
- Zhang, J.; Duan, F.; Niu, G.; Jiang, J.; Li, J. A Blade Tip Timing Method Based on a Microwave Sensor. Sensors 2017, 17, 1097. [Google Scholar] [CrossRef] [PubMed]
- Violetti, M.; Qin Xu, O.; Hochreutiner, A.K.; Skrivervik, A.K. New microwave sensor for on-line Blade Tip Timing in gas and steam turbines. In Proceedings of the 2012 Asia-Pacific Microwave Conference Proceedings (APMC), Kaohsiung, Taiwan, 4–7 December 2012. [Google Scholar]
- Violetti, M.; Skrivervik, A.K.; Qin Xu, M.; Hafner, M. New microwave sensing system for blade tip clearance measurement in gas turbines. In Proceedings of the 2012 IEEE Sensors, Taipei, Taiwan, 28–31 October 2012. [Google Scholar]
- Woike, M.; Abdul-Aziz, A.; Oza, N.; Matthews, B. New sensors and techniques for the structural health monitoring of propulsion systems. Sci. World J. 2013, 2013, 596506. [Google Scholar] [CrossRef]
- Abdul-Aziz, A.; Woike, M.R.; Bencic, T.J. A Microwave Blade Tip Clearance Sensor for Propulsion Health Monitoring—NASA/TM-2010-216736. In Infotech@Aerospace 2010 Conference; Sponsoring Organization; NASA Glenn Research Center: Cleveland, OH, USA, 2010. [Google Scholar]
- Wagner, M.; Schulze, A.; Vossiek, M.; Stephelbauer, C.; Weigel, R.; Vortmeyer, N.; Heide, P. Novel microwave vibration monitoring system for industrial power generating turbines. In Proceedings of the IEEE MTT-S International Microwave Symposium Digest, Baltimore, MD, USA, 7–12 June 1998; Volume 3. [Google Scholar]
- Hafner, M.A.; Holst, T.A.; Billington, S.A. Blade tip measurement advanced visualization using a three dimensional representation. In Proceedings of the ASME Turbo Expo 2011, Vancouver, BC, Canada, 6–10 June 2011; American Society of Mechanical Engineers: Vancouver, BC, Canada, 2011; Volume 3. [Google Scholar]
- Neri, P.; Peeters, B. Non-Harmonic Fourier Analysis for bladed wheels damage detection. J. Sound Vib. 2015, 356, 181–194. [Google Scholar] [CrossRef]
- Schicht, A.; Schwarzer, S.; Schmidt, L.-P. Tip Clearance Measurement Technique for Stationary Gas Turbines Using an Autofocusing Millimeter-Wave Synthetic Aperture Radar. IEEE Trans. Instrum. Meas. 2012, 61, 1778–1785. [Google Scholar] [CrossRef]
- Tomassini, R.; Rossi, G.; Brouckaert, J.-F. On the development of a magnetoresistive sensor for blade tip timing and blade tip clearance measurement systems. Rev. Sci. Instrum. 2016, 87, 102505. [Google Scholar] [CrossRef]
- Gopalakrishnan, S. Computational Techniques for Structural Health Monitoring; Springer: London, UK, 2011. [Google Scholar]
- Przysowa, R.; Rokicki, E. Inductive sensors for blade tip-timing in gas turbines. J. KONBIN 2015, 36, 147–164. [Google Scholar] [CrossRef]
- Lawson, C.P.; Ivey, P.C. Tubomachinery blade vibration amplitude measurement through tip timing with capacitance tip clearance probes. Sens. Actuators A Phys. 2005, 118, 14–24. [Google Scholar] [CrossRef]
- Tomassini, R.; Rossi, G.; Brouckaert, J-F. On the development of a magnetoresistive sensor for blade tip timing and blade tip clearance measurement systems. In AIP Conference Proceeding; AIP Publishing: Melville, NY, USA, 2014; Volume 1600. [Google Scholar]
- Reinhardt, A.K.; Kadambi, J.R.; Quinn, R.D. Laser vibrometry measurements of rotating blade vibrations. J. Eng. Gas Turb. Power 1995, 117, 484–488. [Google Scholar] [CrossRef]
- Lezhin, D.S.; Falaleev, S.V.; Safin, A.I.; Ulanov, A.M.; Vergnano, D. Comparison of Different Methods of Non-contact Vibration Measurement. Procedia Eng. 2017, 176, 175–183. [Google Scholar] [CrossRef]
- Heath, S.; Imregun, M. An improved single-parameter tip-timing method for turbomachinery blade vibration measurements using optical laser probes. Int. J. Mech. Sci. 1996, 38, 1047–1058. [Google Scholar] [CrossRef]
- Battiato, G.; Firrone, C.M.; Berruti, T.M. Forced response of rotating bladed disks: Blade Tip-Timing measurements. Mech. Syst. Signal Process. 2017, 85, 912–926. [Google Scholar] [CrossRef]
- Di Maio, D.; Ewins, D.J. Experimental measurements of out-of-plane vibrations of a simple blisk design using Blade Tip Timing and Scanning LDV measurement methods. Mech. Syst. Signal Process. 2012, 28, 517–527. [Google Scholar] [CrossRef]
- Chen, Z.; Yang, Y.; Xie, Y.; Guo, B.; Hu, Z. Non-contact crack detection of high-speed blades based on principal component analysis and Euclidian angles using optical-fiber sensors. Sens. Actuators A Phys. 2013, 201, 66–72. [Google Scholar] [CrossRef]
- Gwashavanhu, B.; Oberholster, A.J.; Heyns, P.S. Rotating blade vibration analysis using photogrammetry and tracking laser Doppler vibrometry. Mech. Syst. Signal Process. 2016, 76–77, 174–186. [Google Scholar] [CrossRef]
- Büttner, L.; Pfister, T.; Czarske, J. Fiber-optic laser Doppler turbine tip clearance probe. Opt. Lett. 2006, 31, 1217–1219. [Google Scholar] [CrossRef]
- Pfister, T.; Büttner, L.; Czarske, J.; Krain, H.; Schodl, R. Turbo machine tip clearance and vibration measurements using a fibre optic laser doppler position sensor. Meas. Sci. Technol. 2006, 17, 1693–1705. [Google Scholar] [CrossRef]
- Gil-Garcia, J.M.; Garcia, I.; Zubia, J.; Aranguren, G. Measurement of blade tip clearance and time of arrival in turbines using an optic sensor. In Proceedings of the 2015 International Conference on Applied Electronics (AE), Pilsen, Czech Republic, 8–9 September 2015. [Google Scholar]
- Zielinski, M.; Ziller, G. Noncontact vibration measurements on compressor rotor blades. Meas. Sci. Technol. 2000, 11, 847–856. [Google Scholar] [CrossRef]
- Overton, G. Fiberoptic probe measures turbine tip clearance. Laser Focus World 2006, 42, 20–23. [Google Scholar]
- Sharma, V.K.; Hanagud, S.; Ruzzene, M. Damage Index Estimation in Beams and Plates Using Laser Vibrometry. Aiaa J. 2006, 44, 919–923. [Google Scholar] [CrossRef]
- García, I.; Zubia, J.; Beloki, A.; Aldabaldetreku, G. Tip timing measurements for Structural Health Monitoring in a low-pressure turbine using three optical sensors. In Proceedings of the 8th European Workshop on Structural Health Monitoring (EWSHM 2016), Spain, Bilbao, 5–8 July 2016. [Google Scholar]
- Günther, P.; Dreier, F.; Pfister, T.; Czarske, J.; Haupt, T.; Hufenbach, W. Measurement of radial expansion and tumbling motion of a high-speed rotor using an optical sensor system. Mech. Syst. Signal Process. 2011, 25, 319–330. [Google Scholar] [CrossRef]
- Oberholster, A.J.; Heyns, P.S. Eulerian laser Doppler vibrometry: Online blade damage identification on a multi-blade test rotor. Mech. Syst. Signal Process. 2011, 25, 344–359. [Google Scholar] [CrossRef]
- Pfister, T.; Büttner, L.; Czarske, J. Laser doppler profile sensor with sub-micrometre position resolution for velocity and absolute radius measurements of rotating objects. Meas. Sci. Technol. 2005, 16, 627–641. [Google Scholar] [CrossRef]
- Przysowa, R.; Majewski, P.; Rokicki, E. Optimized magnetic sensors to measure speed and position in adverse environments. In Proceedings of the IET & ISA 60th International Instrumentation Symposium 2014, Cavendish Square, London, UK, 24–26 June 2014. [Google Scholar]
- Procházka, P. Sensors for noncontact vibration diagnostics in rotating machinery. In AIP Conference Proceedings; AIP Publishing: Melville, NY, USA, 2016; Volume 1740. [Google Scholar]
- Roeseler, C.; von Flotow, A.; Tappert, P. Monitoring blade passage in turbomachinery through the engine case (no holes). In Proceedings of the IEEE Aerospace Conference Proceedings, Big Sky, MT, USA, 9–16 March 2002. [Google Scholar]
- Ghoshal, A.; Le, D.; Kim, H. Technological assessment of high temperature sensing systems under extreme environment. Sens. Rev. 2012, 32, 66–71. [Google Scholar] [CrossRef]
- Neumann, M.; Dreier, F.; Günther, P.; Wilke, U.; Fischer, A.; Büttner, L.; Holzinger, F.; Schiffer, H.-P.; Czarske, J. A laser-optical sensor system for blade vibration detection of high-speed compressors. Mech. Syst. Signal Process. 2015, 64–65, 337–346. [Google Scholar] [CrossRef]
- Cardwell, D.N.; Chana, K.S.; Russhard, P. The use of eddy current sensors for the measurement of rotor blade tip timing-sensor development and engine testing. In Proceedings of the ASME Turbo Expo 2008, Power for Land, Sea and Air, Berlin, Germany, 9–13 June 2008; American Society of Mechanical Engineers: Berlin, Germany, 2008; Volume 2. [Google Scholar]
- Liu, C.; Jiang, D. Improved Blade Tip Timing in Blade Vibration Monitoring with Torsional Vibration of the Rotor. J. Phys. Conf. Ser. 2012, 364, 12136. [Google Scholar] [CrossRef]
- Chana, K.S.; Sridhar, V.; Singh, D. The use of eddy current sensors for the measurement of rotor blade tip timing: Development of a new method based on integration. In Proceedings of the ASME Turbo Expo 2016, Turbomachinery Technical Conference and Exposition, Seoul, South Korea, 13–17 June 2016; American Society of Mechanical Engineers: Seoul, South Korea, 2016; Volume 6. [Google Scholar]
- Tsutomu, M.; Sho, G.; Kenta, D.; Yoshinori, K.; Yuichi, A.; Shigemi, E.; Hiroki, S. Method for Identifying Type of Eddy-Current Displacement Sensor. IEEE Trans. Magn. 2011, 47, 3554–3557. [Google Scholar] [CrossRef]
- Przysowa, R.; Spychała, J. Health Monitoring of Turbomachinery Based on Blade Tip-Timing and Tip-Clearance. Available online: https://www.researchgate.net/profile/Radoslaw_Przysowa/publication/273137276_Health_Monitoring_of_Turbomachinery_Based_on_Blade_Tip-Timing_and_Tip-Clearance/links/54f97cfa0cf28d6deca4a6d9/Health-Monitoring-of-Turbomachinery-Based-on-Blade-Tip-Timing-and-Tip-Clearance.pdf (accessed on 10 October 2018).
- Procházka, P.; Vanek, F. New methods of non-contact sensing of blade vibrations and deflections in turbomachinery. In Proceedings of the 2013 IEEE International Instrumentation and Measurement Technology Conference (I2MTC), Minneapolis, MN, USA, 6–9 May 2013. [Google Scholar]
- Procházka, P.; Vank, F. Contactless diagnostics of turbine blade vibration and damage. J. Phys. Conf. Ser. 2011, 205, 012116. [Google Scholar] [CrossRef]
- Brouckaert, J.-F.; Marsili, R.; Rossi, G.; Tomassini, R. Development and experimental characterization of a new non contact sensor for blade tip timing. In AIP Conference Proceedings; AIP Publishing: Melville, NY, USA, 2012; Volume 1457. [Google Scholar]
- Tomassini, R.; Rossi, G. Noncontact vibration measurements using magnetoresistive sensing elements. In AIP Conference Proceedings; AIP Publishing: Melville, NY, USA, 2016; Volume 1740. [Google Scholar]
- Tomassini, R. Blade Tip Timing and Blade Tip Clearance Measurement System Based on Magnetoresistive Sensors. Ph.D. Thesis, University of Padua, Padua, Italy, 2016. [Google Scholar]
- Lawson, C.P. Capacitance Tip Timing Techniques in Gas Turbines. Ph.D. Thesis, Cranfield University, Silsoe, UK, 2003. [Google Scholar]
- Steiner, A. Techniques for blade tip clearance measurements with capacitive probes. Meas. Sci. Technol. 2000, 11, 865–869. [Google Scholar] [CrossRef]
- Sarma, G.R.; Barranger, J.P. Capacitance-type blade-tip clearance measurement system using a dual amplifier with ramp/DC inputs and integration. IEEE Trans. Instrum. Meas. 1992, 41, 674–678. [Google Scholar] [CrossRef]
- Drumm, M.; Hause, W.C. High performance rotor monitoring. In Proceedings of the 19th 2000 Digital Avionics Systems Conference (DASC), Philadelphia, PA, USA, 7–13 October 2000. [Google Scholar]
- Mönich, M.; Bailleul, G. Capacitive Measurement System for Blade Clearances. Sens. Rev. 1993, 13, 23–26. [Google Scholar] [CrossRef]
- Mueller, D.; Mozumdar, S.; Johann, E. Capacitive measurement of compressor and turbine blade tip to casing running clearance. J. Eng. Gas Turbines Power 1997, 119, 877–884. [Google Scholar] [CrossRef]
- Fabian, T.; Sangkyun Kang, F.; Prinz, F. Capacitive blade tip clearance measurements for a micro gas turbine. In Proceedings of the 19th IEEE IMTC/2002 Instrumentation and Measurement Technology Conference, Anchorage, AK, USA, 21–23 May 2002; Volume 2. [Google Scholar]
- Lavagnoli, S.; Paniagua, G.; Tulkens, M.; Steiner, A. High-fidelity rotor gap measurements in a short-duration turbine rig. Mech. Syst. Signal Process. 2012, 27, 590–603. [Google Scholar] [CrossRef]
- Sinha, J.K.; Elbhbah, K. A future possibility of vibration based condition monitoring of rotating machines. Mech. Syst. Signal Process. 2013, 34, 231–240. [Google Scholar] [CrossRef]
- Abdelrhman, A.M.; Leong, M.S.; Alfatih, S.; Al Obiadi, S. A Review of Vibration Monitoring as a Diagnostic Tool for Turbine Blade Faults. Appl. Mech. Mater. 2012, 229–231, 1459–1463. [Google Scholar] [CrossRef]
- Elmaleeh, M.; Saad, N. Development of acoustic emission diagnostic system for condition monitoring of rotating machines. In Proceedings of the IEEE 2nd International Power and Energy Conference (PECon), Johor Bahru, Malaysia, 1–3 December 2008. [Google Scholar]
- Lim, M.H.; Leong, M.S. Improved Blade Fault Diagnosis Using Discrete Blade Passing Energy Packet and Rotor Dynamics Wavelet Analysis. In Proceedings of the ASME Turbo Expo 2010: Presented at the 2010 ASME Turbo Expo, Glasgow, UK, 14–18 June 2010; American Society of Mechanical Engineers: New York, NY, USA, 2010; pp. 31–37. [Google Scholar]
- Abdelrhman, A.M.; Hee, L.M.; Leong, M.S.; Al-Obaidi, S. Condition Monitoring of Blade in Turbomachinery: A Review. Adv. Mech. Eng. 2015, 6, 210717. [Google Scholar] [CrossRef]
- Hee, L.M.; Leong, M.S. Improved blade fault diagnosis using discrete Blade Passing Energy Packet and rotor dynamics wavelet analysis. In Proceedings of the ASME Turbo Expo 2010: Power for Land, Sea and Air, Glasgow, UK, 17–18 June 2010; American Society of Mechanical Engineers: Glasgow, UK, 2010; Volume 3. [Google Scholar]
- Südmersen, Ü.; Pietsch, O.; Scheer, C.; Reimche, W.; Bach, F.-W. Condition Monitoring of Steam Turbines by combined vibration and process parameter analysis. In Proceedings of the Conferência Technologia de Equipamentos, Salvador, Brazil, 9–12 September 2002. [Google Scholar]
- Lebold, M.S.; Maynard, K.; Reichard, K.; Trethewey, M.; Bieryla, D.; Lissenden, C.; Dobbins, D. Using torsional vibration analysis as a synergistic method for crack detection in rotating equipment. In Proceedings of the 2004 IEEE Aerospace Conference, Big Sky, MT, USA, 6–13 March 2004. [Google Scholar]
- Leong, M.S. Field Experiences of Gas Turbines Vibrations—A Review and Case Studies. J. Syst. Des. Dyn. 2008, 2, 24–35. [Google Scholar] [CrossRef]
- Al-Bedoor, B.O.; Ghouti, L.; Adewusi, S.A.; Al-Nassar, Y.; Abdlsamad, M. Experiments on the extraction of blade vibration signature from the shaft torsional vibration signals. J. Qual. Maint. Eng. 2003, 9, 144–159. [Google Scholar] [CrossRef]
- Zhang, Y.; Cruz-Manzo, S.; Latimer, A. (Eds.) Start-Up Vibration Analysis for Novelty Detection on Industrial Gas Turbines. In Proceedings of the 2016 International Symposium on Industrial Electronics (INDEL), Banja Luka, Bosnia Herzegovina, 3–5 November 2016. [Google Scholar]
- Loutas, T.H.; Roulias, D.; Pauly, E.; Kostopoulos, V. The combined use of vibration, acoustic emission and oil debris on-line monitoring towards a more effective condition monitoring of rotating machinery. Mech. Syst. Signal Process. 2011, 25, 1339–1352. [Google Scholar] [CrossRef]
- Schlagwein, G.; Schaber, U. Non-contact blade vibration measurement analysis using a multi-degree-of-freedom model. Proc. Inst. Mech. Eng. Part A: J. Power Energy 2006, 220, 611–618. [Google Scholar] [CrossRef]
- Sendhil, K.S.; Senthil, K.M. Condition monitoring of rotating machinery through vibration analysis. J. Sci. Ind. Res. 2014, 73, 258–261. [Google Scholar]
- Yunusa-kaltungo, A.; Sinha, J.K. Effective vibration-based condition monitoring (eVCM) of rotating machines. J. Qual. Maint. Eng. 2017, 23, 279–296. [Google Scholar] [CrossRef]
- Matthaiou, I.; Khandelwal, B.; Antoniadou, I. Vibration Monitoring of Gas Turbine Engines: Machine-Learning Approaches and Their Challenges. Front. Built Environ. 2017, 3, 54. [Google Scholar] [CrossRef]
- Lifson, A.; Quentin, G.H.; Smalley, A.J.; Knauf, C.L. Assessment of gas turbine vibration monitoring. J. Eng. Gas Turbines Power 1989, 111, 257–263. [Google Scholar] [CrossRef]
- Fábry, S.; Češkovič, M. Aircraft gas turbine engine vibration diagnostics. Mag. Aviat. Dev. 2017, 5, 24–28. [Google Scholar] [CrossRef]
- Madhavan, S.; Jain, R.; Sujatha, C.; Sekhar, A.S. Vibration based damage detection of rotor blades in a gas turbine engine. Eng. Fail. Anal. 2014, 46, 26–39. [Google Scholar] [CrossRef]
- Djaidir, B.; Hafaifa, A.; Kouzou, A. Faults detection in gas turbine rotor using vibration analysis under varying conditions. J. Theory Appl. Mech. 2017, 55, 393–406. [Google Scholar] [CrossRef]
- Gubran, A.A.; Sinha, J.K. Shaft instantaneous angular speed for blade vibration in rotating machine. Mech. Syst. Signal Process. 2014, 44, 47–59. [Google Scholar] [CrossRef]
- Kumar, S.; Roy, N.; Ganguli, R. Monitoring low cycle fatigue damage in turbine blade using vibration characteristics. Mech. Syst. Signal Process. 2007, 21, 480–501. [Google Scholar] [CrossRef]
- Rajagopalan, V.; Behera, A.; Bhattacharya, A.; Prabhu, R.; Badami, V. Estimation of static deflection under operational conditions for blade health monitoring. In Proceedings of the 2012 IEEE Conference on Prognostics and System Health Management (PHM), Beijing, China, 23–25 May 2012. [Google Scholar]
- Heath, S.; Imregun, M. A survey of blade tip-timing measurement techniques for turbomachinery vibration. J. Eng. Gas Turbines Power 1998, 120, 784–791. [Google Scholar] [CrossRef]
- Hu, Z.; Lin, J.; Chen, Z.-S.; Yang, Y.-M.; Li, X.-J. A Non-Uniformly Under-Sampled Blade Tip-Timing Signal Reconstruction Method for Blade Vibration Monitoring. Sensors 2015, 15, 2419–2437. [Google Scholar] [CrossRef] [PubMed]
- Guru, S.S.; Shylaja, S.; Kumar, S.; Murthy, R. Pre-emptive Rotor Blade Damage Identification by Blade Tip Timing Method. J. Eng. Gas Turb. Power 2014, 136, 072503. [Google Scholar] [CrossRef]
- Heath, S. A new technique for identifying synchronous resonances using tip-timing. J. Eng. Gas Turb. Power 2000, 122, 219–225. [Google Scholar] [CrossRef]
- Pan, M.; Yang, Y.; Guan, F.; Hu, H.; Xu, H. Sparse Representation Based Frequency Detection and Uncertainty Reduction in Blade Tip Timing Measurement for Multi-Mode Blade Vibration Monitoring. Sensors 2017, 17, 1745. [Google Scholar]
- Wu, F.; Liang, L.; Xing, J.; Wang, L.; Jia, L. Blade tip timing vibration monitoring method based on fiber Bragg grating. Photonic Sens. 2014, 4, 188–192. [Google Scholar] [CrossRef]
- Rao, R.A.; Dutta, B.K. Vibration analysis for detecting failure of compressor blade. Eng. Fail. Anal. 2012, 25, 211–218. [Google Scholar]
- Jones, H. Shedding light on vibration. Mech. Eng. 1996, 118, 94–98. [Google Scholar]
- Kadoya, Y.; Mase, M.; Kaneko, Y.; Umemura, S.; Oda, T.; Johnson, C.M. Noncontact Vibrational Measurement Technology of Steam Turbine Blade. JSME Int. J. Ser. C Dyn. Control Robot. Des. Manuf. 1995, 38, 486–493. [Google Scholar] [CrossRef]
- Satyam, M.; Rao, V.; Devy, C.G. Cepstrum Analysis—An Advanced Technique in Vibration Analysis of Defects in Rotating Machinery. Def. Sci. J. 1994, 44, 53–60. [Google Scholar] [CrossRef]
- Sinha, J.K.; Hahn, W.; Elbhbah, K.; Tasker, G.; Ullah, I. Vibration investigation for low pressure turbine last stage blade failure in steam turbines of a power plant. In Proceedings of the ASME Turbo Expo 2012, Copenhagen, Denmark, 11–15 June 2012; American Society of Mechanical Engineers: Copenhagen, Denmark, 2012; Volume 7. [Google Scholar]
- Sinha, J.K. Vibration Engineering and Technology of Machinery, Proceedings of VETOMAC X 2014, Held at the University of Manchester, UK, 9–11 September 2014; Springer: Cham, Switzerland, 2015. [Google Scholar]
- Warren, C.; Niezrecki, C.; Avitabile, P. Optical non-contacting vibration measurement of rotating turbine blades II. In Conference Proceedings of the Society for Experimental Mechanics Series; Springer: New York, NY, USA, 2011; Volume 1. [Google Scholar]
- Di Maio, D.; Castellini, P. Rotating Machinery, Hybrid Test Methods, Vibro-Acoustics & Laser Vibrometry, Volume 8: Proceedings of the 35th IMAC, A Conference and Exposition on Structural Dynamics 2017; Springer: Cham, Switzerland, 2017. [Google Scholar]
- Deraemaeker, A. New Trends in Vibration Based Structural Health Monitoring; Springer: Vienna, Austria, 2010. [Google Scholar]
- Tagashira, T.; Sugiyama, N.; Matsuda, Y.; Matsuki, M. (Eds.) Measurement of Blade Tip Clearance Using an Ultrasonic Sensor; American Institute of Aeronautics and Astronautics: Reston, VA, USA, 1997. [Google Scholar]
- Tagashira, T.; Sugiyama, N.; Matsuda, Y.; Matsuki, M. (Eds.) An Experimental Study of Ultrasonic Tip Clearance Sensor; American Institute of Aeronautics and Astronautics: Reston, VA, USA, 1998. [Google Scholar]
- Giurgiutiu, V. Structural Health Monitoring with Piezoelectric Wafer Active Sensors; Elsevier Academic Press: Oxford, UK, 2014. [Google Scholar]
- Cheeke, J.D.N. Fundamentals and Applications of Ultrasonic Waves; CRC Press: Boca Raton, FL, USA, 2002. [Google Scholar]
- Cho, H.; Lissenden, C.J. Structural health monitoring of fatigue crack growth in plate structures with ultrasonic guided waves. Struct. Health Monit. 2012, 11, 393–404. [Google Scholar] [CrossRef]
- Chan, H.; Masserey, B.; Fromme, P. High frequency guided ultrasonic waves for hidden fatigue crack growth monitoring in multi-layer model aerospace structures. Smart Mater. Struct. 2015, 24, 25037. [Google Scholar] [CrossRef]
- Masserey, B.; Fromme, P. Analysis of high frequency guided wave scattering at a fastener hole with a view to fatigue crack detection. Ultrasonics 2017, 76, 78–86. [Google Scholar] [CrossRef]
- Masserey, B.; Fromme, P. In-situ monitoring of fatigue crack growth using high frequency guided waves. NDT E Int. 2015, 71, 1–7. [Google Scholar] [CrossRef]
- Masserey, B.; Fromme, P. Noncontact monitoring of fatigue crack growth using high frequency guided waves. In Proceedings of SPIE. Society of Photo-optical Instrumentation Engineers: Bellingham; Society of Photo-Optical Instrumentation Engineers: Washington, DC, USA, 2014. [Google Scholar]
- Masserey, B.; Fromme, P. Fatigue crack growth monitoring using high-frequency guided waves. Struct. Health Monit. 2013, 12, 484–493. [Google Scholar] [CrossRef]
- Vanlanduit, S.; Guillaume, P.; van der Linden, G. On-line monitoring of fatigue cracks using ultrasonic surface waves. NDT E Int. 2003, 36, 601–607. [Google Scholar] [CrossRef]
- Masserey, B.; Aebi, L.; Mazza, E. Ultrasonic surface crack characterization on complex geometries using surface waves. Ultrasonics 2006, 44 (Suppl. 1), e957–e961. [Google Scholar] [CrossRef]
- Lin, B.; Zhang, L.; Dorantes, D.; Li, Y.; Fu, X.; Hu, X. Numerical simulation of surface acoustic wave and detection of surface crack in steel. Trans. Tianjin Univ. 2011, 17, 254–258. [Google Scholar] [CrossRef]
- Mukhopadhyay, S.C. New Developments and Applications in Sensing Technology; Springer: Berlin/Heidelberg, Germany, 2011. [Google Scholar]
- Willberg, C.; Duczek, S.; Vivar-Perez, J.M.; Ahmad, Z.A.B. Simulation Methods for Guided Wave-Based Structural Health Monitoring: A Review. Appl. Mech. Rev. 2015, 67, 10803. [Google Scholar] [CrossRef]
- Rose, J.L.; Soley, L.E. Ultrasonic guided waves for anomaly detection in aircraft components. Mater. Eval. 2000, 58, 1080–1086. [Google Scholar]
- Achenbach, J.D.; Lin, W.; Keer, L.M. Mathematical modelling of ultrasonic wave scattering by sub-surface cracks. Ultrasonics 1986, 24, 207–215. [Google Scholar] [CrossRef]
- Rose, J.L.; Pelts, S.P.; Quarry, M.J. A comb transducer model for guided wave NDE. Ultrasonics 1998, 36, 163–169. [Google Scholar] [CrossRef]
- Fierro, G.P.M. Development of Nonlinear Ultrasound Techniques for Multidisciplinary Engineering Applications. Ph.D. Thesis, University of Bath, Bath, UK, 2014. [Google Scholar]
- Dutta, D.; Sohn, H.; Harries, K.A.; Rizzo, P. A Nonlinear Acoustic Technique for Crack Detection in Metallic Structures. Struct. Health Monit. 2009, 8, 251–262. [Google Scholar] [CrossRef]
- Friswell, M.I.; Penny, J.E.T. Crack Modeling for Structural Health Monitoring. Struct. Health Monit. 2002, 1, 139–148. [Google Scholar] [CrossRef]
- Kawashima, K.; Omote, R.; Ito, T.; Fujita, H.; Shima, T. Nonlinear acoustic response through minute surface cracks: FEM simulation and experimentation. Ultrasonics 2002, 40, 611–615. [Google Scholar] [CrossRef]
- Morris, W.L.; Buck, O.; Inman, R.V. Acoustic harmonic generation due to fatigue damage in high-strength aluminum. J. Appl. Phys. 1979, 50, 6737–6741. [Google Scholar] [CrossRef]
- Nazarov, V.E.; Sutin, A.M. Nonlinear elastic constants of solids with cracks. J. Acoust. Soc. Am. 1997, 102, 3349–3354. [Google Scholar] [CrossRef]
- Ostrovsky, L.A. Wave processes in media with strong acoustic nonlinearity. J. Acoust. Soc. Am. 1991, 90, 3332–3337. [Google Scholar] [CrossRef]
- Barnard, D.J. Monitoring Fatigue Damage Accumulation with Rayleigh Wave Harmonic Generation Measurements. In Proceedings of the AIP Conference Proceedings, Bellingham, WA, USA, 14–19 July 2002; pp. 1393–1400. [Google Scholar]
- Berwig, P. Anwendung von Ultraschall-Rayleigh-Wellen zur Rissdetektion an Turbinenschaufeln aus Titanaluminid. Bachelor Thesis, Hochschule für Angewandte Wissenschaften München, Munich, Germany, 2014. [Google Scholar]
- Rau, E.; Bamberg, J.; Burchards, J.; Berwig, P.; Voelkl, W. High Resolution Crack Detection on Turbine Blade Roots by the Use of Eddy Current and Ultrasonic Rayleigh Waves. Available online: http://www.ndt.net/article/wcndt2016/papers/we3a2.pdf (accessed on 1 March 2018).
- Rau, E.; Bamberg, J.; Berwig, P. Ultraschallprüfung an Turbinenschaufeln mittels Oberflächenwellen. Available online: https://www.dgzfp.de/Portals/ultraschall2015/BB/8.pdf (accessed on 1 March 2018). (In German).
- Lane, C. The Development of a 2D Ultrasonic Array Inspection for Single Crystal Turbine Blades; Springer: Cham, Switzerland, 2014. [Google Scholar]
- Olympus. Introduction to Phased Array Ultrasonic Technology Applications: Olympus Guideline; Olympus: Waltham, MA, USA, 2004. [Google Scholar]
- Drinkwater, B.W.; Wilcox, P.D. Ultrasonic arrays for non-destructive evaluation: A review. NDT E Int. 2006, 39, 525–541. [Google Scholar] [CrossRef]
- Chatillon, S.; Cattiaux, G.; Serre, M.; Roy, O. Ultrasonic non-destructive testing of pieces of complex geometry with a flexible phased array transducer. Ultrasonics 2000, 38, 131–134. [Google Scholar] [CrossRef]
- Harrold, R.T.; Sanjana, Z.N. Acoustic Waveguide Sensing the Condition of Components within Gas Turbines. U.S. Patent 6487909B2, 3 December 2002. [Google Scholar]
- Harrold, R.T.; Sanjana, Z.N. Monitoring Thermal Barrier Coating Deterioration via Acoustic Response to Gas Flow, Pressure and Impact. U.S. Patent 7062971B2, 20 June 2006. [Google Scholar]
- Willsch, M.; Bosselmann, T.; Theune, N.M. New approaches for the monitoring of gas turbine blades and vanes. In Proceedings of the Sensors 2004 IEEE, Vienna, Austria, 24–27 October 2004. [Google Scholar]
- Atkinson, D.; Hayward, G. The generation and detection of longitudinal guided waves in thin fibers using a conical transformer. IEEE Trans. Ultrason. Ferroelectr. Freq. Control 2001, 48, 1046–1053. [Google Scholar] [CrossRef] [PubMed]
- Wai, Y.; Gao, Y.; Xiao, Z.; Wang, G.; Tian, M.; Liang, H. Ultrasonic Al2O3 Ceramic Thermometry in High-Temperature Oxidation Environment. Sensors 2016, 16, 1905. [Google Scholar] [CrossRef] [PubMed]
- Carlson, N.M.; Musick, C.A.; Watkins, A.D.; Tillotson, R.D.; Mullenix, P.D. Evaluation of a novel temperature sensing probe for monitoring and controlling glass temperature in a joule-heated glass melter. In Proceedings of the Waste management Science Technology in the Ceramic and Nuclear industries (Symbosium I), Indianapolis, IN, USA, 25–28 April 1999; American Ceramic Society: Austin, TX, USA, 1999. [Google Scholar]
- Periyannan, S.; Rajagopal, P.; Balasubramaniam, K. Ultrasonic bent waveguides approach for distributed temperature measurement. Ultrasonics 2017, 74, 211–220. [Google Scholar] [CrossRef]
- Huang, K.N.; Huang, C.F.; Li, Y.C.; Young, M.S. Temperature measurement system based on ultrasonic phase-shift method. In Proceedings of the 2003 IEEE EMBS Asian-Pacific Conference on Biomedical Engineering, Kyoto, Japan, 20–22 October 2003. [Google Scholar]
- Tsai, W.-Y.; Chen, H.-C.; Liao, T.-L. An ultrasonic air temperature measurement system with self-correction function for humidity. Meas. Sci. Technol. 2005, 16, 548–555. [Google Scholar] [CrossRef]
- Dyrwal, A.; Meo, M.; Ciampa, F. Nonlinear air-coupled thermosonics for fatigue micro-damage detection and localisation. NDT E Int. 2018, 97, 59–67. [Google Scholar] [CrossRef]
- Zhang, D. Study of Chaotic Ultrasound and Frequency Sweep Excitations in Sonic IR NDE Technology. Ph.D. Thesis, Wayne State University, Detroit, MI, USA, 2014. [Google Scholar]
- Chimenti, D.E. Review of air-coupled ultrasonic materials characterization. Ultrasonics 2014, 54, 1804–1816. [Google Scholar] [CrossRef]
- Lim, H.J.; Song, B.; Park, B.; Sohn, H. Noncontact fatigue crack visualization using nonlinear ultrasonic modulation. NDT E Int. 2015, 73, 8–14. [Google Scholar] [CrossRef]
- Thiele, S.; Kim, J.-Y.; Qu, J.; Jacobs, L.J. Air-coupled detection of nonlinear Rayleigh surface waves to assess material nonlinearity. Ultrasonics 2014, 54, 1470–1475. [Google Scholar] [CrossRef] [PubMed]
- Zhou, Z.; Zhang, K.; Zhou, J.; Sun, G.; Wang, J. Application of laser ultrasonic technique for non-contact detection of structural surface-breaking cracks. Opt. Laser Technol. 2015, 73, 173–178. [Google Scholar] [CrossRef]
- Arias, I. Modeling of the Detection of Surface-Breaking Cracks by Laser Ultrasonics. Ph.D. Thesis, Northwestern University, Evanston, IL, USA, 2003. [Google Scholar]
- Liu, P.; Nazirah, A.W.; Sohn, H. Numerical simulation of damage detection using laser-generated ultrasound. Ultrasonics 2016, 69, 248–258. [Google Scholar] [CrossRef] [PubMed]
- An, Y.-K.; Kwon, Y.; Sohn, H. Noncontact laser ultrasonic crack detection for plates with additional structural complexities. Struct. Health Monit. 2013, 12, 522–538. [Google Scholar] [CrossRef]
- Pei, C.; Demachi, K.; Fukuchi, T.; Koyama, K.; Uesaka, M. Cracks measurement using fiber-phased array laser ultrasound generation. J. Appl. Phys. 2013, 113, 163101. [Google Scholar] [CrossRef]
- Dhital, D.; Lee, J. A Fully Non-Contact Ultrasonic Propagation Imaging System for Closed Surface Crack Evaluation. Exp. Mech. 2012, 52, 1111–1122. [Google Scholar] [CrossRef]
- Amini, M.H.; Sinclair, A.N.; Coyle, T.W. High Temperature Ultrasonic Transducer for Real-time Inspection. Phys. Procedia 2015, 70, 343–347. [Google Scholar] [CrossRef]
- Kažys, R.; Voleišis, A.; Voleišienė, B. High temperature ultrasonic transducers. Ultragarsas 2008, 63, 7–17. [Google Scholar]
- Searfass, C.T.; Tittmann, B.R. High temperature ultrasonic transducer up to 1000 °C using lithium niobate single crystal. Appl. Phys. Lett. 2010, 97, 232901. [Google Scholar] [CrossRef]
- Salas, K.I.; Cesnik, C.E.S. Guided wave excitation by a CLoVER transducer for structural health monitoring: Theory and experiments. Smart Mater. Struct. 2009, 18, 75005. [Google Scholar] [CrossRef]
- Edwards, R.S.; Dixon, S.; Jian, X. Depth gauging of defects using low frequency wideband Rayleigh waves. Ultrasonics 2006, 44, 93–98. [Google Scholar] [CrossRef] [PubMed]
- Jian, X.; Dixon, S.; Guo, N.; Edwards, R. Rayleigh wave interaction with surface-breaking cracks. J. Appl. Phys. 2007, 101, 064906. [Google Scholar] [CrossRef]
- Jian, X.; Dixon, S.; Guo, N.; Edwards, R.S.; Potter, M. Pulsed Rayleigh wave scattered at a surface crack. Ultrasonics 2006, 44 (Suppl. 1), e1131–e1134. [Google Scholar] [CrossRef] [PubMed]
- Dixon, S.; Burrows, S.E.; Dutton, B.; Fan, Y. Detection of cracks in metal sheets using pulsed laser generated ultrasound and EMAT detection. Ultrasonics 2011, 51, 7–16. [Google Scholar] [CrossRef] [PubMed]
- Kerr, C.; Ivey, P. Optical pyrometry for gas turbine aeroengines. Sens. Rev. 2004, 24, 378–386. [Google Scholar] [CrossRef]
- Feist, J.P.; Sollazzo, P.Y.; Berthier, S.; Charnley, B.; Wells, J. Precision Temperature Detection Using a Phosphorescence Sensor Coating System on a Rolls-Royce Viper Engine. In Proceedings of the ASME Turbo Expo, Copenhagen, Denmark, 11 June 2012; American Society of Mechanical Engineers: New York, NY, USA, 2012; pp. 917–926. [Google Scholar]
- Meher-Homji, C.B. Blading Vibration and Failures in Gas Turbines: Part C—Detection and Troubleshooting. In ASME 1995 International Gas Turbine and Aeroengine Congress and Exposition: Volume 4: Heat Transfer; Electric Power; Industrial and Cogeneration, Houston, TX, USA, 5 June 1995; American Society of Mechanical Engineers: New York, NY, USA, 1995; p. V004T11A016. [Google Scholar]
- Rohy, D.A.; Compton, W.A. Radiation Pyrometer for Gas Turbine Bades. SAE Trans. 1972, 81, 720001–720196. [Google Scholar]
- Becker, W.J.; Roby, R.J.; O’Brien, W.F.; Bensing, G.K. Dynamic turbine blade temperature measurements. J. Propul. Power 1994, 10, 69–78. [Google Scholar] [CrossRef]
- Beynon, T.G.R. (Ed.) Turbine Pyrometry—An Equipment Manufacturer’s View; ASME: New York, NY, USA, 1981. [Google Scholar]
- Lucia, M.; Lanfranchi, C. An infrared pyrometry system for monitoring gas turbine blades: Development of a computer model and experimental results. J. Eng. Gas Turb. Power 1994, 116, 172–177. [Google Scholar] [CrossRef]
- Douglas, J.; Smith, C.A.; Taylor, S.J.R. An integrated approach to the application of high bandwidth optical pyrometry to turbine blade surface temperature mapping. In Proceedings of the 18th International Congress on Instrumentation in Aerospace Simulation Facilities, Toulouse, France, 14–17 June 1999. [Google Scholar]
- Alaruri, S.; Bianchini, L.; Brewington, A. Effective spectral emissivity measurements of superalloys and YSZ thermal barrier coating at high temperatures using a 1.6 μm single wavelength pyrometer. Opt. Lasers Eng. 1998, 30, 77–91. [Google Scholar] [CrossRef]
- Gao, S.; Feng, C.; Wang, L.; Li, D. Multi-spectral temperature measurement method for gas turbine blade. Opt. Rev. 2016, 23, 17–25. [Google Scholar] [CrossRef]
- Kerr, C. An overview of the measurement errors associated with gas turbine aeroengine pyrometer systems. Meas. Sci. Technol. 2002, 13, 873–881. [Google Scholar] [CrossRef]
- Ketui, D.; Chi, F.; Shan, G. Single wavelength and ratio pyrometry reflection errors in temperature measurement of gas turbine blade. Measurement 2016, 86, 133–140. [Google Scholar] [CrossRef]
- Lemieux, D.H. On-Line Thermal Barrier Coating Monitoring for Real-Time Failure Protection and Life Maximization; Siemens Westinghouse Power Corporation: Orlando, FL, USA, 2003. [Google Scholar]
- Bison, P.G.; Cernuschi, F.; Grinzato, E. Ageing evaluation of thermal barrier coating: Comparison between pulsed thermography and thermal wave interferometry. Quant. Infrared Thermogr. J. 2006, 3, 169–181. [Google Scholar] [CrossRef]
- Bison, P.; Cernuschi, F.; Grinzato, E. In-depth and In-plane Thermal Diffusivity Measurements of Thermal Barrier Coatings by IR Camera: Evaluation of Ageing. Int. J. Thermophys. 2008, 29, 2149–2161. [Google Scholar] [CrossRef]
- Sun, J.G.; Tao, N. Thermal property measurement for thermal barrier coatings using pulsed thermal imaging—Multilayer analysis method. In AIP Conference Proceedings; AIP Publishing: Melville, NY, USA, 2016; Volume 1706. [Google Scholar]
- Meola, C.; Carlomagno, G.M.; Di Foggia, M.; Natale, O. Infrared thermography to detect residual ceramic in gas turbine blades. Appl. Phys. A 2008, 91, 685–691. [Google Scholar] [CrossRef]
- Topal, A.; Catori, C.; Cagan, L.; Uslu, S.; Turan, O.; Piskin, A. One-Dimensional Heat Transfer Analysis and Experimental Investigation of a Gas Turbine Combustor. In Proceedings of the CONV-14: International Symposium on Convective Heat and Mass Transfer, Kusadasi, Turkey, 8–13 June 2014; Begell House: Antalya, Turkey, 2014; p. 15. [Google Scholar]
- Feist, J.P.; Sollazzo, P.Y.; Berthier, S.; Charnley, B.; Wells, J. Application of an Industrial Sensor Coating System on a Rolls-Royce Jet Engine for Temperature Detection. In Proceedings of the ASME Turbo Expo, Copenhagen, Denmark, 11–15 June 2012; p. 191. [Google Scholar]
- Heyes, A.L.; Rabhiou, A.; Feist, J.P.; Kempf, A.M. Phosphor Based Temperature Indicating Paints. In Proceedings of the ASME Turbo Expo, Copenhagen, Denmark, 11–15 June 2012; p. 927. [Google Scholar]
- Pilgrim, C.C.; Sollazzo, P.Y.; Feist, J.P.; Beyrau, F.; Heyes, A.L.; Yañez Gonzalez, A.; Nicholls, J.R. Temperature Sensing inside Thermal Barrier Coatings using Phosphor Thermometry. In Proceedings of the IET & ISA 60th International Instrumentation Symposium, London, UK, 24–26 June 2014; p. 3.1.2. [Google Scholar]
- Yañez, G.A.; Pilgrim, C.C.; Feist, J.P.; Sollazzo, P.Y.; Beyrau, F.; Heyes, A.L. On-Line Temperature Measurement Inside a Thermal Barrier Sensor Coating During Engine Operation. J. Turbomach. 2015, 137, 101004. [Google Scholar] [CrossRef]
- Khalid, A.H.; Kontis, K.; Behtash, H.-Z. Phosphor thermometry in gas turbines: Consideration factors. Proc. Inst. Mech. Eng. Part G J. Aerosp. Eng. 2010, 224, 745–755. [Google Scholar] [CrossRef]
- Pilgrim, C.C.; González, A.Y.; Saggese, R.; Krewinkel, R.; Blaswich, M.; Feist, J.P.; Orth, U.; Rabs, M.; Frank, D.; Rodríguez, S.A. Surface temperature measurement in an industrial gas turbine using thermal history paints. In Proceedings of the 12th European Conference on Turbomachinery Fluid dynamics & Thermodynamics, Stockholm, Sweden, 3–7 April 2017. [Google Scholar]
- Krewinkel, R.; Färber, J.; Lauer, M.; Frank, D.; Orth, U.; Gonzalez, A.Y.; Pilgrim, C.; Feist, J.; Saggese, R.; Berthier, S.; et al. (Eds.) Validation of Surface Temperature Measurements on a Combustor Liner Under Full-Load Conditions Using a Novel Thermal History Paint; The American Society of Mechanical Engineers: New York, NY, USA, 2016. [Google Scholar]
- Carl, V.; Zenzinger, G. Automatische Rissprüfung mit induktiv angeregter Thermografie. 2005. Available online: https://www.ndt.net/article/dgzfp05/v58.pdf (accessed on 13 July 2018).
- Netzelmann, U.; Walle, G.; Lugin, S.; Ehlen, A.; Bessert, S.; Valeske, B. Induction thermography: Principle, applications and first steps towards standardization. In Proceedings of the 2015 Asia International Conference on Quantitative InfraRed Thermography, Mahabalipuram, Indian, 6–10 July 2015. [Google Scholar]
- Šrajbr, C.; Mehler, S. Induktionsthermografie zur automatisierten Rissprüfung von Flugzeugstrukturen aus Aluminium. 2013. Available online: http://www.dgzfp.de/Portals/thermo2013/BB/vortrag%2012.pdf (accessed on 13 July 2018).
- Šrajbr, C. Anwendung der Induktionsthermografie im industriellen Umfeld. 2015. Available online: https://www.dgzfp.de/Portals/thermo2015/BB/13.pdf (accessed on 13 July 2018).
- Bamberg, J.; Erbeck, G.; Zenzinger, G. EddyTherm: Ein Verfahren zur bildgebenden Rißprüfung metallischer Bauteile. 1999. Available online: https://www.ndt.net/article/dgzfp/pdf/zfp68-bamberg.pdf (accessed on 15 July 2018).
- Vrana, J. Grundlagen und Anwendungen der aktiven Thermographie mit elektromagnetischer Anregung: Induktions- und Konduktionsthermographie. Ph.D. Thesis, Universität des Saarlandes, Saarbrücken, Germany, 2008. (In German). [Google Scholar]
- Spießberger, C.; Dillenz, A.; Zweschper, T. Rissprüfung mittels aktiver Thermografieverfahren: Induktions- und Ultraschallanregung im Vergleich. 2011. Available online: http://www.dgzfp.de/Portals/thermo2011/BB/v07.pdf (accessed on 13 July 2018). (In German).
- Al-Obaidi, S.M.A.; Leong, M.S.; Hamzah, R.R.; Abdelrhman, A.M. A Review of Acoustic Emission Technique for Machinery Condition Monitoring: Defects Detection & Diagnostic. Appl. Mech. Mater. 2012, 229–231, 1476–1480. [Google Scholar]
- Nashed, M.S.; Steel, J.A.; Reuben, R.L. The use of acoustic emission for the condition assessment of gas turbines: Acoustic emission generation from normal running. Proc. Inst. Mech. Eng. Part E J. Process Mech. Eng. 2014, 228, 286–308. [Google Scholar] [CrossRef]
- Mba, D.; Hall, L.D. The transmission of acoustic emission across large-scale turbine rotors. NDT E Int. 2002, 35, 529–539. [Google Scholar] [CrossRef]
- Mba, D. Development of Acoustic Emission Technology for Condition Monitoring and Diagnosis of Rotating Machines: Bearings, Pumps, Gearboxes, Engines, and Rotating Structures. Shock Vib. Dig. 2006, 38, 3–16. [Google Scholar] [CrossRef]
- Leahy, M.; Mba, D.; Cooper, P.; Montgomery, A.; Owen, D. Experimental investigation into the capabilities of acoustic emission for the detection of shaft-to-seal rubbing in large power generation turbines: A case study. Proc. Inst. Mech. Eng. Part J J. Eng. Tribol. 2006, 220, 607–615. [Google Scholar] [CrossRef]
- Mba, D.; Cooke, A.; Roby, D.; Hewitt, G. Detection of shaft-seal rubbing in large-scale power generation turbines with acoustic emissions. Case study. Proc. Inst. Mech. Eng. Part A J. Power Energy 2004, 218, 71–81. [Google Scholar] [CrossRef]
- Mathioudakis, K.; Papathanasiou, A.; Loukis, E.; Papailiou, K. Fast response wall pressure measurement as a means of gas turbine blade fault identification. J. Eng. Gas Turb. Power 1991, 113, 269–275. [Google Scholar] [CrossRef]
- Mathioudakis, K.; Loukis, E.; Papailiou, K. Casing Vibration and Gas Turbine Operating Conditions. J. Eng. Gas Turb. Power 1990, 112, 478–485. [Google Scholar] [CrossRef]
- Forbes, G.L.; Randall, R.B. Estimation of turbine blade natural frequencies from casing pressure and vibration measurements. Mech. Syst. Signal Process. 2013, 36, 549–561. [Google Scholar] [CrossRef]
- Forbes, G.L. Non-contact gas turbine blade vibration monitoring using internal pressure and casing response measurements. Ph.D. Thesis, The University of New South Wales, School of Mechanical and Manufacturing Engineering, Sydney, Australia, 2010. [Google Scholar]
- Forbes, G.L.; Randall, R.B. Simulation of Gas Turbine Blade Vibration Measurement from Unsteady Casing Wall Pressure; Australian Acoustical Society: Adelaide, Australia, 2009. [Google Scholar]
- Forbes, G.L.; Randall, R.B. Simulated Gas Turbine Casing Response to Rotor Blade Pressure Excitation; Australian Acoustical Society: Adelaide, Australia, 2007. [Google Scholar]
- Forbes, G.L.; Randall, R.B. Detection of a Blade Fault from Simulated Gas Turbine Casing Response Measurements; DEStech Publications: Lancaster, PA, USA, 2008. [Google Scholar]
- Longtin, J.; Sampath, S.; Tankiewicz, S.; Gambino, R.J.; Greenlaw, R.J. Sensors for harsh environments by direct-write thermal spray. IEEE Sens. J. 2004, 4, 118–121. [Google Scholar] [CrossRef]
- Schonberg, T.; Ruusuvuori, K.; Christensen, B.H.; Boivie, K.; Berild, J.P.; Ronkainen, H.; Gellein, L.T. Surface embedded temperature sensor on tool part for real time injection moulding process monitoring. In Proceedings of the 2013 Transducers & Eurosensors XXVII: The 17th International Conference on Solid-State Sensors, Actuators and Microsystems (TRANSDUCERS & EUROSENSORS XXVII), Barcelona, Spain, 16–20 June 2013; pp. 116–119. [Google Scholar]
- Zhang, Y.; Mack, D.; Mauer, G.; Vaßen, R. Laser Cladding of Embedded Sensors for Thermal Barrier Coating Applications. Coatings 2018, 8, 176. [Google Scholar] [CrossRef]
- Li, J.; Longtin, J.P.; Tankiewicz, S.; Gouldstone, A.; Sampath, S. Interdigital capacitive strain gauges fabricated by direct-write thermal spray and ultrafast laser micromachining. Sens. Actuators A Phys. 2007, 133, 1–8. [Google Scholar] [CrossRef]
- Li, P.; Wen, Y.; Zheng, M.; Zhou, Z. Self-powered Piezoelectric Wireless Micro-sensors by Absorbing Electromagnetic Energy. In Proceedings of the 2004 IEEE Sensors, Vienna, Austria, 24–27 October 2004; Vienna University of Technology: Vienna, Austria, 2004. [Google Scholar]
- Xia, R.; Farm, C.; Choi, W.; Kim, S.-G. Self-Powered Wireless Sensor System using MEMS Piezoelectric Micro Power Generator. In Proceedings of the 2006 IEEE Sensors, Daegu, Korea, 22–25 October 2006. [Google Scholar]
- Chen, Q.; Tong, T.; Longtin, J.P.; Tankiewicz, S.; Sampath, S.; Gambino, R.J. Novel Sensor Fabrication Using Direct-Write Thermal Spray and Precision Laser Micromachining. J. Manuf. Sci. Eng. 2004, 126, 830. [Google Scholar] [CrossRef]
- Hon, K.K.B.; Li, L.; Hutchings, I.M. Direct writing technology—Advances and developments. CIRP Ann. 2008, 57, 601–620. [Google Scholar] [CrossRef]
- Pique, A. Direct-Write Technologies for Rapid Prototyping Applications Sensors, Electronics, and Integrated Power Sources; San Diego Academic Press: San Diego, CA, USA, 2002. [Google Scholar]
- LG Tech-Link Global. Uniform Crystal Temperature Sensor Technology and Support Services. Available online: http://www.lgtechlink.com (accessed on 15 July 2018).
- Sheth, A.; Thomas, A. Uniform Crystal Temperature Sensor (UCTS) Application to Validation, Verification and Technical Comparison Processes; UC DRC: Lynn, MA, USA, 2015. [Google Scholar]
- DeVoe, J.; Thomas, A.; DeVoe, R.; Ginzbursky, E. Gas temperature measurement in engine conditions using uniform crystal temperature sensors (UCTS): GT2018-76890. In ASME Turbo Expo 2018: Turbomachinery Technical Conference and Exposition; American Society of Mechanical Engineers: New York, NY, USA, 2018; p. V05BT13A016. [Google Scholar]
- DeVoe, J.; Odom, S.; Ginzbursky, L. Uniform Crystal Temperature Sensor Accuracy Under Transient Conditions: GT2012-68197. In ASME Turbo Expo 2012; American Society of Mechanical Engineers: New York, NY, USA, 2012; pp. 79–87. [Google Scholar]
- Kubiak, J.A.; Franco, J.M.; Carnero, A.; Rothhirsch, L.A.; Aguirre, R.J. A Diagnosis of Failure of a Compressor Blade. In Volume 5: Manufacturing Materials and Metallurgy; Ceramics; Structures and Dynamics; Controls, Diagnostics and Instrumentation; Process Industries; General, Anaheim, CA, USA, 31 May 1987; American Society of Mechanical Engineers: New York, NY, USA, 1987; p. V005T13A003. [Google Scholar]
- Lattime, S.B.; Steinetz, B.M. Turbine Engine Clearance Control Systems: Current Practices and Future Directions. In Proceedings of the 38th AIAA/ASME/SAE/ASEE Joint Propulsion Conference & Exhibit, Indianapolis, IN, USA, 7–10 July 2002. [Google Scholar]
- Salar, A.; Hosseini, S.M.; Zangmolk, B.R.; Sedigh, A.K. Improving Model-Based Gas Turbine Fault Diagnosis Using Multi-Operating Point Method. In Proceedings of the 2010 Fourth UKSim European Symposium on Computer Modeling and Simulation (EMS), Pisa, Italy, 17–19 November 2010. [Google Scholar]
- Diallo, O.; Mavris, D. A data analytics approach to failure precursor detection of gas turbine. In ASME 2011 Turbo Expo: Turbine Technical Conference and Exposition; American Society of Mechanical Engineers: New York, NY, USA, 2011; Volume 3. [Google Scholar]
- Hanachi, H.; Liu, J.; Chen, Y.; Koul, A. A Physics-Based Modeling Approach for Performance Monitoring in Gas Turbine Engines. IEEE Trans. Reliab. 2015, 64, 197–205. [Google Scholar] [CrossRef]
- Dewallef, P.; Borguet, S. A Methodology to Improve the Robustness of Gas Turbine Engine Performance Monitoring Against Sensor Faults. J. Eng. Gas Turb. Power 2013, 135, 51601. [Google Scholar] [CrossRef]
- Borguet, S.; Léonard, O. Comparison of adaptive filters for gas turbine performance monitoring. J. Comput. Appl. Math. 2010, 234, 2202–2212. [Google Scholar] [CrossRef]
- Tahan, M.; Tsoutsanis, E.; Muhammad, M.; Abdul, K.Z.A. Performance-based health monitoring, diagnostics and prognostics for condition-based maintenance of gas turbines: A review. Appl. Energy 2017, 198, 122–144. [Google Scholar] [CrossRef]


| Continuous Duty | Cyclic Duty |
|---|---|
| Rupture | TMF |
| Creep deflection | High-cycle fatigue |
| High-cycle fatigue | Rubbing/wear |
| Oxidation | Foreign object damage |
| Erosion | Combined failure mechanism (creep/fatigue, corrosion/fatigue, oxidation/erosion and so on) |
| Corrosion | |
| Rubbing/wear | |
| Foreign object damage | |
| Combined failure mechanism (creep/fatigue, corrosion/fatigue, oxidation/erosion and so on) |
| Sensing Technology | Failure Modes | NDT | SHM | Temp. limit | Band-width | Accuracy | Sensitivity | Costs | |
|---|---|---|---|---|---|---|---|---|---|
| Tip timing method | Microwave probes | Creep Crack Rubbing Wear | X | + | + | + | 0 | 0 | |
| Optical sensor | X | − | + | + | + | − | |||
| Inductive sensors | X | − | + | + | + | + | |||
| EC sensors | X | − | 0 | + | 0 | 0 | |||
| Magnetoresistive sensors | X | + | + | + | + | + | |||
| Capacitance sensors | X | + | 0 | 0 | 0 | + | |||
| Vibrational monitoring | Rubbing FOD Crack | X | 0 | + | - | - | + | ||
| Ultrasound | Waveguides | Crack | X | + | 0 | + | + | + | |
| Thermosonic | X | − | 0 | + | + | 0 | |||
| Laser Ultrasonic | X | − | 0 | + | + | − | |||
| High temperature transducers | X | + | 0 | + | + | − | |||
| EMAT | X | − | 0 | + | + | 0 | |||
| Temperature measurements | Pyrometry | − | X | − | + | + | + | − | |
| Infrared thermography | Creep LCF Corrosion Erosion Oxidation | X | X | − | + | + | + | − | |
| Phosphor thermometry | − | X | + | − | 0 | 0 | − | ||
| Induction thermography | Crack | X | − | + | + | + | − | ||
| AE | Creep Crack | X | − | 0 | 0 | - | + | ||
| Mm-waves | Crack Wear | X | X | − | 0 | + | + | − | |
| Pressure measurements | Crack Creep Rubbing | X | + | + | + | + | + | ||
| DWTS | Crack | X | + | + | 0 | + | − | ||
| UCTS | − | X | + | + | 0 | + | − | ||
| Performance monitoring | Cracks Wear | X | + | 0 | − | − | + |
© 2019 by the authors. Licensee MDPI, Basel, Switzerland. This article is an open access article distributed under the terms and conditions of the Creative Commons Attribution (CC BY) license (http://creativecommons.org/licenses/by/4.0/).
Share and Cite
Mevissen, F.; Meo, M. A Review of NDT/Structural Health Monitoring Techniques for Hot Gas Components in Gas Turbines. Sensors 2019, 19, 711. https://doi.org/10.3390/s19030711
Mevissen F, Meo M. A Review of NDT/Structural Health Monitoring Techniques for Hot Gas Components in Gas Turbines. Sensors. 2019; 19(3):711. https://doi.org/10.3390/s19030711
Chicago/Turabian StyleMevissen, Frank, and Michele Meo. 2019. "A Review of NDT/Structural Health Monitoring Techniques for Hot Gas Components in Gas Turbines" Sensors 19, no. 3: 711. https://doi.org/10.3390/s19030711
APA StyleMevissen, F., & Meo, M. (2019). A Review of NDT/Structural Health Monitoring Techniques for Hot Gas Components in Gas Turbines. Sensors, 19(3), 711. https://doi.org/10.3390/s19030711