Article

Limits of the Effective Medium Theory in Particle Amplified Surface Plasmon Resonance Spectroscopy Biosensors

1
Department of Electrical Engineering, Federal University of Pará, Belém-PA 66075-110, Brazil
2
Department of Physics, Pontifical Catholic University of Rio de Janeiro, Rio de Janeiro-RJ 22451-900, Brazil
3
Department of Chemistry, Pontifical Catholic University of Rio de Janeiro, Rio de Janeiro-RJ 22451-900, Brazil
4
Division of Metrology of Materials, National Institute of Metrology Quality and Technology - INMETRO, Duque de Caxias- RJ 25250-020, Brazil
*
Author to whom correspondence should be addressed.
Sensors 2019, 19(3), 584; https://doi.org/10.3390/s19030584
Submission received: 15 November 2018 / Revised: 30 December 2018 / Accepted: 2 January 2019 / Published: 30 January 2019
(This article belongs to the Special Issue Surface Plasmon Resonance Sensing 2019)

Abstract

:
The resonant wave modes in monomodal and multimodal planar Surface Plasmon Resonance (SPR) sensors and their response to a bidimensional array of gold nanoparticles (AuNPs) are analyzed both theoretically and experimentally, to investigate the parameters that rule the correct nanoparticle counting in the emerging metal nanoparticle-amplified surface plasmon resonance (PA-SPR) spectroscopy. With numerical simulations based on the Finite Element Method (FEM), we evaluate the error performed in the determination of the surface density of nanoparticles σ when the Maxwell-Garnett effective medium theory is used for fast data processing of the SPR reflectivity curves upon nanoparticle detection. The deviation increases directly with the manifestations of non-negligible scattering cross-section of the single nanoparticle, dipole-dipole interactions between adjacent AuNPs and dipolar interactions with the metal substrate. Near field simulations show clearly the set-up of dipolar interactions when the dielectric thickness is smaller than 10 nm and confirm that the anomalous dispersion usually observed experimentally is due to the failure of the effective medium theories. Using citrate stabilized AuNPs with a nominal diameter of about 15 nm, we demonstrate experimentally that Dielectric Loaded Waveguides (DLWGs) can be used as accurate nanocounters in the range of surface density between 20 and 200 NP/µm2, opening the way to the use of PA-SPR spectroscopy on systems mimicking the physiological cell membranes on SiO2 supports.

Graphical Abstract

1. Introduction

Surface plasmon resonance (SPR) spectroscopy, is today one of the principal optical techniques used for the development of low cost and high resolution chemical and bio-chemical optical sensors [1]. The detection principle of SPR sensors is based on the perturbation of the near electromagnetic field at the metal-dielectric interface of the sensing platform, provoked by the interaction of the external surface with the analytes of interest [2]. In order to enhance the sensitivity of the SPR-based optical sensors, different data processing methods and excitation or detection schemes have been proposed [3,4,5], and an ultimate SPR spectroscopy resolution of about 10−7 RIU has been determined in the classical Kreschtmann configuration with an angular interrogation scheme [6]. The latter value is associated to bulk refractive changes of the external medium.
In some particular applications, the spatial overlap between the analytes and the evanescent electromagnetic field of the surface plasmon polariton (SPP) propagating along the metal-dielectric interface, has to be taken in account for the determination of the geometrical properties of the sensing platforms necessary to obtain the higher sensitivity. For example, when nanometric targets are considered, the best performances are obtained by the deposition of a ~30 nm thin film of SiO2 over the metal layer supporting the plasma wave [7]. Alternatively, the monitoring of the interaction of bio-molecules with systems mimicking the physiological cell membranes on solid supports is performed with the best sensitivity by the use of dielectric loaded waveguide (DLWG) [8,9], due to the wider extension of the evanescent electromagnetic field of the guided modes into the external medium. More recently, an alternative strategy consisting in the manipulation of the target species has been proposed for the enhancement of the sensitivity of the SPR optical sensor, giving rise to the so-called particle amplified surface plasmon resonance (PA-SPR) spectroscopy [10].
In PA-SPR spectroscopy, the analyte bio-molecules are previously chemically attached to the surface of gold nanoparticles (AuNPs), and the external surface of the sensing platform is functionalized with a proper bio-recognition element with high and selective affinity with the target bio-molecules. In the last decade, PA-SPR spectroscopy in the Kreschtmann configuration has demonstrated to enhance the sensitivity of optical bio-sensors up to 1000-fold enhancement [11,12,13,14]. Due to this extremely high sensitivity, PA-SPR imaging spectroscopy has also been recently applied for single nanoparticle detection, and a detailed study of the chemical affinity of different kinds of metal and dielectric nanoparticles with gold thin films modified by different ω-functionalized alkyl thiols [15].
In addition to the single nanoparticle detection [15], one of the challenges in PA-SPR spectroscopy consists in the fast measurement of the nanoparticle surface density σ, in order to monitor in real time the mass surface coverage of the target molecules which, linked to the AuNPs, interacts with the bio-recognition element deposited over the outer surface of the SPR sensing platform. The simplest approach for the fast and in real time determination of the mass surface coverage is the use of the Maxwell-Garnett (MG) theory which, due to the set-up of interparticle interaction, can be applied only in a definite range of σ. The limits of the effective medium theories in the interpretation of the experimental results in PA-SPR spectroscopy were investigated for the first time from an experimental point of view in [7,13]. In [13], the authors amplified the SPR signal by the use of biotin-capped AuNPs with a mean diameter of 24 nm, and observed that the increase in the surface density σ of the nanoparticles is associated to a progressive bigger deviation between the experimental and theoretical results, the latter obtained in the frame of the MG theory [16].
This discrepancy was associated to the onset of interparticle dipolar interactions, which are not the only cause leading to the failure of the effective medium theories in the determination of σ or, alternatively, of the effective dielectric function of the AuNPs/water composite layer. In fact, as pointed out experimentally in [7], when the distance between the gold layer supporting the plasma wave and the AuNPs gets progressively smaller, a distance-dependent intrinsic dielectric function of the nanoparticle has to be introduced to explain the experimental results. In the case of very thin SiO2 spacing layers (<10 nm), anomalous dispersion of the dielectric function of the AuNPs is observed [7], and numerical or semianalytical models taking into account the optical anisotropy of the AuNPs have to be used for the accurate determination of the surface density [17].
In the present paper, we perform a theoretical study of an SPR metal nanoparticle sensor in the Kreschtmann configuration, focused on the sensitivity response and the dependence of the dipole-dipole interactions on the dielectric spacer thickness, the dimension of the AuNPs, the surface density σ and the wavelength of the exciting electromagnetic wave. We compare a semi-analytical approach based on the effective medium theory, which neglects dipole-dipole interactions, with a numerical method developed by using Finite Element Method (FEM) in COMSOL Multiphysics® software [18], which gives exact results for the interpretation of the reflectivity curves of the sensors upon interaction with the AuNPs.
The study defines the limited range of σ for which the counting of the nanoparticles interacting with the SiO2 surface of the sensing platform can be determined with a finite percentage accuracy δσ by the use of the effective medium theory. The importance of this research is not limited to PA-SPR spectroscopy, but extend to others amplified spectroscopies, such as the surface enhanced Raman spectroscopy (SERS) [19], where the knowledge of the surface density of nanoparticles is fundamental to measure the associated electromagnetic enhancement factor [19]. We conclude the article demonstrating for the first time experimental AuNP counting over DLWGs, presenting both TM0 and TM1 modes at the wavelength of 783 nm. In the low surface density regime, when dipole-dipole interparticle interactions are negligible, we show an excellent match between atomic force microscopy (AFM) and SPR-based results, demonstrating the possibility to extend in a near future the application of PA-SPR spectroscopy to the monitoring of nanoparticle uptake by lipidic or artificial cellular membranes [20,21].

2. Materials and Methods

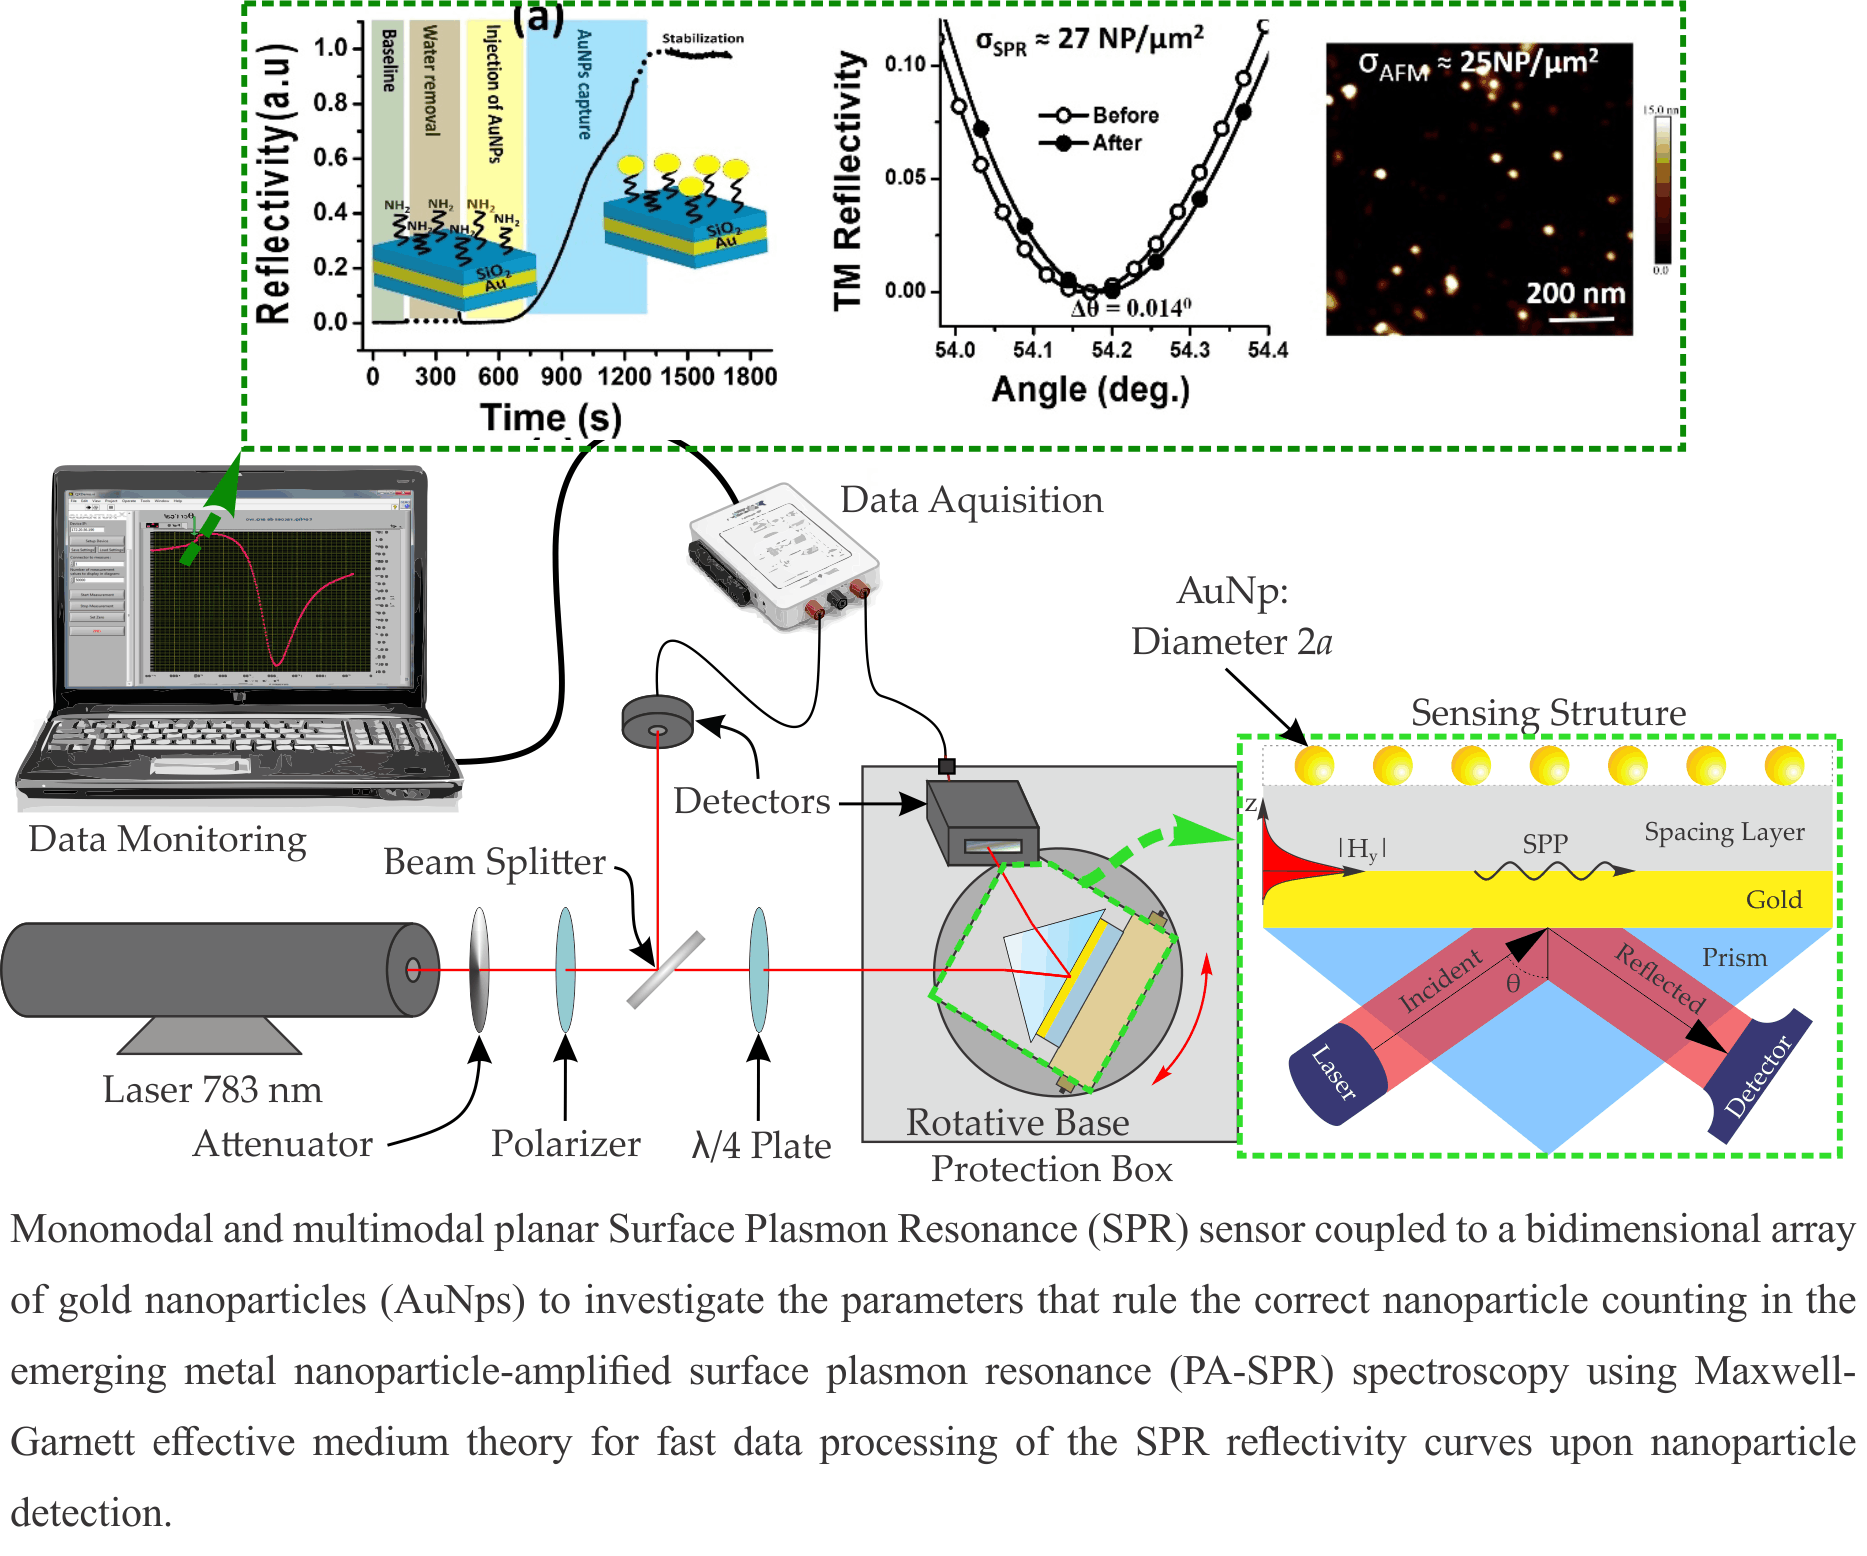
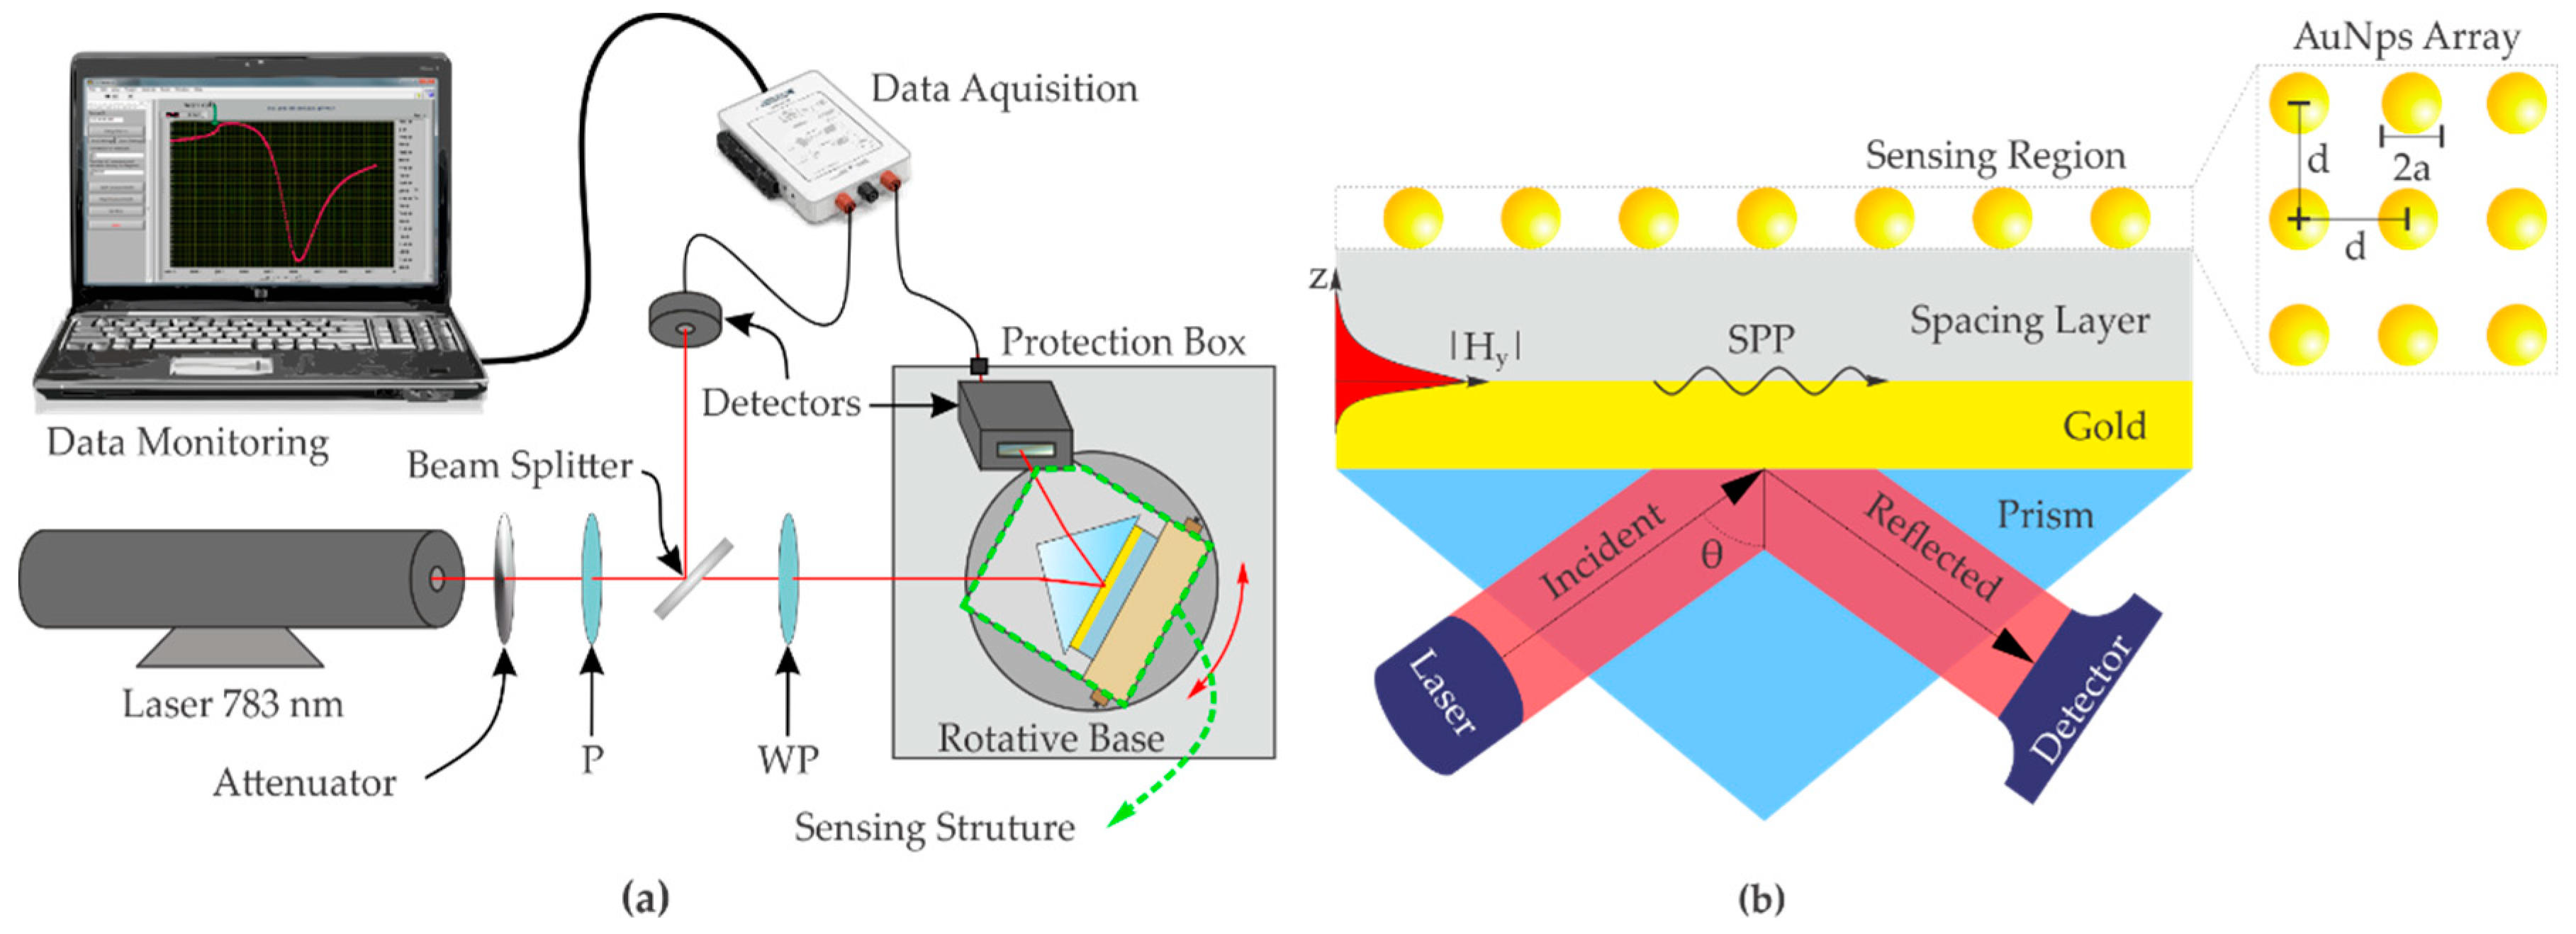
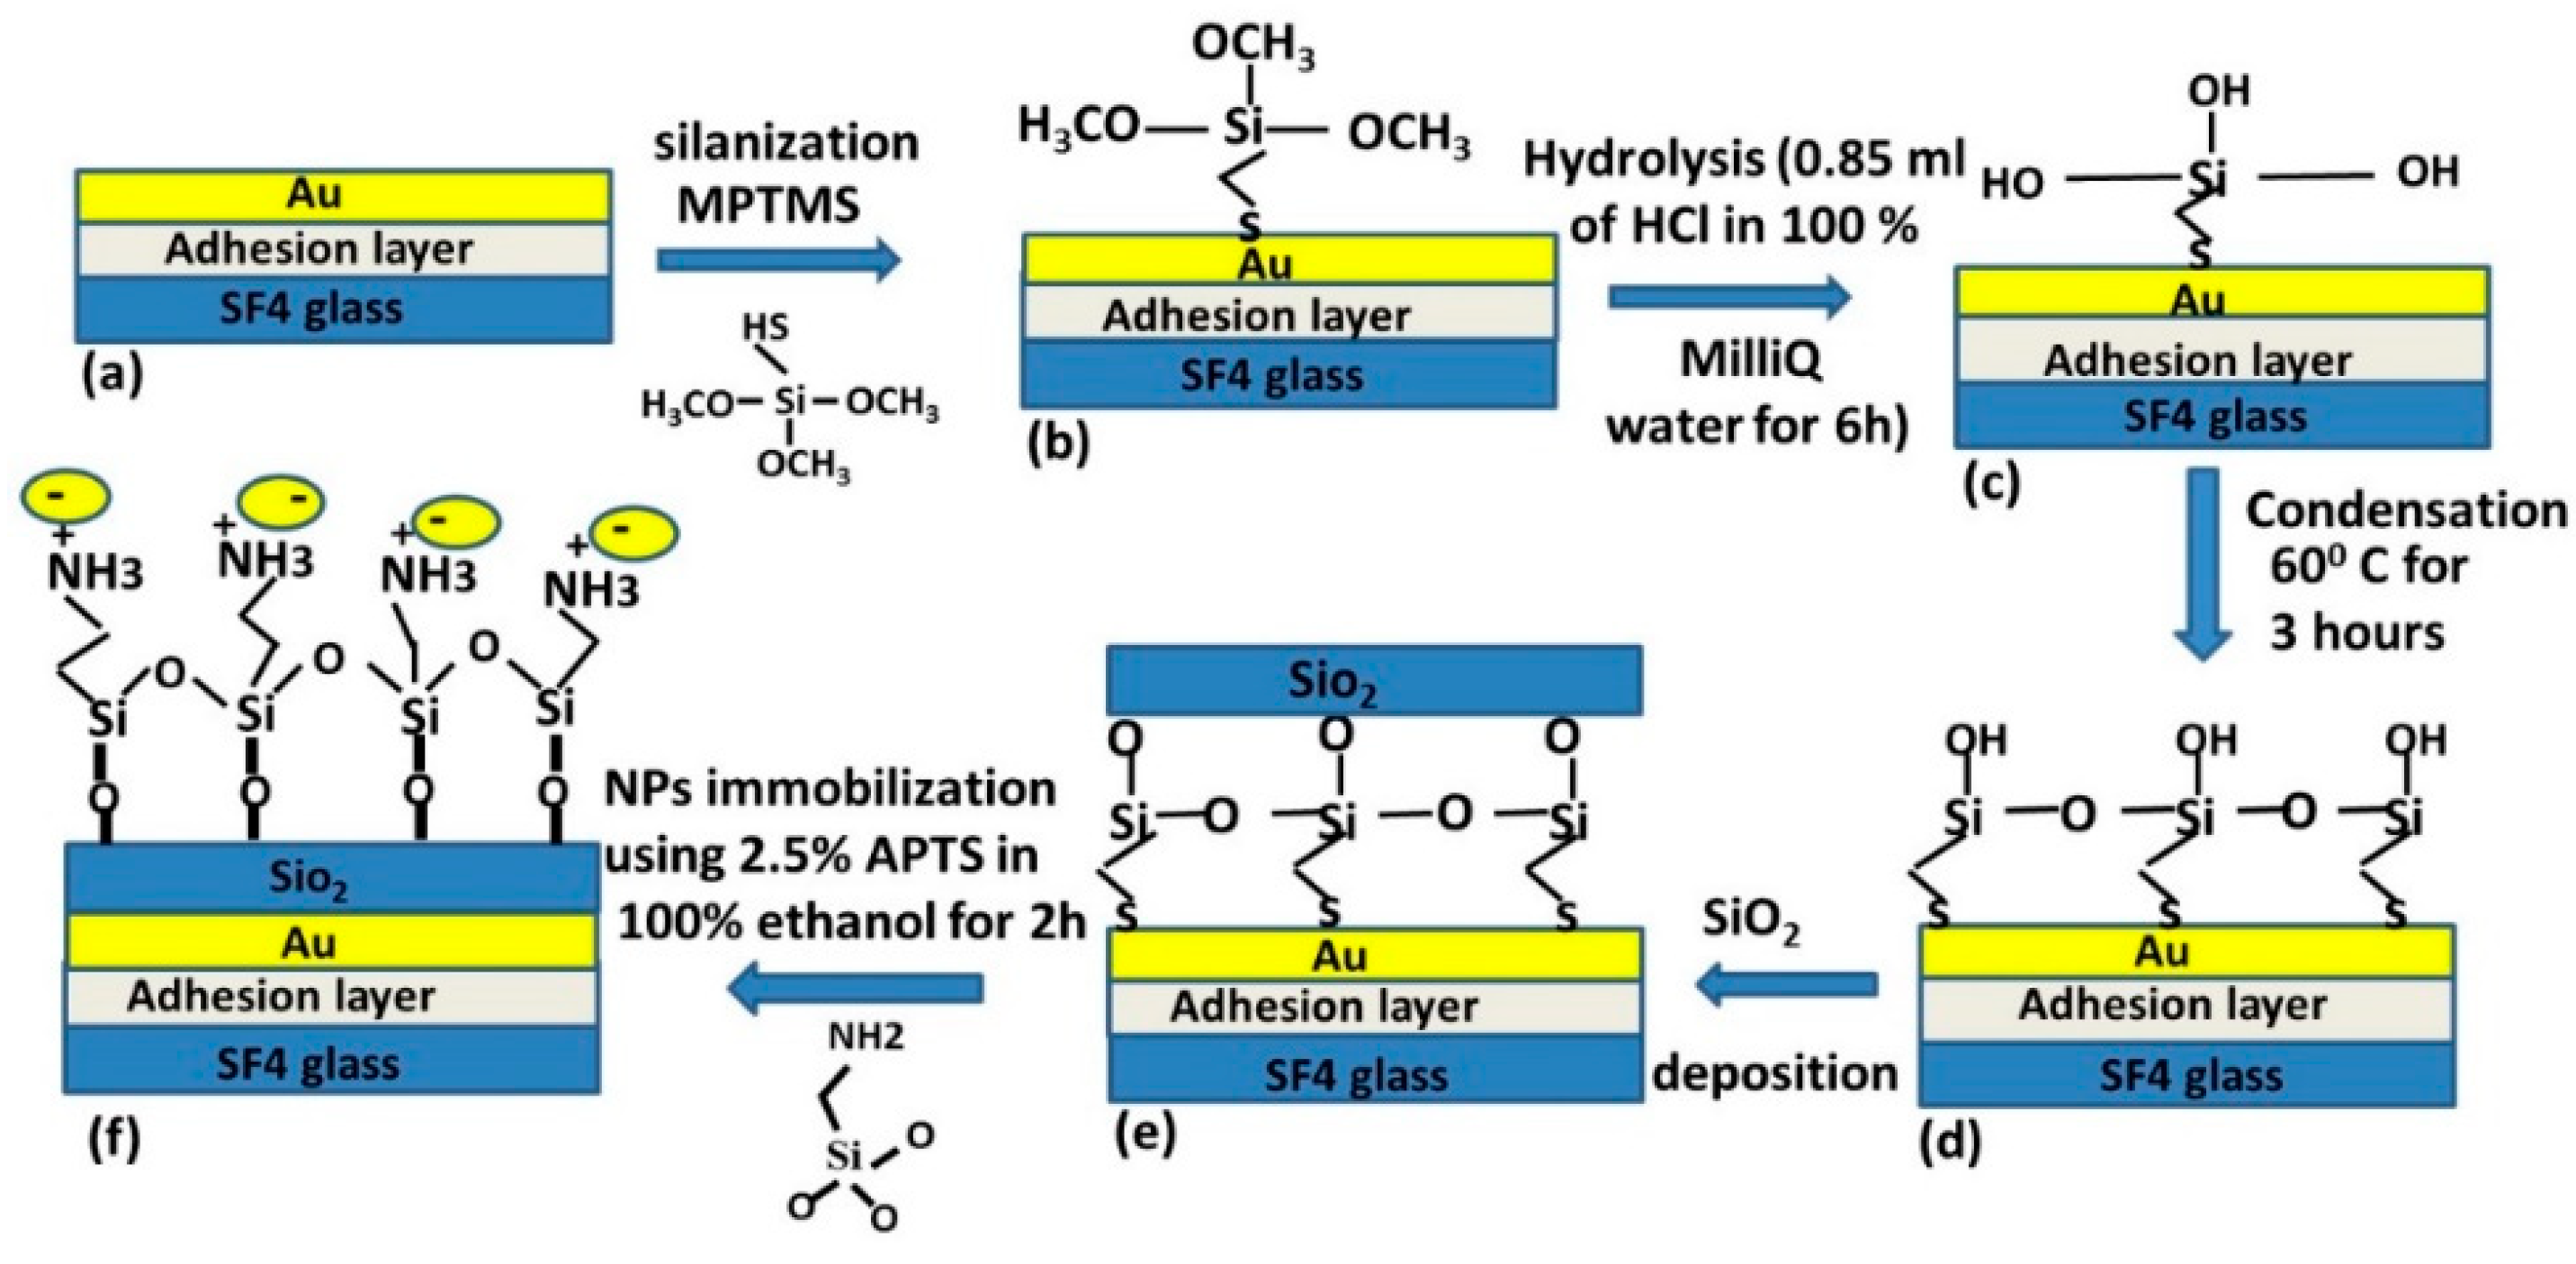
2.1. Fabrication and Working Principle of the Au/SiO2 Sensing Platforms

The experimental set-up in the classical Kreschtmann configuration with angular modulation [2,22] and the Au/SiO2 sensing platforms fabricated in the present research, are represented in Figure 1a,b, respectively. In Figure 1a, a collimated laser source at the wavelength of 783 nm (model LM-783-PLR-75-1, 75 mW, Ondax Inc., Monrovia, CA, USA) impinges on the sensing platform after passing by a linear polarizer (P) and a λ/4 wave-plate (WP), used to select TM or TE polarization. The reflectivity of the SPR platform is measured in function of the angle of incidence θ (Figure 1b), using a controlled rotary base of Sigma-Koki with an angular resolution of 0.0025°. The reflectivity spectra are eventually sent to a data acquisition system connected to a personal computer (Figure 1a). When θ is greater than the attenuated total reflection angle (ATR) the SPP wave, here identified as TM0 mode, can be excited in TM polarization [23,24], and if the thickness of the SiO2 spacing layer is large enough, multiple resonances can be excited, both in TM and TE polarization [8,25].
An SF4 prism and a refractive index matching oil (n = 1.75, Cargille Laboratories, Cedar Grove, NJ, USA) was used for the optical coupling of the DLWGs, constituted by a thin film of gold of the thickness of about 49 nm and a 670 nm thick SiO2 film.
The Au and SiO2 thin films were deposited by an electron beam assisted vacuum deposition system (Leybold, Univex 450, Colonia, Germany) at a pressure of about 3 × 10⁻⁶ Torr and with a rate of 3 Å/s. Prior to the deposition of SiO2, the gold-coated substrates were functionalized with 0.5% volume (3-mercaptopropyl) trimethoxysilane (MPTS) solution in ethanol (30 mL ethanol with 150 μL MPTMS) for 90 min at room temperature [22]. To carry out the hydrolysis process, the silanized gold film was immersed in a 0.1 M HCl water solution (0.85 mL of HCl in 100 mL of MilliQ water) for 6 h in room temperature. Finally, a condensation reaction is carried out at 60 °C for 3 h in oven. For the sensing of the AuNPs, the SiO2 layer was further functionalized by immersing the substrates in 3-aminopropyl trimethoxysilane (APTS)/ethanol solution for 2 h, followed by rinsing with ethanol and gentle drying with nitrogen [7].
Citrate stabilized AuNPs were synthesized using the procedure reported in [26]. A continuous flux pump (FutureChemistry, Nijmegen, The Netherlands), not shown in Figure 1, was used for sensor rinsing and nanomaterial injection. The composite layer consisting of AuNPs and H2O shown in Figure 1 is formed by fluxing citrate stabilized AuNPs at a rate flow 0.3 mL/min for times ranging from 1 to 5 min, to achieve different Nps surface density over the SiO2 surface. A schematic diagram showing the process of fabrication of the DLWGs, is represented in Figure 2.
In the theoretical calculations and in the interpretation of the experimental data we suppose the colloidal dispersion of AuNPs to be monodispersed, with all the nanoparticles having the same radius a. Moreover, the exact spatial distribution of the 2D array of AuNPs deposited over the SiO2 surface does not influence the optical response of the device. It depends only on the average surface density σ of the metal nanoparticles, validating the approximation of equispaced nanoparticles as shown in Figure 1a.
When APTS molecules bind with AuNPs, the excitation condition of the wave modes in the sensor structure is altered with a final shift of the angle of resonance Δθ [2]. The latter is used as the sensor output information and can be used to measure static parameters of the AuNPs thin film such as the electrical effective permittivity when the surface density is known experimentally [14,22]. Vice versa, the correct theoretical modeling of the dielectric constant of the AuNPs, allows the optical experimental measurement of the surface density of immobilized metal nanoparticles and, in this way, the calculus of the mass surface coverage of the target molecules along experiments in PA-SPR spectroscopy.

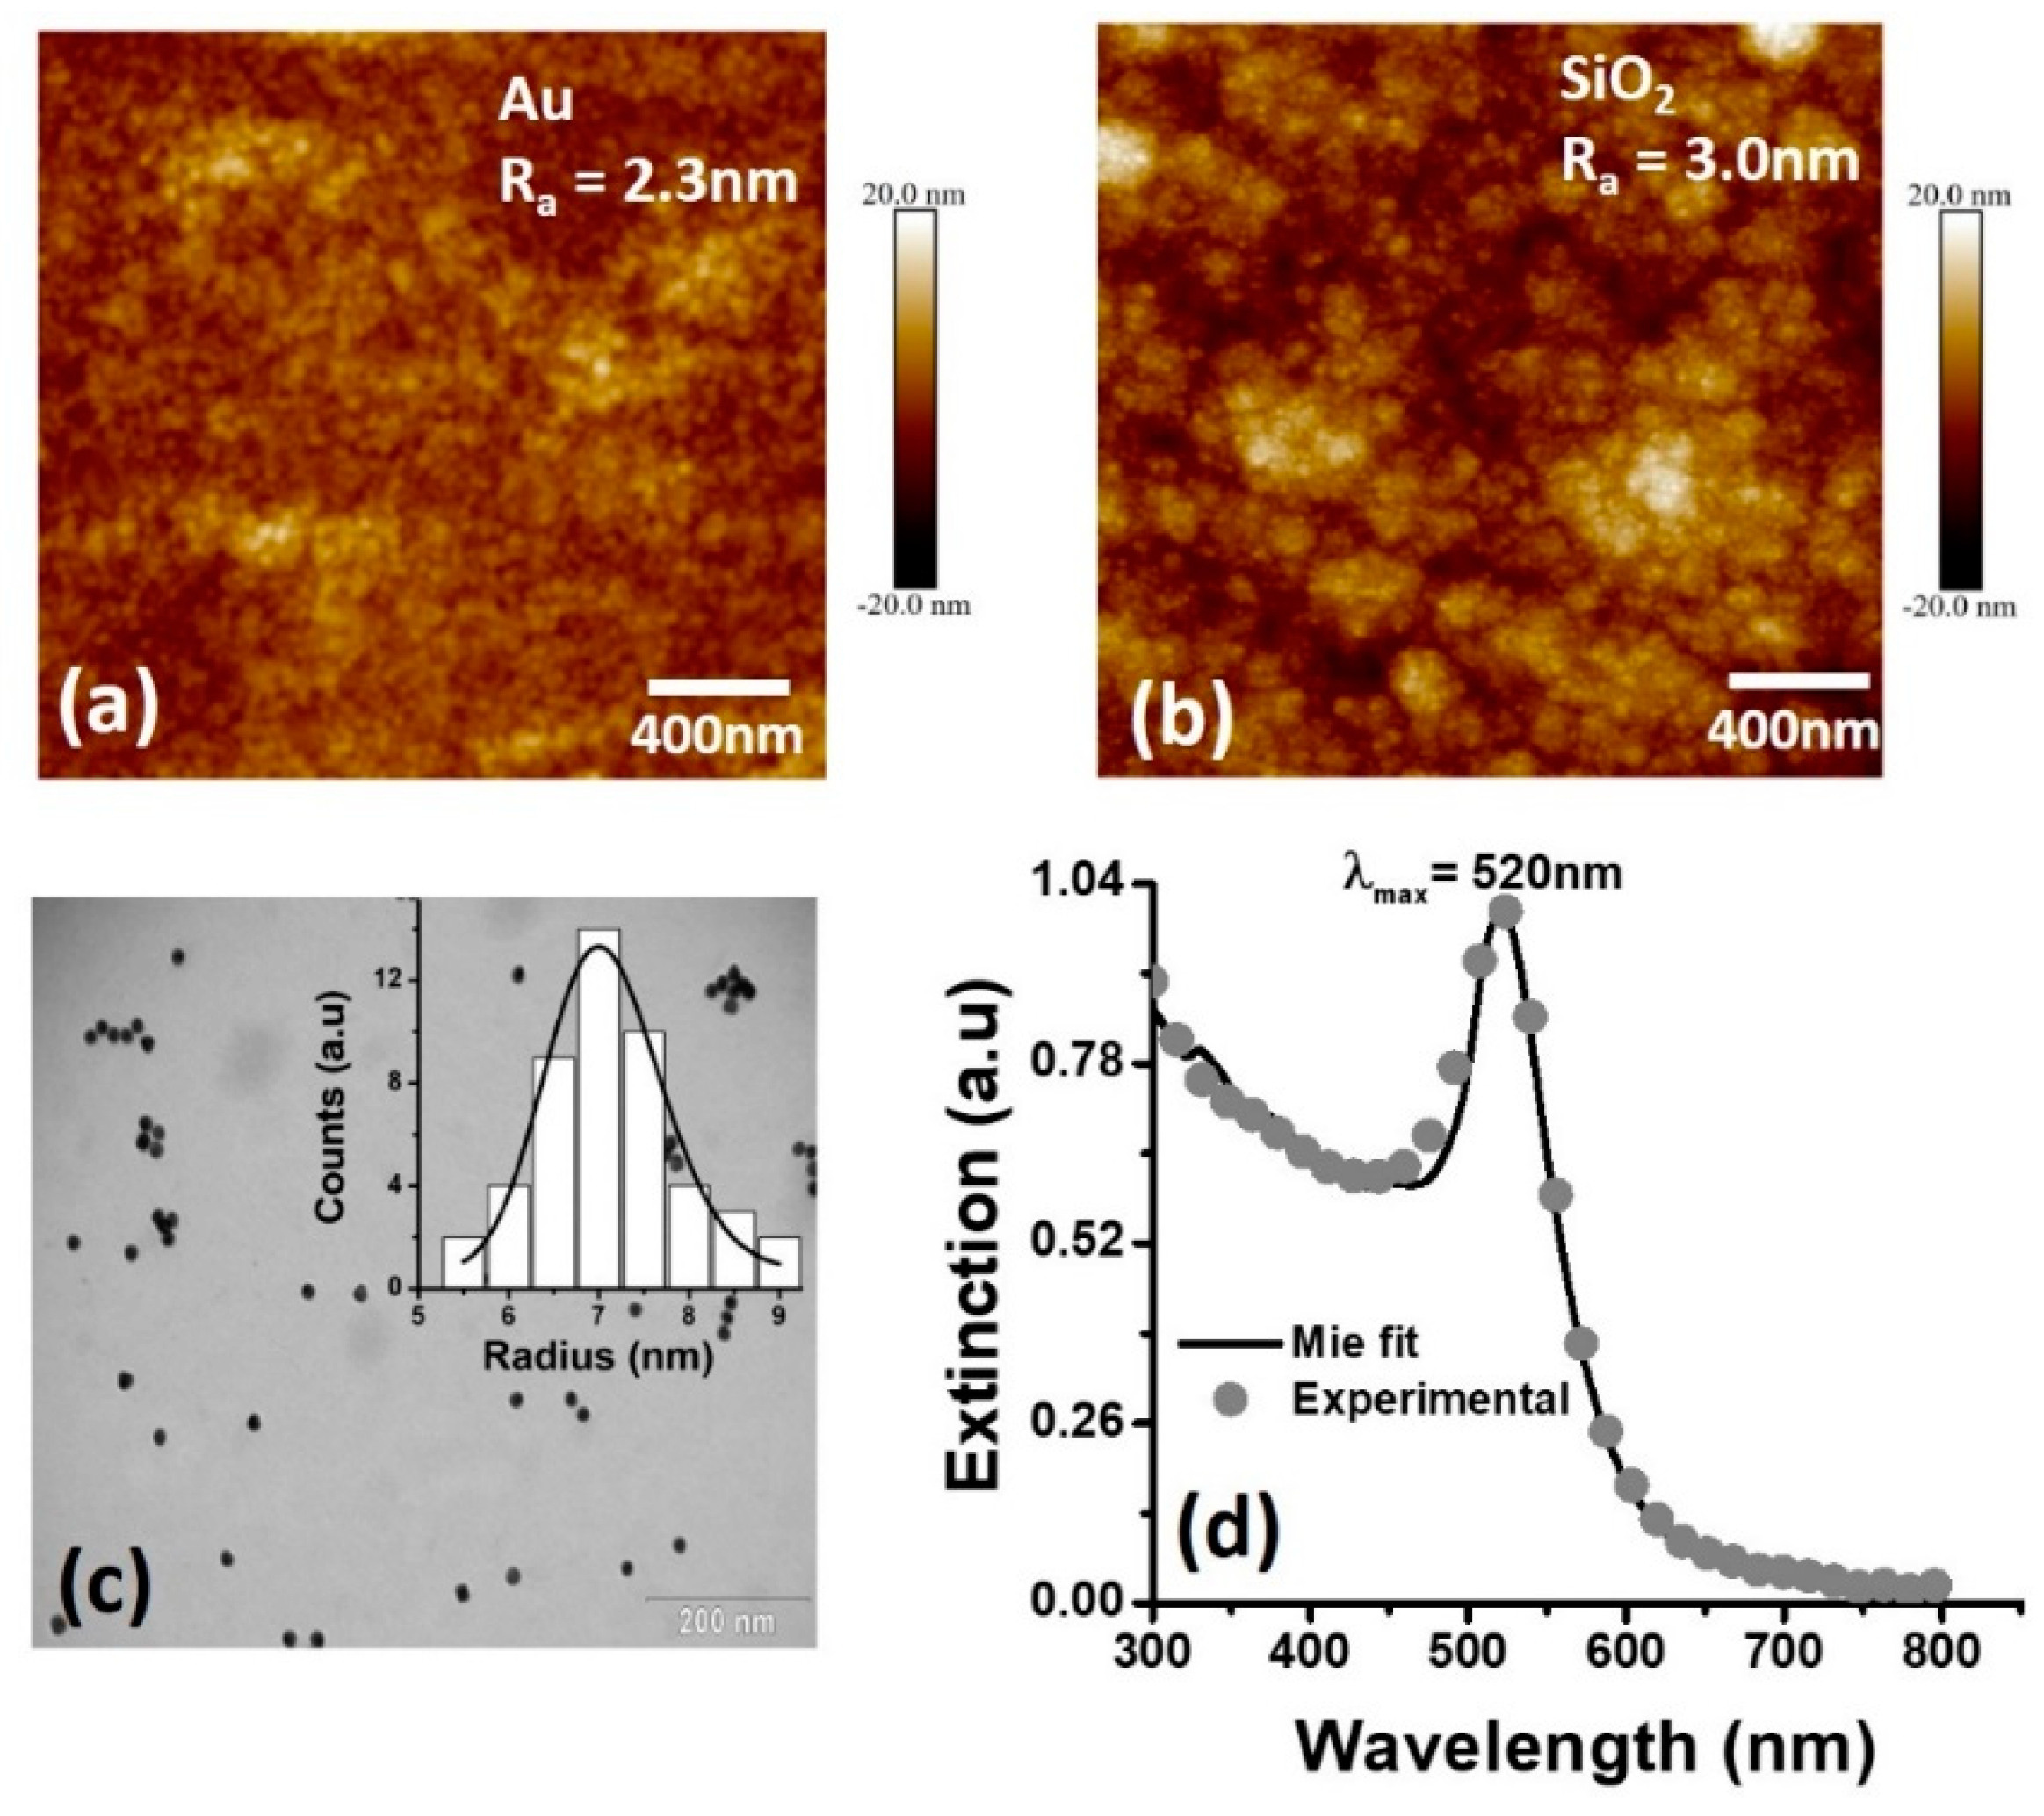
2.2. Morphological Characterization of the DLWGs and AuNPs Citrate Colloidal Solution

The surface of both the Au and SiO2 thin films constituting the DLWGs were analyzed by an AFM (model Multimode 8, Bruker, Santa Barbara, CA, USA), operated in Peak Force TappingTM with scanAssist Air tips (spring constant ≈ 0.4 N/m). Data analysis was carried out with Nanoscope Analysis software, version 1.4, by Bruker. The results are shown in Figure 3a,b. The route mean square (RMS) roughness of the surface increase from 2.3 nm in the case of bare gold to 3.0 nm after the deposition of the SiO2 thin film. These values are coherent with the typical values reported in literature for metallic thin films [27,28,29], and do not produce a significant damping of the SPPs propagating along the metal-dielectric interface [30].
The statistical size distribution of the colloidal solution of AuNPs was determined using a Tecnai Spirit Transmission Electron Microscope (FEI Company, model Tecnai Spirit G2, Hillsboro, OR, USA) operating at 30 kV with bright-field detector. The corresponding TEM image is shown in Figure 3c. In the inset, represented as a continuous line, the best fit on the experimental statistical distribution is shown. It was obtained by using a log-normal function [31].
From the fit on the experimental size distribution we obtained a mean radius value <a> = 7.3 nm, and a standard deviation δα = 1.5 nm, representative of colloidal solutions with low polidispersitivity [32]. The size statistical distribution of Figure 3c is further used to perform the theoretical fit of Mie with quadrupole orders [31] on the experimental extinction spectra of the colloidal dispersion of AuNPs, as shown in Figure 3d. The matching between the experimental and the theoretical extinction spectra is excellent, thus supporting the reliability of the value of <a> obtained by TEM, which will be further considered as reference value.

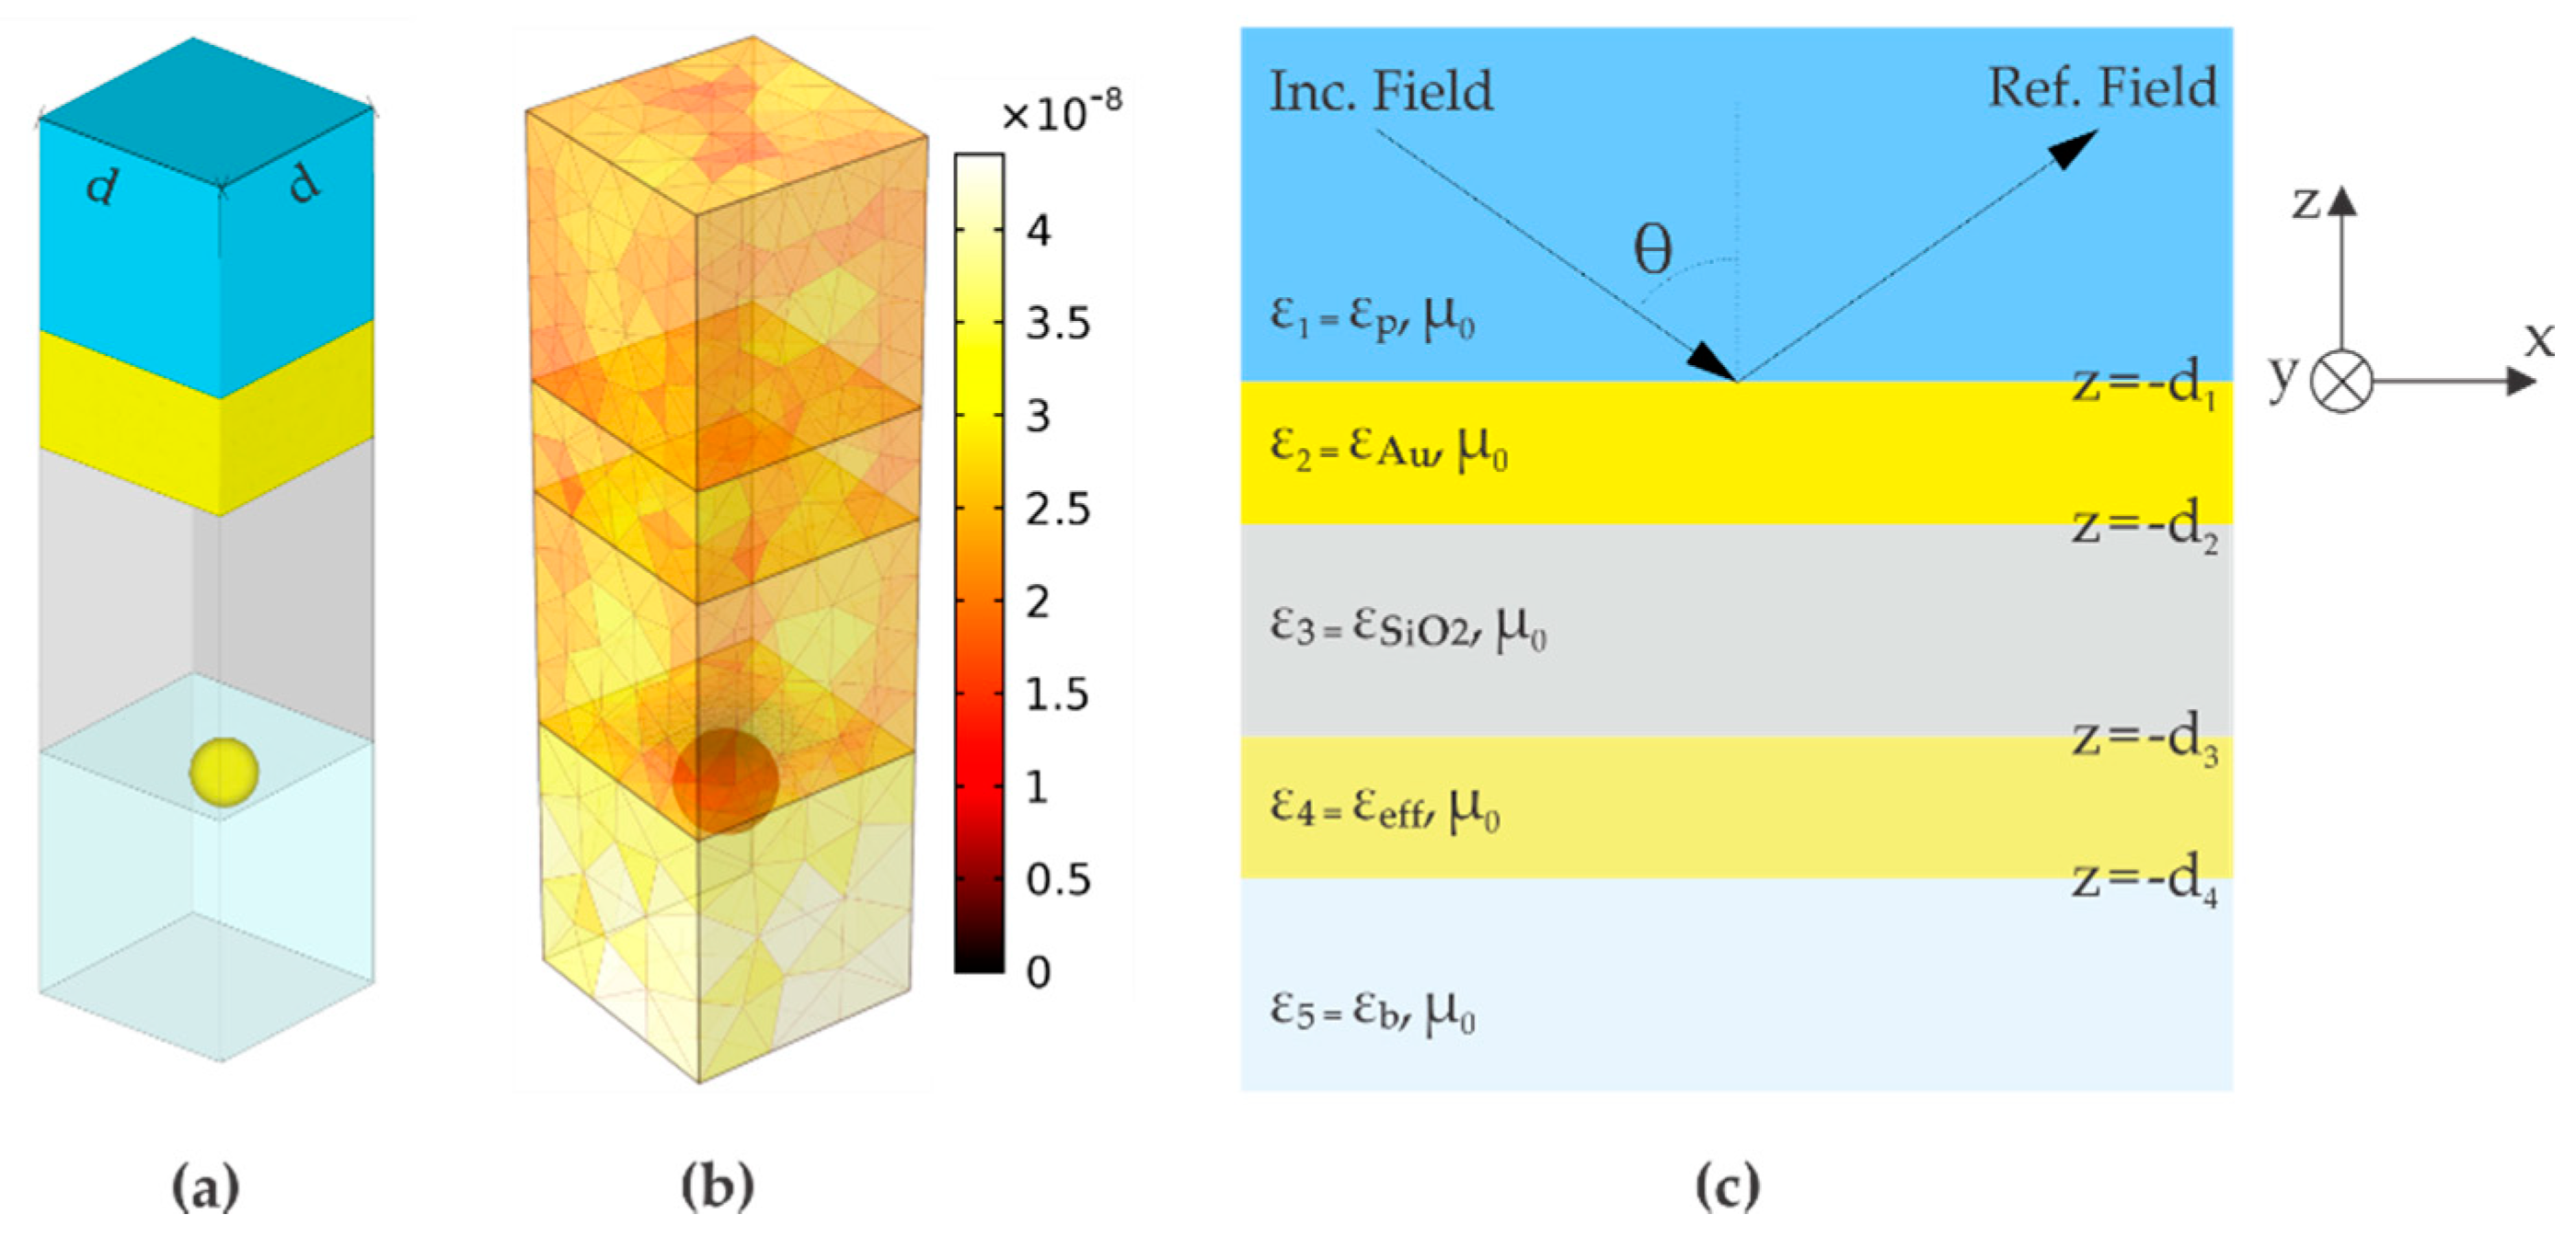
2.3. Theoretical Model

The numerical model in FEM of the SPR sensor (Figure 1) is based in a unit periodic cell of width d, containing one AuNP (Figure 4a). The mesh (Figure 4b) represents the division of the space in elements small enough to study correctly the propagation of the electromagnetic wave using the Radio Frequency (RF) module of COMSOL Multiphysics® software [18]. In our calculations each material is characterized by its electrical permittivity. For the gold thin film, the dielectric constant is calculated using the Drude-Lorentz model with electron damping and one term of interband transitions [22,25].
The semi-analytical approach is based on the approximation of the composite thin film constituted by the external medium and the periodic array of AuNPs (Figure 1b) as an effective homogeneous layer with thickness hNp = 2a and effective permittivity εeff (Figure 4c), given by the following Maxwell-Garnett (MG) mixing formula:
ε e f f = ε b [ 1 + 2 f s ( ε A u ε b ) / ( ε A u + 2 ε b ) 1 f s ( ε A u ε b ) / ( ε A u + 2 ε b ) ]
In the latter, fs = 2π/3(a/d)2 is the AuNPs volume fraction in the heterogeneous layer and εb is the permittivity of the external medium. The surface density σ = 1/(d[µm])2 is measured in nanoparticles per µm2 (Np/µm2) [7,12,13,17]. The validity of equation (1) is limited by the onset of non-negligible scattering cross-section of the AuNPs, dipole-dipole interactions between adjacent nanoparticles and dipolar interaction between the nanoparticles and the metal thin film supporting the plasma wave [16,17,33].
The aim of the effective medium theory is to find the effective dielectric constant (1) of a composite layer constituted by nanosized inclusions contained in a non-absorbing dielectric matrix with the real dielectric constant εb. In the present work, we need to model the composite AuNPs/water film as a continuous film, since the propagation of the incident plane wave in the resultant planar structure of the SPR sensor (Figure 4c) is analyzed by the generalized reflection coefficient r ˜ for the planar multilayer structure [34]. Equation (2), representing the generalized reflection coefficient, is defined in frequency domain with the time dependence exp(–iωt), and r and t are the Fresnel’s reflection and transmission coefficients for TM or TE polarization in accordance with the excitation source:
r ˜ n , n + 1 = r n , n + 1 + r ˜ n + 1 , n + 2 exp [ i 2 k n + 1 , z ( d n + 1 d n ) ] 1 + r n , n + 1 r ˜ n + 1 , n + 2 exp [ i 2 k n + 1 , z ( d n + 1 d n ) ]
For TM polarization, the transverse magnetic field Hn,y in the n-th layer of the sensor structure (Figure 4b) is given by equation (3), where An is the amplitude of the field component given by equation (4). For TE polarization, equation (3) corresponds to the transverse electric field En,y [34]. Equations (3) and (4) have the following form:
H n , y = A n [ exp ( i k n , z z ) + r ˜ n , n + 1 exp [ i k n , z ( 2 d n + z ) ] ] exp ( i k x x )
A n = t n 1 , n A n 1 exp [ i ( k n 1 , z k n , z ) d n 1 ] 1 r n , n 1 r ˜ n , n + 1 exp [ i 2 k n , z ( d n d n 1 ) ]
In expressions (2)–(4) A1 = 1 is the amplitude of the incident field; k n 2 = ω 2 ε n μ n is the wave propagation constant in the n-th layer, ω = 2πc/λ is the angular frequency, c is the speed of light in free space, and kx = k1 sin(θ) is the x-axis component of the wave vector. The reflectivity curve R is calculated by relation (2) considering the prism-gold interface, so that R = | r ˜ 12 | 2 [34]. Throughout the text, the bulk sensitivity S of the SPR sensing platform is defined as the ratio of the change in Δθ to the change in the refractive index of the external medium nb [1,2,6,35,36,37].

3. Results and Discussion
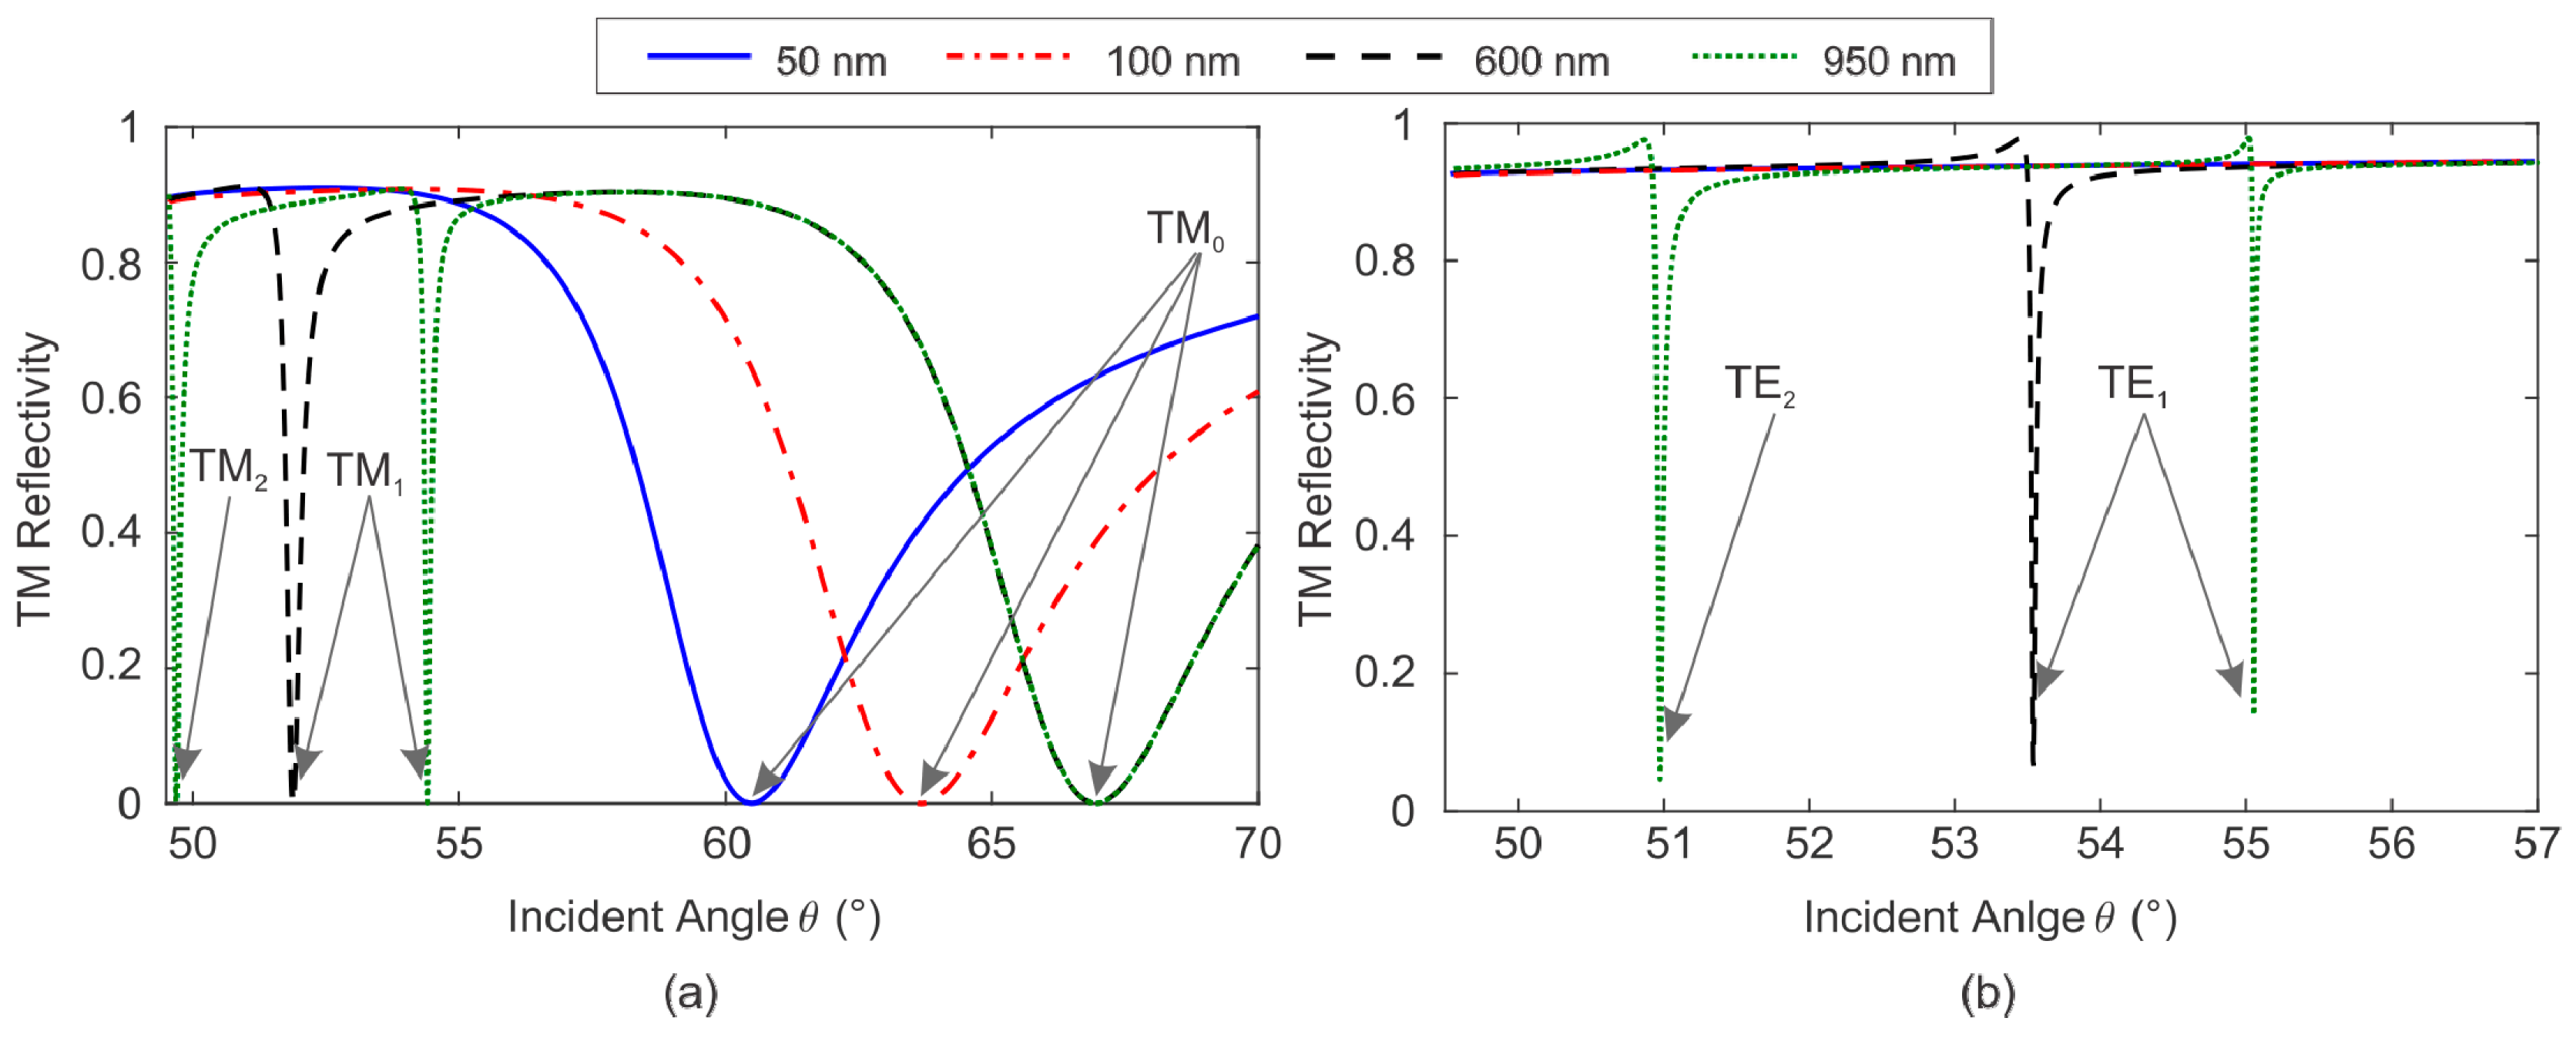
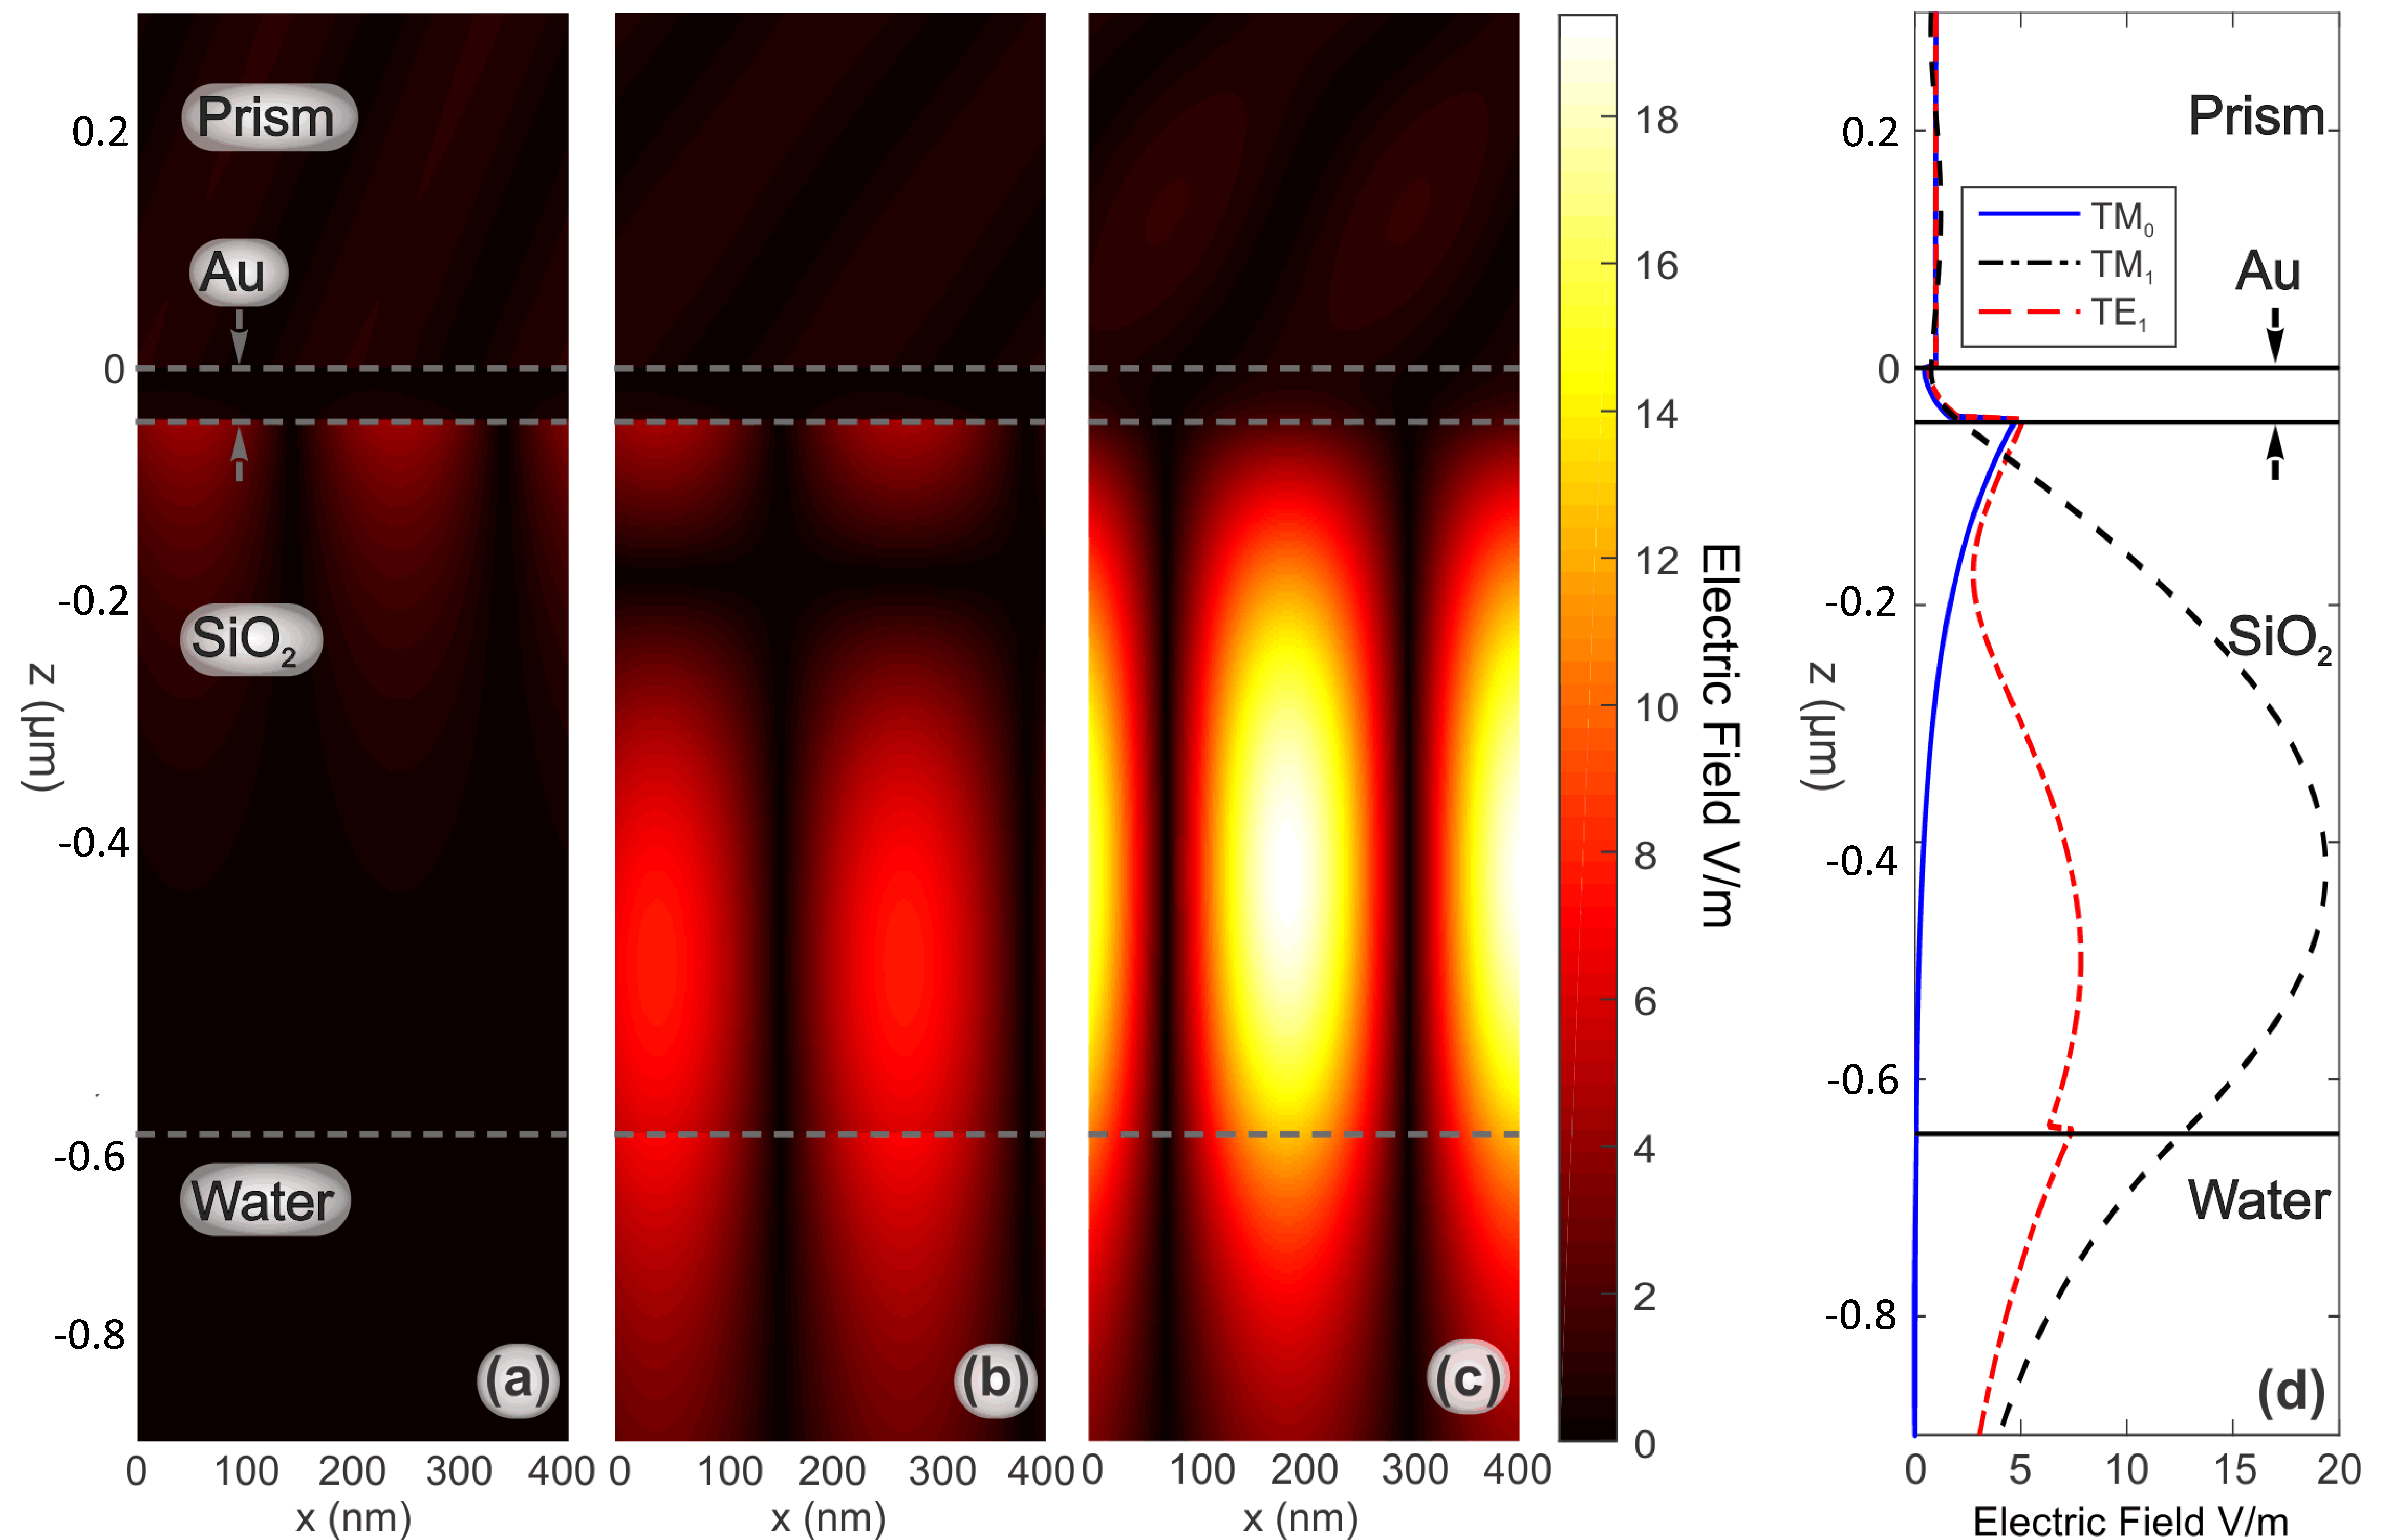
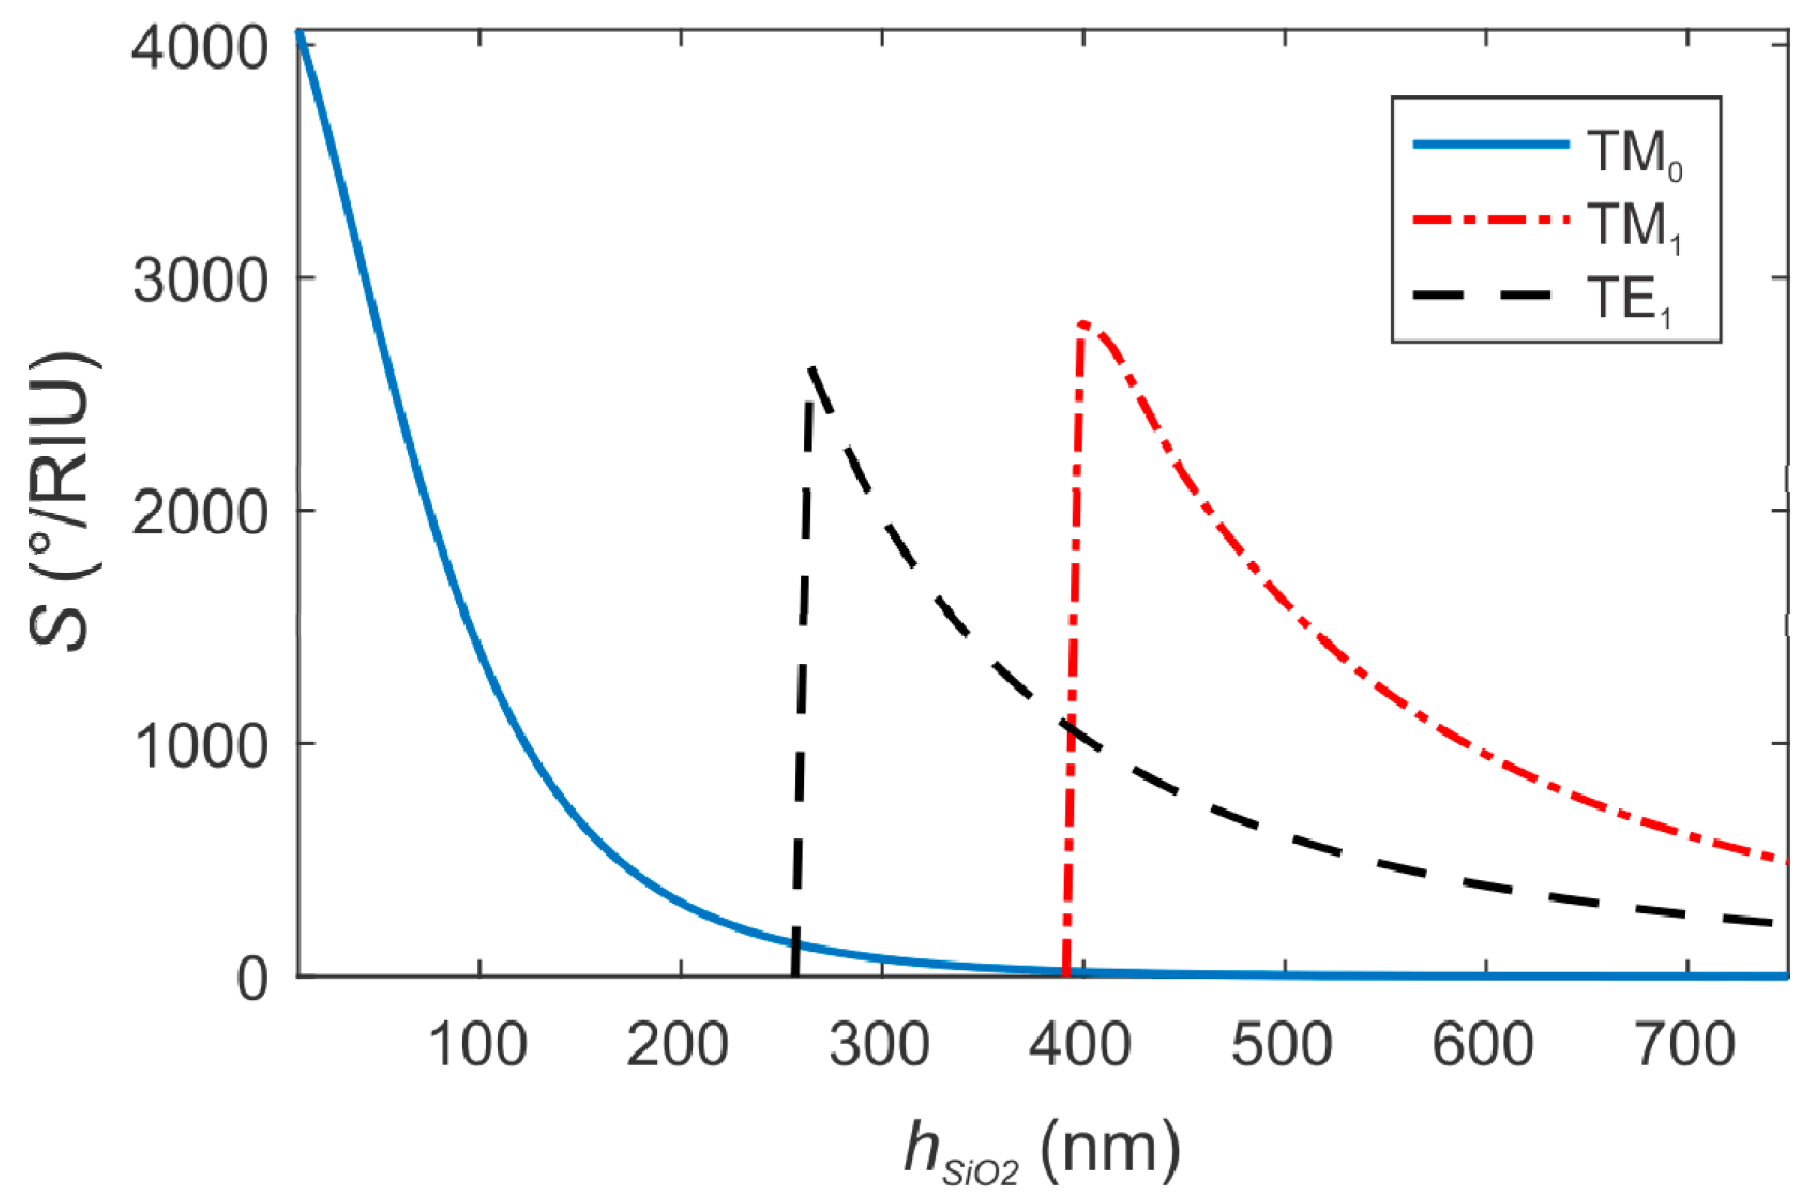
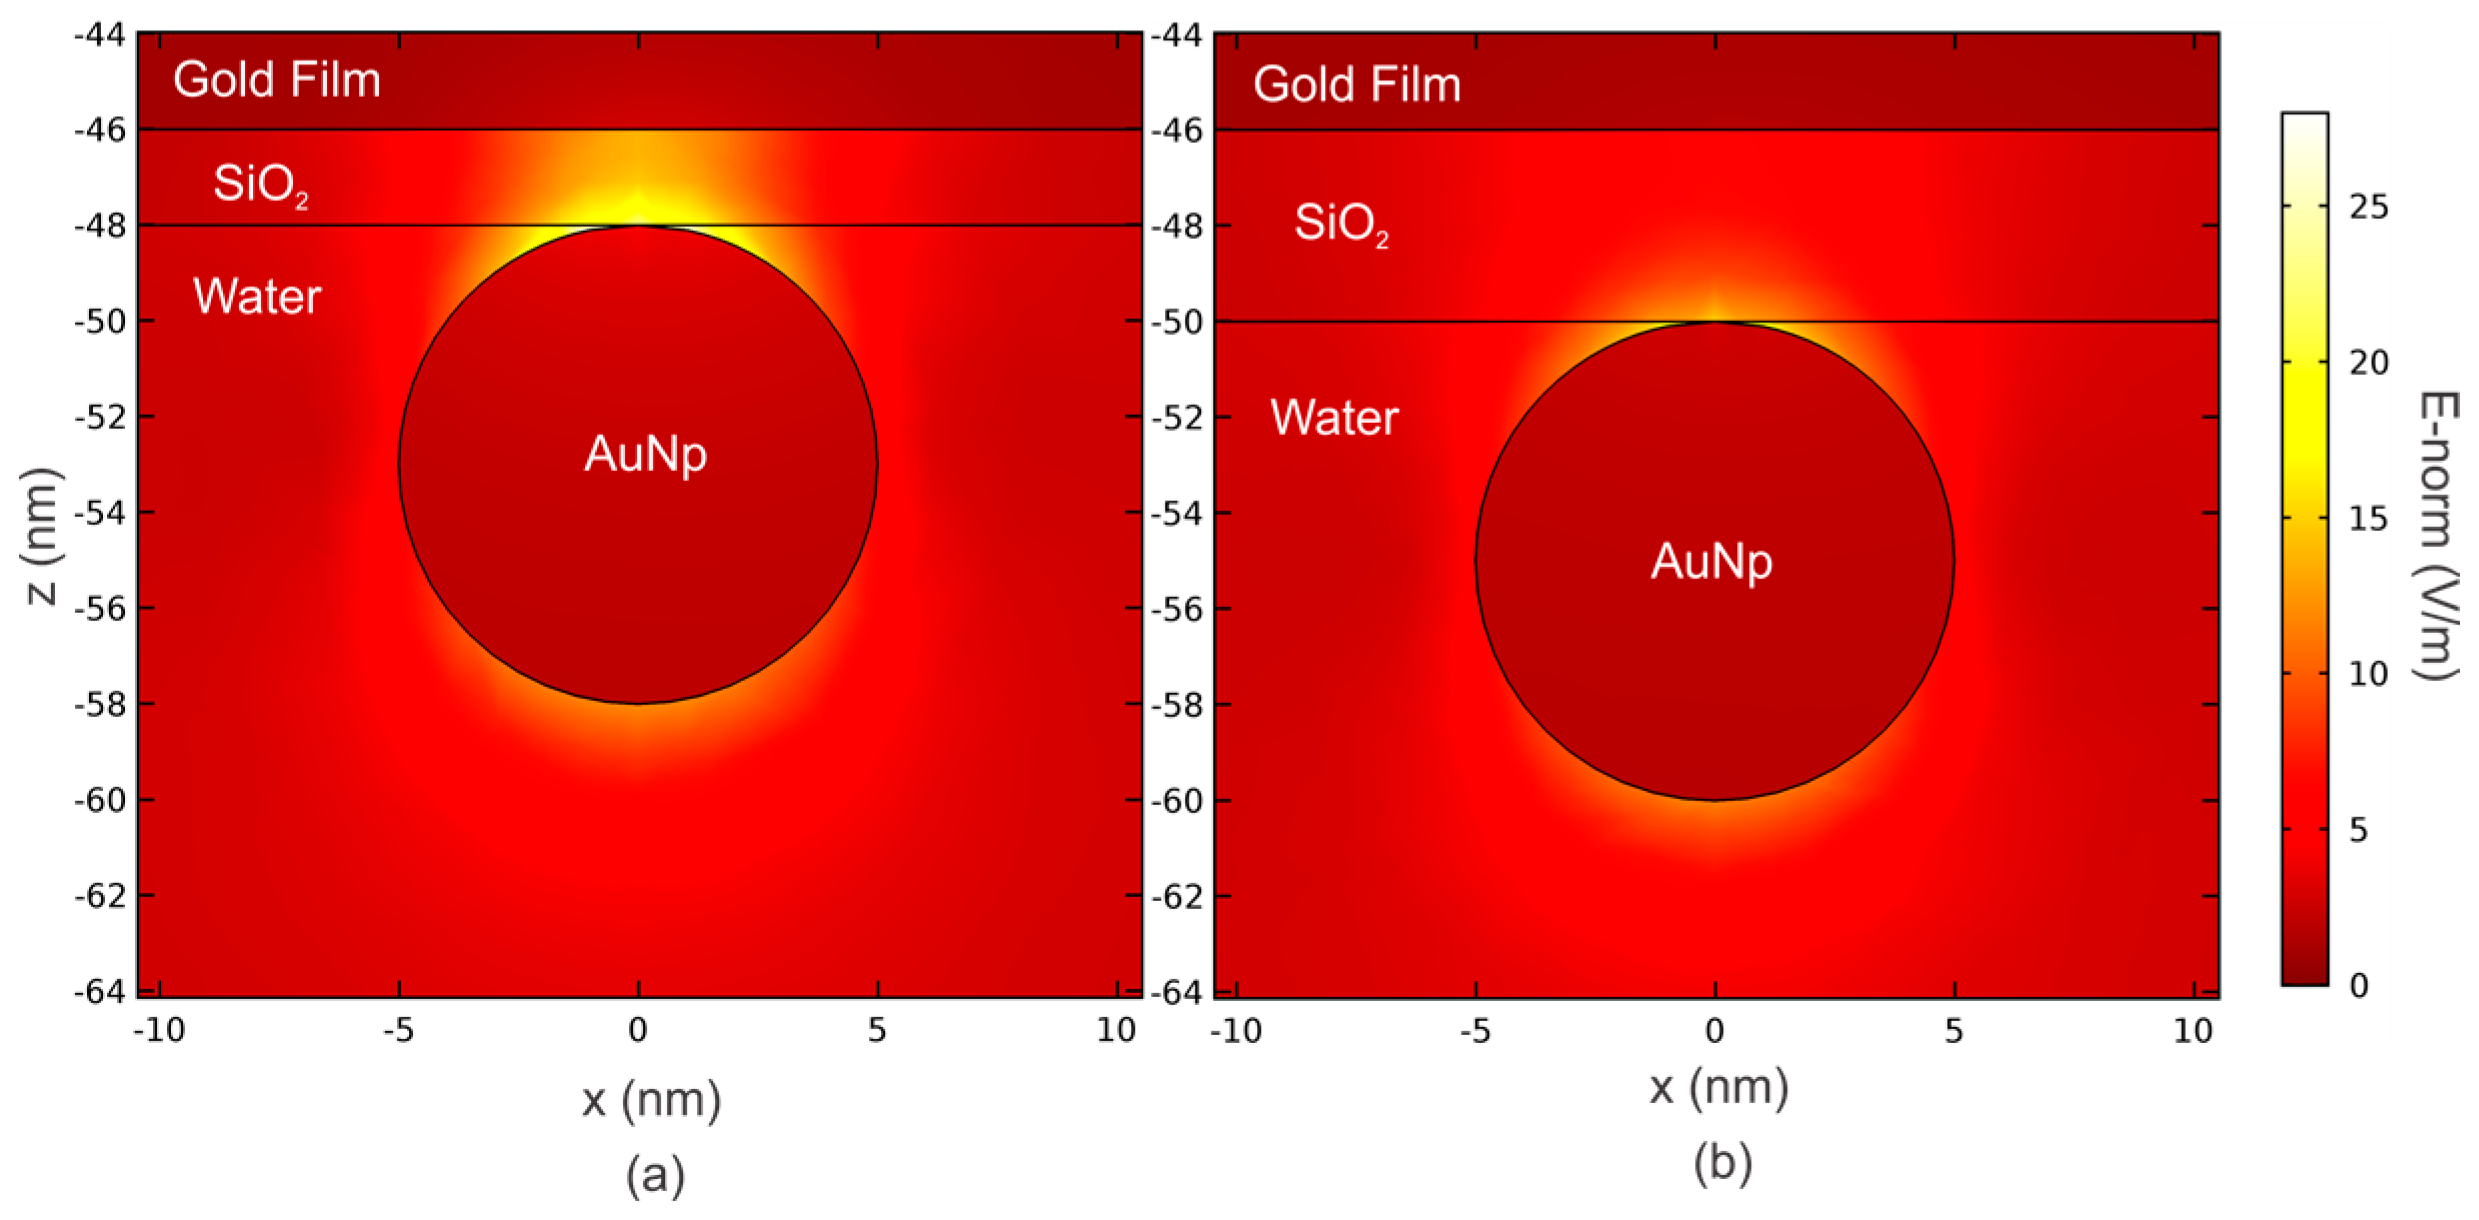
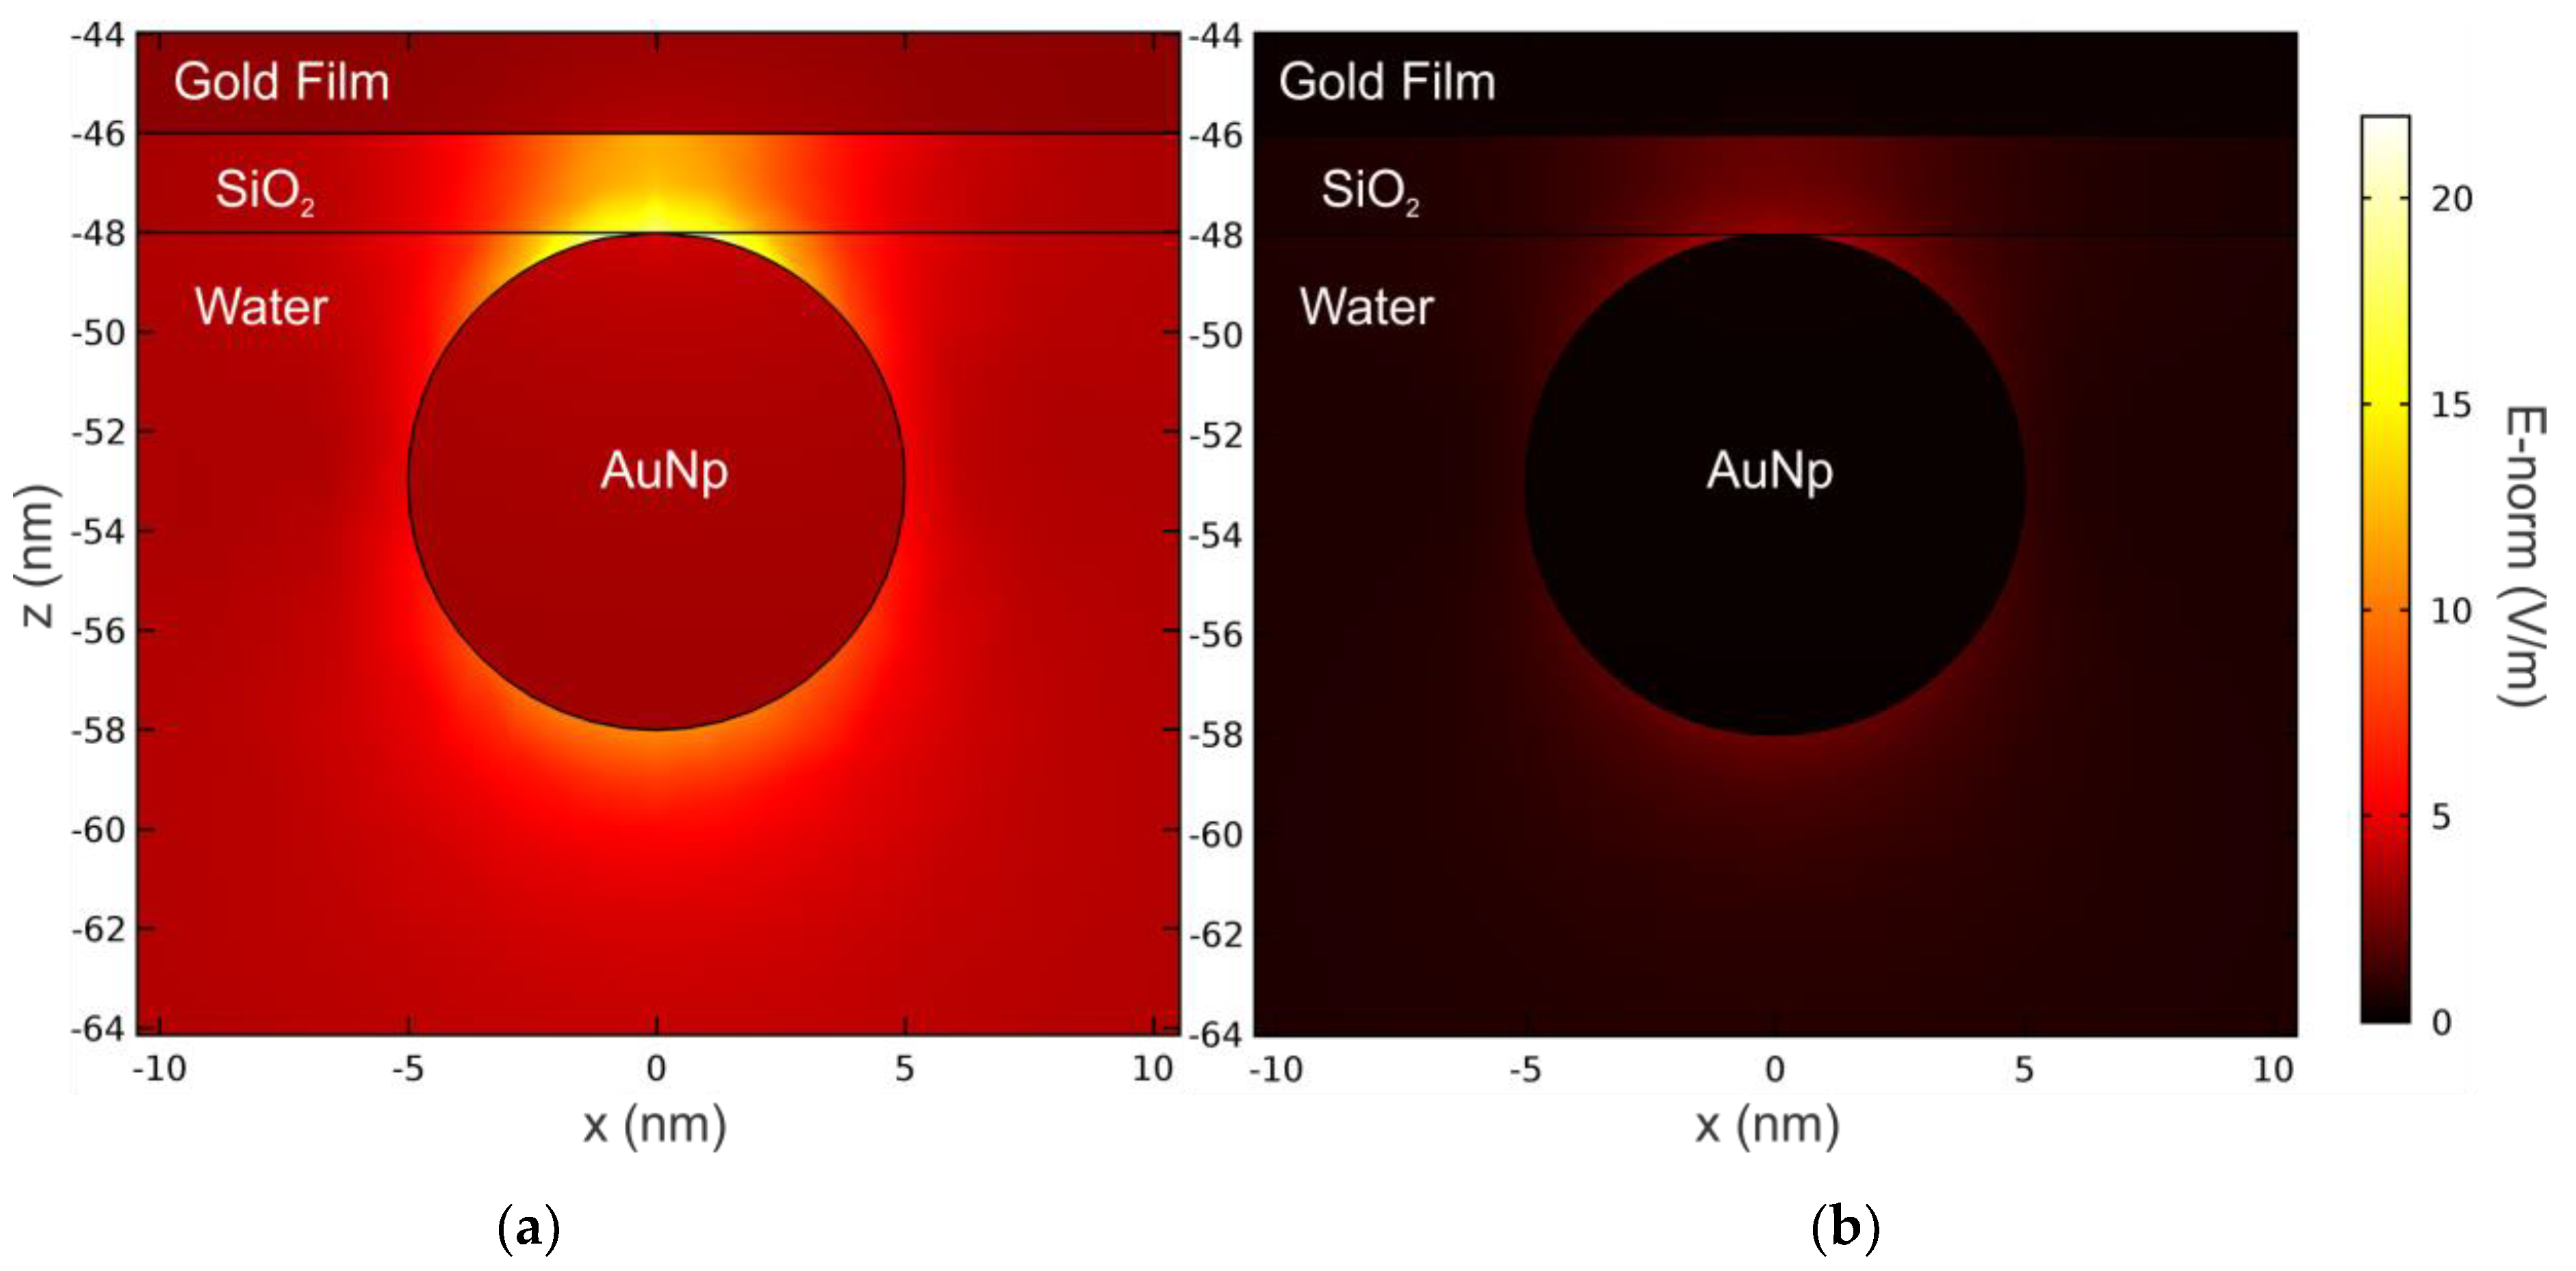
3.1. Modal Analysis

The parameter hSiO2 is crucial to study both modal characteristics and bulk sensitivity of the SPR platform sensing [7,8,9,11,36]. To achieve the hSiO2 cutoff values defining the transition from pure plasmonic behavior to waveguide resonator, we show in Figure 5 the reflectivity curves R(θ) for hSiO2 varying from 10 nm to 1000 nm, in both TM and TE polarizations, considering the exciting wavelength of 633 nm and water as the external medium. The resonance angle of the plasmonic mode (TM0) increases continuously with hSiO2 up to saturation value of ~67°, for dielectric layer thicker than 300 nm (Figure 5a). Pockrand et al. first demonstrated this behavior [38]. The coupled waveguide modes TM1, TE1, TE2, and TM2 only raise for hSiO2 thicker than the cutoff values of 240 nm, 400 nm, 770 nm, and 950 nm, respectively [8].
In Figure 6, we present the near electric field E in the resonant condition for the TM0, TM1 and TE1 modes when the dielectric thickness is 600 nm. The TM1 mode provides a better overlap between the E-field profile and the external environment if compared with the plasmonic mode, which leads to a higher sensitivity of the platform [35,36]. The TE1-field does not present an evanescent profile at the gold-dielectric interface as TM modes, but is characterized by a good overlap with the external environment, in agreement with [8].
In Figure 7, we represent the bulk sensitivity S (in °/RIU) of the Au/SiO2 sensing platforms versus hSiO2 in the monomodal and DLWG regimes, for both TM and TE polarizations. For the TM0 mode, the sensitivity decreases to zero when hSiO2 increases, with a maximum value of 4140 °/RIU for hSiO2 = 10 nm. For the other modes of the DLWGs, the sensitivity also decreases with hSiO2, with maximum values of 2670 °/RIU for TM1 and 2560 °/RIU for TE1, occurring for thicknesses close to the corresponding cutoff values.
Although the bulk sensitivity may be slightly different from the sensitivity of the sensor to a spatial confined material such as metal nanoparticles, the results shown in Figure 7 underline that for the multimodal DLWGs, the evanescent field associated to the TM1 mode has to be used as the electromagnetic sensing nanoprobes when the best sensitivity is desired.

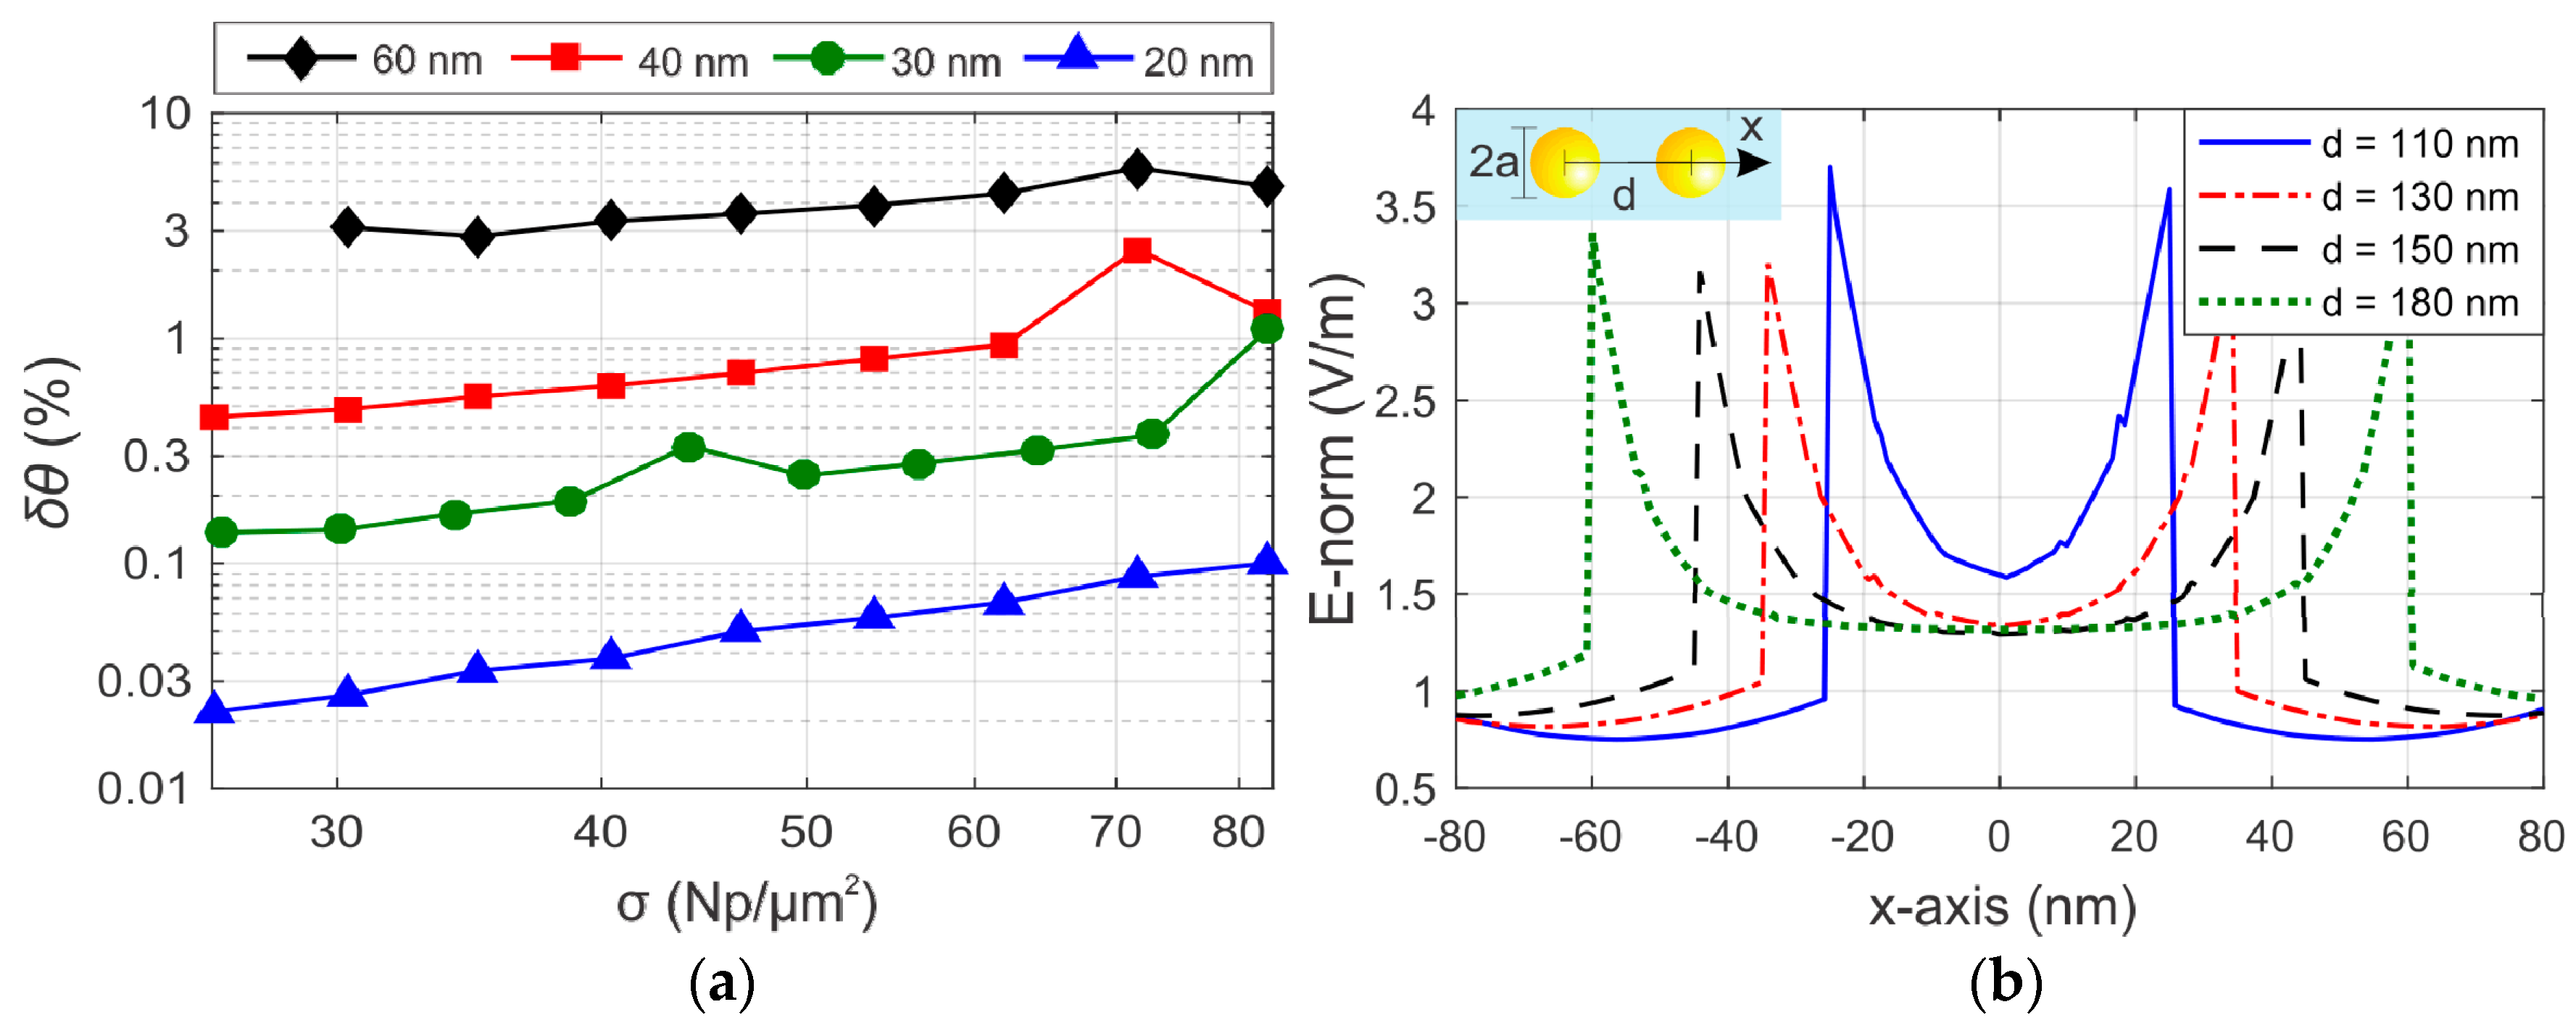
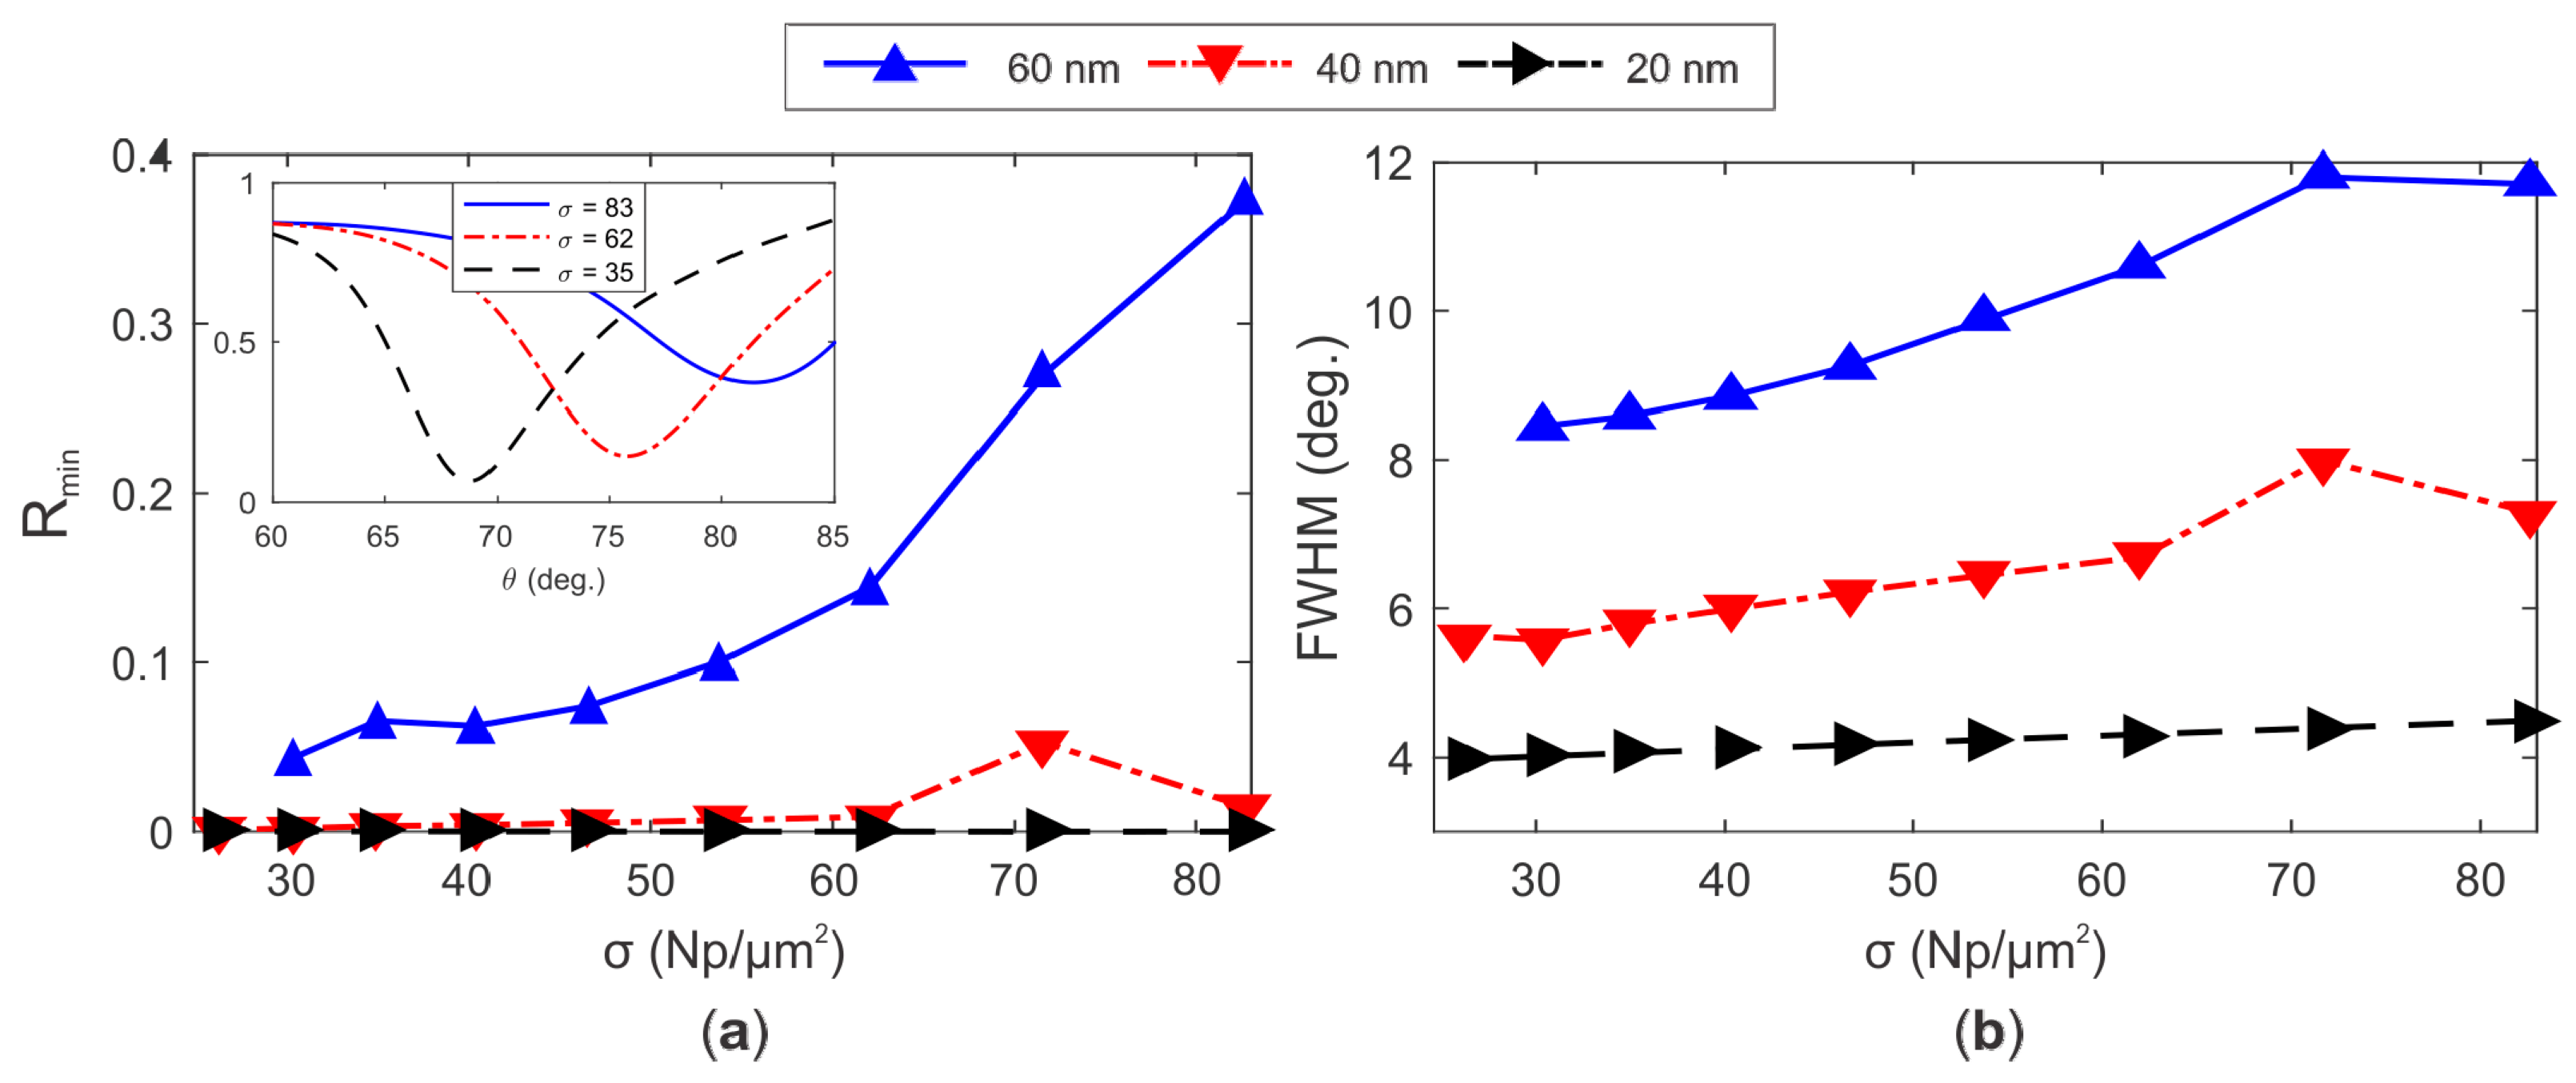
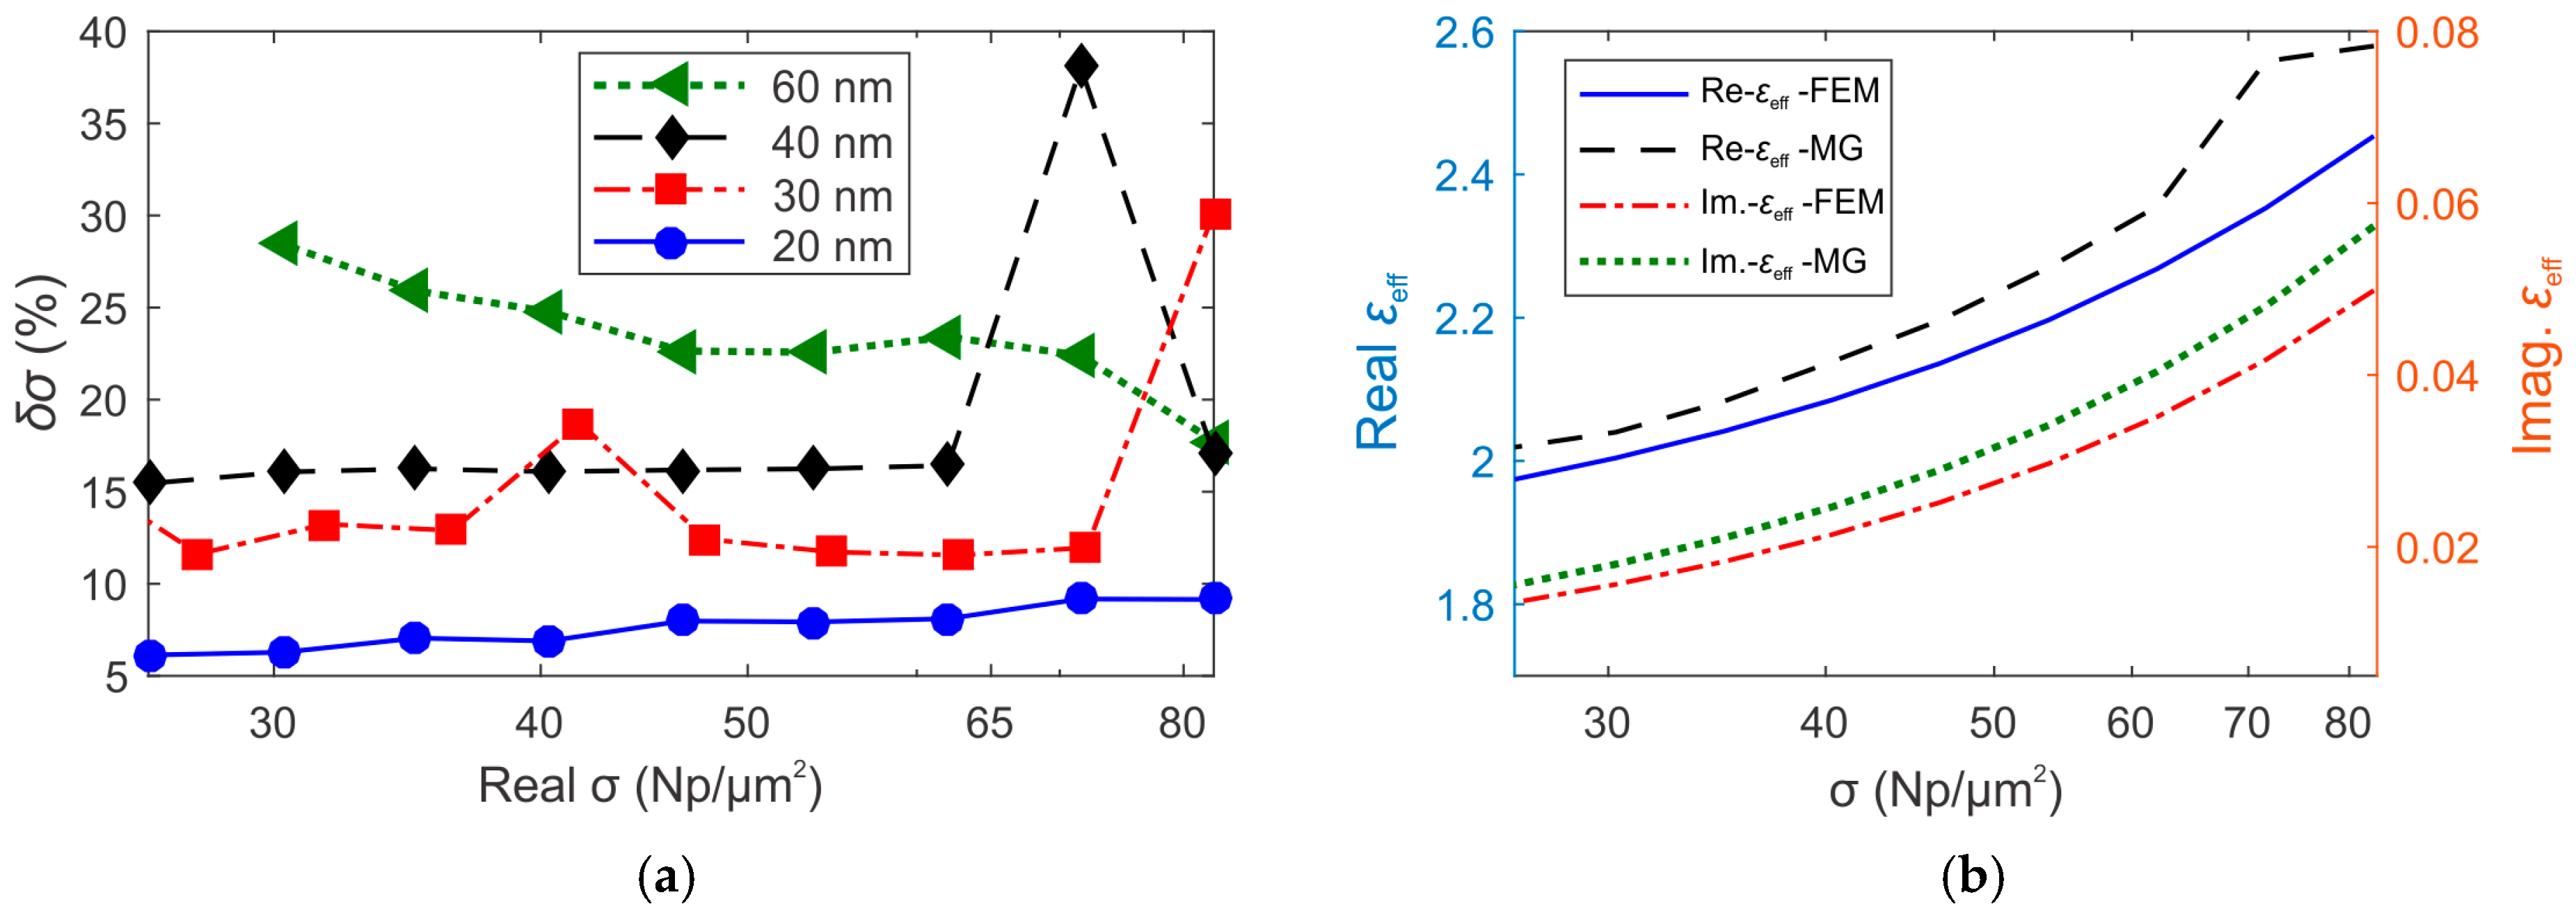
3.2. Parametric Analysis of Models

To investigate the limits of the Maxwell-Garnet theory in the determination of the AuNPs surface density in PA-SPR spectroscopy, we evaluate the relative percentage deviation between the resonance angle of the SPR platforms calculated by the FEM method (θFEM) and the semi-analytical model (θMG). The difference δ θ ( % ) = 100 % | θ F E M θ M G | / θ F E M is calculated by probing the TM0 mode of an Au/SiO2 SPR platform with a dielectric thickness of 50 nm, considering an exciting wavelength of 633 nm and water as an external medium. In Figure 8a we can observe, from a general point of view, the tendency of the discrepancy δθ to get worse as a increases with a fixed value of σ, or when σ increases and the dimension of the AuNPs is fixed.
The tendency can be explained by two factors. The first one is the progressive deficiency of effective medium theories to model of the extinction properties of the single AuNP as the size increases, since the scattering properties are not taken in account in the Maxwell-Garnett theory [16]. The second one is the onset of dipole-dipole interaction between adjacent AuNPs when increasing the surface density σ or the single AuNP radius [16,17,33]. To show the influence of σ on the dipole-dipole interparticle interaction, we present in Figure 8b the near Ez field in the center between two adjacent AuNPs with a diameter of 60 nm, separated by the distance d, at the wavelength of 633 nm. As a general trend, we observe an enhancement of the E-field between adjacent AuNPs as d decreases. Interestingly, for distances smaller than 130 nm (equivalent to σ ≈ 44 Np/µm2), it is observed a sudden increase in the field intensity in the middle of the AuNPs (point x = 0 nm in Figure 8b), due to onset of the dipole-dipole interparticle interaction regime [16].
The dipole-dipole interparticle interactions are also correlated with the increase of the minimum of reflectivity Rmin and the full width at half maximum (FWHM) of the SPR spectra. This is evident in the reflectivity curves of Figure 9, represented for AuNPs with a diameter of 60 nm, 40 nm and 20 nm. Particularly interesting, is the rapid increase of Rmin up to 0.38 for σ > 83 Np/µm2, which results from field overlap and dipolar interparticle interactions for the biggest nanoparticles [7,14,35].
In order to make quantitative and rapid measurements in PA-SPR spectroscopy, three conditions are highly desired: (i) the possibility to extend the surface density of the AuNPs array from low to high values (low d) in order to extend the maximum range of the sensor; (ii) the use of AuNPs with higher surface (big radius), in order to have the better results in the enhancement of the sensitivity compared to classical SPR spectroscopy in Kreschtmann configuration; and (iii) a fast calculus method based on the Maxwell-Garnet approximation.
On the basis of these conditions, the results of Figure 8 and Figure 9 suggest the use of an exciting radiation at higher wavelengths than 633 nm (near IR, i.e., 783 nm), since interparticle interactions are expected to rise at higher values of surface density in this case. A trade-off should be considered in the choice of both AuNP dimensions and maximum surface density of the array, depending on the error that can be tolerated in the evaluation of the surface density and, in ultimate analysis, in the calibration of the PA-SPR sensor. To define the error of the surface density δσ, we calculate the relative deviation between the real surface density σFEM used in FEM simulations, and the density calculated using MG formula (σMG) to fit the TM0 resonance angle θFEM (Figure 10a), for the same AuNP size and surface density used in Figure 8a.
It is clear the increasing of the discrepancy δσ for higher values of the surface density (Figure 10a), especially for bigger nanoparticles. The best results are observed for AuNPs of 20 nm in diameter, for which the discrepancy remains lower than 10% for all the analyzed values of surface density.
In Figure 10b, for each value of surface density σFEM, we compare the effective permittivity of the AuNPs/water composite layer calculated by the use of the MG theory (MG-εeff) and the values of εeff calculated using the FEM method (FEM-εeff). The calculations were performed considering AuNPs with a diameter of 40 nm. The FEM-εeff values are larger than the MG-εeff and the difference increases with σ. Again, this particular behavior is associated to the progressive contribution of the interparticle dipolar interactions for higher values of surface density.
Besides of the limitations of the MG theory due to the onset of the interparticle interactions, it is important to highlight the effects of dipolar interaction between the AuNPs and the gold thin film supporting the plasma wave in the presence of thin dielectric layer spacer [7,12,13]. In Figure 11, we illustrate the near E-field surrounding a single AuNP with a diameter of 10 nm with an excitation wavelength of 633 nm. In this case, we consider a value of σ low enough to disregard the dipole-dipole interaction between the AuNPs, and a nanoparticle size small enough to validate the quasi-static regime [16]. The intensity of the electromagnetic field at the SiO2/Au interface clearly shows the onset of AuNP-Au thin film for very small values of hSiO2 [7,17,39].
The AuNP-Au thin film interaction is also dependent on the wavelength [7,13,17,39]. Figure 12 shows the near-field surrounding a 10 nm-AuNP over a 2 nm thick SiO2 layer at the wavelengths of 633 nm and 783 nm. In this case, we observe that the interaction decreases with the wavelength, in accordance with [39].
To investigate the limits of the MG theory due to the AuNP-Au thin film interaction, we calculated the percentage discrepancy δσ between σFEM and σMG depending on the SiO2 thin film thickness. The results, reported in Figure 13a, were obtained for three different excitation wavelengths. We observed that, for the same wavelength, the discrepancy δσ reduces increasing the thickness of the SiO2 layer. Vice versa, for the same value of hSiO2, δσ decreases for higher excitation wavelengths. These general tendencies in the behavior of δσ can be explained with the set-up of the dipolar interaction between the single isolated AuNP and the thin Au layer constituting the Au/SiO2 sensing platform [7,39], coherently with the results reported in Figure 11 and Figure 12. In our calculation for the 10 nm sized AuNPs, we observed that δσ is maintained below 10% for all the excitation wavelengths considered, when the SiO2 thickness is higher than 20 nm.
In Figure 13b,c we compare the real and imaginary parts of the dielectric constant of the single AuNP (εNp) calculated by the MG theory in order to fit the exact reflectivity curves calculated by the FEM method, as proposed in [7]. Interestingly, when the dielectric thickness is smaller than ~ 10 nm, we observe an expressive variation in εNp, which induces to a wrong interpretation of the experimental results, such as anomalous dispersion in the real part of the dielectric constant of the nanoparticles, as observed in [7]. Here, we show clearly by the near field simulation reported in Figure 12, that the anomalous dispersion is effectively due to the onset of AuNP-Au thin film dipolar interaction, which cannot be taken in account by the use of the classical effective medium theories [16].

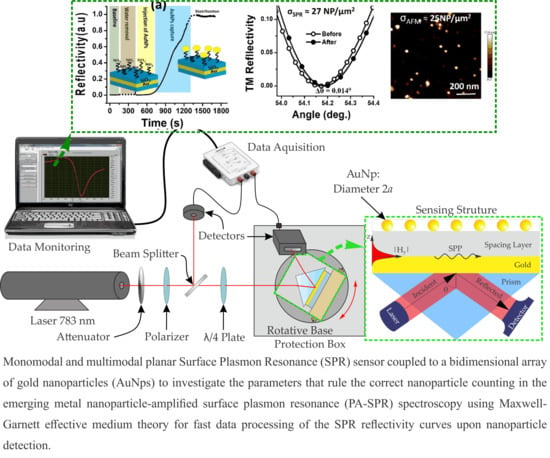
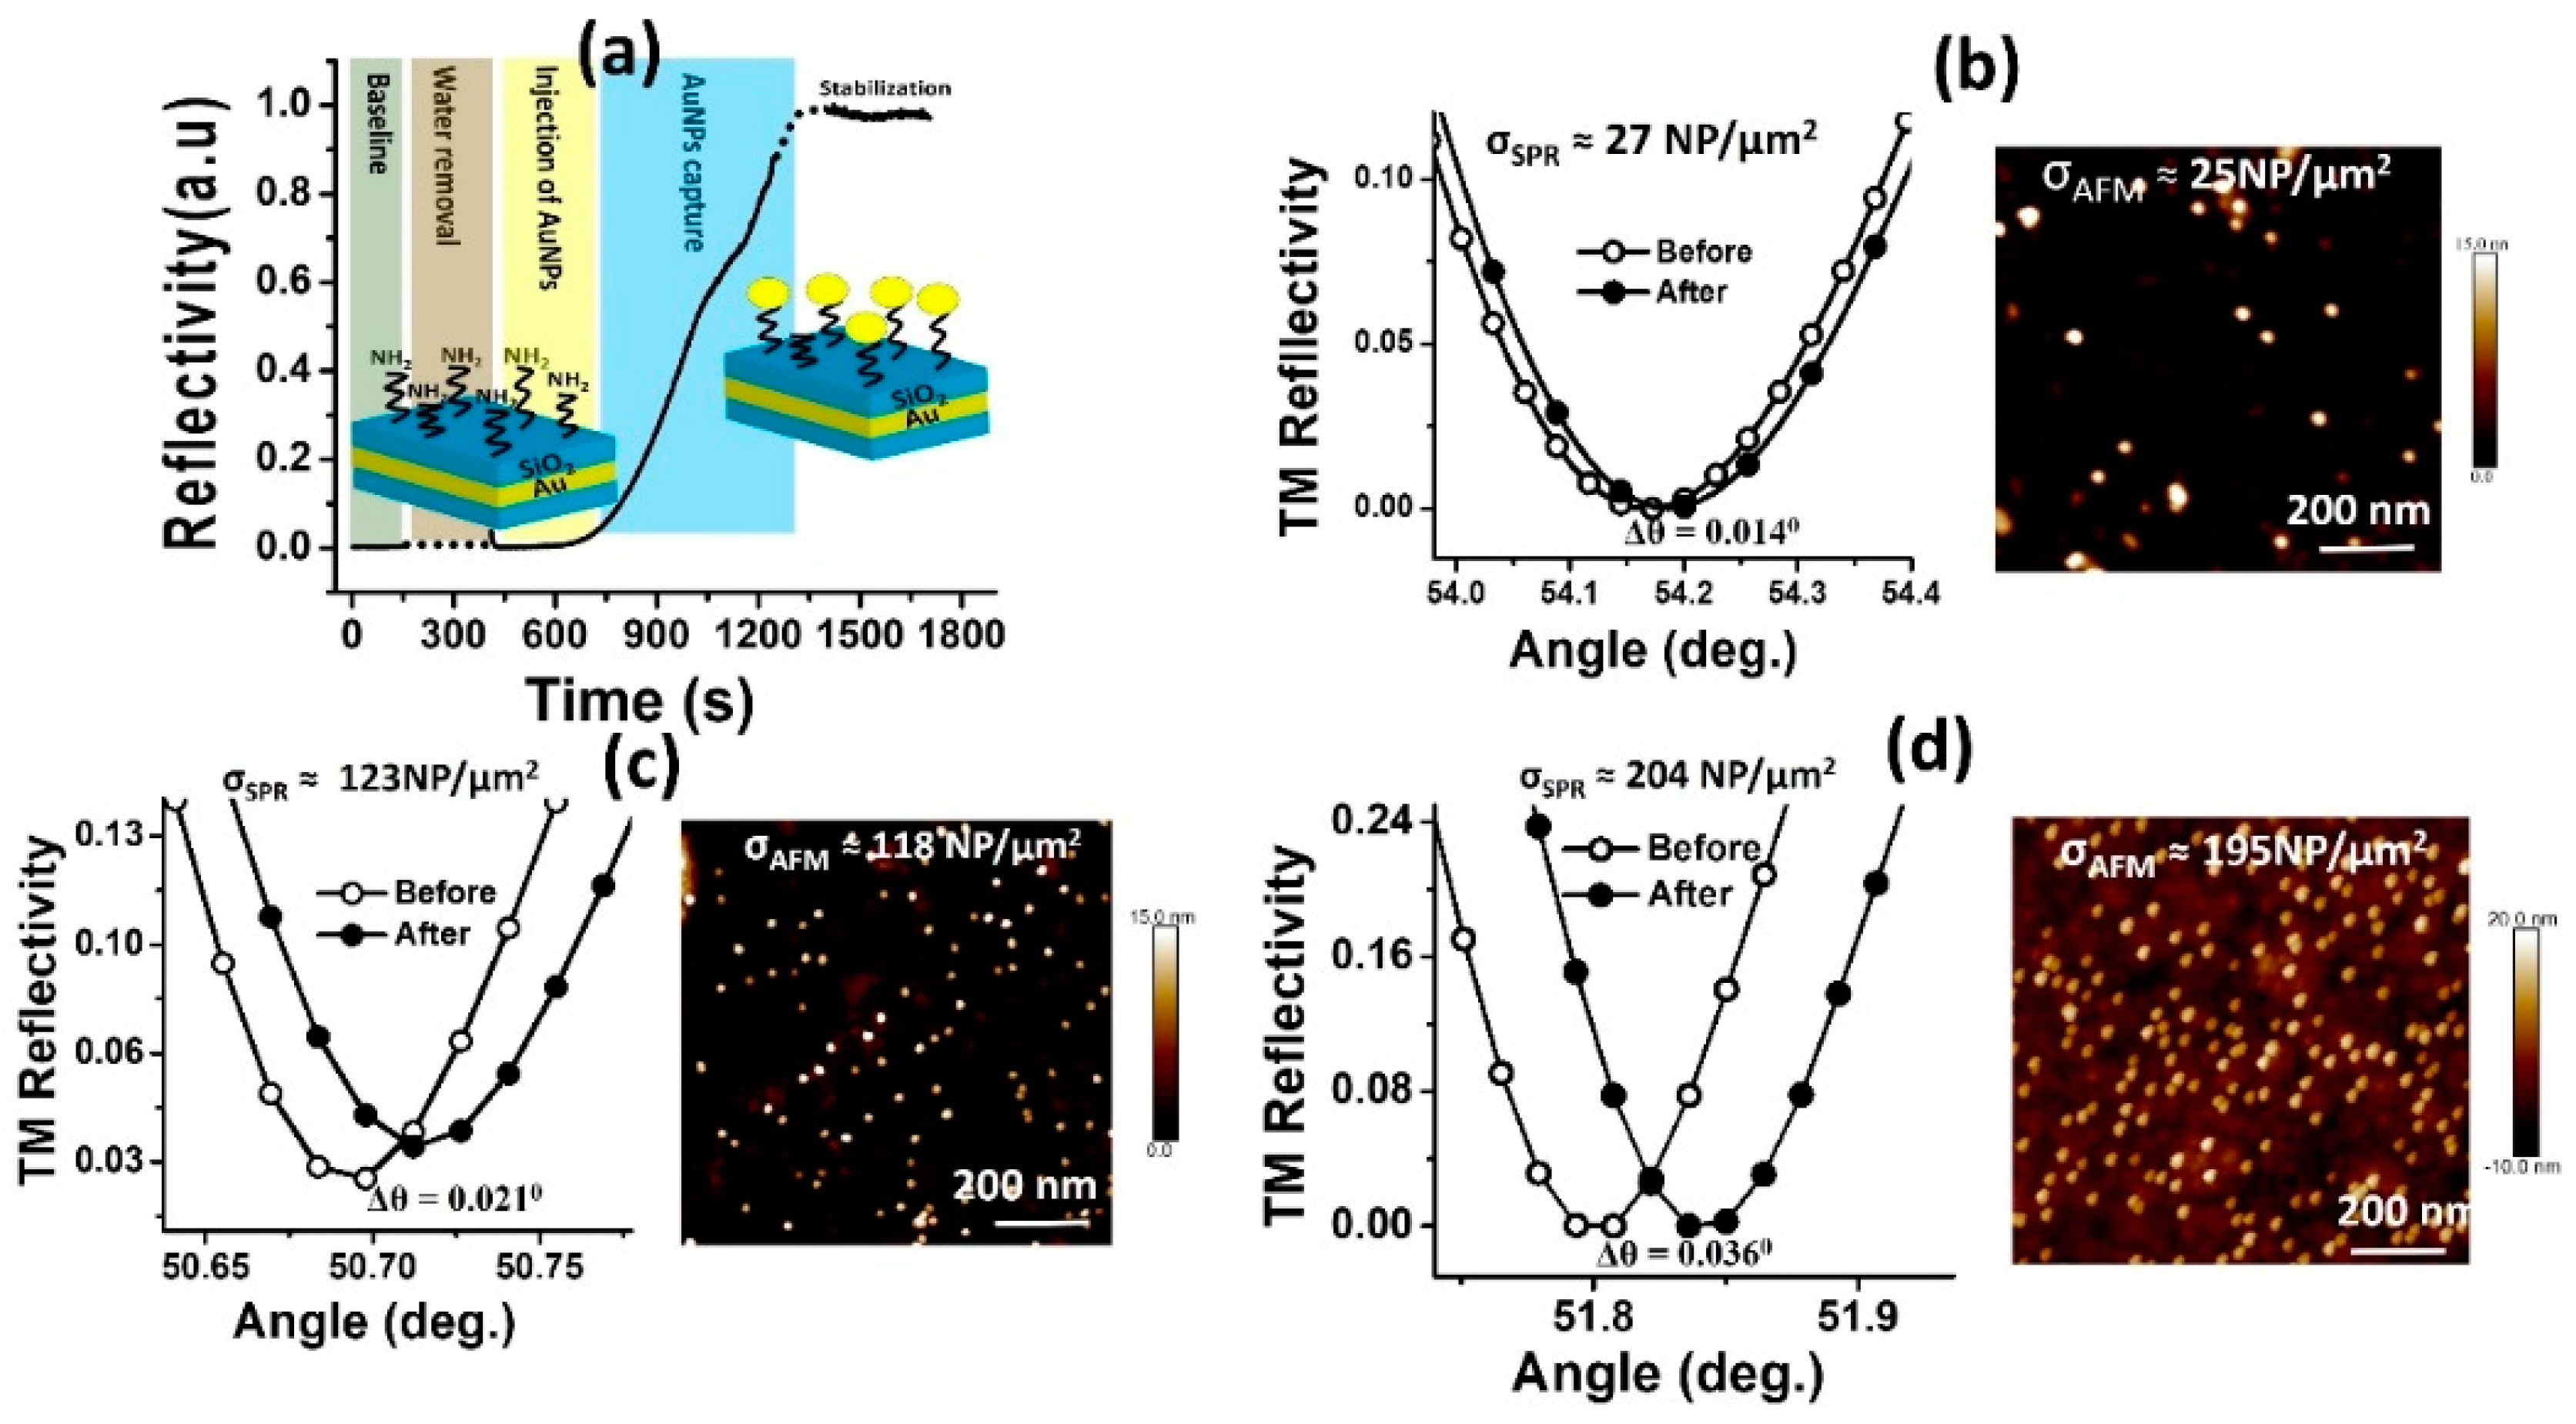
3.3. Experimental SPR AuNPs Counting

The DLWGs fabricated in the present research were tested as nanoparticle counter for AuNPs with the nominal diameter of 14.6 nm, a dimension for which the Maxwell-Garnett theory can be still applied under the assumption of inclusions with negligible value of the scattering-cross section [40]. Following the theoretical results reported in Section 3.1, the TM1 mode was used as the most sensitive optical nanoprobe for the detection of the AuNPs in DLWG regime.
The performances of the DLWGs in NP counting were studied by SPR spectroscopy and AFM in a range of σ between ~20 and 200 NP/µm2, in order to prevent the effects of dipole-dipole interparticle interaction as highlighted in Section 3.2. Prior to the optical sensing experiments, the optical constants and thickness of the gold and SiO2 layers constituting the DLWGs were characterized by two-color SPR spectroscopy using the experimental procedure reported in [41]. In Table 1, the values obtained for the parameters of the DLWGs at the experimental wavelength of 783 nm are shown.
In Figure 14a, the time-dependent SPR sensorgram relative to the different experimental phases involved the sensing of the AuNPs is reported. The different experimental phases consist in base-line determination for TM1 mode in a pure water environment, water removal with enhancement of the reflectivity (not shown), injection of the colloidal solution of nanoparticles with monitoring of the interaction between the amino group of the SAM of APTMS and the negative charge of the AuNPs, and final pure water rinsing and stabilization of the SPR signal. The raise of the reflectivity is due to a shift Δθ in the SPR angle after AuNPs detection and stabilization. In Figure 14b–d, the shift of the SPR reflectivity curves and AFM image of the external surface of the DLWGs after nanoparticles sensing with a final surface density of about 25, 120 and 200 NP/µm2 are shown.
As it is shown in the AFM images reported in Figure 14, the AuNPs are randomly distributed on the surface, which may not follow the simulation modeling proposed in Section 2 based on an ordered bidimensional array of AuNPs. This doesn´t represent a crucial issue when the metal nanoparticles are not interacting one with the other. In the approximation of non-interacting nanoparticles, the exact spatial distribution of the bidimensional array of AuNPs deposited over the SiO2 thin film of the sensor does not influence the optical response of the device, and the shift in the angle of resonance of the DLWGs upon the interaction with the AuNPs depends only on the surface density σ, and not on their specific surface distribution.
This assumption is validated by the excellent matching between the AFM and SPR experimental densities σSPR and σAFM during the nanoparticle counting in the range between approximately 20 and 200 NPs/µm2. Progressive increasing surface density will lead to partial agglomeration of the AuNPs, breaking the approximation of non-interacting nanoparticles for values of surface density lower than the ones predicted by the theoretical analysis. Anyway, the value of surface density at which the AuNPs starts to agglomerate and the non-interacting nanoparticle approximation starts to fail may depend in principle on several physico-chemical factors [15] such as the dimension of the nanoparticle, the surface density of the molecular ligands on the SiO2 surface of the waveguide, the flux velocity of the AuNPs during the injection process, or the pH of the water environment containing the colloidal dispersion of AuNPs. The optimal choice of the experimental parameters during the metal nanoparticle deposition to prevent their agglomeration and extend the range of the sensor, represent an interesting physico-chemical investigation which we pretend to address in the near future.

4. Conclusions

In this paper, we analyzed in details the limits of the Maxwell-Garnett theory in the determination of the surface density σ of AuNPs in PA-SPR spectroscopy. Using the Kreschtmann configuration and an Au/SiO2 sensing platform, we compared the changes in the reflectivity curves of the SPR sensor upon interaction with a bidimensional array of spherical AuNPs, applying mathematical models based on FEM and MG theory.
We observed a progressive decrease in the accuracy of the optical predictions of the effective medium theory when increasing either the surface density or the size of the AuNPs. The failure of the MG theory is attributed to the onset of dipolar interparticle interaction between adjacent AuNPs, as clearly observed by optical near-field simulations performed by FEM. The theoretical results show that the discrepancy in the determination of σ remains below 10% for surface densities of the order of ~100 Np/µm2, when small nanoparticles with a diameter of about 20 nm are considered.
Our calculations by the FEM, also showed that the accuracy of the MG theory in the prediction of the optical properties of the AuNP/water thin film decreases with the onset of the AuNP-Au thin film interaction, and confirm that the anomalous dispersion usually observed experimentally when very thin dielectric thin films are used, is due to the failure of the effective medium theories to take in account this particular dipolar interaction. The error in the estimation of σ by the use of the MG theory is anyway maintained below 10% when dielectric spacers with a thickness higher than about 20 nm are considered.
We conclude that three conditions are necessary for a quantitative, rapid and accurate measurements of σ in an extended range: (i) the introduction of a SiO2 spacing layer with a thickness higher than ~20 nm; (ii) the use of AuNPs with a diameter smaller than ~20 nm; (iii) the use of excitation wavelengths in the near infrared region, in order to have a reduced interparticle interaction for high values of σ.
On these bases, we demonstrated experimentally the functionality of the Maxwell-Garnett theory for the accurate counting of small AuNPs (2a = 14.6 nm) deposited on DLWGs. The experiments were successfully conducted in the range between 20 and 200 NP/µm2, demonstrating an excellent matching between atomic force microscopy (AFM)- and SPR-based results in nanoparticle counting. The results suggest that in the case of small AuNPs, the DLWGs might be successfully used for quantitative measurements of σ in PA-SPR spectroscopy, paving the way to perform quantitative measurement of nanoparticle uptake by lipidic or artificial cellular membranes [43].

Author Contributions

Conceptualization, K.Q.d.C., V.D. and T.D.R.; Data curation, J.S.C., Q.Z. and O.P.; Formal analysis, J.S.C. and Q.Z.; Methodology, K.Q.d.C. and T.D.R.; Software, J.S.C. and Q.Z.; Investigation J.S.C., Q.Z., O.P. and G.F.; Validation, J.S.C., Q.Z., O.P. and G.F.; Resources, V.D., O.P., G.F. and T.D.R.; Writing—original draft preparation, J.S.C.; Writing—review and editing, K.Q.d.C., V.D. and T.D.R.; Supervision, K.Q.C. and T.D.R.; Project administration, T.D.R.

Funding

This research was funded by INEO-INCT, FAPERJ, FAPESPA and CNPq. Q.Z. and T.D.R. thanks FAPERJ for BolsaNota10 and JCNE grant, respectively.

Conflicts of Interest

The authors declare no conflict of interest.

References

  1. Homola, J. Surface plasmon resonance sensors for detection of chemical and biological species. Chem. Rev. 2008, 108, 462–493. [Google Scholar] [CrossRef] [PubMed]
  2. Homola, J. Surface Plasmon Resonance Based Sensors. In Springer Series on Chemical Sensors and Biosensors; Wolfbeis, O.S., Ed.; Springer: Berlin/Heidelberg, Germany; New York, NY, USA, 2006; Volume 4, ISBN 978-3-642-07046-4. [Google Scholar]
  3. Nenninger, G.G.; Piliarik, M.; Homola, J. Data analysis for optical sensors based on spectroscopy of surface plasmons. J. Meas. Sci. Technol. 2002, 13. [Google Scholar] [CrossRef]
  4. O’Brien, M.J.; Pérez-Luna, V.H.; Brueck, S.R.J.; López, G.P. A surface plasmon resonance array biosensor based on spectroscopic imaging. Biosens. Bioelectron. 2001, 16, 97–108. [Google Scholar] [CrossRef]
  5. Ng, S.; Loo, F.; Wu, S.; Kong, S.; Wu, C.; Ho, H. Common-path spectral interferometry with temporal carrier for highly sensitive surface plasmon resonance sensing. Opt. Express 2013, 21, 20268–20273. [Google Scholar] [CrossRef] [PubMed]
  6. Piliarik, M.; Homola, J. Surface plasmon resonance (SPR) sensors: approaching their limits? Opt. Express 2009, 17, 16505–16517. [Google Scholar] [CrossRef] [PubMed]
  7. Golden, M.S.; Bjonnes, A.C.; Georgiadis, R.M. Distance- and wavelength-dependent dielectric function of au nanoparticles by angle-resolved surface plasmon resonance imaging. J. Phys. Chem. C 2010, 114, 8837–8843. [Google Scholar] [CrossRef]
  8. Salamon, Z.; Macleod, H.; Tollin, G. Coupled plasmon-waveguide resonators: a new spectroscopic tool for probing proteolipid film structure and properties. Biophys. J. 1997, 73, 2791–2797. [Google Scholar] [CrossRef] [Green Version]
  9. Grandidier, J.; Massenot, S.; des Francs, G.C.; Bouhelier, A.; Weeber, J.-C.; Markey, L.; Dereux, A.; Renger, J.; González, M.U.; Quidant, R. Dielectric-loaded surface plasmon polariton waveguides: Figures of merit and mode characterization by image and Fourier plane leakage microscopy. Phys. Rev. B 2008, 78, 245419. [Google Scholar] [CrossRef]
  10. Lyon, L.A.; Musick, M.D.; Natan, M.J. Colloidal au-enhanced surface plasmon resonance immunosensing. Anal. Chem. 1998, 70, 5177–5183. [Google Scholar] [CrossRef]
  11. He, L.; Smith, E.A.; Natan, M.J.; Keating, C.D. The distance-dependence of colloidal au-amplified surface plasmon resonance. J. Phys. Chem. B 2004, 108, 10973–10980. [Google Scholar] [CrossRef]
  12. Špringer, T.; Ermini, M.L.; Špačková, B.; Jabloňků, J.; Homola, J. Enhancing sensitivity of surface plasmon resonance biosensors by functionalized gold nanoparticles: Size matters. Anal. Chem. 2014, 86, 10350–10356. [Google Scholar] [CrossRef] [PubMed]
  13. Li, X.; Tamada, K.; Baba, A.; Knoll, W.; Hara, M. Estimation of dielectric function of biotin-capped gold nanoparticles via signal enhancement on surface plasmon resonance. J. Phys. Chem. B 2006, 110, 15755–15762. [Google Scholar] [CrossRef] [PubMed]
  14. He, L.; Musick, M.D.; Nicewarner, S.R.; Salinas, F.G.; Benkovic, S.J.; Natan, M.J.; Keating, C.D. Colloidal au-enhanced surface plasmon resonance for ultrasensitive detection of DNA hybridization. J. Am. Chem. Soc. 2000, 122, 9071–9077. [Google Scholar] [CrossRef]
  15. Scherbahn, V.; Nizamov, S.; Mirsky, V.M. Plasmonic detection and visualization of directed adsorption of charged single nanoparticles to patterned surfaces. Microchimica Acta 2016, 183, 2837–2845. [Google Scholar] [CrossRef] [PubMed] [Green Version]
  16. Choy, T.C. Effective Medium Theory: Principles and Applications, 2nd ed.; Oxford University Press: Oxford, UK, 2016; ISBN 9780191015182. [Google Scholar]
  17. Uchiho, Y.; Shimojo, M.; Furuya, K.; Kajikawa, K. Optical response of gold-nanoparticle-amplified surface plasmon resonance spectroscopy. J. Phys. Chem. C 2010, 114, 4816–4824. [Google Scholar] [CrossRef]
  18. Comsol Multiphysics Modeling Software. Available online: https://www.comsol.com (accessed on 2 November 2018).
  19. Shiohara, A.; Wang, Y.; Liz-Marzan, L.M. Recent Approaches toward creation of hot spots for SERS detection. J. Photochem. Photobiol. C 2014, 21, 2–25. [Google Scholar] [CrossRef]
  20. Margheri, G.; Trigari, S.; Sottini, S.; D’Agostino, R.; Del Rosso, T.; Del Rosso, M. The Binding of EGFR to GM1(3) Hosted in Lipid Raft-Like Biomembranes Insighted by Plasmonic Resonance Techniques. J. Sens. 2015, 2015. [Google Scholar] [CrossRef]
  21. Margheri, F.; Papucci, L.; Schiavone, N.; D’Agostino, R.; Trigari, S.; Serratì, S.; Laurenzana, A.; Biagioni, A.; Luciani, C.; Chillà, A.; Andreucci, E.; Del Rosso, T.; Margheri, G.; Del Rosso, M.; Fibbi, G. Differential uPAR recruitment in caveolar-lipid rafts by GM1 and GM3 gangliosides regulates endothelial progenitor cells angiogenesis. J. Cell. Mol. Med. 2015, 19, 113–123. [Google Scholar] [CrossRef]
  22. Del Rosso, T.; Sánchez, J.E.H.; Carvalho, R.D.S.; Pandoli, O.; Cremona, M. Accurate and simultaneous measurement of thickness and refractive index of thermally evaporated thin organic films by surface plasmon resonance spectroscopy. Opt. Express 2014, 22, 18914–18923. [Google Scholar] [CrossRef]
  23. Del Rosso, T.; Zaman, Q.; Cremona, M.; Pandoli, O.; Barreto, A.R.J. SPR sensors for monitoring the degradation processes of Eu(dbm)3(phen) and Alq3 thin films under atmospheric and UVA exposure. Appl. Surf. Sci. 2018, 442, 759–766. [Google Scholar] [CrossRef]
  24. Maier, S.A. Plasmonics: Fundamentals and Applications; Springer: New York, NY, USA, 2007; ISBN 978-0387-33150-8. [Google Scholar]
  25. Novotny, L.; Hecht, B. Principles of Nano-Optics, 2nd ed.; Cambridge University Press: New York, NY, USA, 2012; pp. 369–413. ISBN 978-1-107-00546-4. [Google Scholar]
  26. Turkevich, J.; Stevenson, P.C.; Hillier, J. A study of the nucleation and growth processes in the synthesis of colloidal gold. J. Discuss. Faraday Soc. 1951, 11, 55–75. [Google Scholar] [CrossRef]
  27. Schaub, A.; Slepicka, P.; Kasparkova, I.; Malinsky, P.; Mackova, A.; Svorcik, V. Gold nanolayer and nanocluster coatings induced by heat treatment and evaporation technique. Nanoscale Res. Lett. 2013, 249. [Google Scholar] [CrossRef] [PubMed]
  28. Lee, C.; Robertson, C.S.; Nguyen, A.H.; Kahraman, M.; Wachsmann-Hogiu, S. Thickness of a metallic film, in addition to its roughness, plays a significant role in SERS activity. Sci. Rep. 2015, 11644. [Google Scholar] [CrossRef] [PubMed]
  29. Del Rosso, T.; Zaman, Q.; Romani, E.C.; Pandoli, O.; Aucelio, R.Q.; Melo de Lima, L.; Cremona, M.; Dmitriev, V.; da Costa, K.Q.; Freire, F.L., Jr.; Maia da Costa, M.E.H. Enhanced stability of plasmonic metal thin films by CVD grown graphene transfer. Thin Solid Films 2017, 644. [Google Scholar] [CrossRef]
  30. Raether, H. Surface Plasmons on Smooth and Rough Surfaces and on Gratings; Springer: Berlin/Heidelberg, Germany; New York, NY, USA, 1988; ISBN 978-3-662-15124-2. [Google Scholar]
  31. Quinten, M. Optical Properties of Nanoparticle Systems: Mie and Beyond; Wiley: Weinheim, Germany, 2011; ISBN 9783527410439. [Google Scholar]
  32. Capek, I. Noble Metal Nanoparticles: Preparation, Composite Nanostructures, Biodecoration and Collective Properties; Springer: Tokyo, Japan, 2017; ISBN 978-4-431-56556-7. [Google Scholar]
  33. Zhao, L.; Kelly, K.L.; Schatz, G.C. The extinction spectra of silver nanoparticle arrays: influence of array structure on plasmon resonance wavelength and width. J. Phys. Chem. B 2003, 107, 7343–7350. [Google Scholar] [CrossRef]
  34. Chew, W. Waves and Fields in Inhomogeneous Media; IEEE Press: Washington, DC, USA, 1996; ISBN 978-0-780-34749-6. [Google Scholar]
  35. Shalabney, A.; Abdulhalim, I. Electromagnetic fields distribution in multilayer thin film structures and the origin of sensitivity enhancement in surface plasmon resonance sensors. Sens. Actuators A Phys. 2010, 159, 24–32. [Google Scholar] [CrossRef]
  36. Lahav, A.; Auslender, M.; Abdulhalim, I. Sensitivity enhancement of guided-wave surface-plasmon resonance sensors. Opt. Lett. 2010, 33, 2539–2541. [Google Scholar] [CrossRef]
  37. Nguyen, H.H.; Park, J.; Kang, S.; Kim, M. Surface plasmon resonance: A versatile technique for biosensor applications. Sensors 2015, 15. [Google Scholar] [CrossRef]
  38. Pockrand, I. Surface plasma oscillations at silver surfaces with thin transparent and absorbing coatings. Surf. Sci. 1978, 72, 577–588. [Google Scholar] [CrossRef]
  39. Huang, C.-Z.; Wu, M.-J.; Chen, S.-Y. High Order Gap Modes of Film-Coupled Nanospheres. J. Phys. Chem. C 2015, 119, 13799–13806. [Google Scholar] [CrossRef]
  40. García, M.A.; Llopis, J.; Paje, S.E. A simple model for evaluating the optical absorption spectrum from small Au-colloids in sol–gel films. Chem. Phys. Lett. 1999, 315, 313–320. [Google Scholar] [CrossRef]
  41. Del Rosso, T.; Margulis, W.; Fontana, J.; Carvalho, I.C.S. Plasmonics for the Characterization of Metal Organic Films and Nanoparticles. In Nanophotonics, Metal Nanostructures for Photonics; Kassab, L.R.P., de Araujo, C.B., Eds.; Elsevier: Amsterdam, The Netherlands, 2019; ISBN 9780081023785. [Google Scholar]
  42. Polyanskiy, M.N. Refractive Index Database. Available online: https://refractiveindex.info (accessed on 10 November 2018).
  43. Laurenzana, A.; Fibbi, G.; Chillá, A.; Margheri, G.; Rosso, T.; Rovida, E.; Rosso, M.; Margheri, F. Lipids rafts: Integrated platforms for vascular organization offering therapeutic opportunities. Cell. Mol. Life Sci. 2015, 72, 1537–1557. [Google Scholar] [CrossRef] [PubMed]
Figure 1. (a) Illustration of the experimental SPR set-up in Kreschtmann configuration. P: linear polarizer. WP: λ/4 wave-plate. (b) The sensing structure is composed of a coupling prism, a thin film of gold (~ 50 nm) and a dielectric spacer layer (SiO2).
Sensors 19 00584 g001
Figure 2. Schematic diagram showing the fabrication of the DLWGs. (a) 49 nm gold thin film deposited on clean SF4 glass. (b) Silanization with MPTS. (c) Hydrolysis process: methoxy groups are converted to Si-OH group. (d) Condensation leads to Si-O-Si network. (e) Deposition of SiO2 and (f) modification of SiO2 with amino group’s (-NH2) of APTS, which serves as molecular link for the negative charged citrate stabilized AuNPs.
Sensors 19 00584 g002
Figure 3. (a) AFM morphology image of the 49 nm gold thin film and (b) the 670 nm SiO2 layer constituting the DLWGs used in the present work. (c) Typical TEM image of the citrate colloidal solution of AuNPs used in the optical sensing experiments. A log-normal distribution is used to obtain the best fit to the experimental statistical distribution, represented as continuous line in the inset. (d) Comparison between the experimental (grey circles) and theoretical (continuous black line) extinction spectra of the citrate colloidal dispersion of AuNPs. The fit on the experimental data was obtained applying the Mie theory with quadrupole orders [31].
Sensors 19 00584 g003
Figure 4. (a) Unit periodic cell considered in the numerical simulations by the COMSOL® software. The Floquet theorem is used to set the periodic boundary conditions. Periodic ports are used in the top boundary (set on to simulate the incident planar wave) and in the bottom boundary (set off to simulate a very large layer) [18]; (b) Mesh of the FEM model of the sensor. Colors indicate the size of the elements, which is defined by physical and geometrical factors; (c) Resultant planar structure of the PA-SPR sensor in the effective layer approximation to represent the AuNPs periodic array.
Sensors 19 00584 g004
Figure 5. Reflectivity curves R(θ) at the wavelength of 633 nm with increasing values of hSiO2 for both (a) TM and (b) TE polarizations. The arrows highlight the resonant wave mode for each minimum in R. The thickness of the gold thin film is hAu = 46 nm and the external medium is water.
Sensors 19 00584 g005
Figure 6. The absolute values of the electric field for the resonant modes in the SPR platform. In colors for a cut plane parallel to the zx-plane: (a) Ez Field for TM0 mode with θ = 66.9°, (b) Ez field for TM1 mode with θ = 51.88°, and (c) Ey field for TE1 mode with θ = 53.57°; (d) Norm of E field for the resonant modes in a cut line parallel to the z-axis. Fixed parameters: λ = 633 nm, hAu = 46 nm, and hSiO2 = 600 nm.
Sensors 19 00584 g006
Figure 7. Bulk sensitivity S of the Au/SiO2 sensing platforms versus hSiO2 for variation of the external refractive index from 1.33 to 1.36 RIU. Both plasmonic and DLWG regimes in TM and TE polarizations are considered.
Sensors 19 00584 g007
Figure 8. (a) Relative deviation δθ between the resonance angles θFEM and θMG relative to an Au/SiO2 monomodal sensing platform with a dielectric thickness of 50 nm. The data are represented for AuNPs diameters of 20, 30, 40 and 60 nm, and surface densities σ between 26 and 83 Np/µm2. (b) Ez field between two adjacent AuNPs with the diameter of 60 nm embedded in water. The centers of the AuNPs are separated by the distance d, as highlighted in the inset.
Sensors 19 00584 g008
Figure 9. (a) Rmin and (b) FWHM of the reflectivity SPR spectra calculated by FEM for AuNPs with diameters of 60 nm, 40 nm, and 20 nm, and surface density in the range of 26 < σ < 83 Np/µm2. In (a), the inset highlights the reflectivity curves for 60 nm sized AuNPs and surface densities σ of 83, 62 and 35 Np/µm2.
Sensors 19 00584 g009
Figure 10. (a) The relative deviation δσ between the real surface density σFEM and the density σMG calculated applying the MG formula to fit the resonance angle θFEM. (b) Comparison between the effective permittivity of the Au/water composite layer calculated using the MG mixing formula (MG-εeff) and the correct real values obtained by FEM method (FEM-εeff). The comparison has been performed considering AuNPs with a diameter of 40 nm.
Sensors 19 00584 g010
Figure 11. Norm of the near electric field surrounding the AuNPs for thin dielectric spacer layers: (a) hSiO2 = 2 nm and (b) hSiO2 = 4 nm. The parameters are λ = 633 nm, hAu = 46 nm, a = 5 nm, σ = 40 Np/µm2, and θ = 60°.
Sensors 19 00584 g011
Figure 12. Norm of the near electric field surrounding an AuNP for a thin dielectric spacer layer with a thickness of 2 nm, calculated at the wavelengths of (a) 633 nm and (b) 783 nm. Fixed parameters: hAu = 46 nm, 2a = 10 nm, σ = 40 NP/µm2, and θ = 60°.
Sensors 19 00584 g012
Figure 13. (a) Relative percentage deviation δσ between the real surface density σFEM and the density σMG calculated using the MG theory to fit the TM0 resonance angle θFEM. Real (b) and imaginary (c) parts of the dielectric constant of the AuNPs (εNp) calculated by the MG theory in order to fit the exact reflectivity curves calculated by the FEM method. The results are shown in function of hSiO2 and for the excitation wavelengths of 580 nm, 633 nm and 780 nm. Fixed parameters: hAu = 46 nm, 2a = 10 nm and σ ≈ 40 NP/µm2.
Sensors 19 00584 g013
Figure 14. Principle of work of SPR nanoparticle counting with DLWGs. (a) SPR sensorgram relative to the sensing of the interaction between the amino group NH2+ of the external surface of the DLWGs and the negatively charged AuNPs. The TM1 mode of the DLWG has been used as evanescent optical probe. The excitation wavelength was 783 nm, and the sensorgram was taken at a fixed incidence angle of 50.695°. (b) Comparison between experimental σSPR and σAFM in the non-interacting surface density regime: experimental SPR reflectivity curve of the TM1 mode of the DLWGs in water before and after interaction of the AuNPs with the SiO2 surface (left side), and AFM image of a 1 µm × 1 µm region of the SiO2 surface of the device analyzed by SPR spectroscopy (right size), with a surface density of 25 NP/µm2. (c) σ = 120 NP/µm2. (d) σ = 200 NP/µm2. The average surface density σAFM was calculated by analysis of four different regions of each sample.
Sensors 19 00584 g014
Table 1. The thickness and dielectric constants of the gold thin film and SiO2 obtained from the SPR curves fitting.
λ (nm)GoldSiO2Water
783 hAu (nm)ε =εr + iεihSiO2 (nm)εrεr
44.57 −23.91 + i1.726442.111.76 [42]

