Signal Processing and Target Fusion Detection via Dual Platform Radar Cooperative Illumination

 , ,
, ,
Abstract
1. Introduction
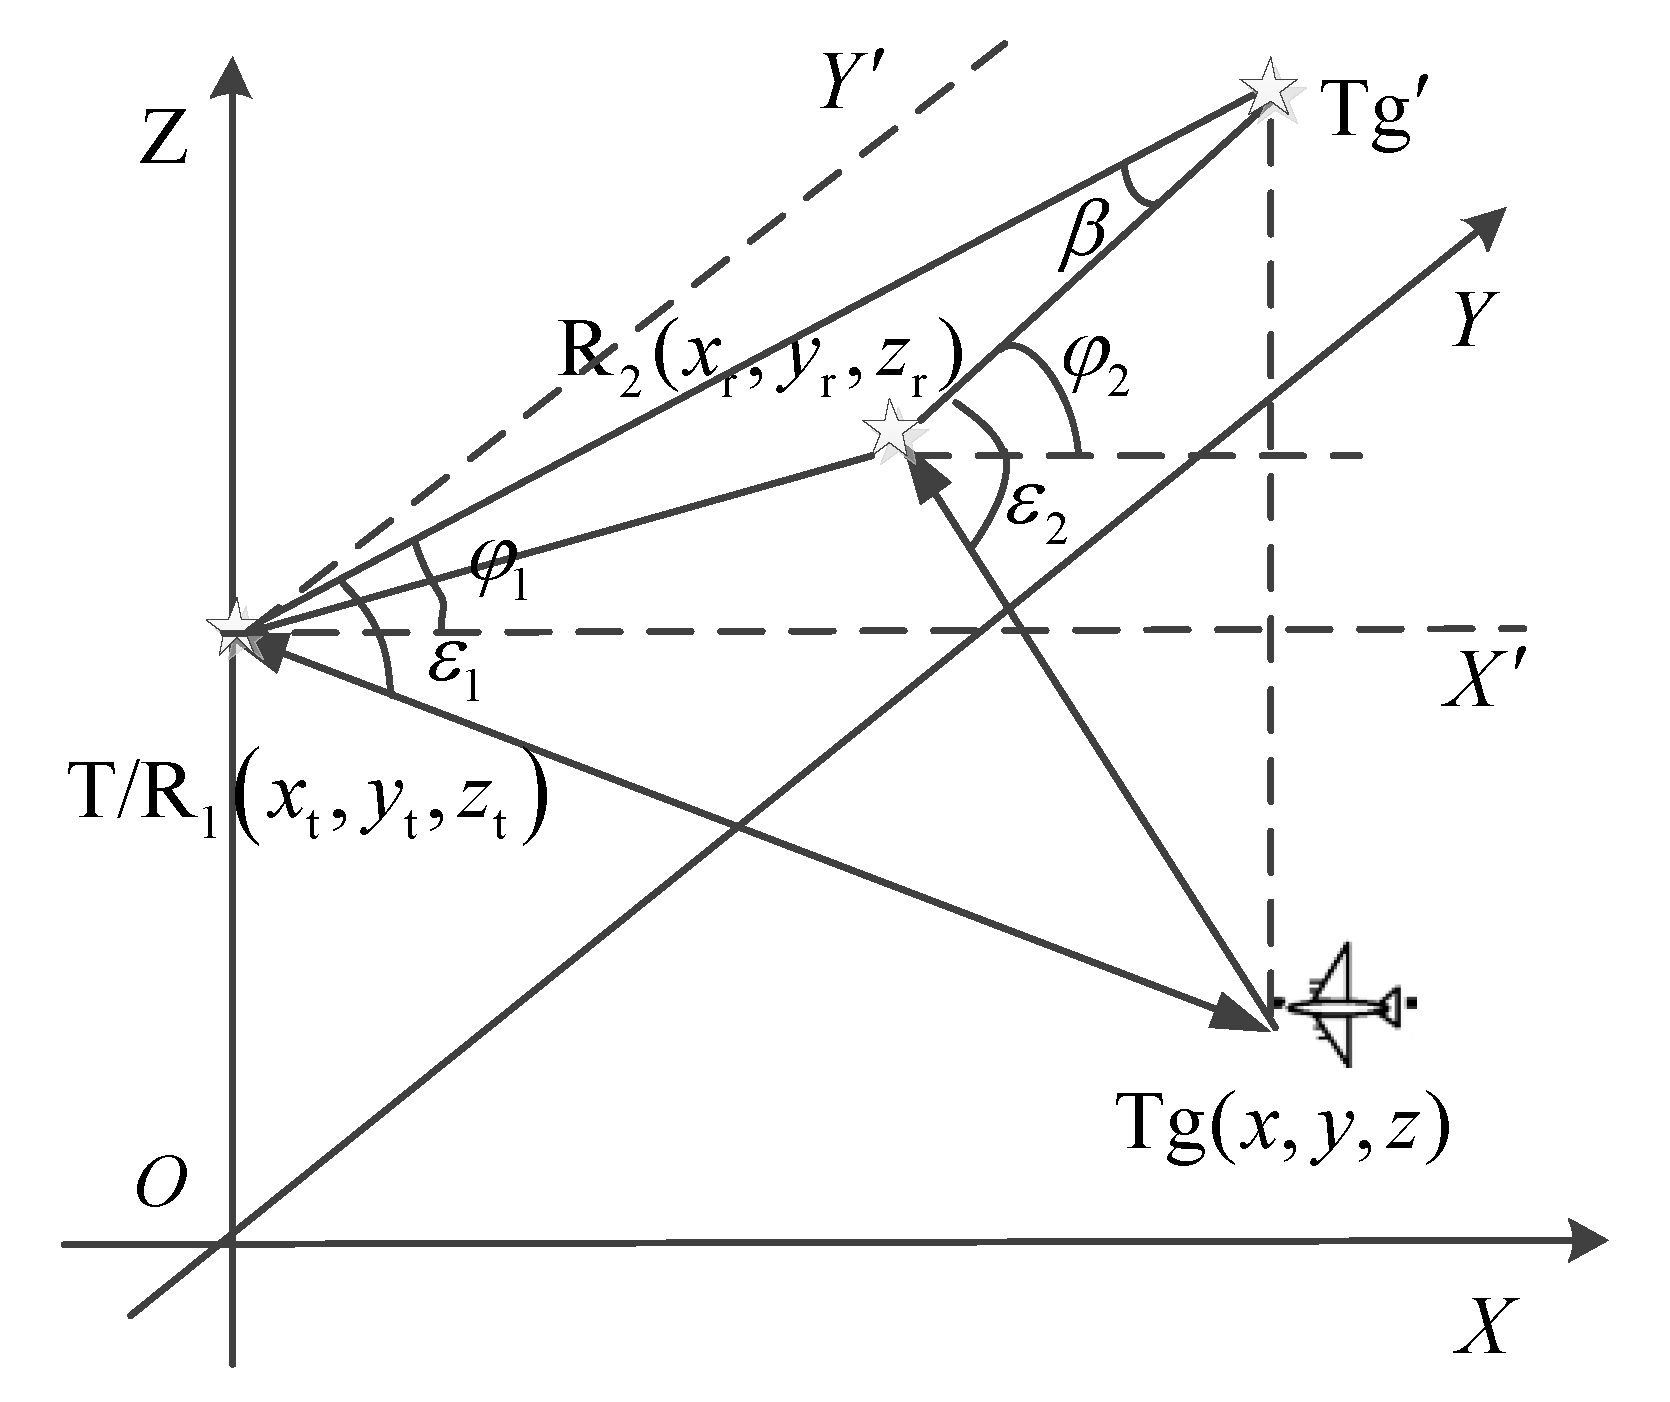
2. Modeling
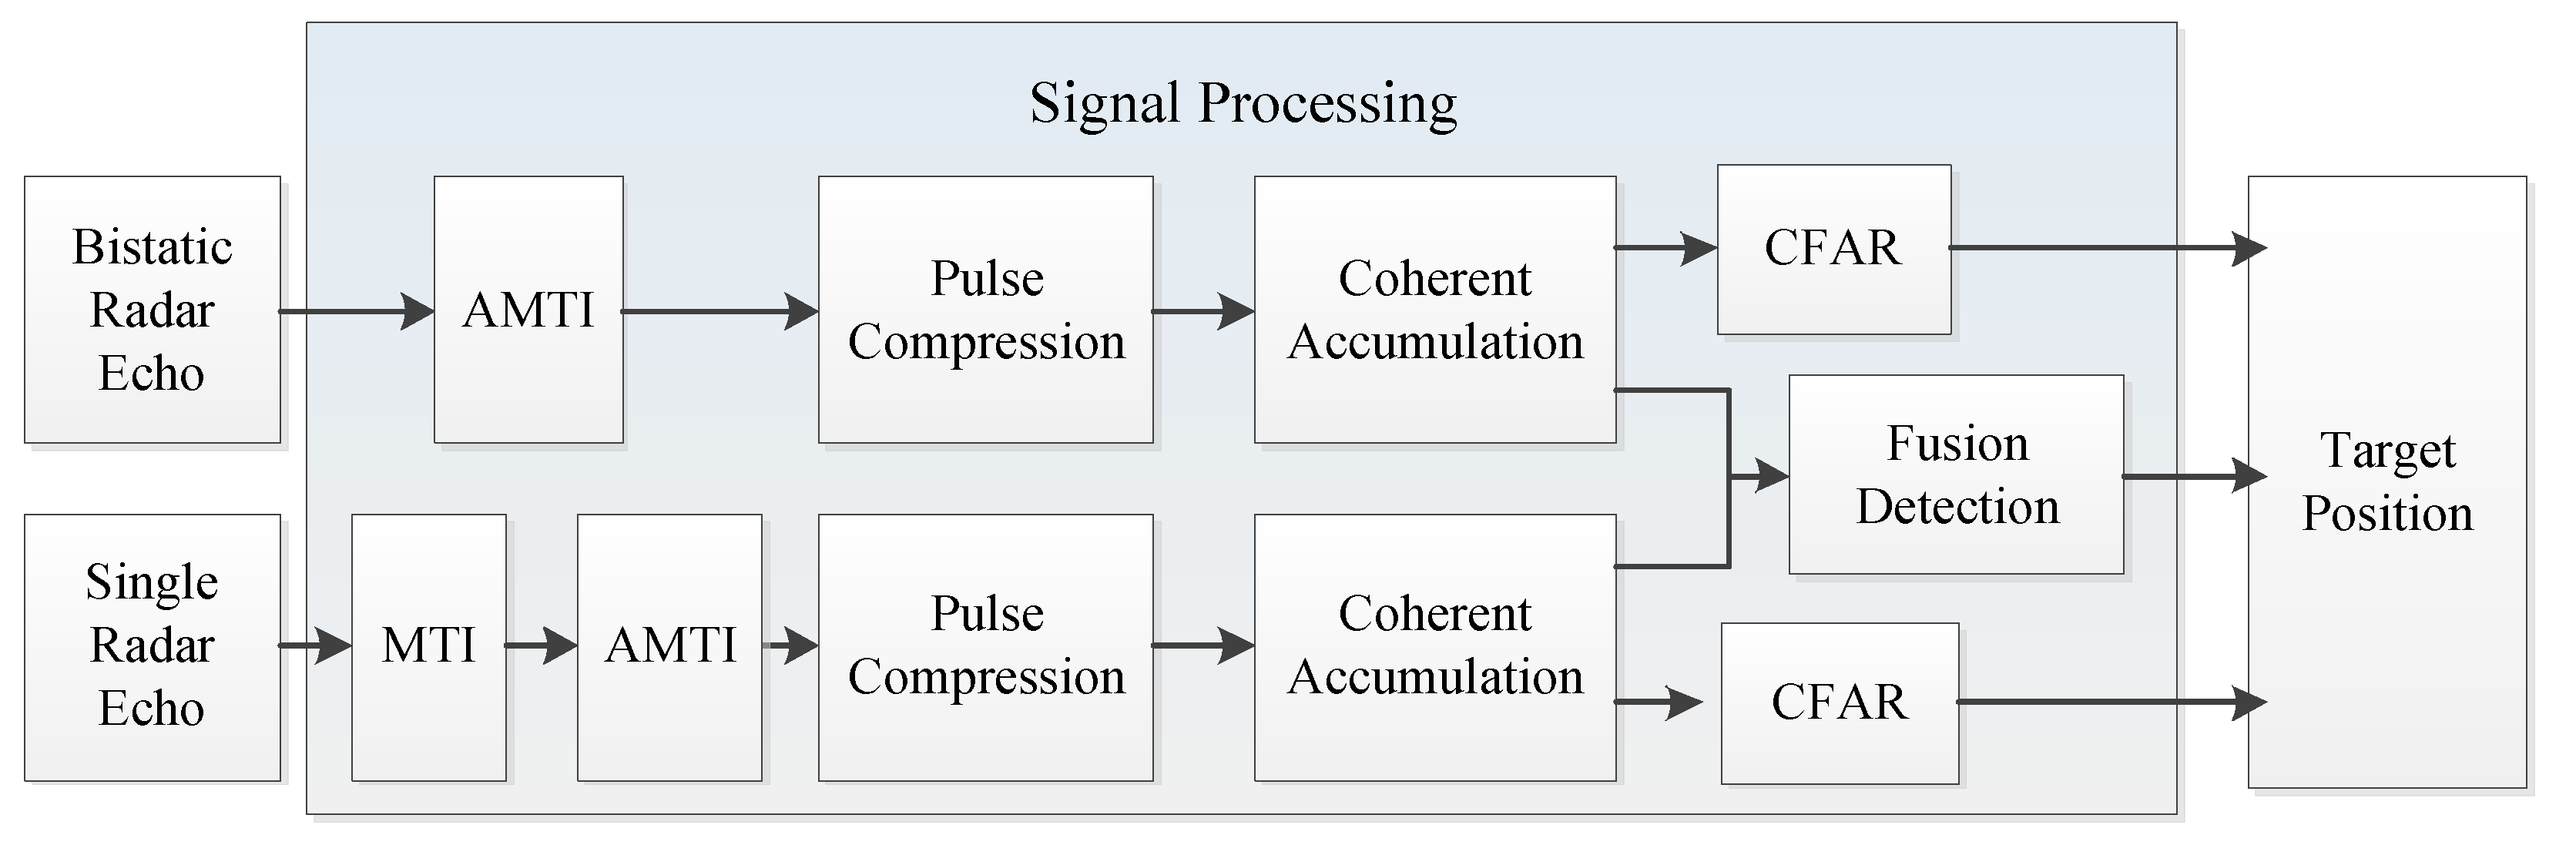
3. Target Cooperative Detection for the Cooperative Detection System.
- (1)
- The receiving platform and the transmitting platform have their own navigation system, which can get their own position information in real time and communicate with each other.
- (2)
- The target is not at the base line of the transceiver and receiver platform, which means there is a time delay between the direct wave and the echo arriving at the receiver.
- (3)
- The main lobe direction of the radar antenna is known, which is a three-dimensional radar.
- (4)
- The arrival time of the echo can be measured.
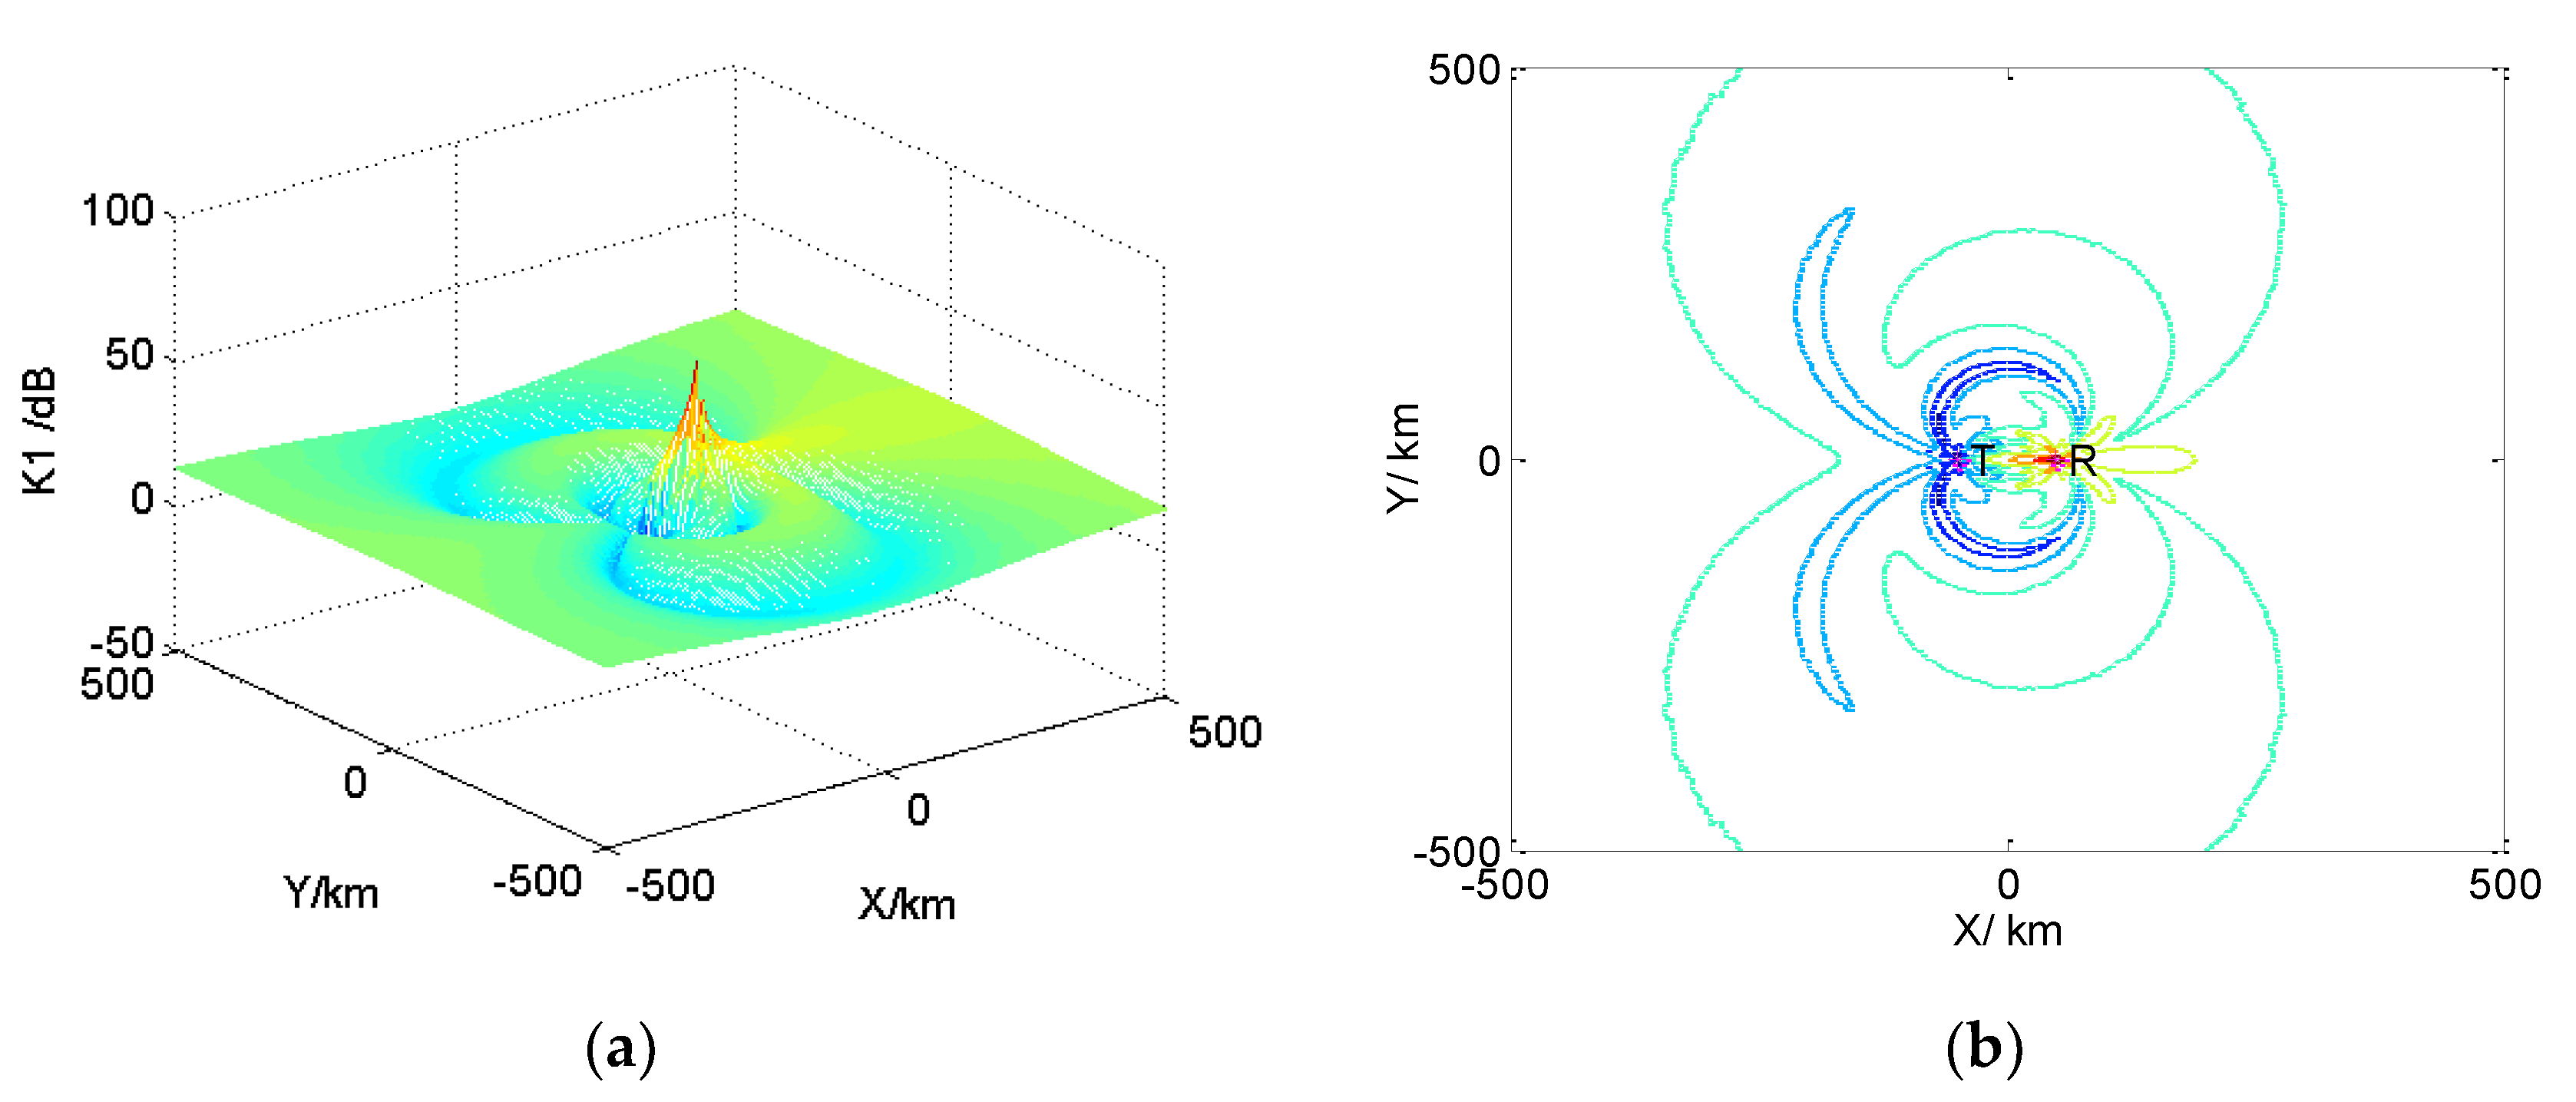
3.1. Detection Range Comparison
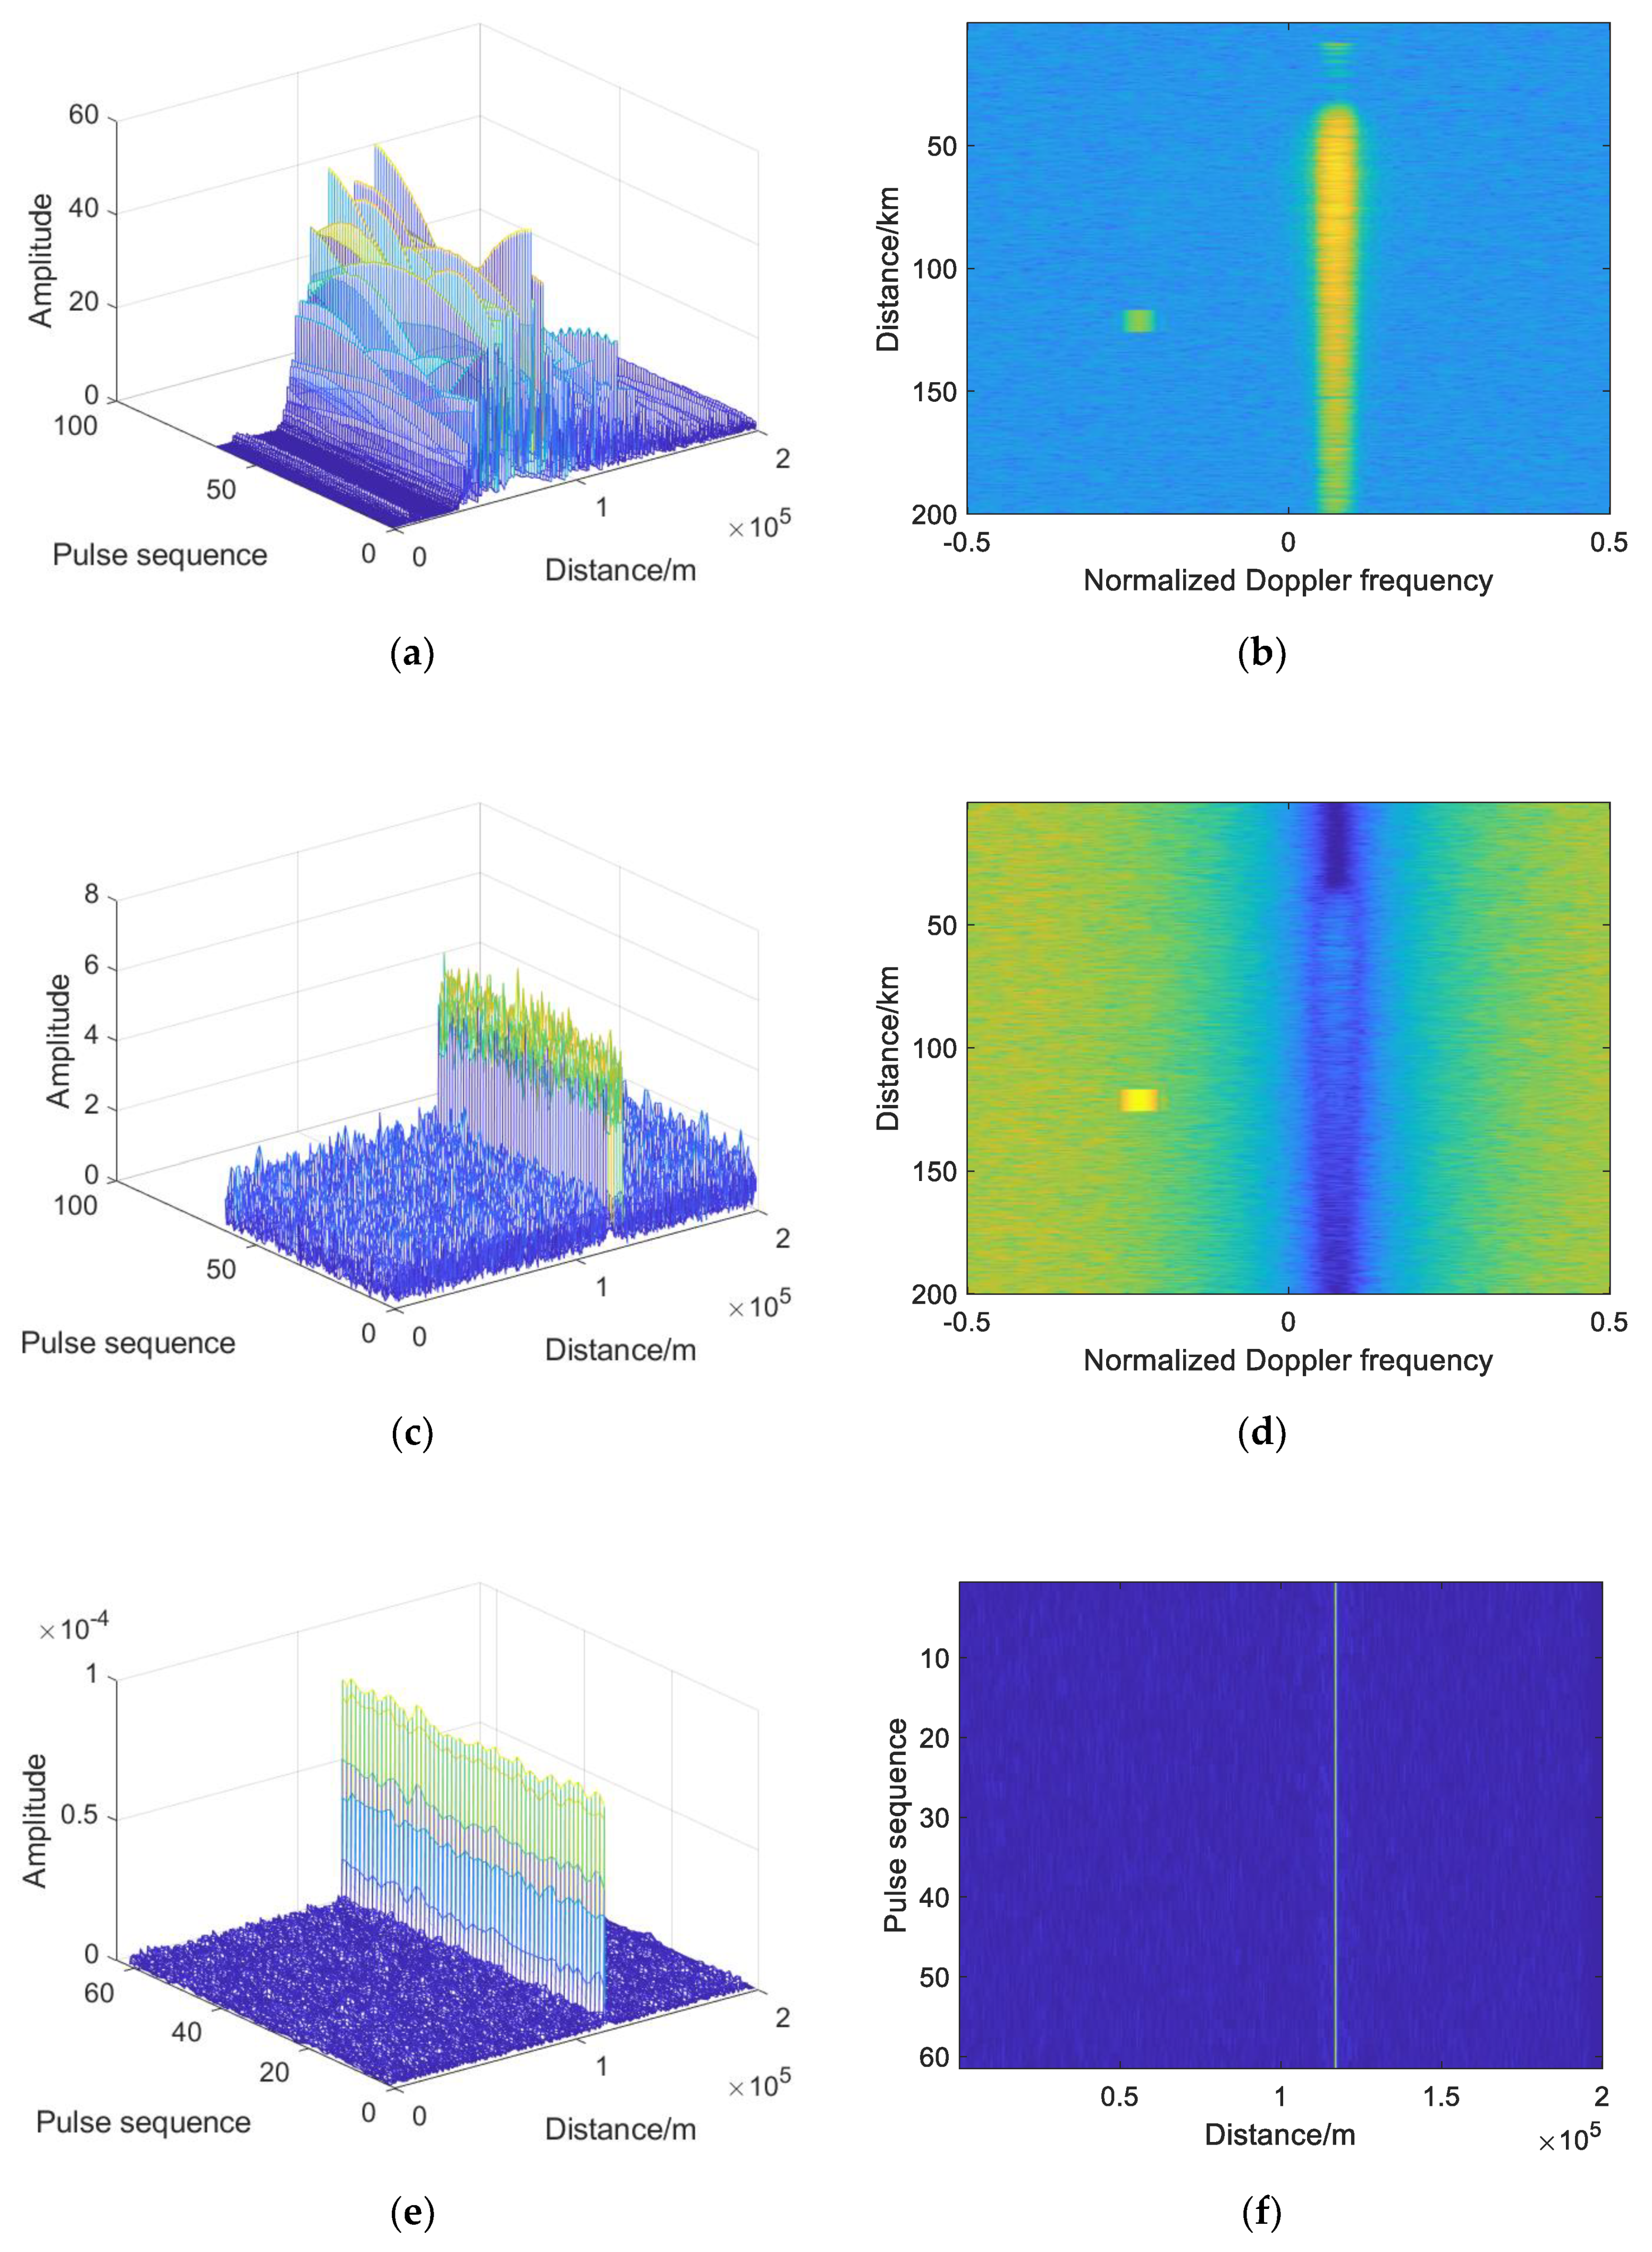
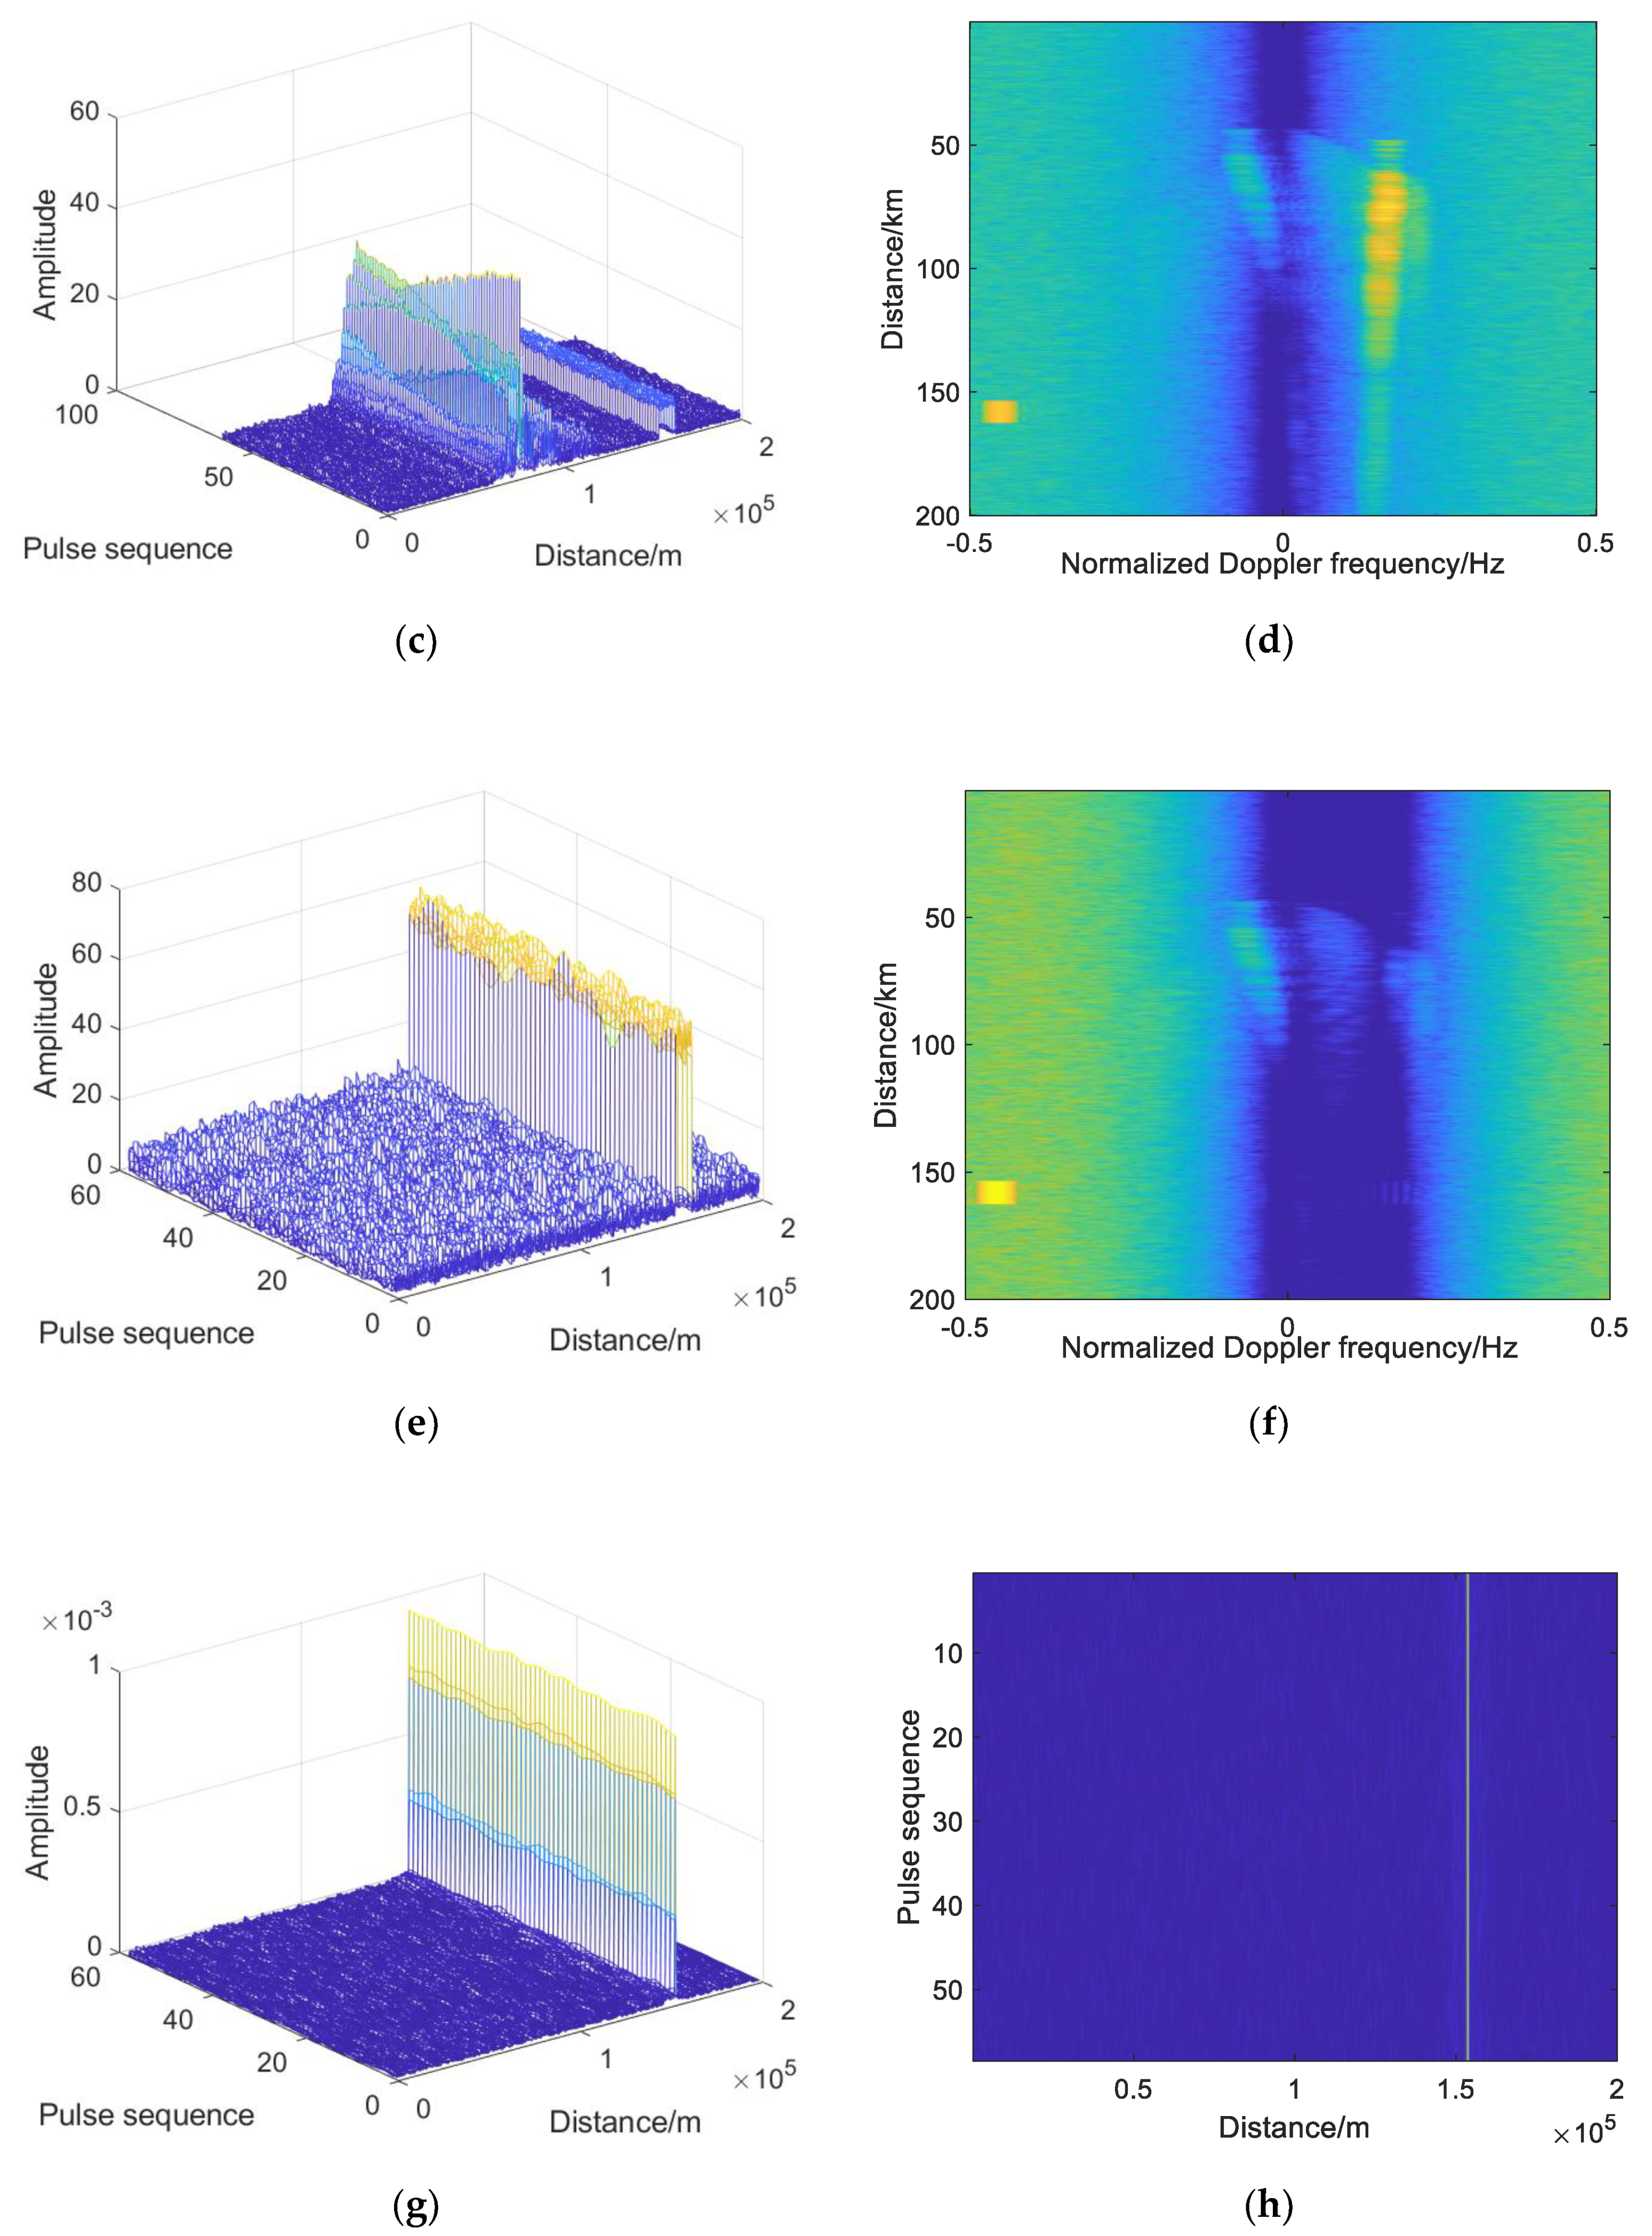
3.2. Direct Wave Suppression
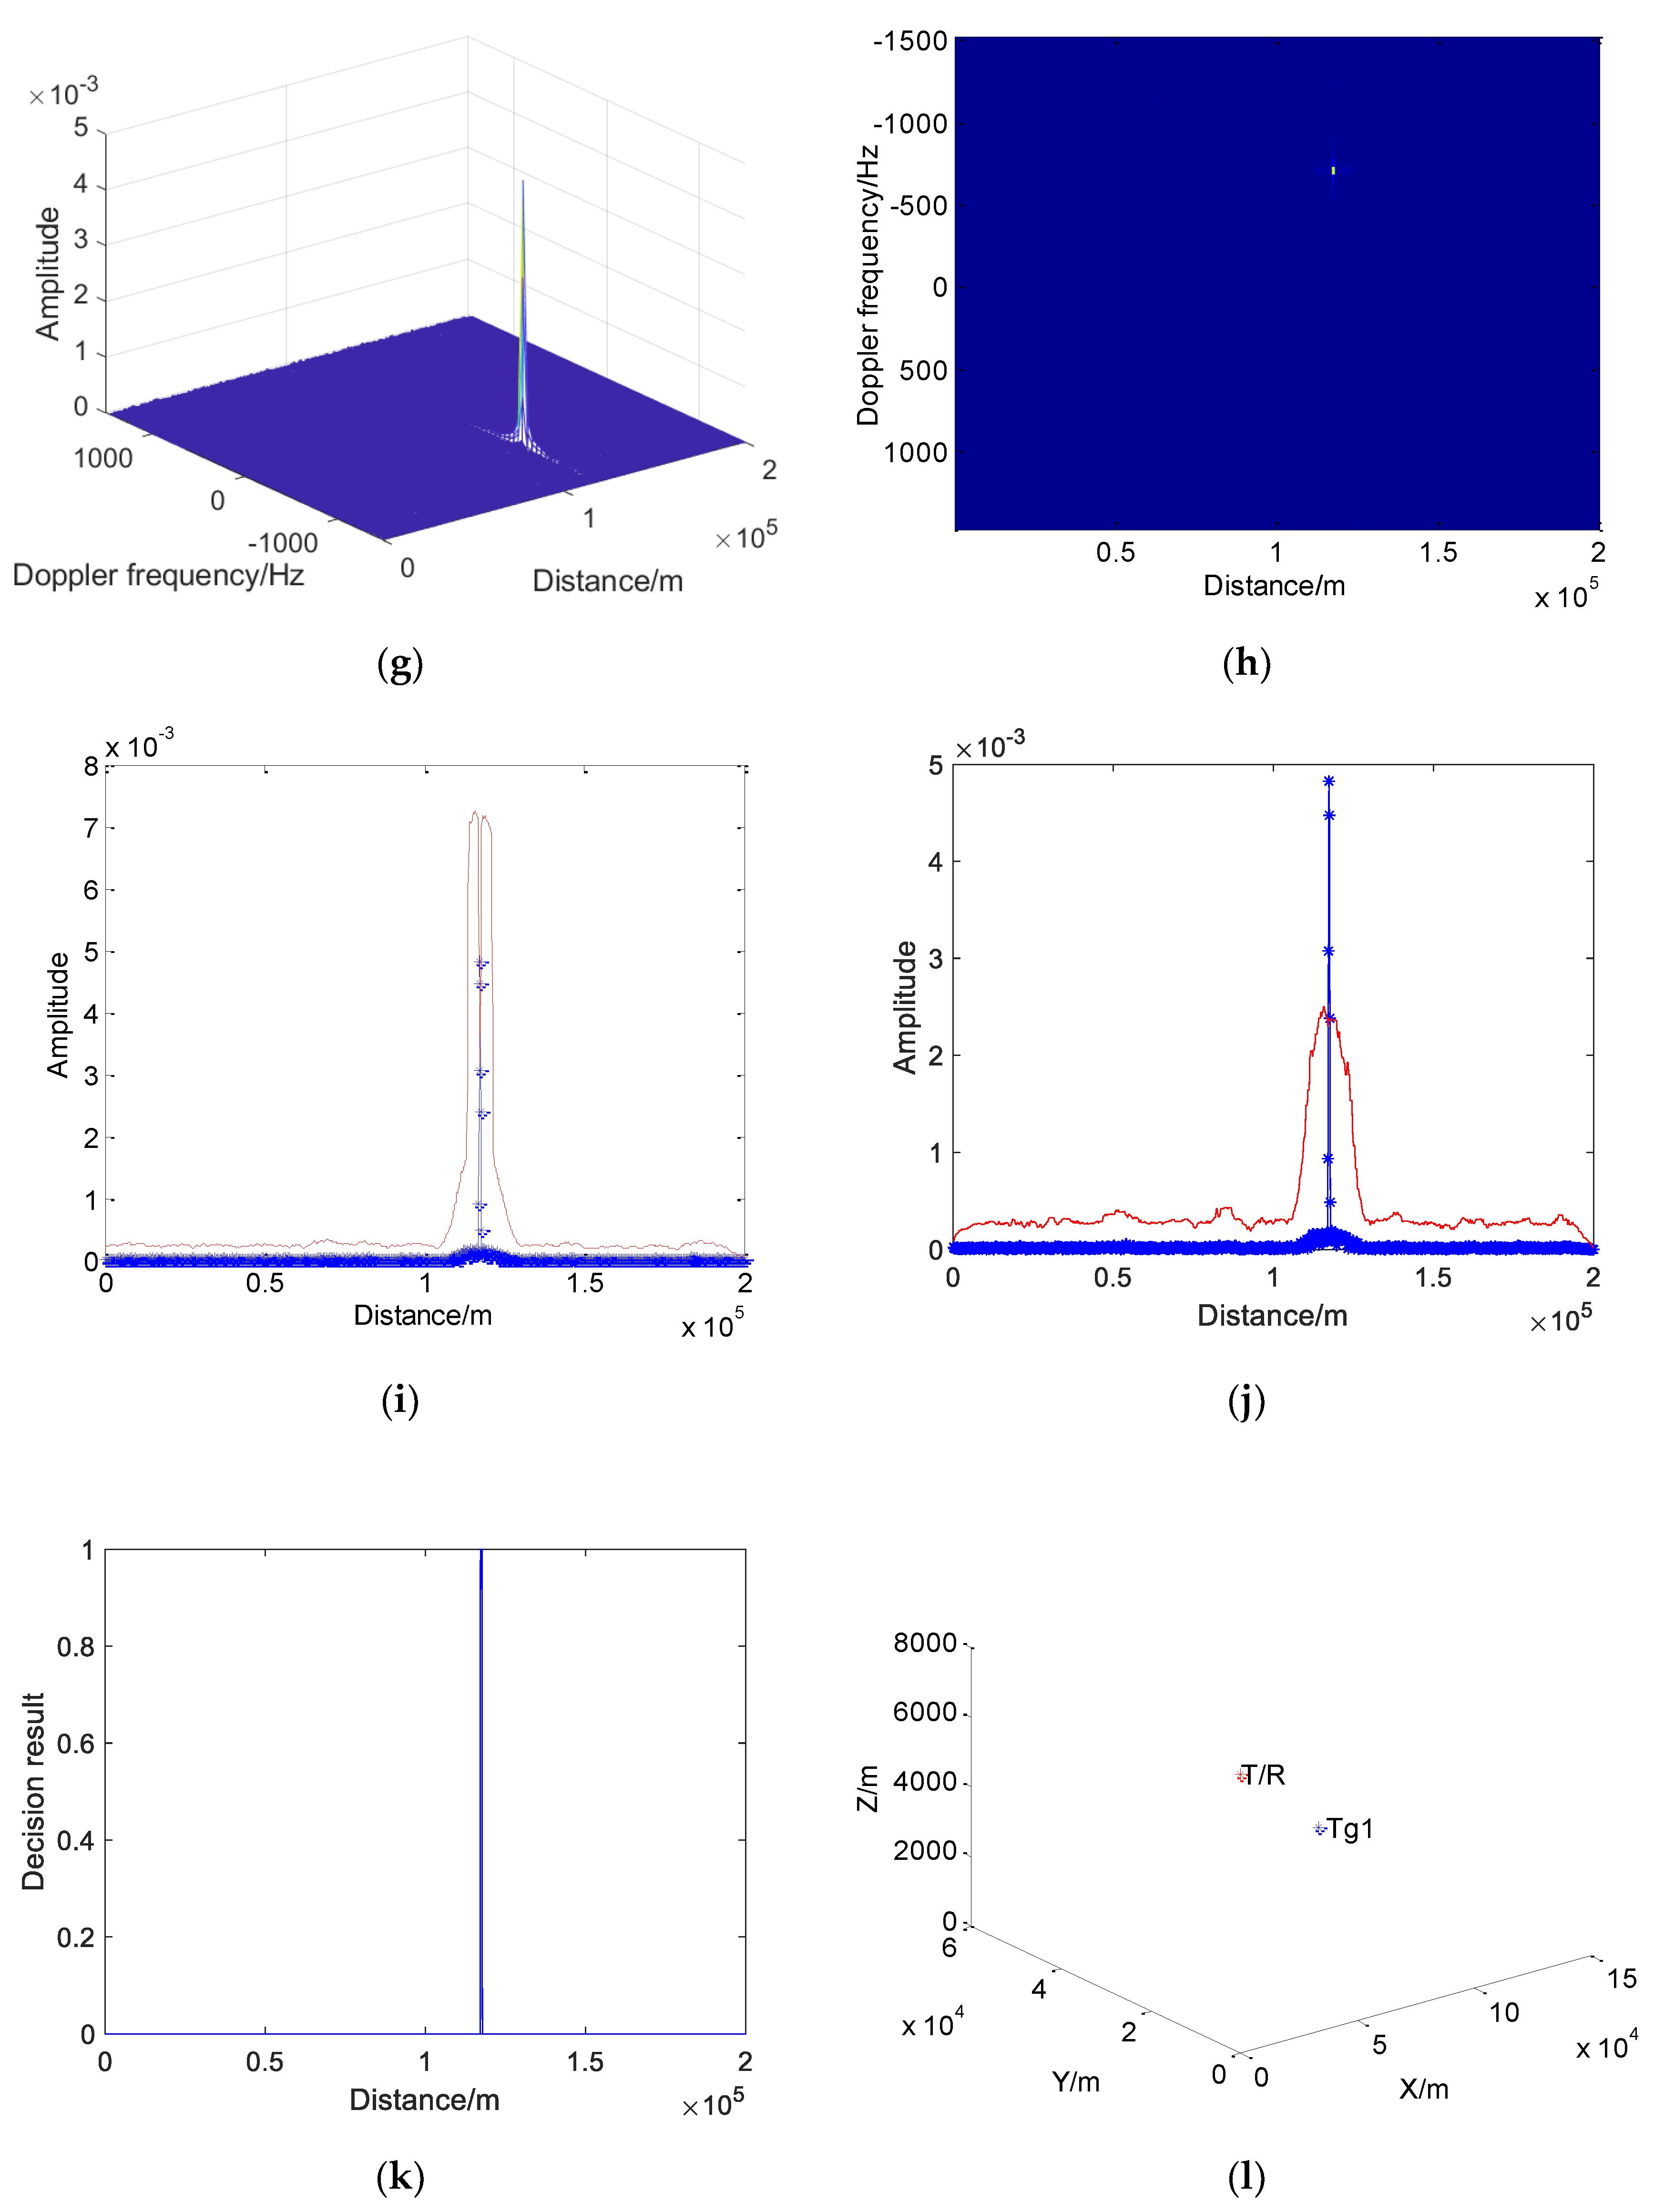
3.3. CFAR Detection
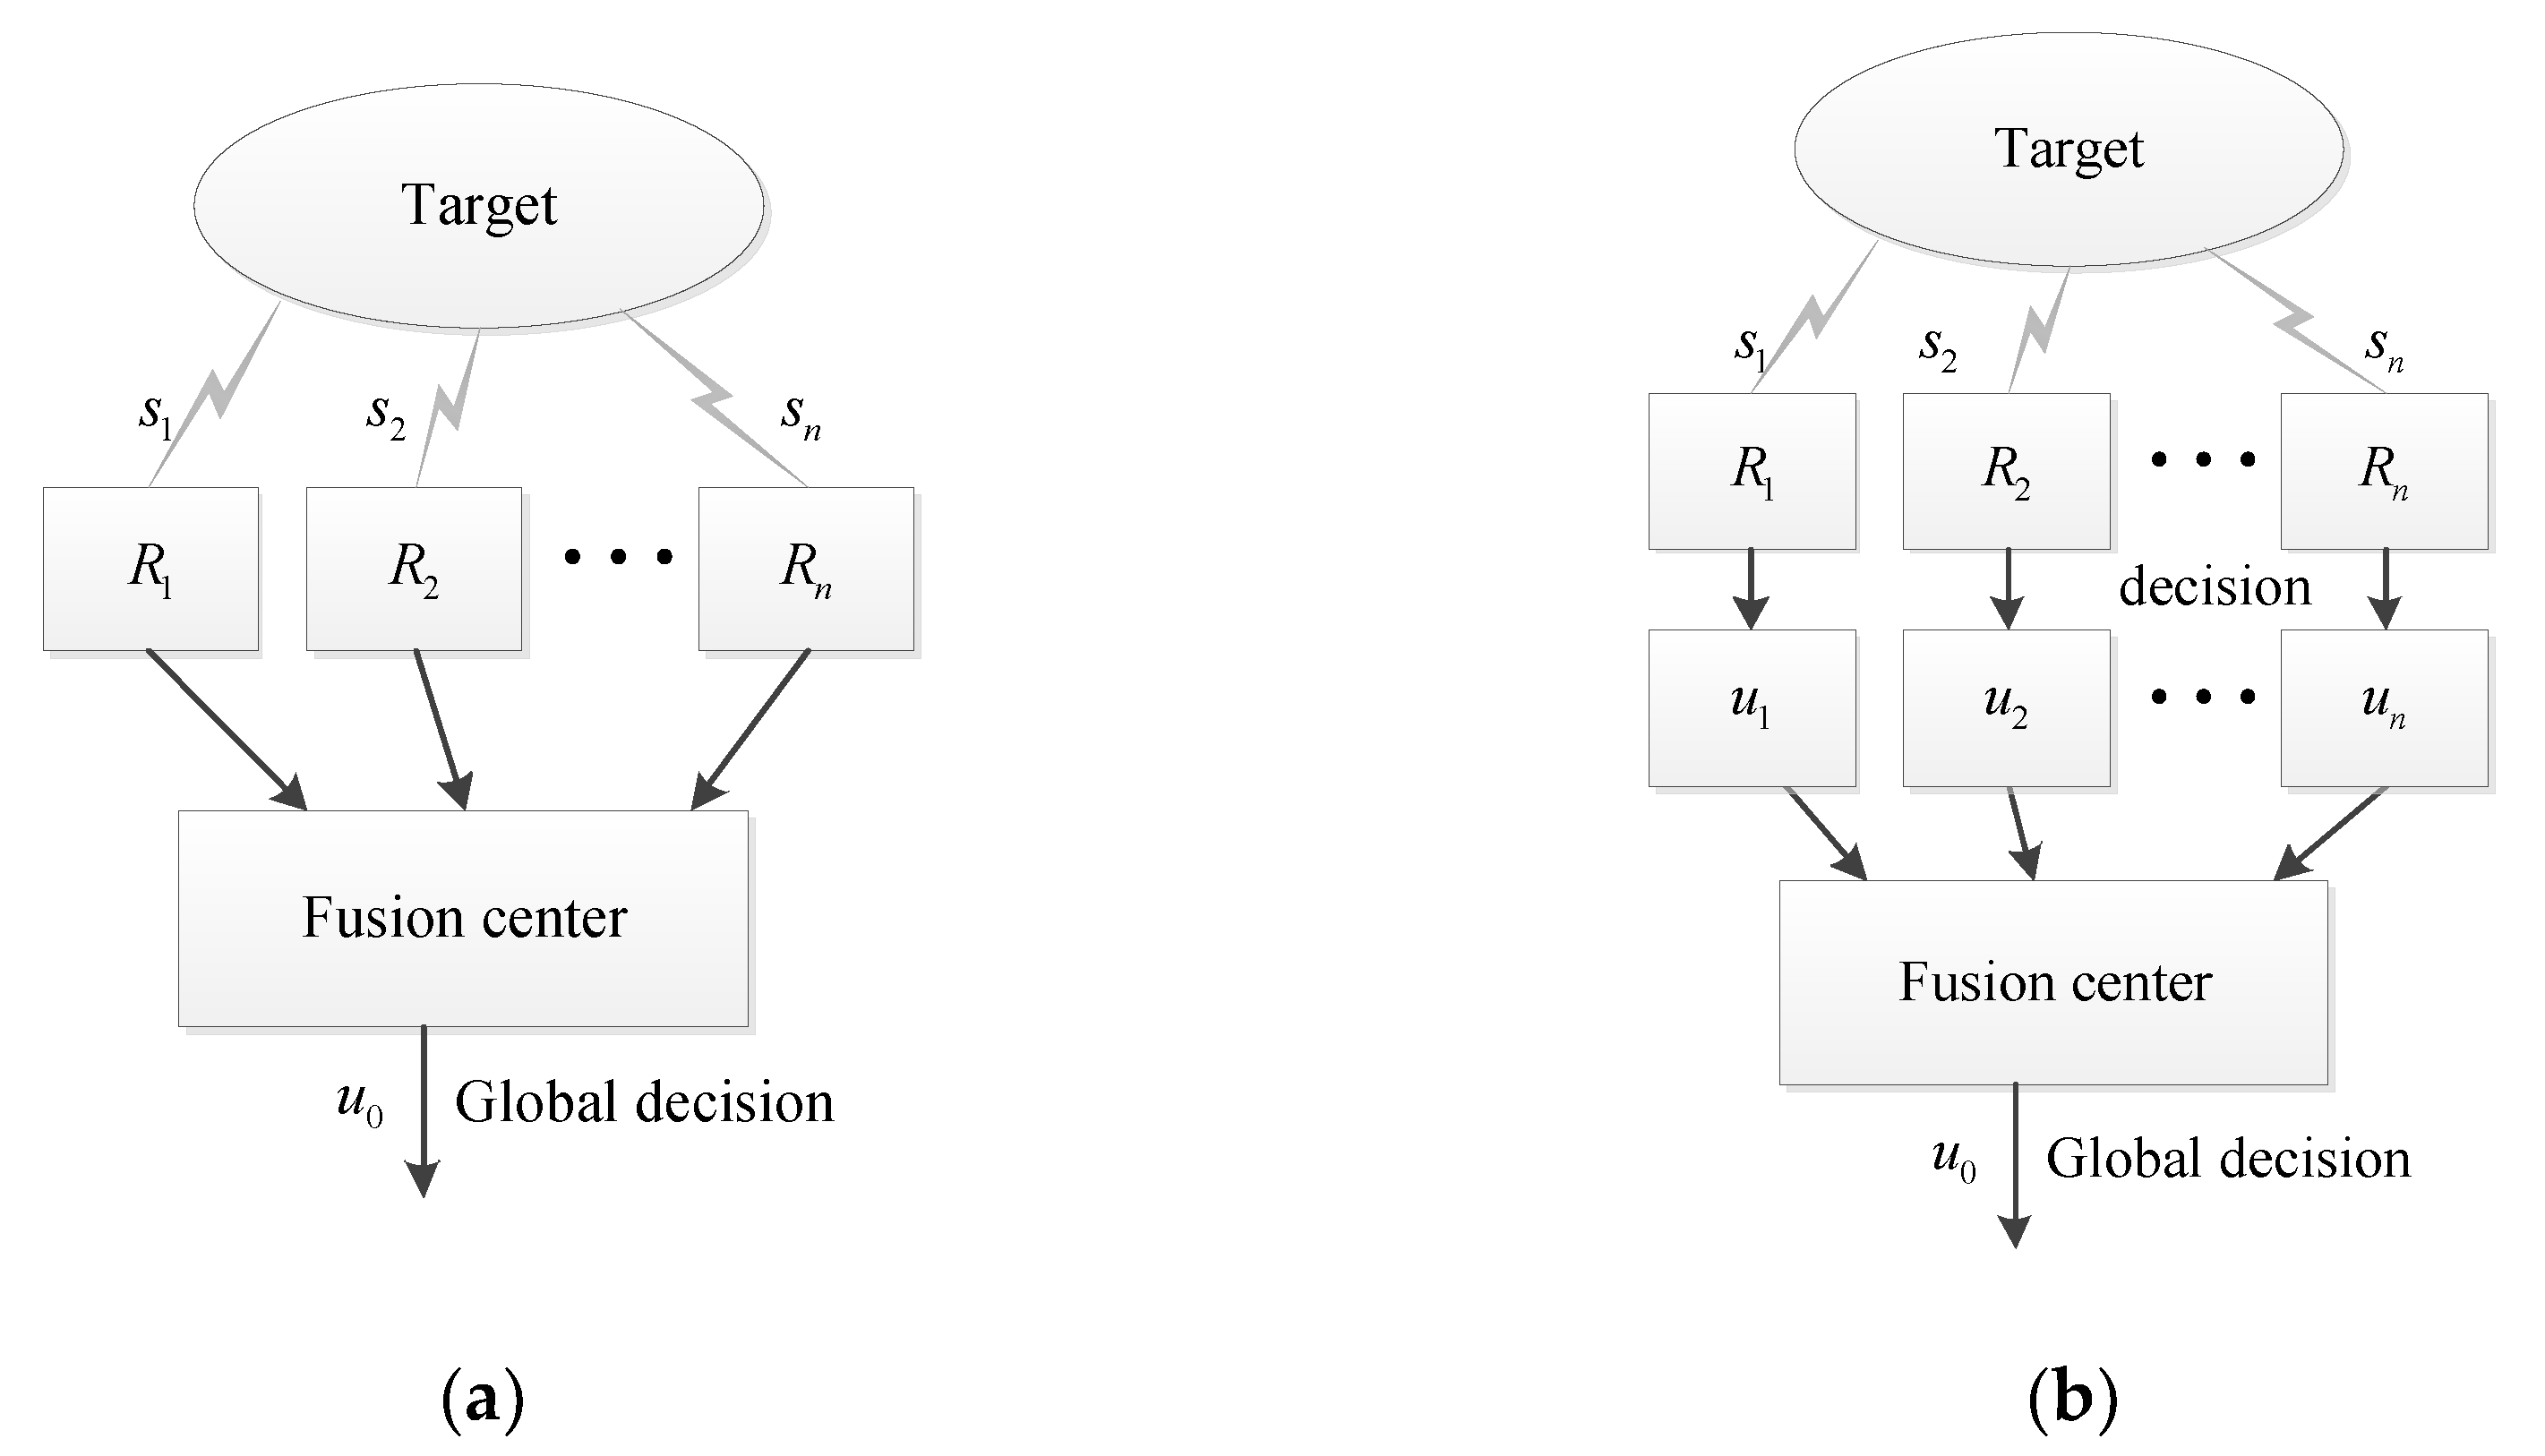
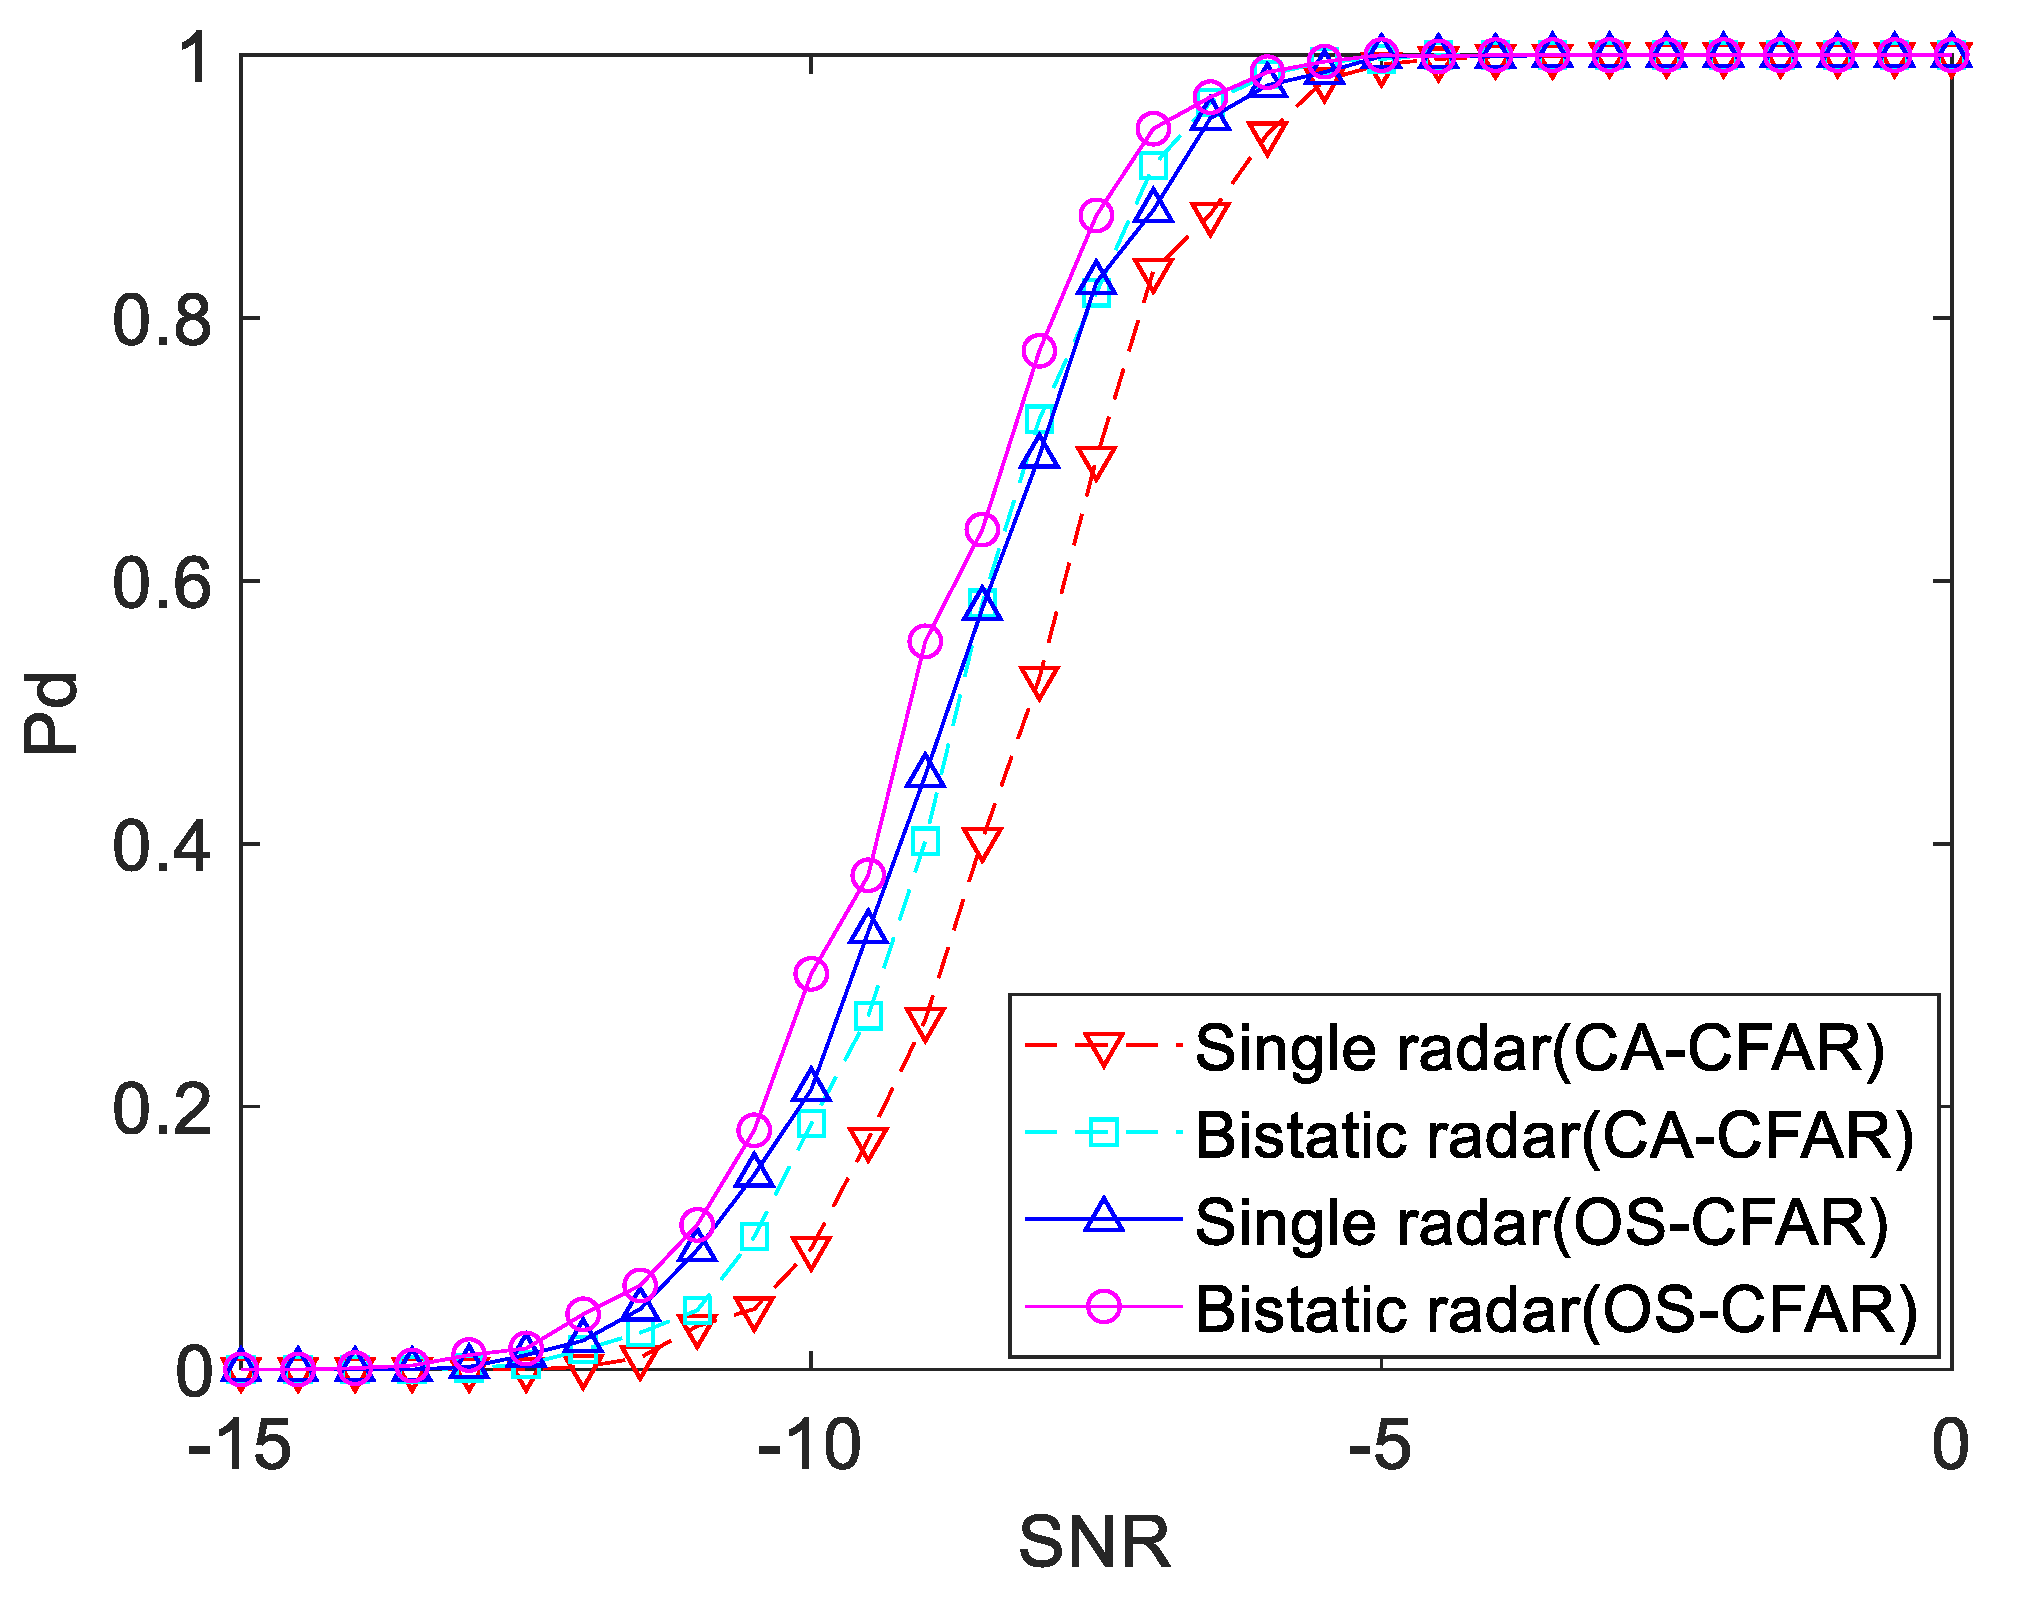
3.4. Fusion Detection Probability
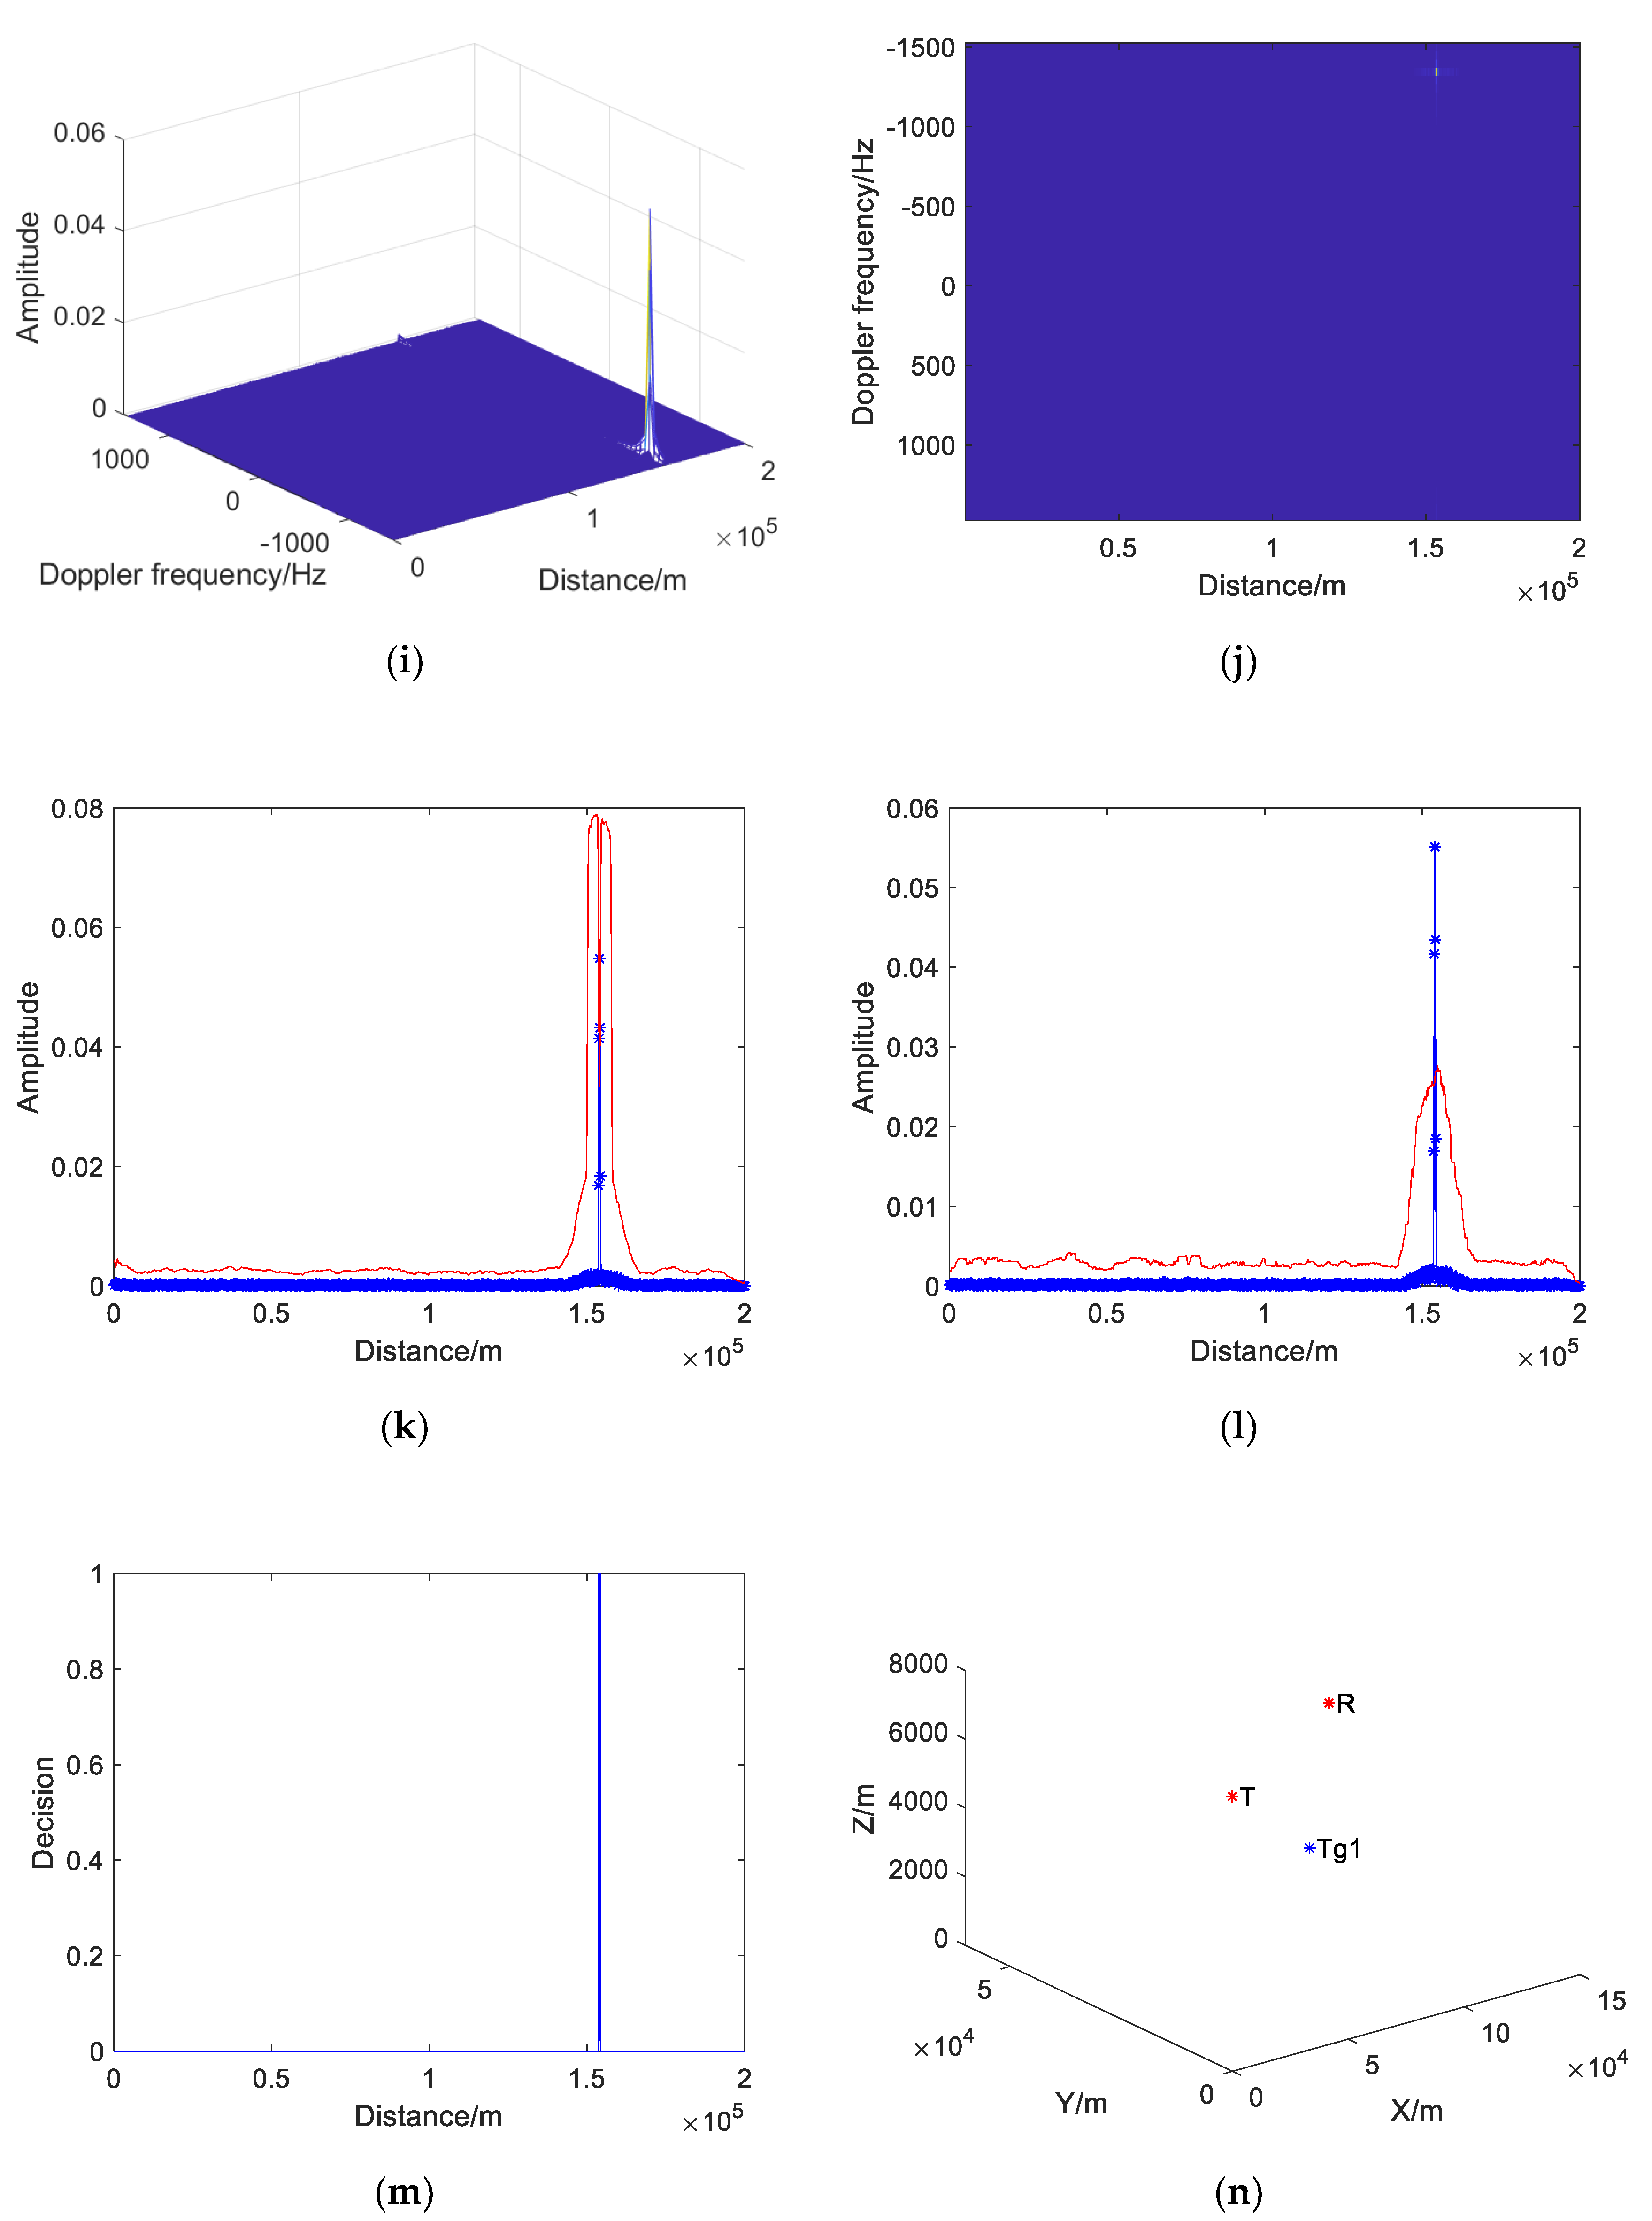
3.5. Estimation of Target Position Parameters
4. Simulation Analysis of Target Cooperative Detection
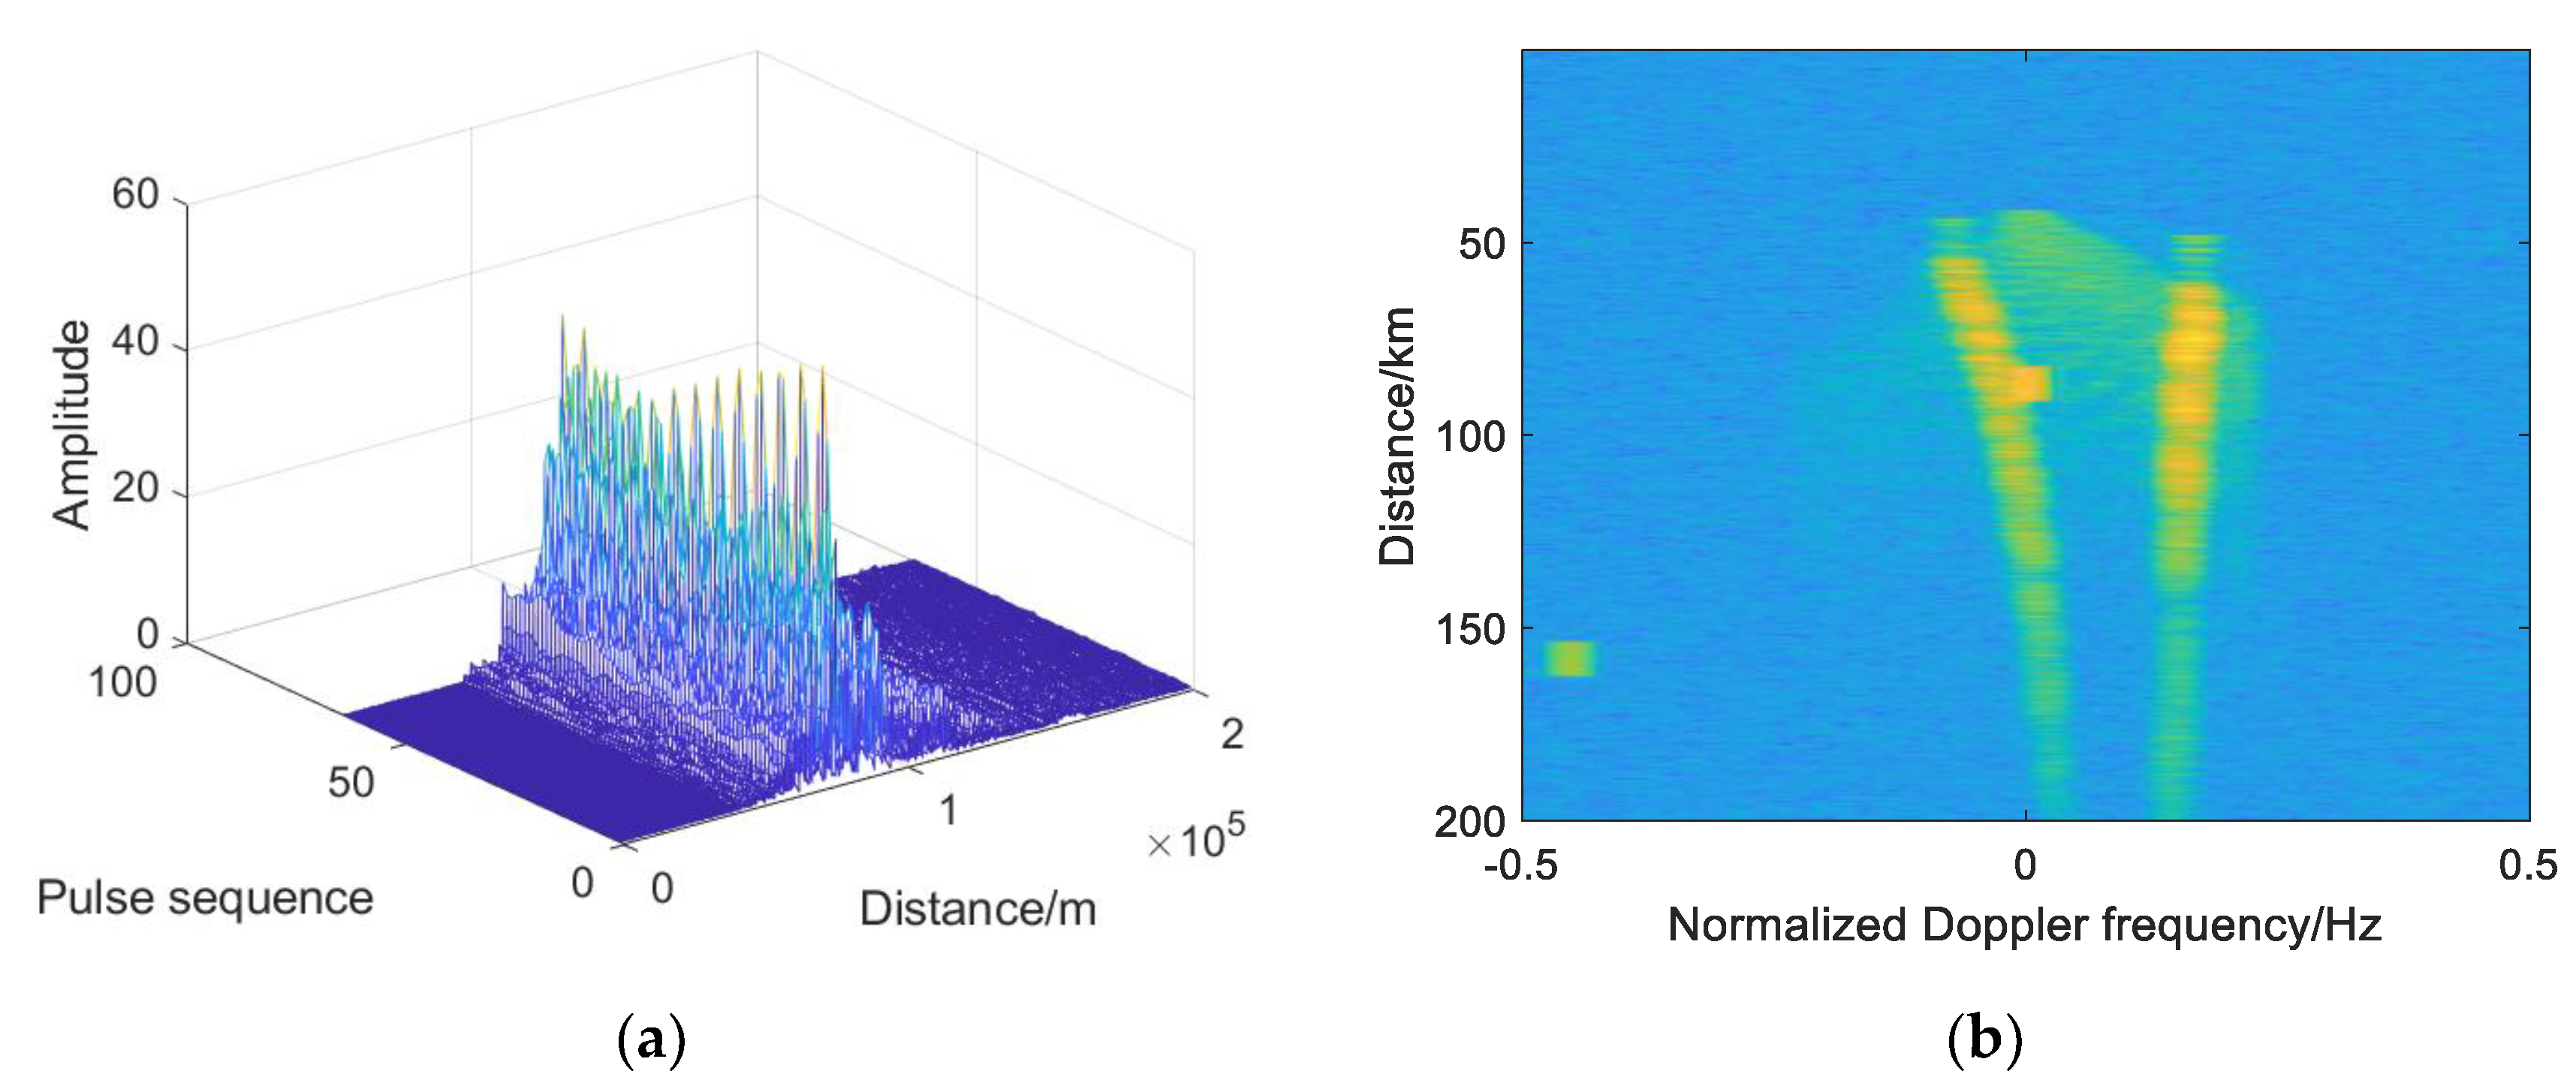
4.1. Analysis of Simulation Results of Single-Base Echo
4.2. Analysis of Simulation Results of Double-Base Echo
4.3. Simulation Analysis of CFAR Detection
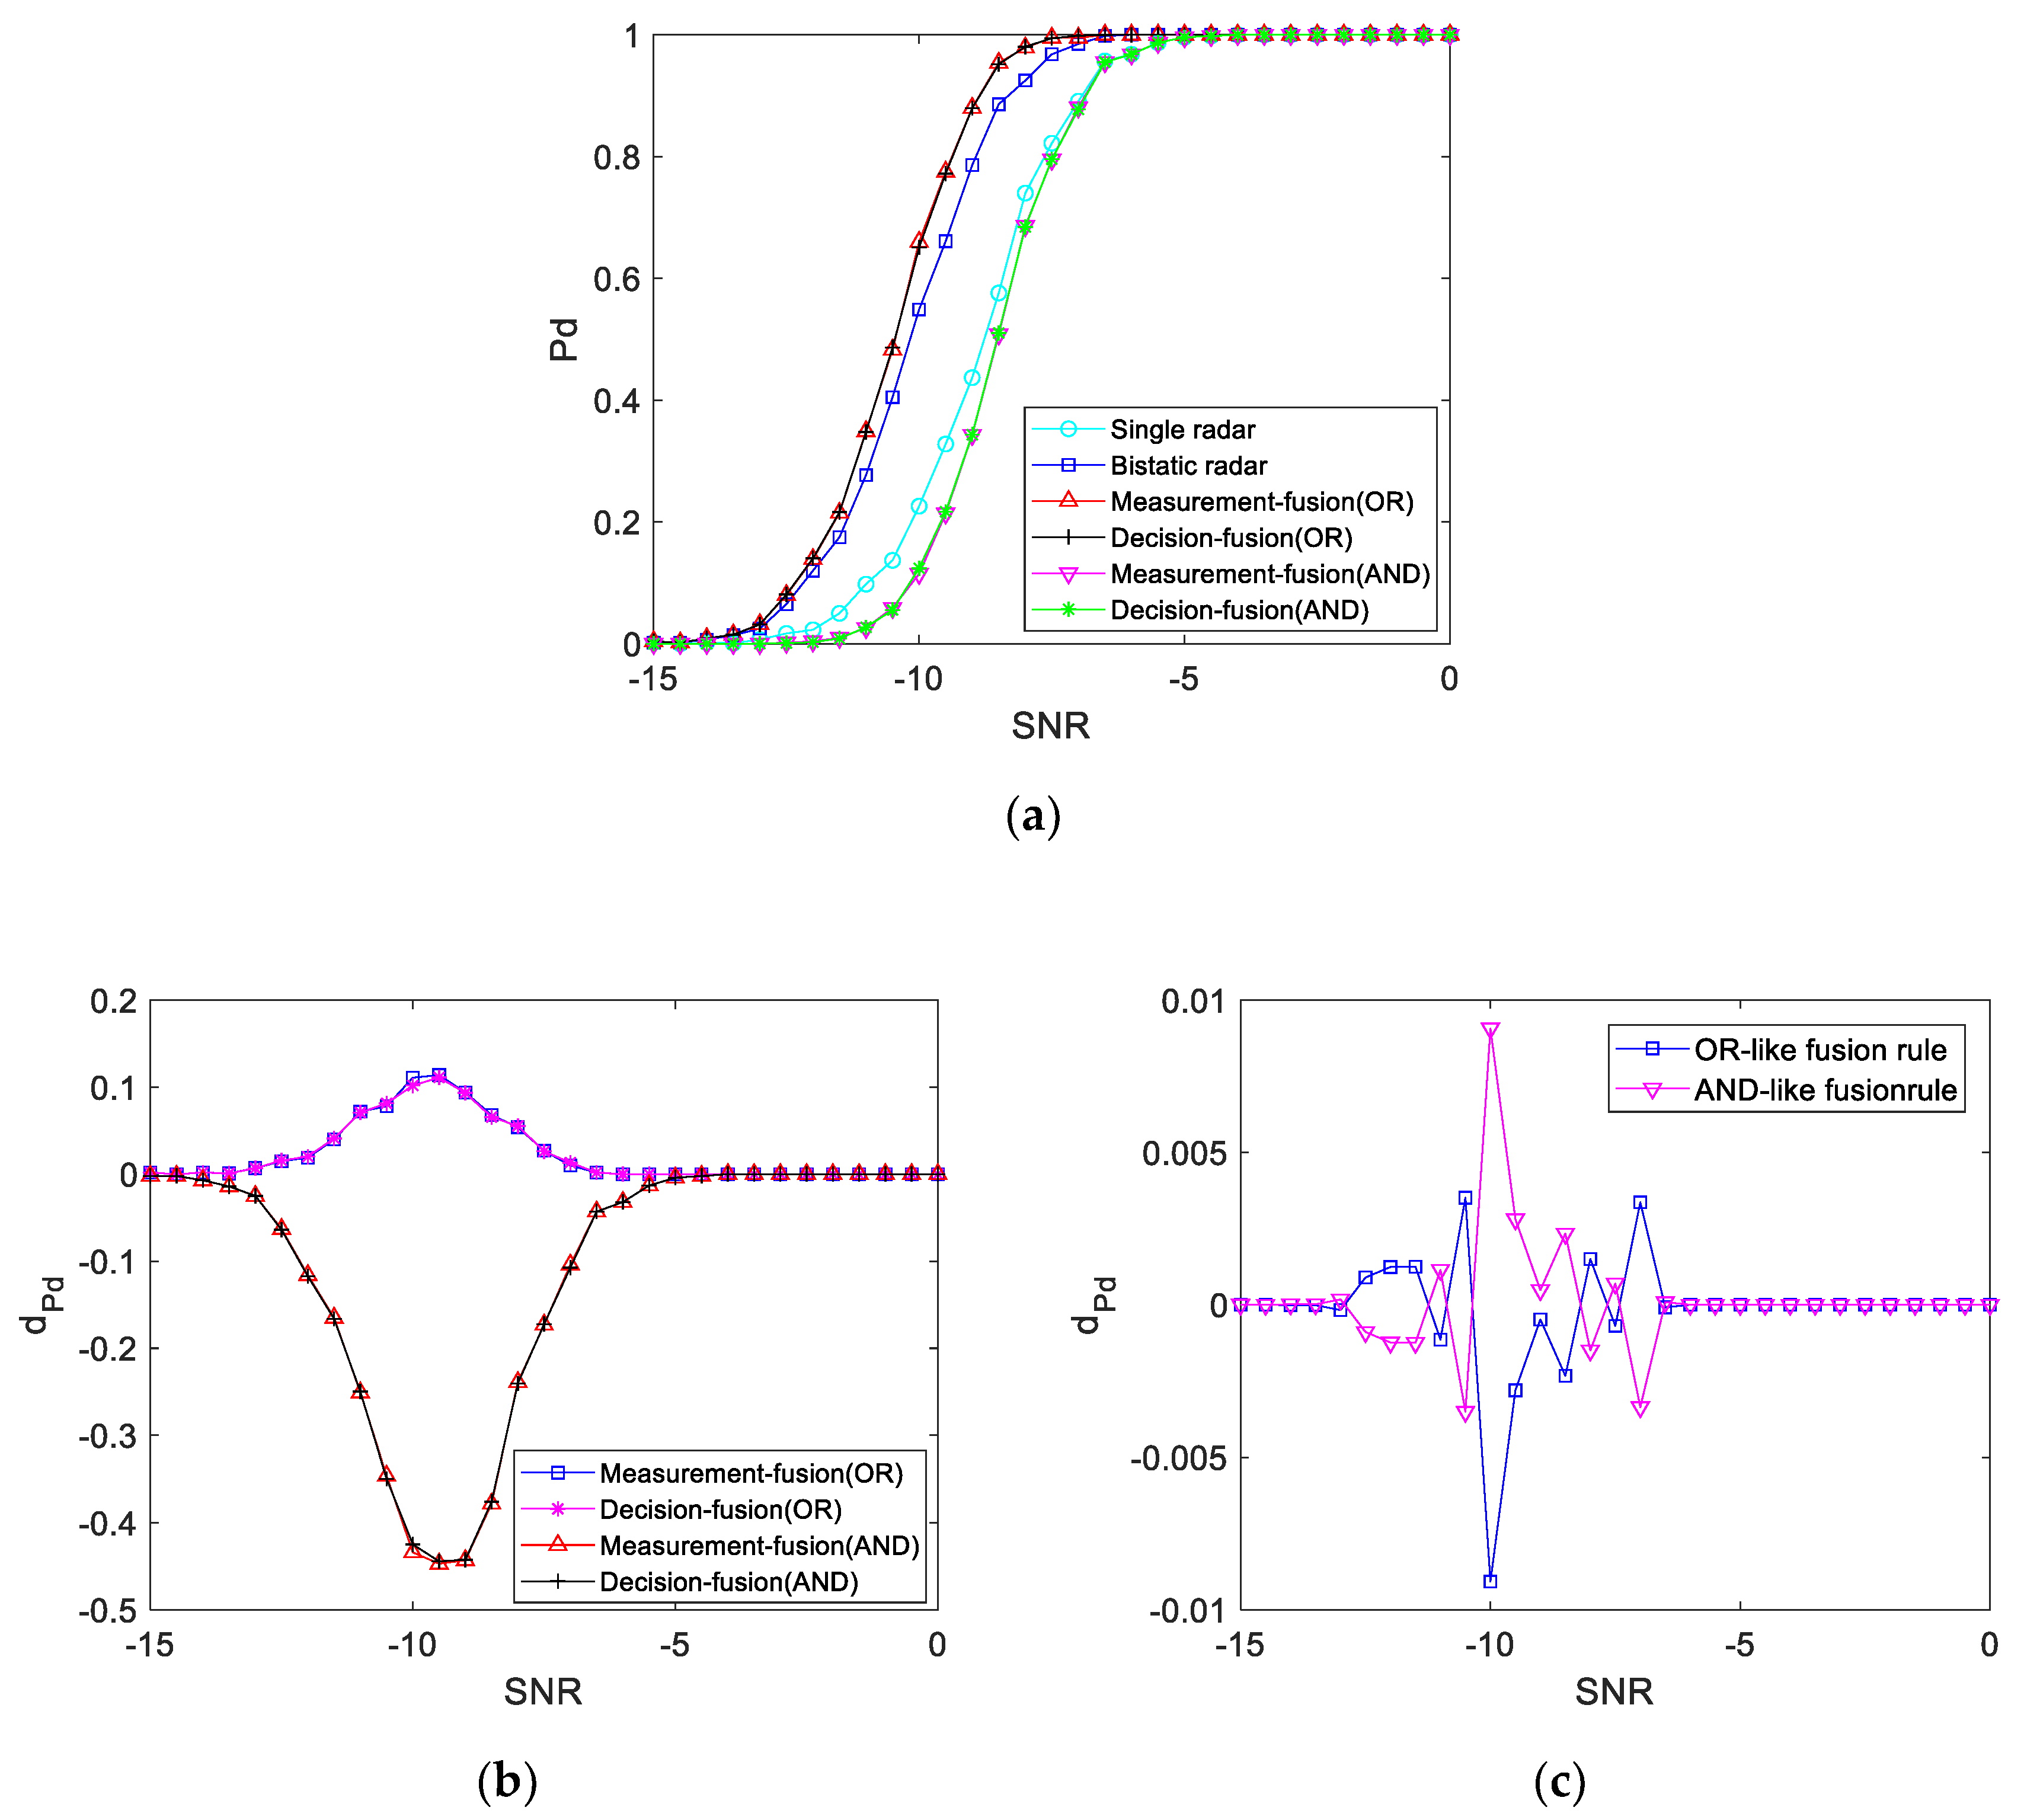
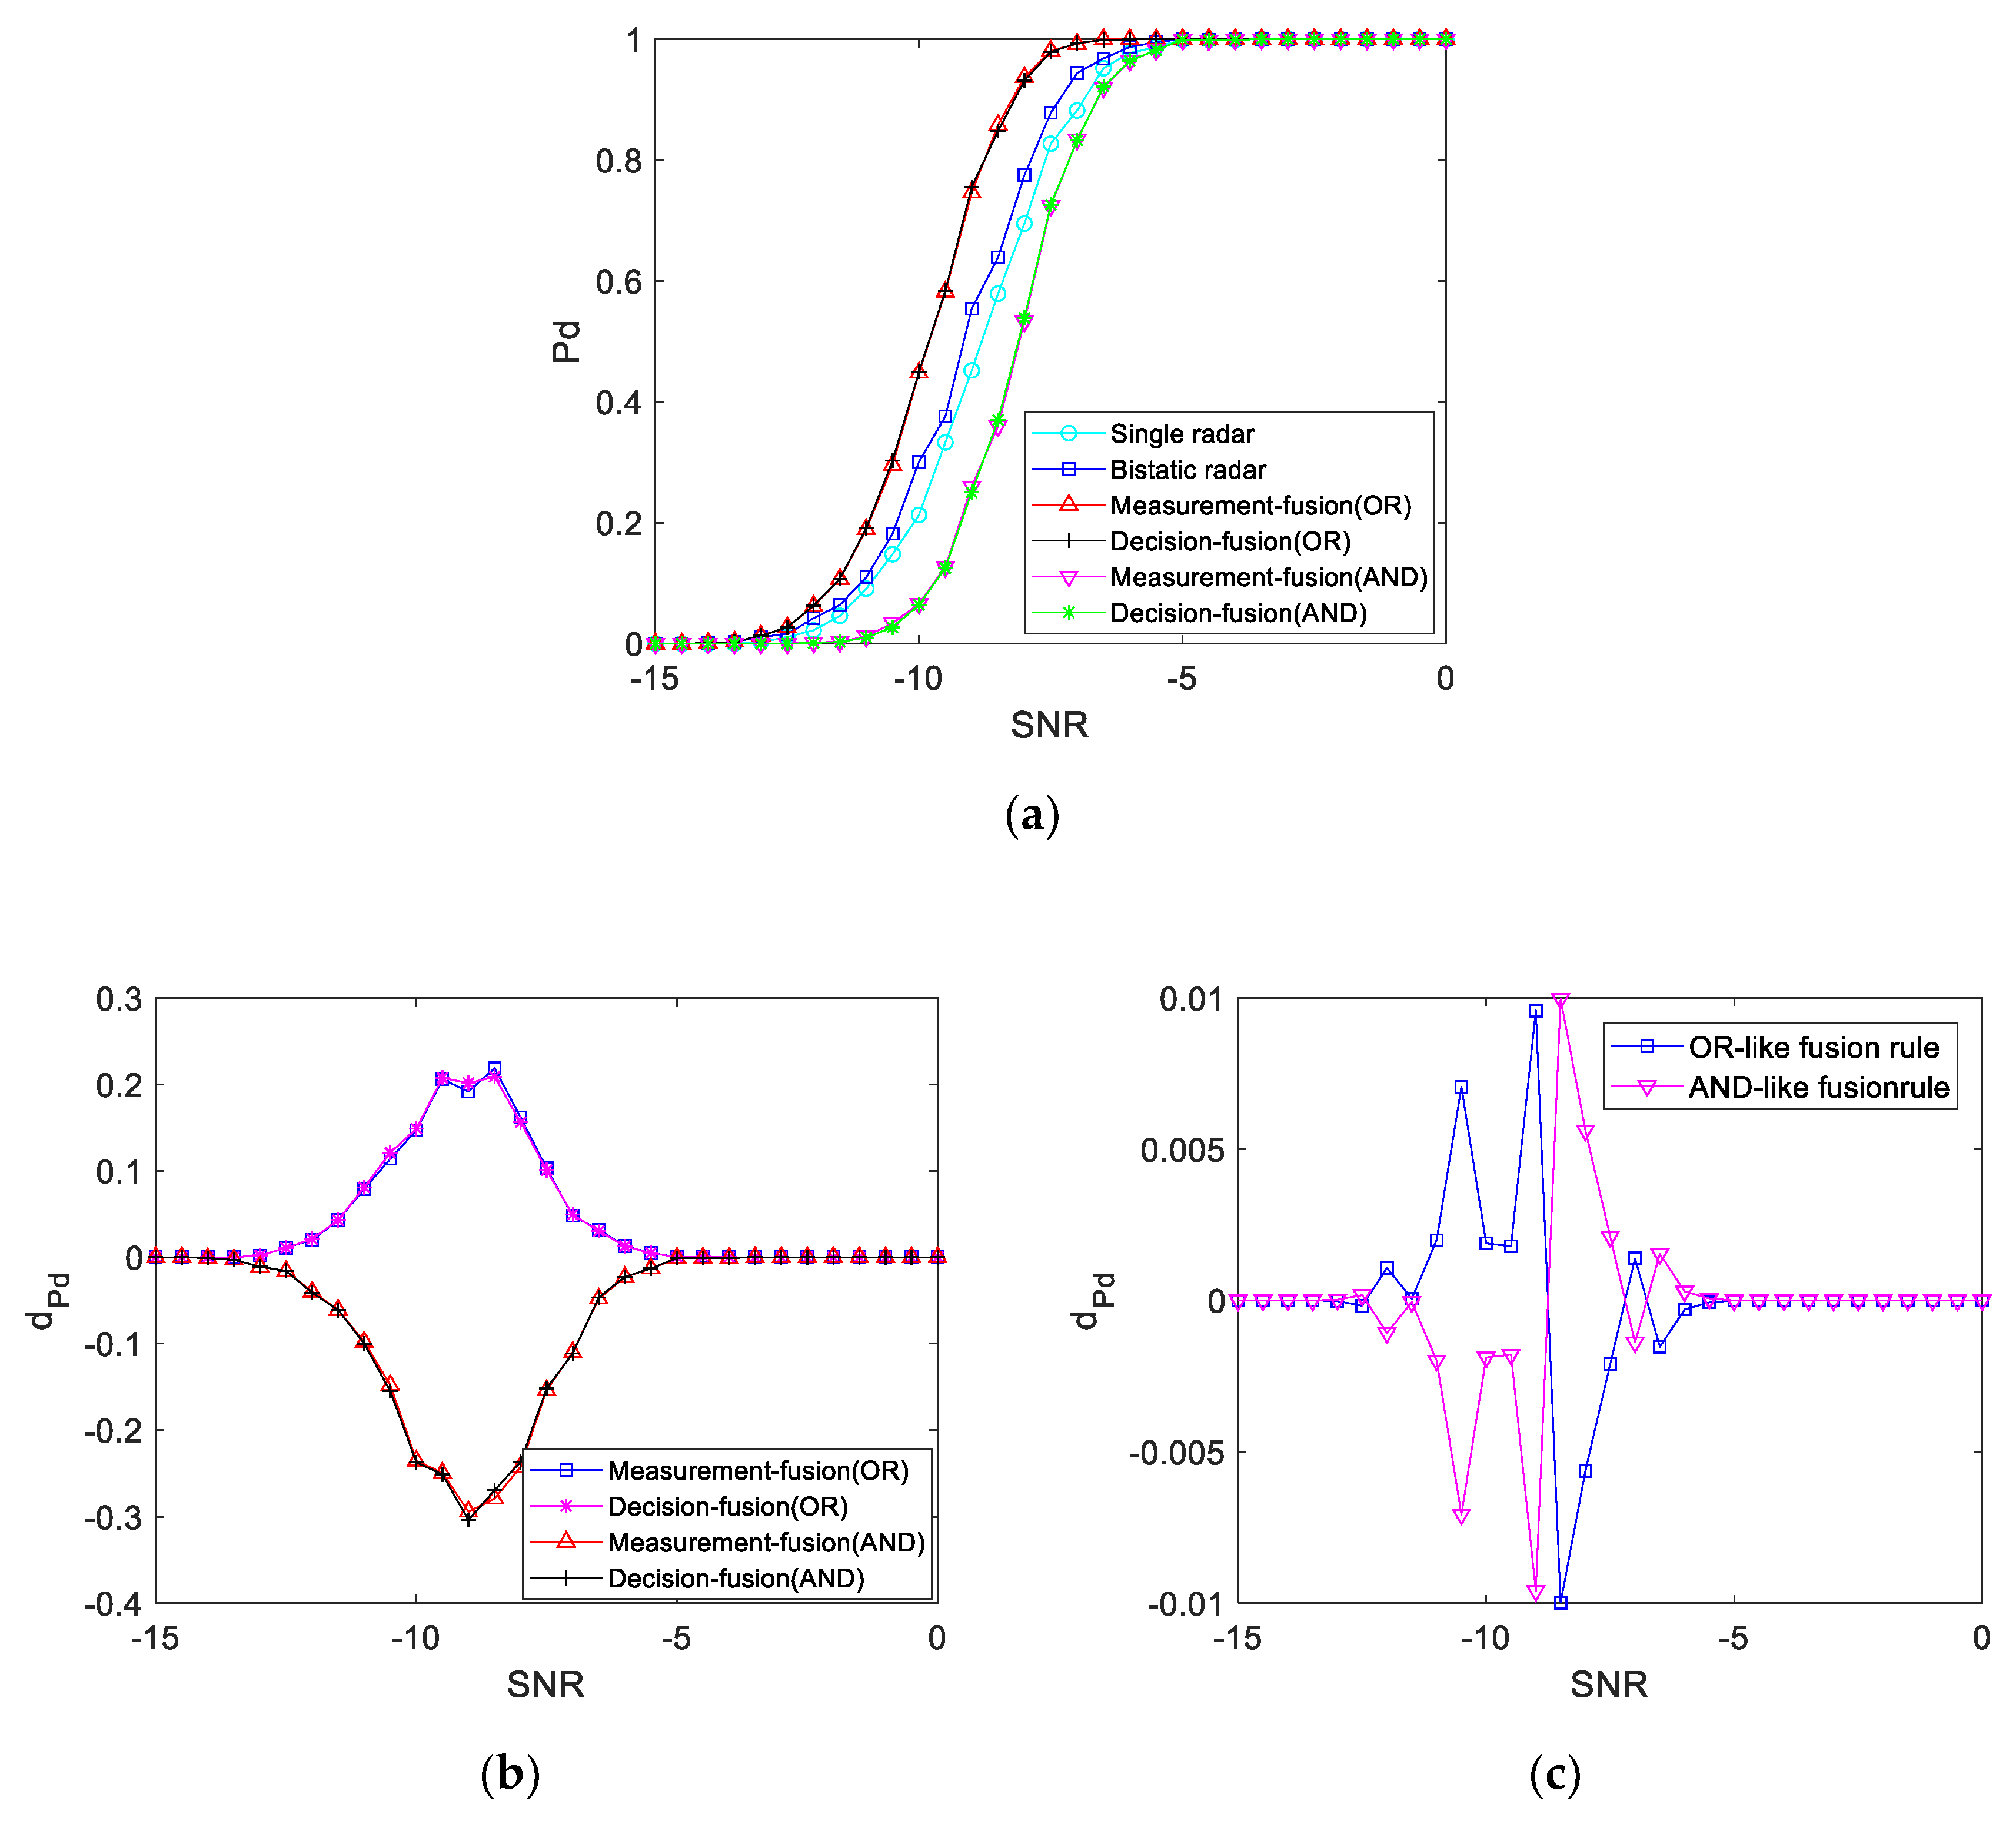
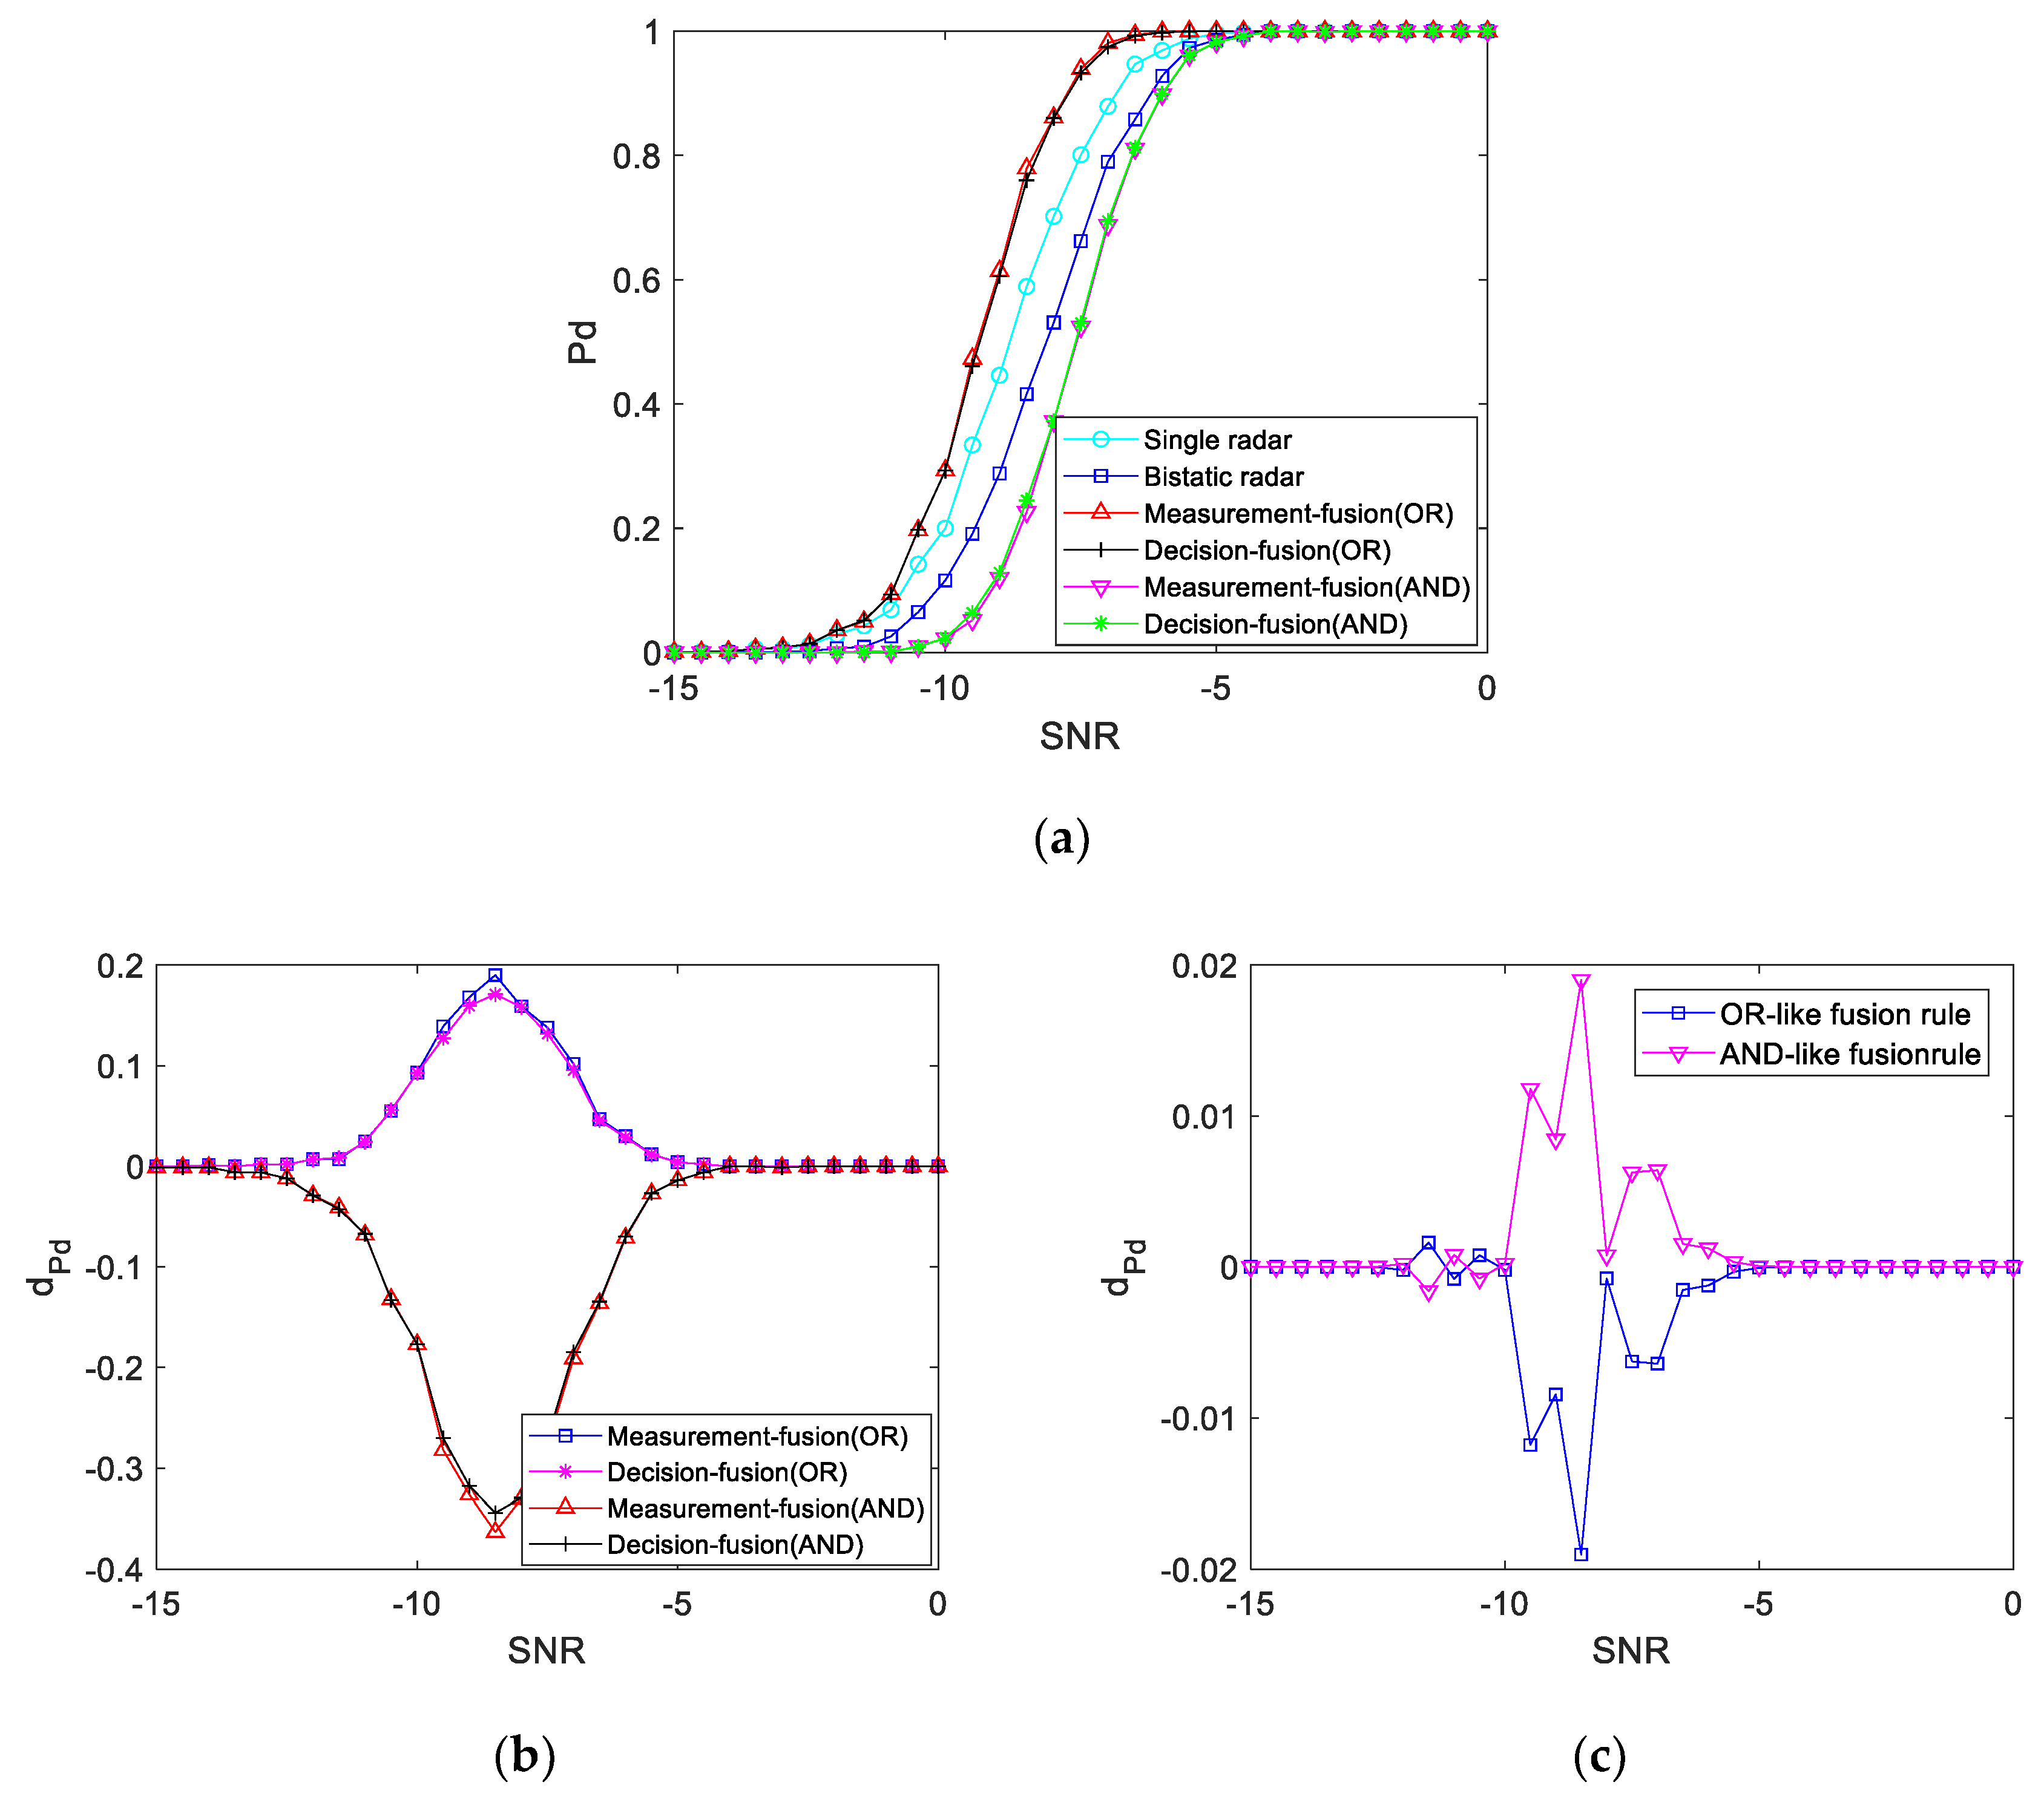
4.4. Simulation Analysis of Fusion Detection
4.4.1.
4.4.2.
4.4.3.
5. Conclusions
Author Contributions
Funding
Acknowledgments
Conflicts of Interest
References
- Gelli, S.; Bacci, A.; Martorella, M.; Berizzi, F. Clutter suppression and high resolution imaging of non-cooperative ground targets for bistatic airborne radar. IEEE Trans. Aerosp. Electron. Syst. 2018, 2, 932–949. [Google Scholar] [CrossRef]
- Pan, X.R.; Yang, F.; Gao, L.R.; Chen, Z.C.; Zhang, B.; Fan, H.R.; Ren, J.C. Building extraction from high-resolution aerial imagery using a generative adversarial network with spatial and channel attention mechanisms. Remote Sens. 2019, 11, 917. [Google Scholar] [CrossRef]
- Wang, H.J.; Zhou, C.; Zhang, Y.P.; Zhu, Z.B. Analysis of positioning accuracy of space-based distributed cooperative detection. J. Huazhong Univ. Of Sci. Tech (Natural Science Edition). 2018, 8, 55–59. [Google Scholar]
- Hu, L.P.; Liang, X.L.; Zhang, J.Q.; Zhu, L. Research on Aircraft Swarms Collaborative Detection of the Space Enemy Stealthy Target. Comput. Simul. 2017, 5, 53–57. [Google Scholar]
- He, Z.; Liu, H.; Wang, Y.W.; Hu, J. Generative adversarial networks-based semi-supervised learning for hyperspectral image classification. Remote Sens. 2017, 9, 1042. [Google Scholar] [CrossRef]
- Ji, C.X.; Shen, M.W.; Liang, C.; Wu, D.; Zhu, D. An improved OMP application for airborne radar space-time clutter spectrum estimation. In Proceedings of the 12th International Conference on Intelligent Systems and Knowledge Engineering (ISKE), Nanjing, China, 24–26 November 2017. [Google Scholar]
- Sun, G.H.; He, Z.S.; Tong, J.; Zhang, X.J. Knowledge-Aided covariance matrix estimation via kronecker product expansions for airborne STAP. IEEE Geosci. Remote Sens. Lett. 2018, 4, 527–531. [Google Scholar] [CrossRef]
- Zhao, F.X.; Liu, Y.X.; Huo, K.; Zhang, S.H.; Zhang, Z.S. Radar HRRP target recognition based on stacked autoencoder and extreme learning machine. Sensors 2018, 18, 173. [Google Scholar] [CrossRef]
- Fu, k.; Dai, W.; Zhang, Y.; Wang, Z.R.; Yan, M.L.; Sun, X. Multiple class activation mapping for aircraft recognition in remote sensing images. Remote Sens. 2019, 11, 544. [Google Scholar] [CrossRef]
- Bai, G.T.; Tao, R.; Zhao, J.; Bai, X.; Wang, Y. Fast FOCUSS method based on bi-conjugate gradient and its application to space-time clutter spectrum estimation. Sci. China (Inf. Sci.). 2017, 8, 163–175. [Google Scholar] [CrossRef]
- Wang, H.J.; Huang, X.; Zhang, Y.P.; Zhu, Z.B. Positioning accuracy analysis of multistatic radar in jamming background. In Proceedings of the 3rd International Conference on Mechanical, Control and Computer Engineering, Huhhot, China, 14–16 September 2018. [Google Scholar]
- Jiang, Y.; Li, Y.; Cai, J.J.; Wang, Y.H.; Xu, J. Robust automatic target recognition via HRRP sequence based on scatter matching. Sensors 2018, 18, 593. [Google Scholar] [CrossRef]
- Karine, A.; Toumi, A.; Khenchaf, A.; EI Hassouni, M. Radar target recognition using salient keypoint descriptors and multitask sparse representation. Remote Sens. 2018, 10, 843. [Google Scholar] [CrossRef]
- Martorella, M.; Berizzi, F.; Bacci, A.; Gelli, S. Joint physical and virtual STAP for strong ground clutter suppression and imaging. In Proceedings of the IEEE Radar Conference, Oklahoma City, OK, USA, 23–27 April 2018. [Google Scholar]
- Wu, H.; Wang, Y.L. Modeling and analysis of the ground clutter spectrum on bistatic airborne early warning radar. Acta Electron. Sin. 2006, 12, 2209–2213. [Google Scholar]
- Wei, M.; Li, X.B.; Huang, Z.R. A compensation method for clutter range-dependence of airborne bistatic radar. J. Signal Process. 2017, 1, 18–24. [Google Scholar]
- Yang, Y.H.; Zhu, H.; Li, S.M. Clutter properties analysis and suppression methods of high-speed airborne radar. Mod. Radar. 2018, 3, 23–26. [Google Scholar]
- Chen, D.F.; Chen, B.X.; Liu, C.B.; Zhang, S.H. Subspace-Projection based direct-path-interference suppression in bistatic GWOTHR. J. Electron. Inf. Technol. 2008, 11, 2702–2705. [Google Scholar] [CrossRef]
- Xu, J.F.; Han, S.P.; Yang, G. A high resolution algorithm of wideband direct wave suppression for bistatic sonar. Tech. Acoust. 2017, 5, 415–416. [Google Scholar]
- Li, G.J.; Tang, X.M.; Zhang, C.S. Research on Direct Signal Cancellation Algorithm of Passive Bistatic Radar. Fire Control Command Control. 2012, 1, 32–35. [Google Scholar]
- Ciuonzo, D. On time-reversal imaging by statistical testing. IEEE Signal Process Lett. 2017, 7, 1024–1028. [Google Scholar] [CrossRef]
- Devaney, A.J. Time reversal imaging of obscured targets from multistatic data. IEEE Trans. Antennas Propag. 2005, 5, 1600–1610. [Google Scholar] [CrossRef]
- Ciuonzo, D.; Romano, G.; Solimene, R. Performance analysis of time-reversal MUSIC. IEEE Trans. Signal Process. 2015, 10, 2650–2662. [Google Scholar] [CrossRef]
- Ciuonzo, D.; Maio, A.D.; Rossi, P.S. A systematic framework for composite hypothesis testing of independent Bernoulli trials. IEEE Signal Process Lett. 2015, 9, 1249–1253. [Google Scholar] [CrossRef]
- Mao, Y.; Shen, J.; Gui, X. A study on deep belief net for branch prediction. IEEE Access. 2018, 6, 10779–10786. [Google Scholar] [CrossRef]
- Wang, H.J.; Tang, Z.Y.; Zhu, Z.B.; Zhang, Y.P. Modeling and characteristic analysis of clutter for airborne bistatic radar in fixed coordinate system. J. Harbin Inst. Technol. 2019, 5, 116–123. [Google Scholar]
- Man, Q.X.; Dong, P.L. Extraction of urban objects in cloud shadows on the basis of fusion of airborne LiDAR and hyperspectral data. Remote Sens. 2019, 11, 713. [Google Scholar] [CrossRef]
- Watkins, D. Fundamentals of Matrix Computation; John Wiley & Sons, Inc.: Hoboken, NJ, USA, 2010; pp. 71–105. [Google Scholar]


| Notation | Notes |
|---|---|
| Scalar | |
| Vector | |
| Matrix | |
| Inverse of matrix | |
| Absolute value | |
| Rectangle function |
| Fusion CFAR | CA-CFAR | OS-CFAR |
|---|---|---|
| Measurement fusion | ||
| Decision fusion |
| Parameter Description | Parameters | Value |
|---|---|---|
| Transmitter coordinates | (0,0,8) km | |
| Receiver coordinates | (80,20,8) km | |
| Target coordinates | (110,40,2) km | |
| Transmitter velocity vector | (100,10,0) m/s | |
| Receiver velocity vector | (100,10,0) m/s | |
| Target velocity vector | (−100,−50,0) m/s | |
| Transmitting signal carrier frequency | 1 GHz | |
| Transmission time width | 30 us | |
| Transmitted signal bandwidth | 1 MHz | |
| Pulse repetition frequency | 3000 Hz | |
| Pulse number | 64 | |
| Sampling frequency | 2 MHz | |
| Signal-to-noise ratio | 15 dB | |
| Signal-to-clutter ratio | −35 dB | |
| Signal/direct wave power ratio | −15 dB | |
| Four-pulse cancellation coefficient of MTI | [1 −3 3 −1] | |
| Number of reference units | 48 | |
| Order values of OS-CFAR | 18 | |
| False alarm probability | 10−6 |
© 2019 by the authors. Licensee MDPI, Basel, Switzerland. This article is an open access article distributed under the terms and conditions of the Creative Commons Attribution (CC BY) license (http://creativecommons.org/licenses/by/4.0/).
Share and Cite
Wang, H.; Tang, Z.; Zhao, Y.; Chen, Y.; Zhu, Z.; Zhang, Y. Signal Processing and Target Fusion Detection via Dual Platform Radar Cooperative Illumination. Sensors 2019, 19, 5341. https://doi.org/10.3390/s19245341
Wang H, Tang Z, Zhao Y, Chen Y, Zhu Z, Zhang Y. Signal Processing and Target Fusion Detection via Dual Platform Radar Cooperative Illumination. Sensors. 2019; 19(24):5341. https://doi.org/10.3390/s19245341
Chicago/Turabian StyleWang, HuiJuan, ZiYue Tang, YuanQing Zhao, YiChang Chen, ZhenBo Zhu, and YuanPeng Zhang. 2019. "Signal Processing and Target Fusion Detection via Dual Platform Radar Cooperative Illumination" Sensors 19, no. 24: 5341. https://doi.org/10.3390/s19245341
APA StyleWang, H., Tang, Z., Zhao, Y., Chen, Y., Zhu, Z., & Zhang, Y. (2019). Signal Processing and Target Fusion Detection via Dual Platform Radar Cooperative Illumination. Sensors, 19(24), 5341. https://doi.org/10.3390/s19245341