Article

An Automatic Head Surface Temperature Extraction Method for Top-View Thermal Image with Individual Broiler

1
College of Engineering/Jiangsu Province Engineering Lab for Modern Facility Agriculture Technology & Equipment, Nanjing Agricultural University, Nanjing 210031, China
2
Jiangsu Lihua Animal Husbandry CO., LTD., Changzhou 213168, China
3
M3-BIORES- Measure, Model & Manage Bioresponses, KU Leuven, Kasteelpark Arenberg 30, B-3001 Leuven, Belgium
4
BioRICS nv, Technologielaan 3, 3001 Leuven, Vlaams-Brabant, Belgium
*
Author to whom correspondence should be addressed.
Sensors 2019, 19(23), 5286; https://doi.org/10.3390/s19235286
Submission received: 20 September 2019 / Revised: 5 November 2019 / Accepted: 27 November 2019 / Published: 30 November 2019
(This article belongs to the Special Issue Smart Sensing Technologies for Agriculture)

Abstract

:
Surface temperature variation in a broiler’s head can be used as an indicator of its health status. Surface temperatures in the existing thermograph based animal health assessment studies were mostly obtained manually. 2185 thermal images, each of which had an individual broiler, were captured from 20 broilers. Where 15 broilers served as the experimental group, they were injected with 0.1mL of pasteurella inoculum. The rest, 5 broilers, served as the control group. An algorithm was developed to extract head surface temperature automatically from the top-view broiler thermal image. Adaptive K-means clustering and ellipse fitting were applied to locate the broiler’s head region. The maximum temperature inside the head region was extracted as the head surface temperature. The developed algorithm was tested in Matlab® (R2016a) and the testing results indicated that the head region in 92.77% of the broiler thermal images could be located correctly. The maximum error of the extracted head surface temperatures was not greater than 0.1 °C. Different trend features were observed in the smoothed head surface temperature time series of the broilers in experimental and control groups. Head surface temperature extracted by the presented algorithm lays a foundation for the development of an automatic system for febrile broiler identification.

1. Introduction

Body temperature is one of the most important indicators of a broiler’s health status [1]. When a broiler is infected with bacteria or a virus, the autoimmune system will take effect, resulting in an obvious rise of core body temperature [2]. Therefore, sudden changes in core body temperature can be utilized to identify a sick broiler. Traditional body temperature measurement is achieved by inserting a mercury thermometer into a broiler’s rectum [3]. It is laborious and time consuming. At the same time, it could increase the probability of disease spreading between farmers and broilers.
With the development of sensor technology, animal body temperature monitoring based on implantable temperature sensors has been evaluated in the rumen [4,5], vagina [6], and subcutis [7]. However, it is difficult to apply implantable sensors to collect body temperature for animals of small size, such as broilers. A wearable temperature sensor, positioned under a broiler’s wing, was utilized by Li, et al. [8] in 2013 to monitor a broiler’s under-wing temperature. However, it has the following demerits. Firstly, frequent replacement of the battery is required. Secondly, it is difficult to keep the sensor in a fixed position under the wing. Position shift of the sensor will cause incorrect under-wing temperature. Worse, falling off of the sensor could lead to temperature data loss.
In recent years, thermal imaging technology has been successfully applied to obtain superficial temperature for cows [9], cattle [10], pigs [11], and so on. Based on the obtained superficial temperature, animal health was evaluated [12,13]. In the field of poultry breeding, thermal imaging has also been employed to obtain the surface temperature for broilers. For example, Giloh, Shinder, and Yahav [1] extracted broiler surface temperature from a thermal image. They found that broiler surface temperature is correlated to its body temperature. Liu, et al. [14] established a regression model between surface and core body temperatures for an individual broiler. However, broiler surface temperature in the existing research was extracted manually by using the specific software provided by the thermal imager manufacturer [15]. This is time and labor consuming, especially when the number of images is large and the ROI (region of interesting) areas are small.
The broiler’s head has few feathers, it is much easier to obtain the skin temperature in head than other parts of an individual broiler by using a top-view thermal camera. Inspired by the study done by Giloh, et al. [1] and Liu, et al. [14], an automatic head surface temperature extraction algorithm for top-view thermal image with individual broiler was developed in this study. At the same time, a method for head temperature time series smoothing was proposed, based on which, febrile broiler can be identified. This research lays a foundation for the development of an automatic system for febrile broiler identification.

2. Materials and Methods
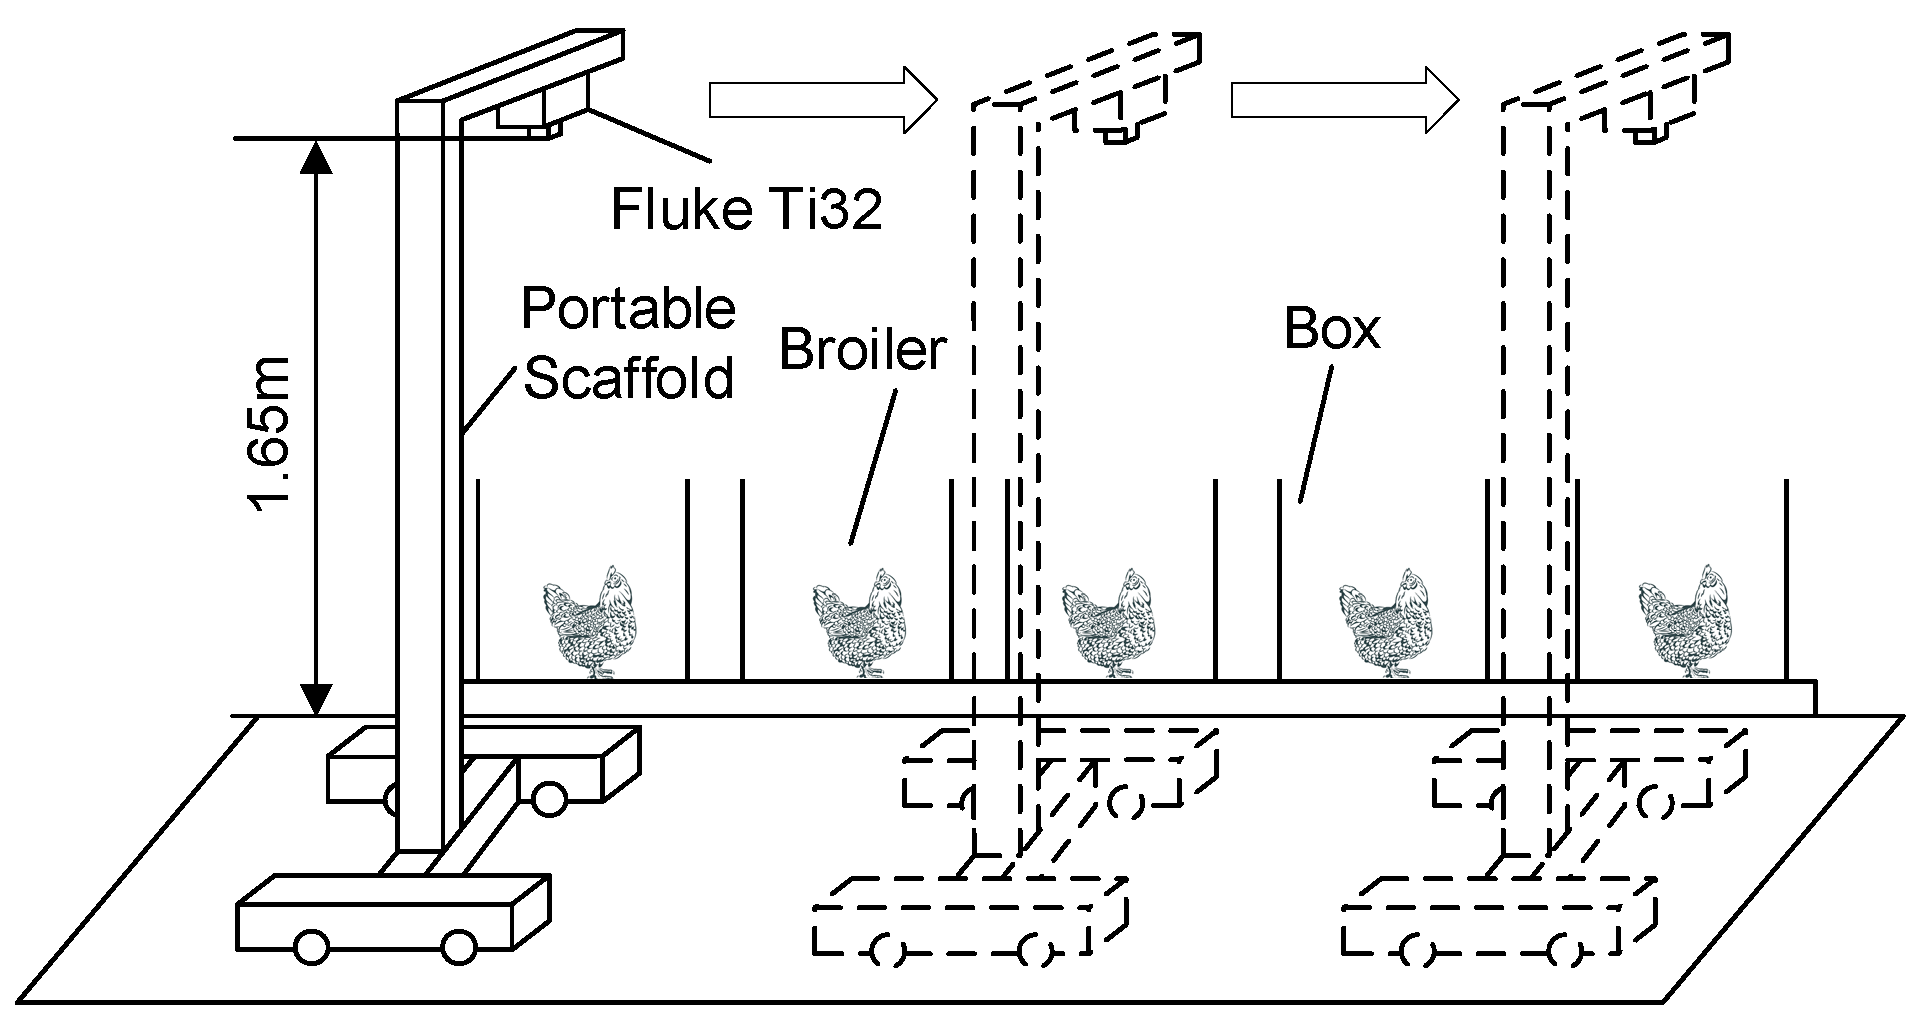
2.1. Image System

The image system consisted of a portable scaffold and an infrared thermal camera (Fluke TI32, Avery, WA, USA), as shown in Figure 1.
The image resolution, thermal sensitivity, field of view (FoV) of the thermal camera was 320 × 240, ≤0.045 °C at 30 °C, and 23° × 17°, respectively. Five paper boxes were placed on the ground, each one with a broiler inside and with no cover. The camera was fixed on the portable scaffold at a height of 1.65 m above the ground. FoV of the camera at this height allows for coverage of the whole boiler in each paper box. According to the survey conducted by McManus, et al. [16] in 2016, emissivity value normally ranged from 0.98 to 0.93 for animal temperature monitoring. Therefore, the emission rate in this study was set to 0.95. The portable scaffold was pushed manually and slid from one box to another. Once the portable scaffold stopped beside a box, thermal imager was triggered manually to capture thermal images for the broiler inside the box. The thermal images were stored in the SD card of the thermal imager in IS2 format. Each IS2 file contained the radiometric data, infrared image, IR-Fusion mode information, and so on, of the object in the FoV of the imager. At the end of thermal image acquisition, all the obtained IS2 files were transferred to a PC for further processing.

2.2. Broilers and Thermal Images Acquisition

20 QingJiaoMa broilers, with the age of around 45 days (45.3 days ± 1.23 days) and a body weight of around 1.5 kg (1.54 kg ± 0.12 kg) were randomly selected from Lihua Animal Husbandry Co. LTD, city of Changzhou, Jiangsu Province, China. All the selected broilers were confirmed to be healthy by a veterinarian. Thermal images of the broilers were acquired in an experimental animal house of Lihua Animal Husbandry Co. LTD from 19 September 2018 to 24 September 2018. Ambient temperature inside the experimental animal house was set to 27–30 °C by using an air conditioner. The environmental relative humidity was 55–65%. Three fluorescent lamps equipped on the ceiling were used to provide stable illumination conditions inside the house. There was no thermal heat from solar or other light sources during the whole course of the thermal images acquisition.
15 broilers were randomly chosen and served as the experimental group. Thermal images of the broilers in this group were captured in 3 batches (5 broilers in each batch). The remaining 5 broilers served as the control group in this study and were photographed in one batch. Thermal image acquisition began at 8:30 a.m. and ended at 11:00 p.m. each day. For each broiler in the experimental group, 0.1 mL of the pasteurella inoculum was injected into its breast at 12:00 a.m. For broilers in the control group, no treatment was given. A wireless wearable sensor based under-wing temperature monitoring system (CH-T2, Chero Technology Co. ltd, Zhejiang, China) was utilized to collect the under-wing temperature for each broiler. The temperature sensor of this system was positioned under each broiler’s wing the night before the next day’s thermal images acquisition. After the sensor installation was completed, each broiler was placed in one of the 5 boxes overnight to help it adapt to the experimental environment and the sensor under its wing. The under-wing temperature of each broiler was collected by the temperature sensor and sent to the application installed in a smart phone at a fixed time interval.
The inherent error between the actual and the monitoring temperature obtained by the thermal camera used in this study was ±2 °C. Averaging operation was employed to reduce the impact brought on by the inherent error. Therefore, five thermal images were captured for each broiler every 30 min. Each broiler of the control and experimental groups was photographed for 30 cycles and 15–21 cycles, respectively, where the quantity of the thermal image acquisition cycles of the broilers in experimental group depended on its dead time. At the end of thermal image acquisition, an image database with 2185 thermal images was procured.

2.3. Head Surface Temperature Extraction

An algorithm, named HSTE (Head Surface Temperature Extraction), was developed to extract head surface temperature from a top-view thermal image with individual broilers. HSTE consisted of 3 steps: thermal image pre-processing, head region locating, and representative head surface temperature extraction.

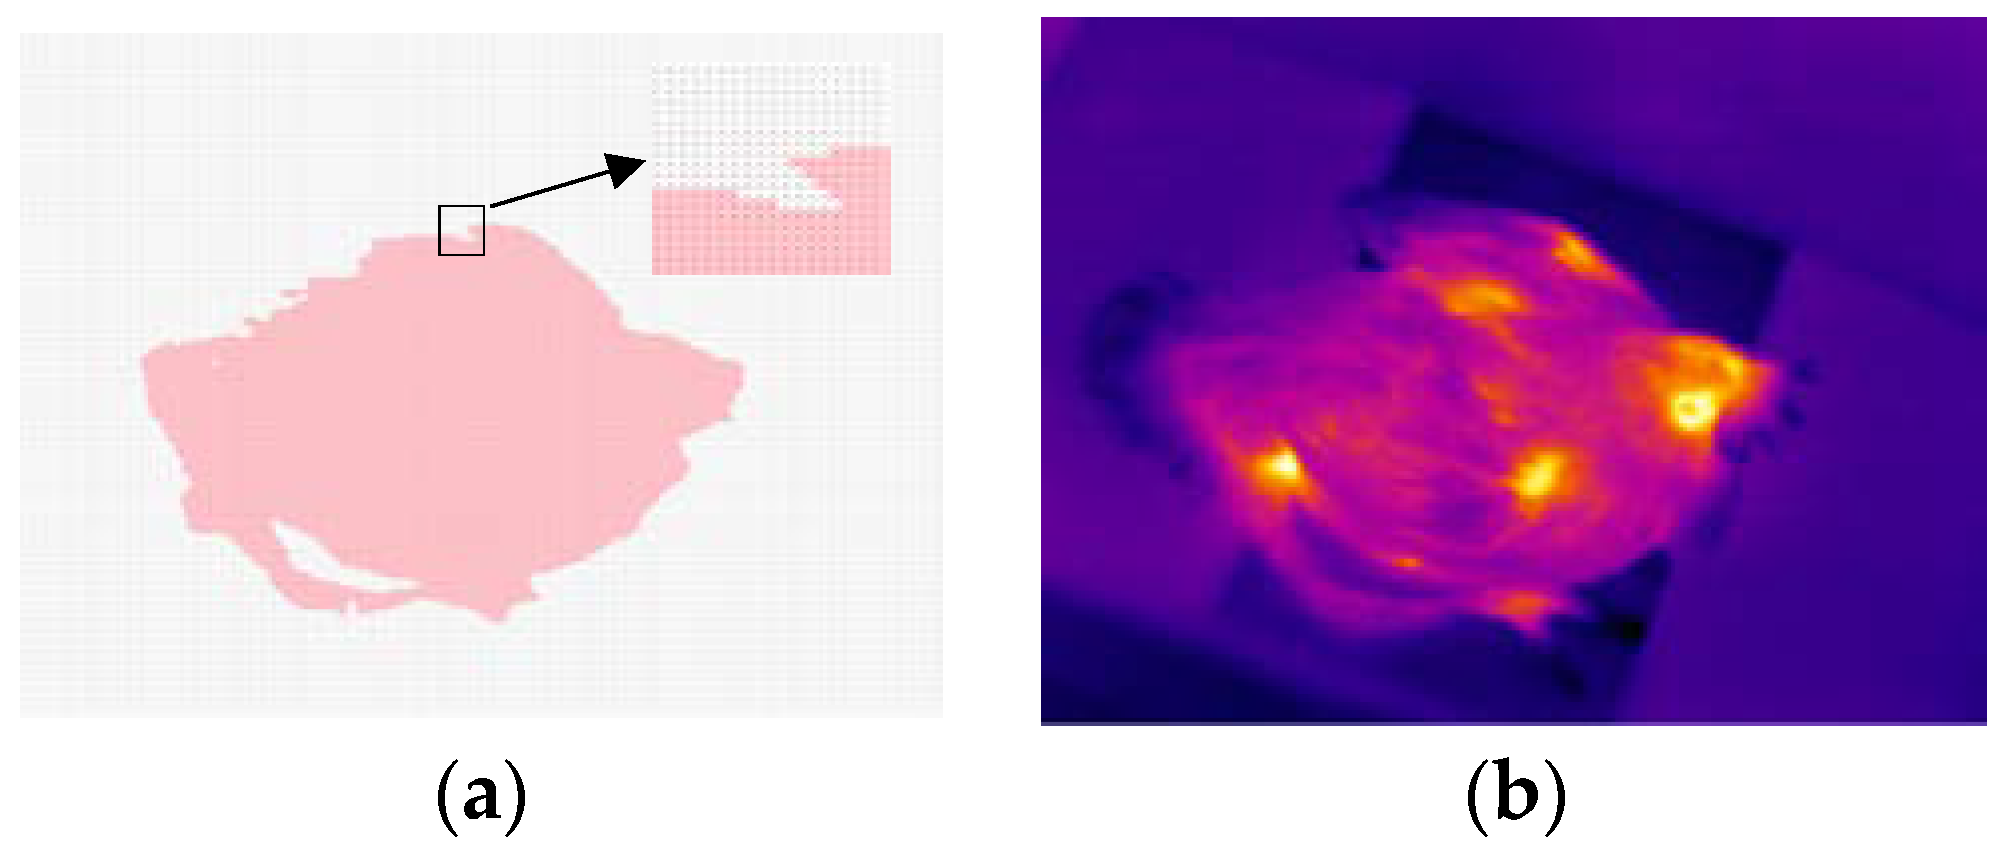
2.3.1. Thermal Image Pre-Processing

Each thermal image obtained in Section 2.2 was converted to a 240 × 320 matrix. The matrix contained the temperature value at each pixel. Taking a thermal image selected randomly from the image database as an example, its temperature matrix and thermal image are shown in Figure 2a,b, respectively.
Temperature matrix shown in Figure 2a was transformed into a grayscale image, as shown in Figure 3a, by using Formula (1):
I m g _ g r a y [ r , c ] = I m g _ m [ r , c ] m i n ( I m g _ m ) m a x ( I m g _ m )   m i n ( I m g _ m )   r [ 1 , 240 ] ,   c [ 1 , 320 ] .
where Img_gray[r, c] was the intensity value of the pixel at the coordinate (r, c) in the grayscale image. Img_m[r, c] was the value at row r and column c of the temperature matrix, max(Img_m) and min(Img_m) were the maximum and minimum value of the temperature matrix, respectively.
The obtained grayscale image was converted to a binary one by using Otsu’s method [17], as shown in Figure 3b. Then, morphological processing [18] was carried out to remove holes and spindly parts in the binary image. The morphological processing result of Figure 3b is shown in Figure 3c. Finally, the convex hull image was obtained by using the algorithm proposed by Barber, et al. [19] in 1996, as shown in Figure 3d.

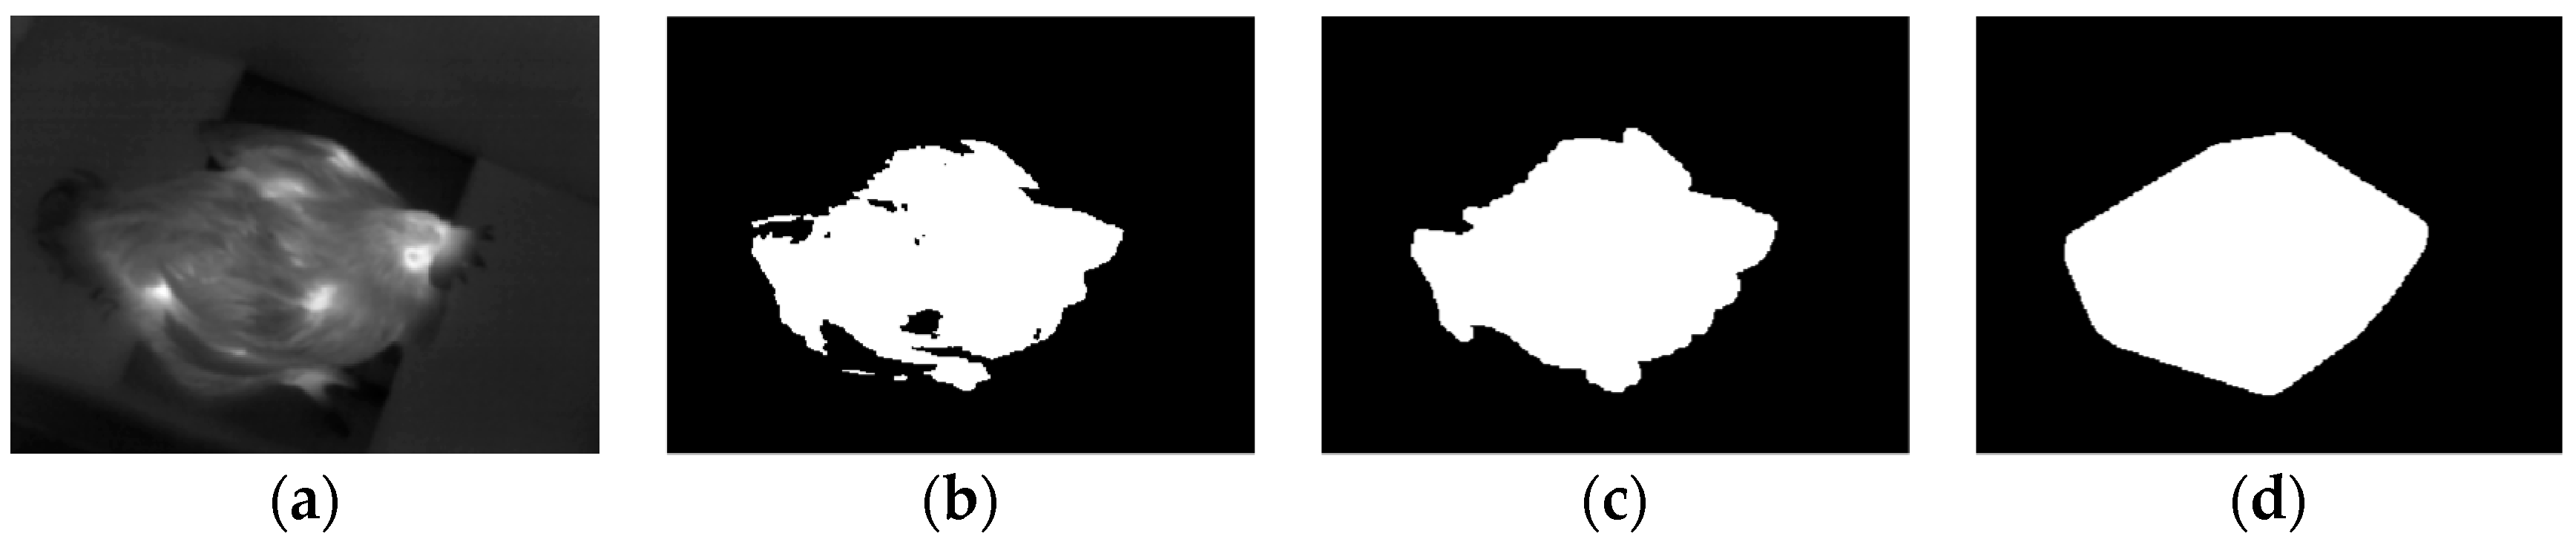
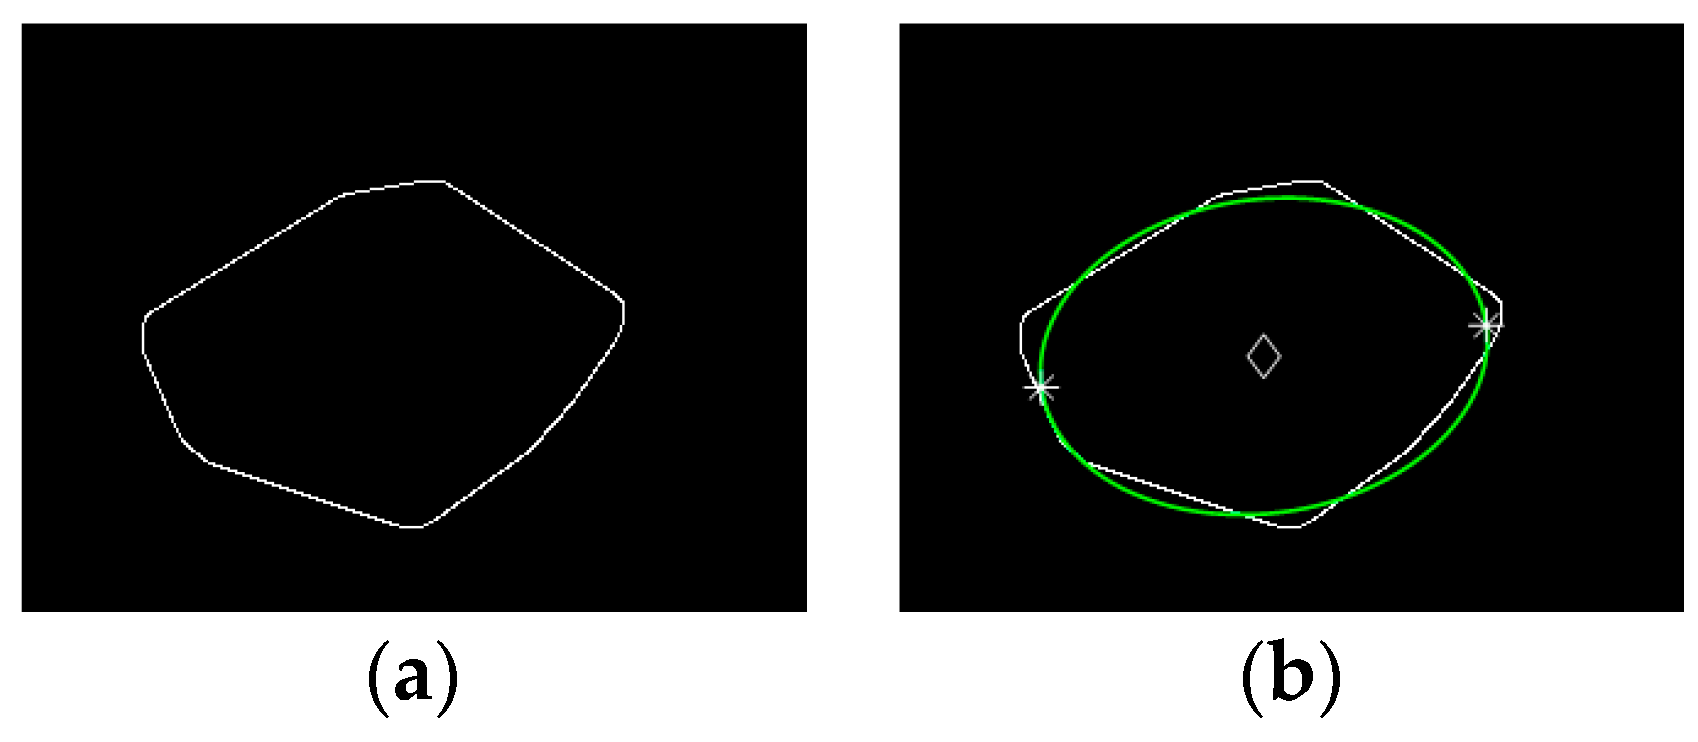
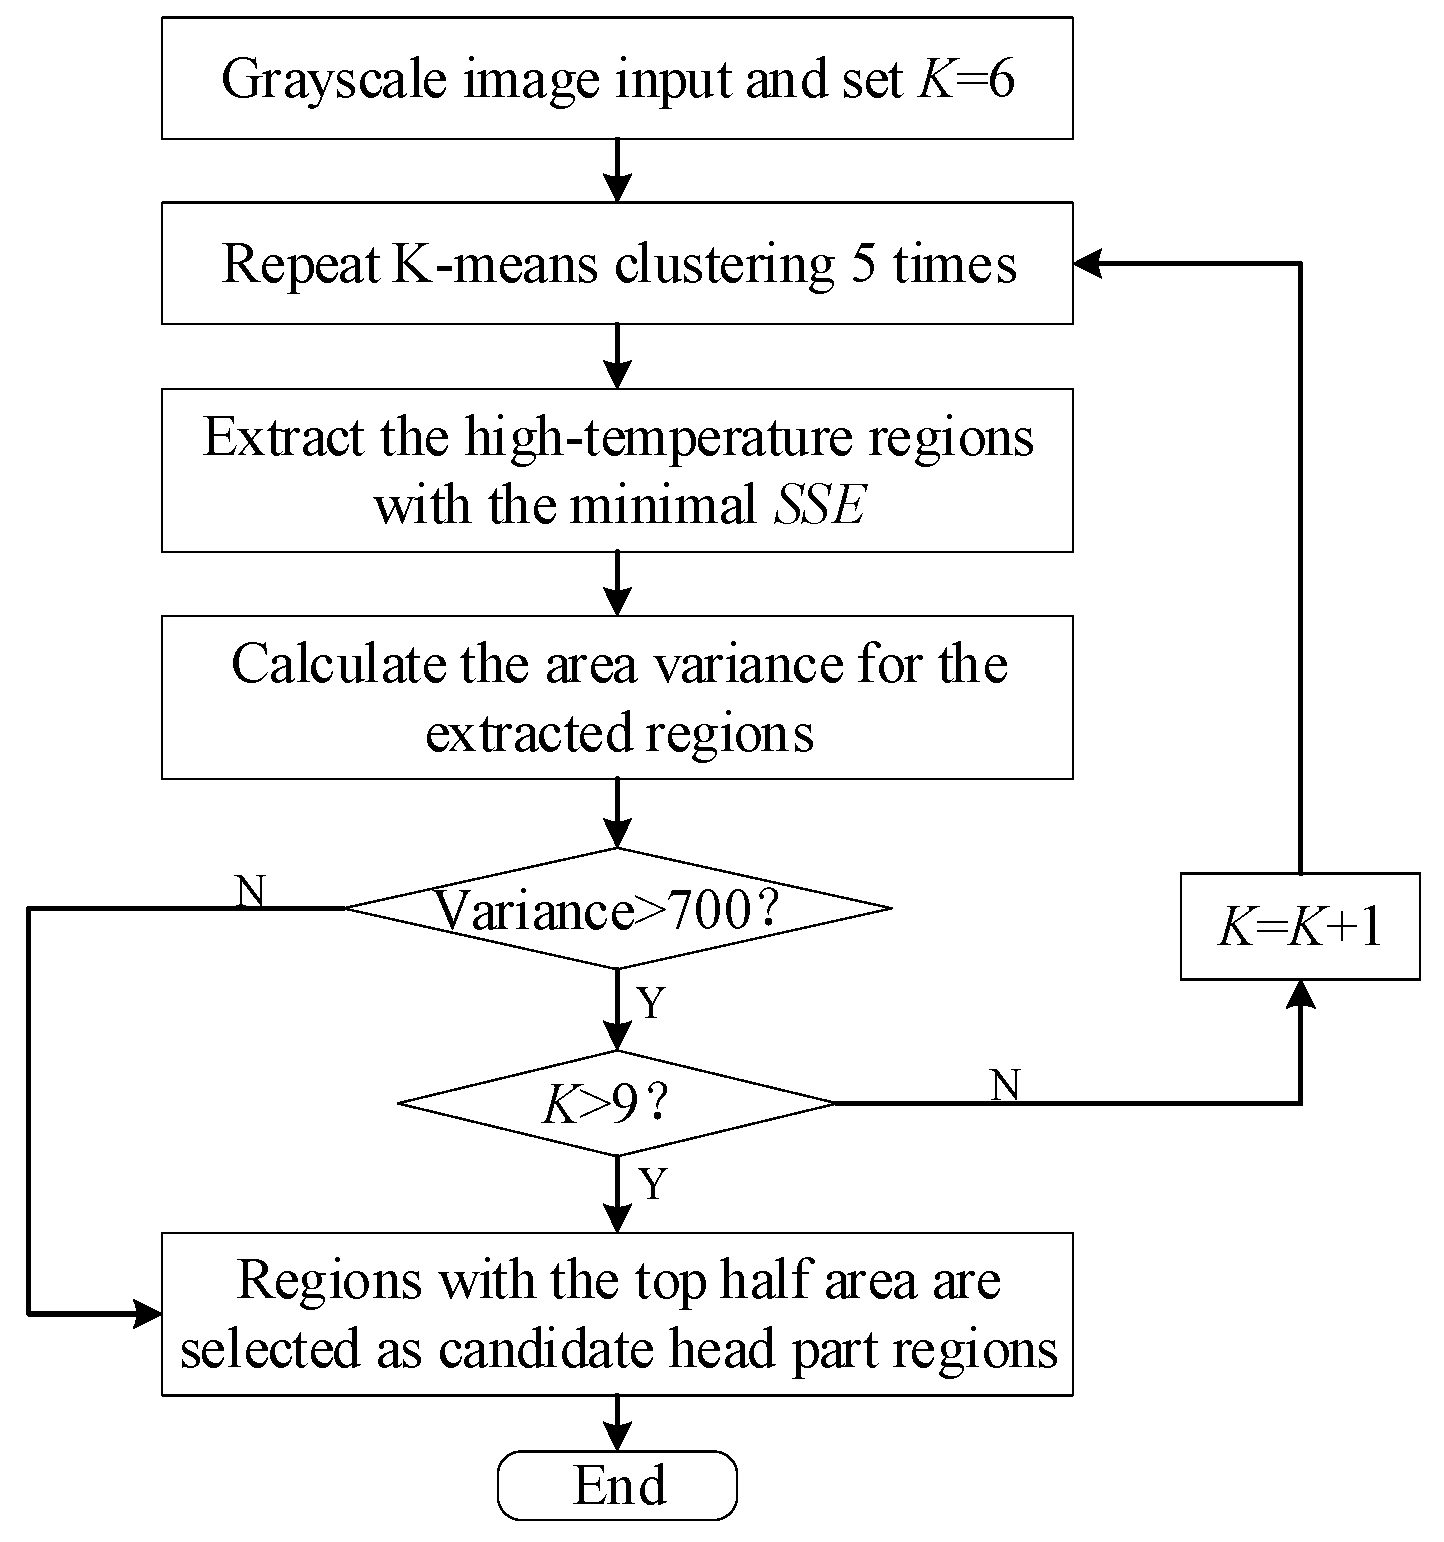
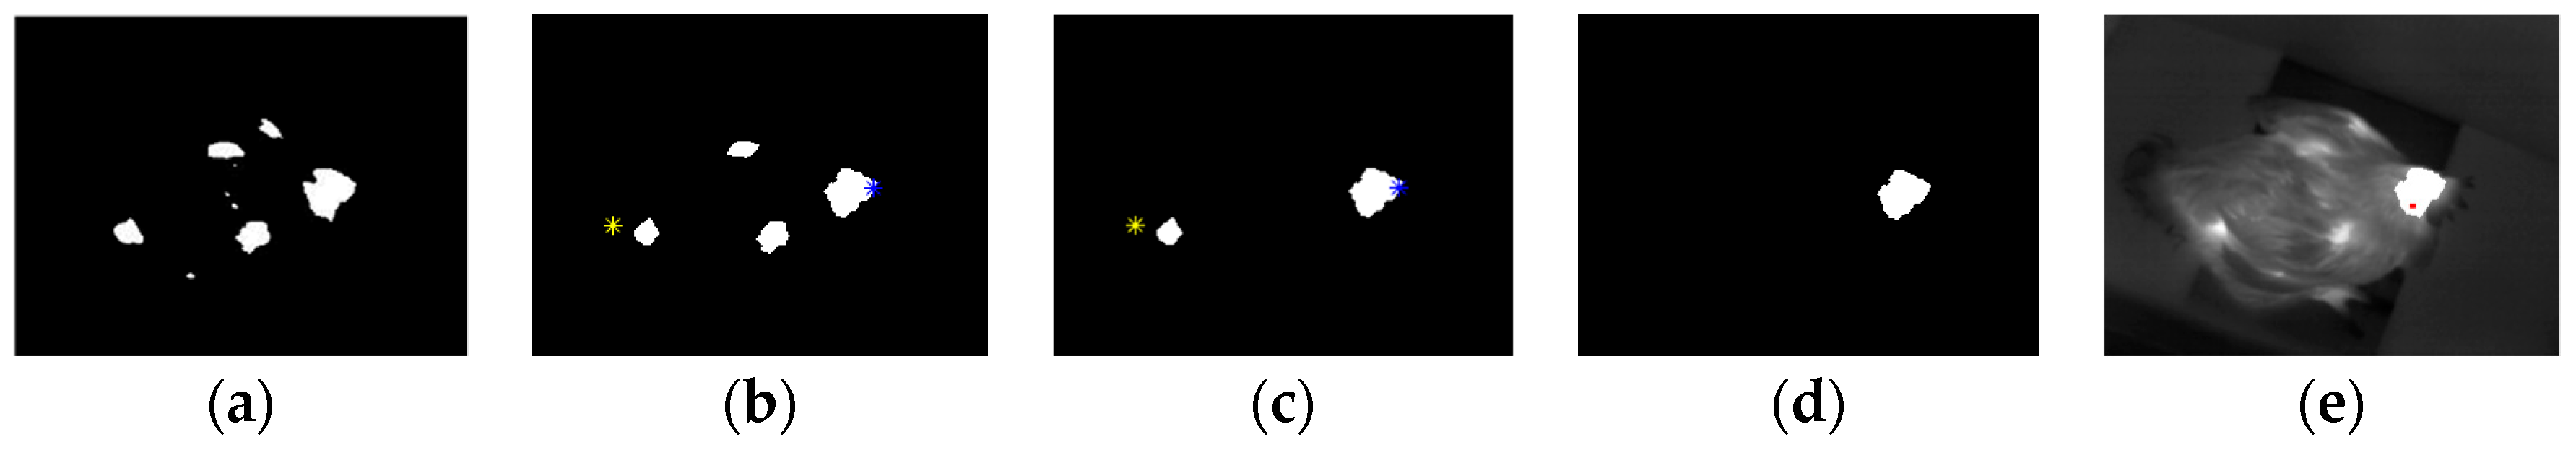
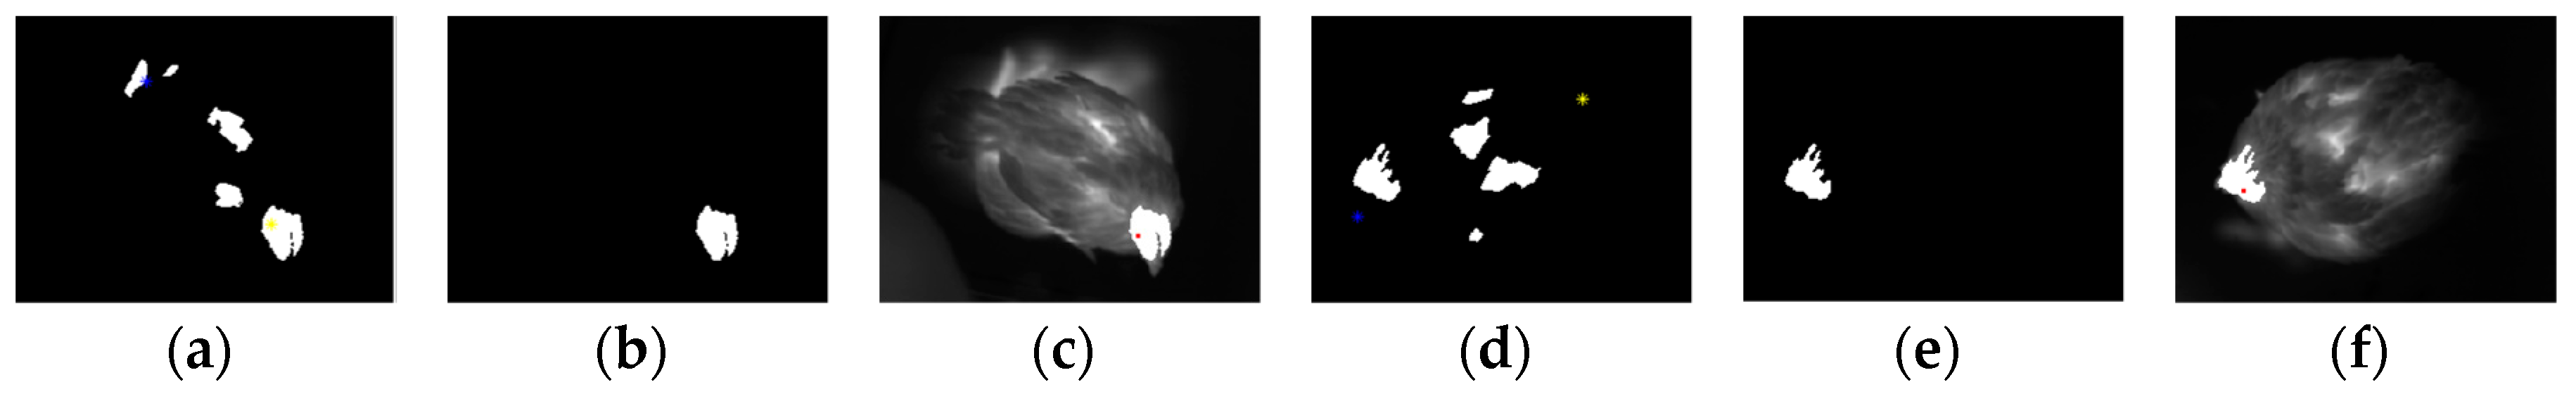
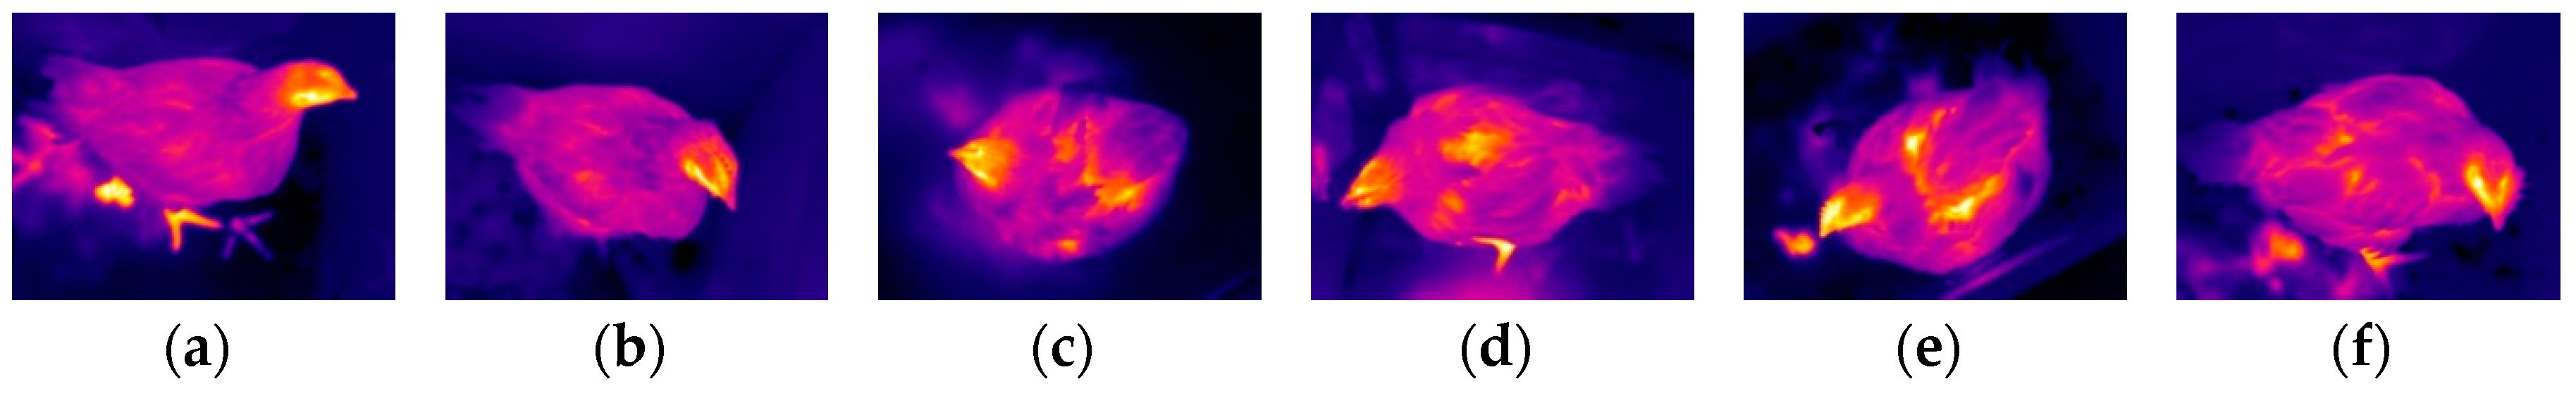
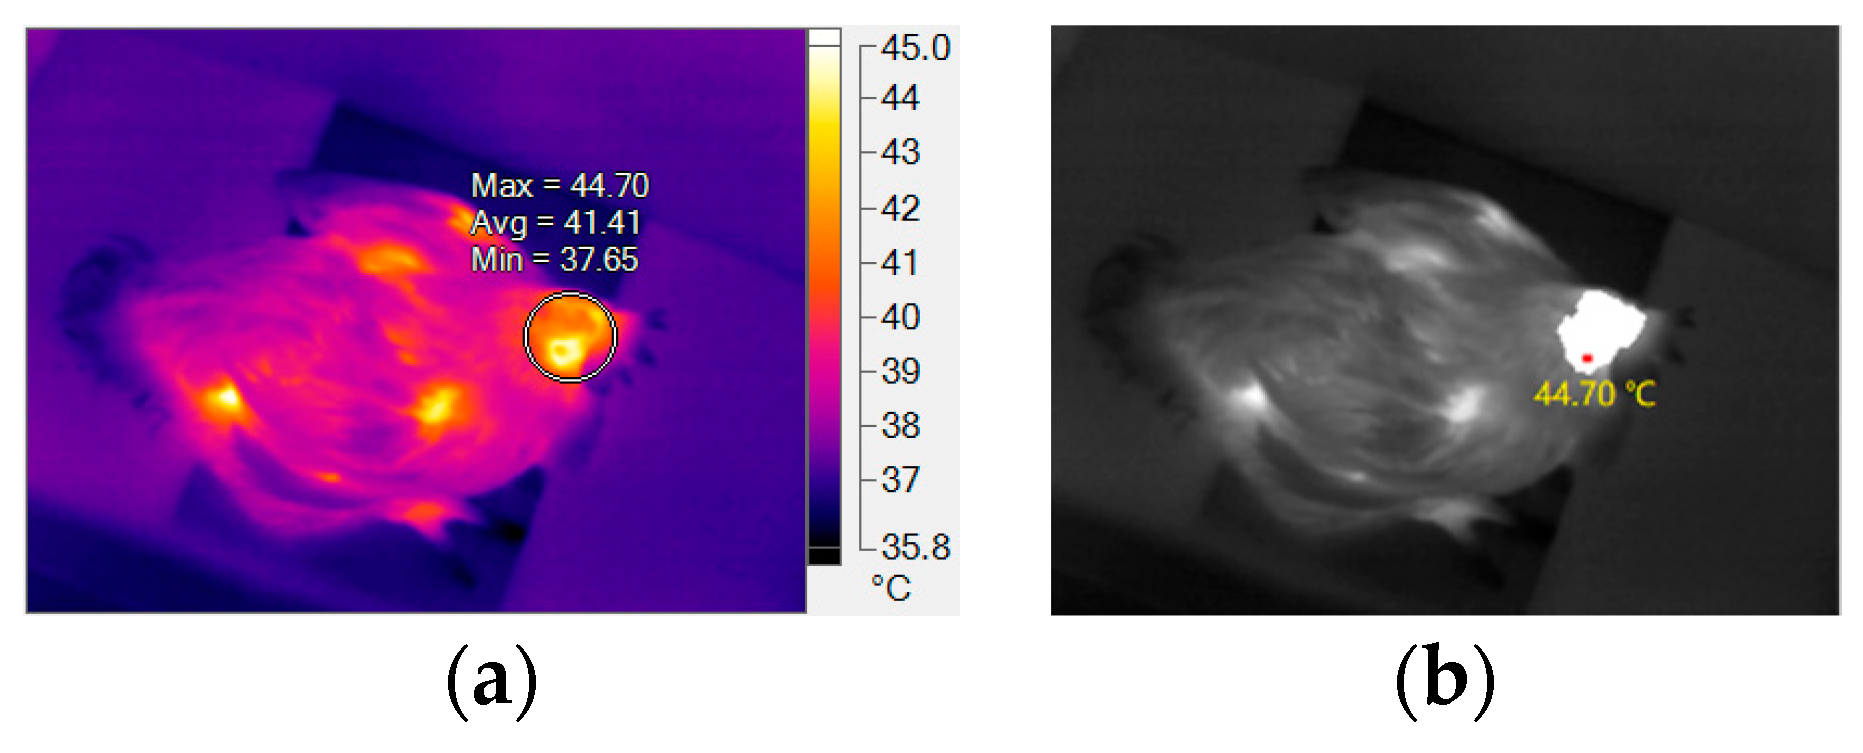
2.3.2. Head Region Locating

The contour of a broiler can be approximately considered an ellipse, where head part is definitely located nearby one of the two endpoints of the major axis of the ellipse. At the same time, there are few feathers in a broiler’s head, leading to a relatively high temperature region in the head part of a thermal image. Therefore, head region was located in a thermal image based on the features of surface temperature distribution and a rough elliptical body shape according to the following 3 sub-steps.
Sub-step 1; coordinates of the major axis endpoints extraction for the fitted ellipse. An ellipse was fitted for the convex hull image contour of an individual broiler by using direct least square method [20,21]. The fitted ellipse of the contour in Figure 4a is shown in Figure 4b, where the contour in Figure 4a was extracted from the convex hull image in Figure 3d by using the method proposed by Canny [22] in 1986. Once the fitted ellipse was obtained, the following parameters of the ellipse were extracted. The coordinate of the center point, which was denoted by ( x 0 , y 0 ) is shown in Figure 4b with a diamond point. Length of the major and minor axis were denoted by a and b, respectively. The inclined angle of the ellipse’s major axis was denoted by α . Based on the aforementioned parameters, coordinates of the two endpoints of the major axis were calculated by Equations (2)–(5):
x 1 = a 2 c o s α + x 0
y 1 =   b 2 s i n α + y 0
x 2 = a 2 c o s α + x 0
y 2 = b 2 s i n α + y 0
where x1 and x2, y1, and y2 were the horizontal and vertical coordinates of the two endpoints, respectively. The extracted endpoints are shown in Figure 4b with two star points.
Sub-step 2, candidate head regions extraction. Figure 2a indicates that there are several high intensity regions in a broiler’s grayscale image. The higher the intensity of a region, the higher the temperature in this region. The head, which has no feather or just sparse feathers, is definitely among these high intensity regions. Adaptive K-means clustering method was carried out to locate these high intensity regions. Then, high intensity regions with the top half area were extracted as the candidate head regions. The main operation of candidate head regions extraction is indicated in the flowchart shown in Figure 5.
Parameter K of the adaptive K-means clustering [23] was initialized to be 6. That is, 6 pixels in the grayscale image shown in Figure 3a were randomly selected as the centroids. The Manhattan distance [24], calculated by Equation (6):
d p d = | x p c q |    p [ 1 , 76800 ] ,   q [ 1 , K ] ,  
was applied to measure the intensity distance from the rest of the pixels to the 6 centroids. xp was the intensity of the pixel in row (p mod 240), column (p/240 + 1) of the grayscale image. “/” and “mod” were modulus and remainder operators on integer values, respectively. cq was the intensity of the qth centroid. Operator |w| referred to the operation of extracting the absolute value of w.
A maximum of 4 iterations of K-means clustering were carried out to obtain the high intensity regions, where each iteration had 5 clustering operations. That is, 5 sets of temporary high intensity regions were obtained for each iteration. The sum of square error, denoted by SSE and calculated by Equation (7):
S S E = p = 1 M q = 1 K d p q 2
was utilized to choose the result high temperature regions for each iteration. Where, M was set to be 240 × 320 and K was adjustable.
Among the 5 sets of temporary high intensity regions, the one with the minimal SSE was selected as the result high intensity regions for the current iteration. The variance of the areas of the resulting high intensity regions was calculated. If the variance was smaller than 700, the resulting high intensity regions were chosen as the final high intensity regions. Otherwise, if K was smaller than 9, a new iteration of clustering was implemented with K increased by 1. Clustering terminated when either the variance was smaller than 700 or K was greater than 9. The final high intensity regions of the grayscale image shown in Figure 3a after the adaptive K-means clustering operation is shown in Figure 6a.
The area of each final high intensity region was calculated. Regions with the top half areas were extracted as the candidate head regions. The candidate head regions of Figure 6a are shown in Figure 6b, where the star points are the endpoints of the major axis of the fitted ellipse. The two endpoints were denoted by EP1 and EP2, respectively.
Sub-step 3, head region locating. The broiler’s head must be close to one of the endpoints of the major axis of the fitted ellipse of its top-view body contour. Therefore, two of the candidate head regions, each of which was closest to one of the endpoints of major axis of the fitted ellipse, were selected as the alternative head regions. The alternative head regions selected from the candidate head regions in Figure 6b are shown in Figure 6c. Head region was chosen from the two alternative head regions, denoted by L1 and L2, respectively, according to the following 3 cases:
Case 1: EP1 and EP2 located inside L1 and L2, one endpoint in one region. Then, the alternative head region with higher maximum temperature was extracted as the head region.
Case 2: Only one endpoint located inside L1 or L2. Then, the alternative head region, in which the endpoint was located, was extracted as the head region.
Case 3: No endpoint located inside L1 or L2. Then, the shorter distance of each endpoint to the center of L1 and L2, denoted by D_min1 and D_min2, respectively, were calculated and obtained. The alternative head region with a distance of min{D_min1, D_min2} s extracted as the head region. Where, min{D_min1, D_min2} was the smaller value of D_min1 and D_min2.
Taking the alternative head regions in Figure 6c as an example, head region was located by using Case 2, as shown in Figure 6d. The relationship between the extracted head region and the original gray-scale thermal image is shown in Figure 6e. Examples of the head region located by using case 1 and case 3 are shown in Figure 7b,e, respectively.
Where the corresponding candidate head regions are shown in Figure 7a,d, respectively. The relationship between the extracted head region and the gray-scale thermal image is shown in Figure 7c,f. Operations described in Section 2.3.1 and Section 2.3.2 were applied to all the 2185 thermal images in the database to locate the broiler’s head region. As a result, the head region of the 2027 thermal images were located correctly.
Once the head region was located, the maximum temperature in the region was extracted as the head surface temperature, which was denoted by HTi,j,k (i ∈ [1, 20]). Where i was the number of the broiler and j was the number of the thermal image capture interval. For a broiler in the experimental group, the maximum value of j depended on its dead time. For broilers in the control group, the maximum value of j was 30. k was the number of the thermal image in each interval. It had a maximum value of 5.
According to the technical manual of the thermal imager used in this study, the maximum error between the temperatures recorded by the thermal imager and animal’s actual superficial temperature is ±2 °C. In order to reduce the influence of this inherent error, representative head surface temperature (abbreviated as RHT) of the ith broiler in jth internal was calculated by Equation (8):
R H T i j = ( k = 1 N j H T i , j , k )   /   N j      i [ 1 , 20 ]
where Nj is the quantity of the thermal images in the jth interval.

2.3.3. Construction of RHT Time Series

Equation (8) was applied to all the 2027 thermal images obtained in Section 2.3.2. A RHT time series, which was denoted by TSRHT, could be constructed for each broiler. Taking the ith broiler as an example, its TSRHT was obtained by using expression (9):
T S R H T i = { R H T i 1 , R H T i 2 , , R H T i j , ,   R H T i N I H i }       i [ 1 , 20 ] .
where NIHi is the quantity of the intervals in the thermal images acquisition step for the ith broiler. Two broilers, one in the experimental group and another in the control group, were randomly selected, the corresponding TSRHT of which are shown in Figure 8.
Data points in the TSRHT of the broiler in experimental and control groups are displayed with red cross and blue star points in Figure 8, respectively. It can be observed that sharp rising and drop exist in the whole TSRHT; even the average operation has been applied to reduce influence of the inherent error of the thermal imager. Therefore, the original TSRHT could not be utilized directly to identify febrile broiler. Smoothing operation was carried out to each TSRHT to obtain a gentle time series. Taking the ith broiler as an example, the tth data point in its smoothed TSRHTi (i ∈ [1, 20]) was obtained by calculating the mean of the first t (t ∈ [1, NIHi]) elements in TSRHTi by using Equation (10):
m i t = j = 1 t R H T i j t   t [ 1 , N I H i ]   ,   i [ 1 , 20 ] .  
where m i t is the smoothed value of the tth data point in the smoothed TSRHTi. NIHi and R H T i j are the quantity of the elements and the jth element in TSRHTi, respectively. The smoothed TSRHT of the broilers in the experimental and control groups are shown in Figure 9a with red cross and blue star points, respectively. The corresponding under-wing temperature time series is shown in Figure 9b.
The maximum time intervals of the broilers in the experimental group was 21; data points of broilers in control group from the 22nd to 30th time interval are not plotted in Figure 9. It can be observed in Figure 9a that the smoothed TSRHT of broilers in the experimental and control groups had an overall slight increase and flat trends, respectively. Meanwhile, under-wing temperature time series in Figure 9b indicates that almost all the broilers in the experimental groups were feverish (under-wing temperature greater than 42 °C) from the 13rd time interval on. All the broilers in the control group were not feverish (under-wing temperatures less than 42 °C). This is consistent with the result found by Meltzer in 1983 and by Donkoh in 1989. Both studies suggested that most healthy broilers had an ordinary body temperature of 40–42 °C [25,26]. Therefore, all the broilers in the experimental group in this study were infected successfully by the pasteurella inoculum. It can be inferred from Figure 9 that different trend features existed in the smoothed TSRHT of febrile and non-febrile broilers, which can be utilized to identify individual febrile broilers.

3. Results

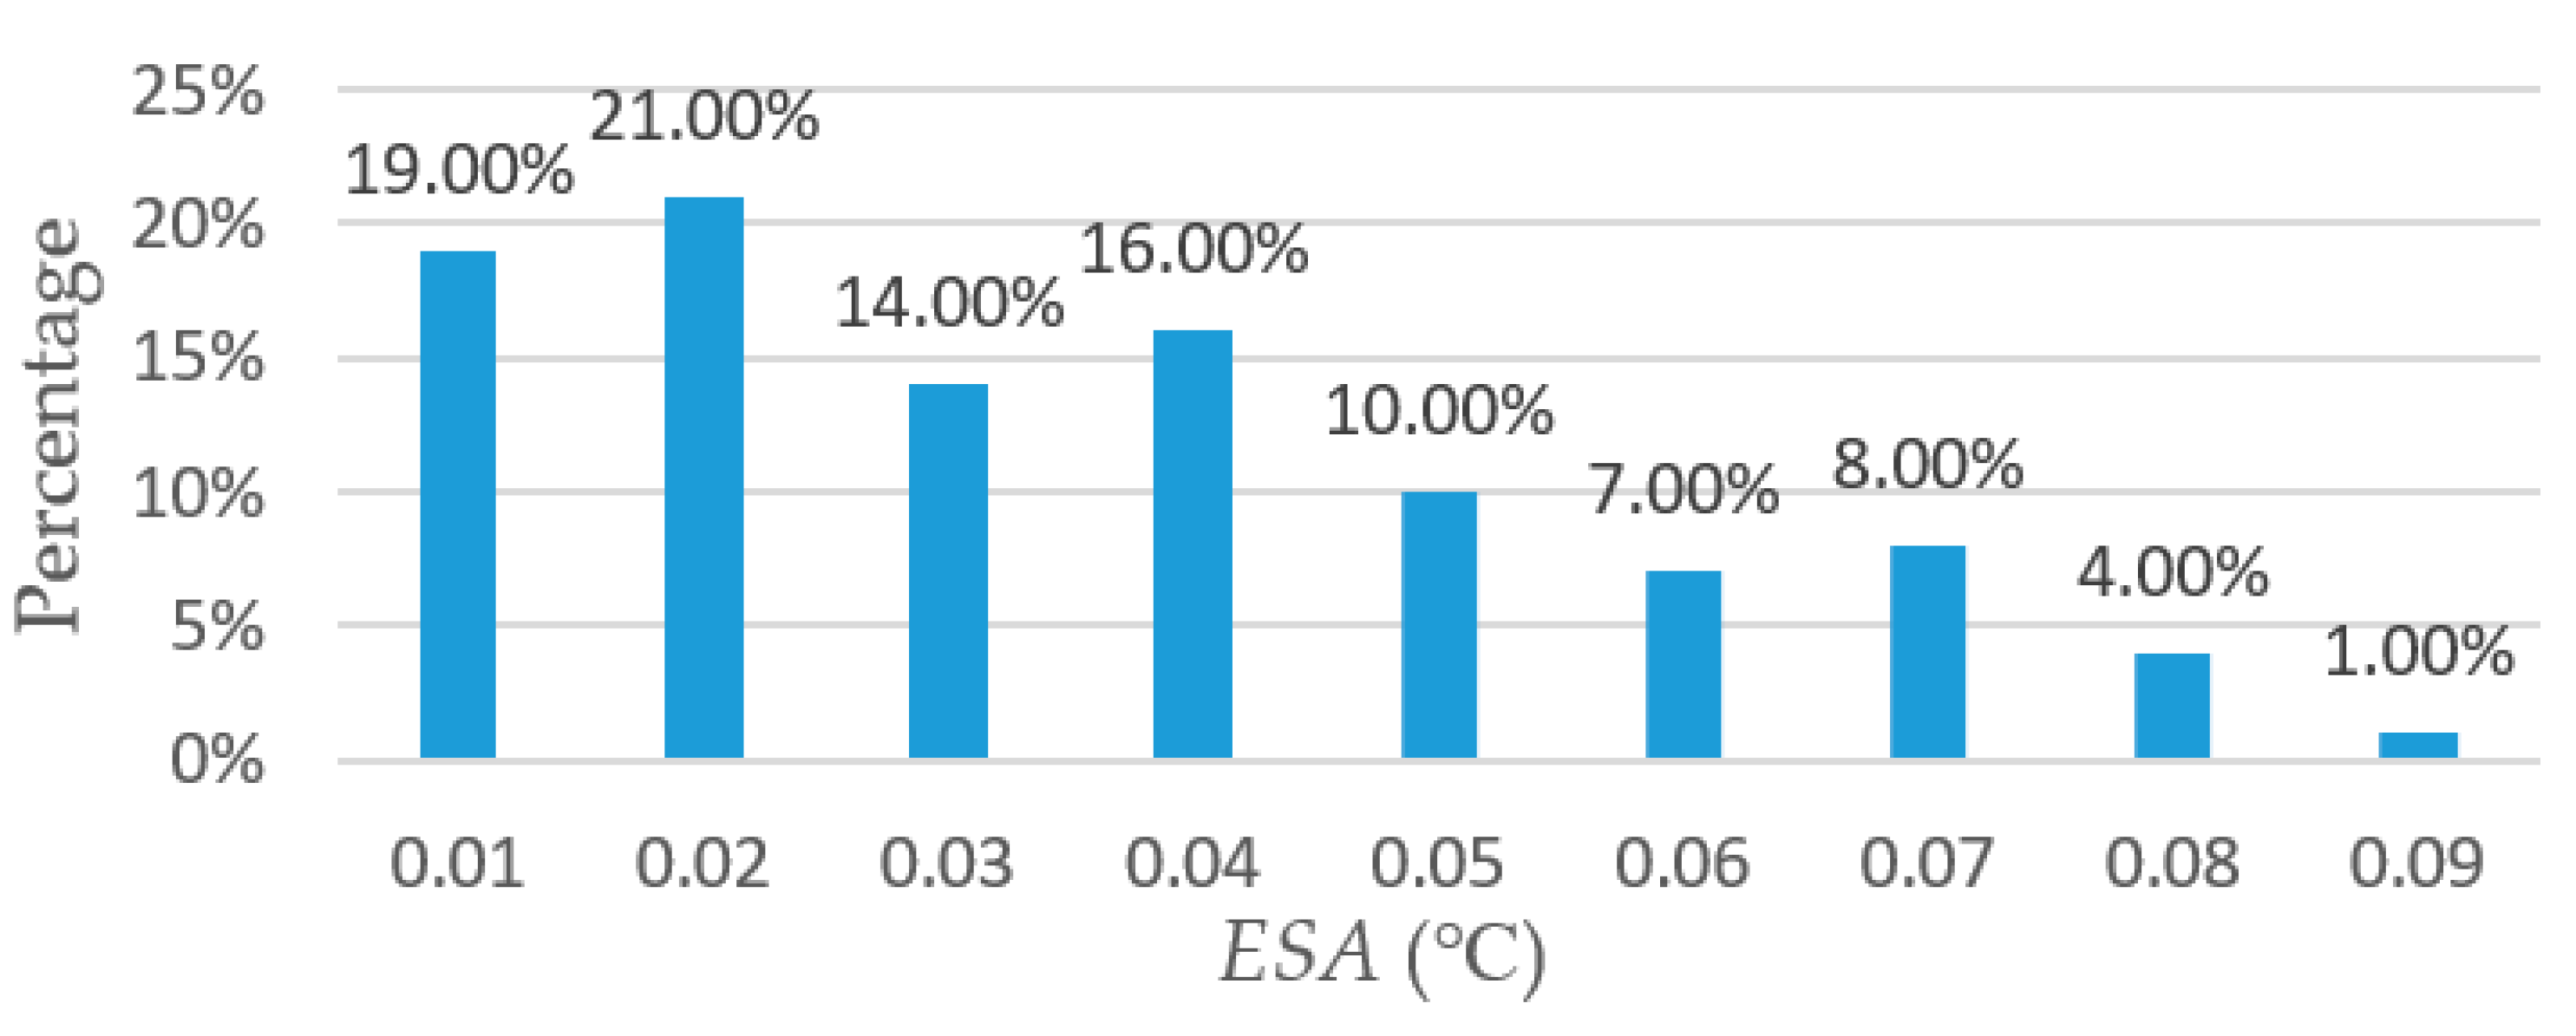
3.1. Testing of HSTE

Operations described in Section 2.3.1 and Section 2.3.2 were applied to all the 2185 thermal images to locate a broiler’s head region. Thermal images were classified into the following six categories: (i) broiler body was well covered by feathers, and both feet and uncooled manure appeared; (ii) broiler body was well covered by feathers, and only feet or only uncooled manure appeared, or no feet and uncooled manure appeared; (iii) broiler body had sparse feathers, no feet, and uncooled manure appeared; (iv) broiler body had sparse feathers, and feet appeared; (v) broiler body had sparse feathers, an uncooled manure appeared; and (vi) broiler body had sparse feathers, and both feet and uncooled manure appeared. An example image for each category is shown in Figure 10.
Algorithm testing results indicated that the head region of the thermal images in category (a)–(f) could be correctly located with a ratio of 78.05%, 94.90%, 94.94%, 91.53%, 84.89%, and 73.68%, respectively, as shown in Table 1.
As a result, the average ratio of the correct locating of the head region was 92.77%. That is, the head region of 2027 thermal images were located correctly. These images were picked out for the TSRHT construction described in Section 2.3.3.
In order to evaluate the accuracy of the head temperature obtained automatically by extracting the maximum value in the head region, 100 thermal images were randomly selected from the 2027 images whose broiler head regions were located correctly. Head temperatures of the selected thermal images were obtained automatically and manually by using HSTE and Fluke Smartview 4.3, respectively. In the latter case, head region was selected by drawing a circle in the head for each selected thermal image. SmartView 4.3 provided the maximum, mean, and minimum temperatures of the selected region, as shown in Figure 11a.
Head temperature extracted automatically for the thermal image in Figure 11a is shown in Figure 11b. Using the maximum temperature in the selected region provided by the SmartView 4.3 as the gold standard, the accuracy of the head surface temperature extracted by HSTE was evaluated. For the thermal images whose broiler head part was correctly located, correlation coefficient between the maximum temperatures extracted by HSTE (38.86 °C ± 3.77 °C) and by Smartview (38.9 °C ± 3.76 °C) was 99.99%. The standard deviation of the maximum temperatures was close to 4 °C; this is because the thermal images were randomly selected from different broilers in different groups (including experimental and control groups). The absolute value of the error of the head surface temperature was extracted automatically and by SmartView 4.3 was denoted by ESA. For all the selected 100 thermal images, ESA is shown in Figure 12.
Figure 12 indicates that the maximum ESA of the head temperature, extracted automatically and manually, is less than 0.1 °C. Where 95% of the ESA are distributed in the range of 0.01–0.07 °C, it can be concluded that once the head region is located correctly, the head temperature can be extracted automatically with an acceptable accuracy.

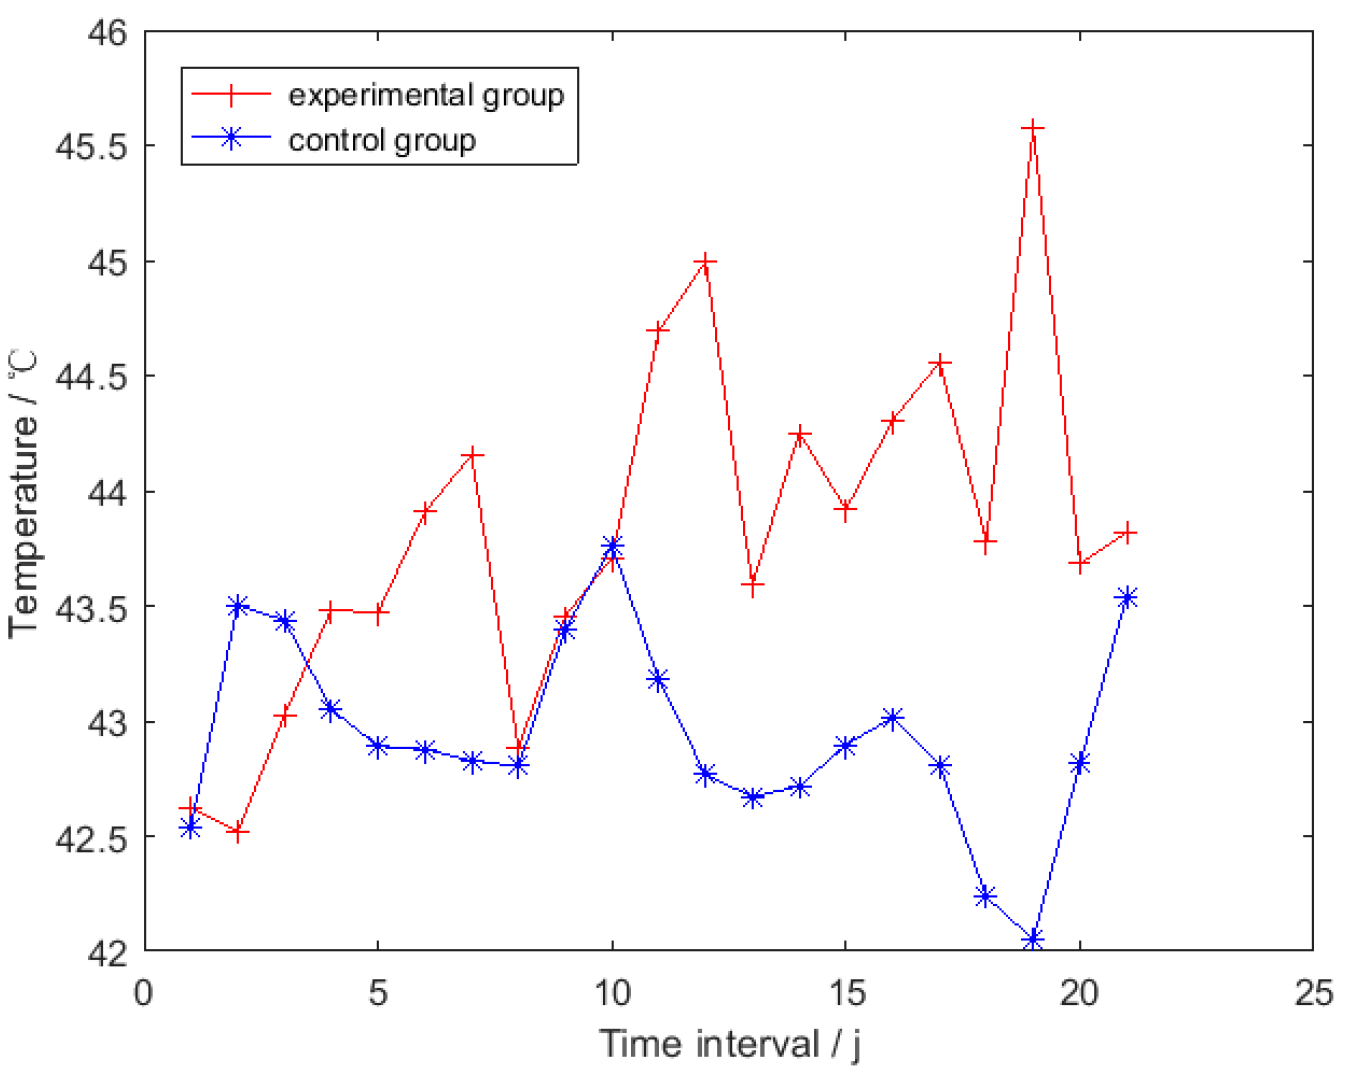
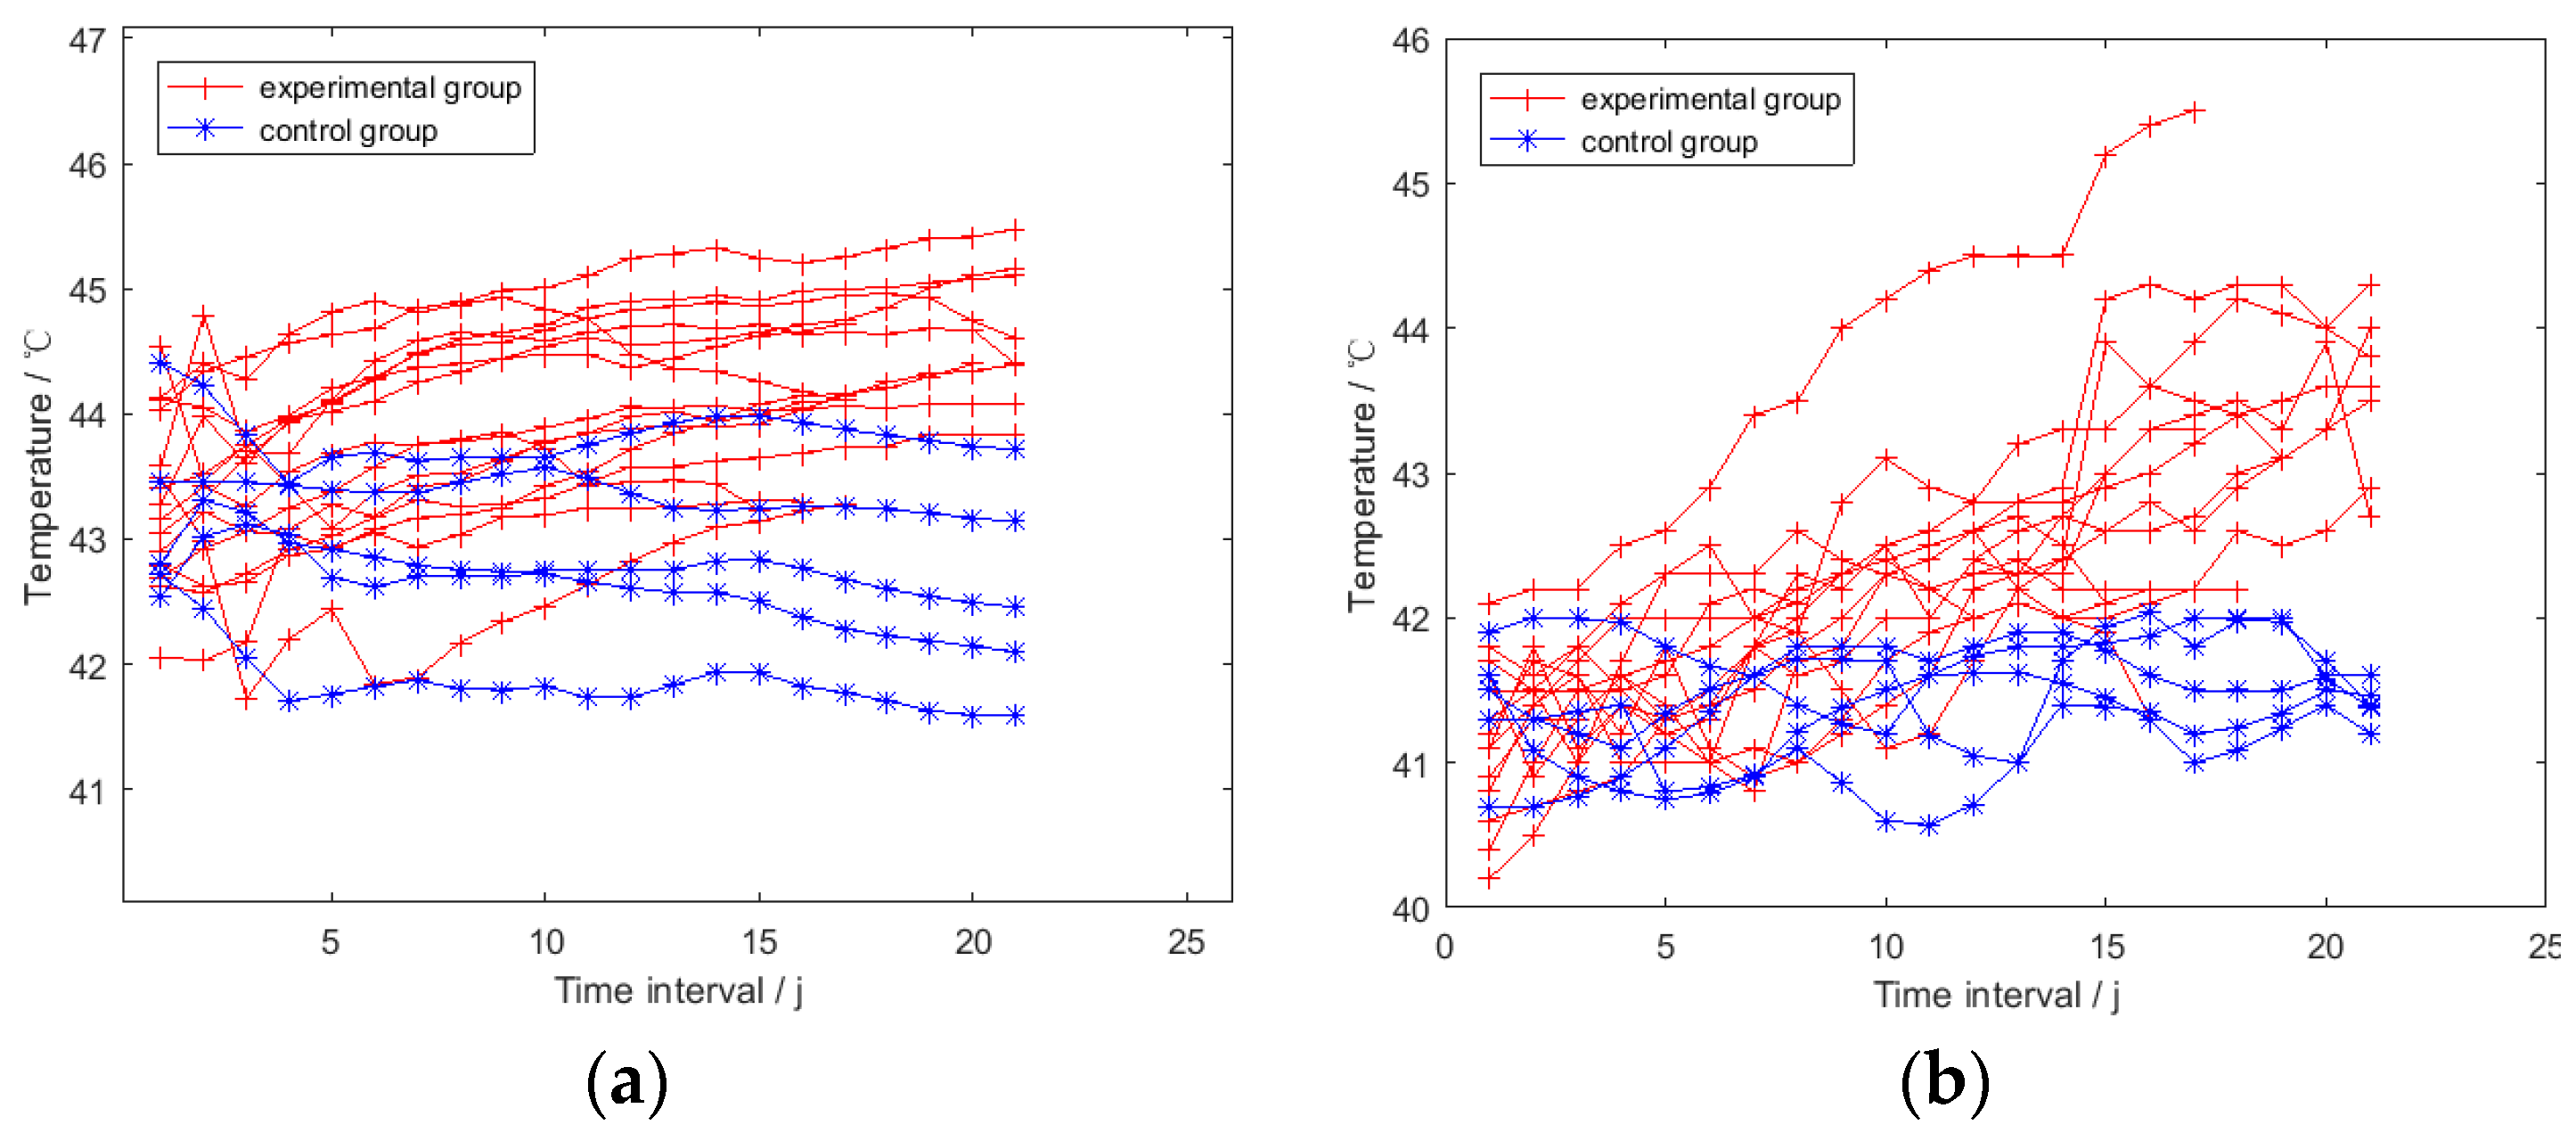
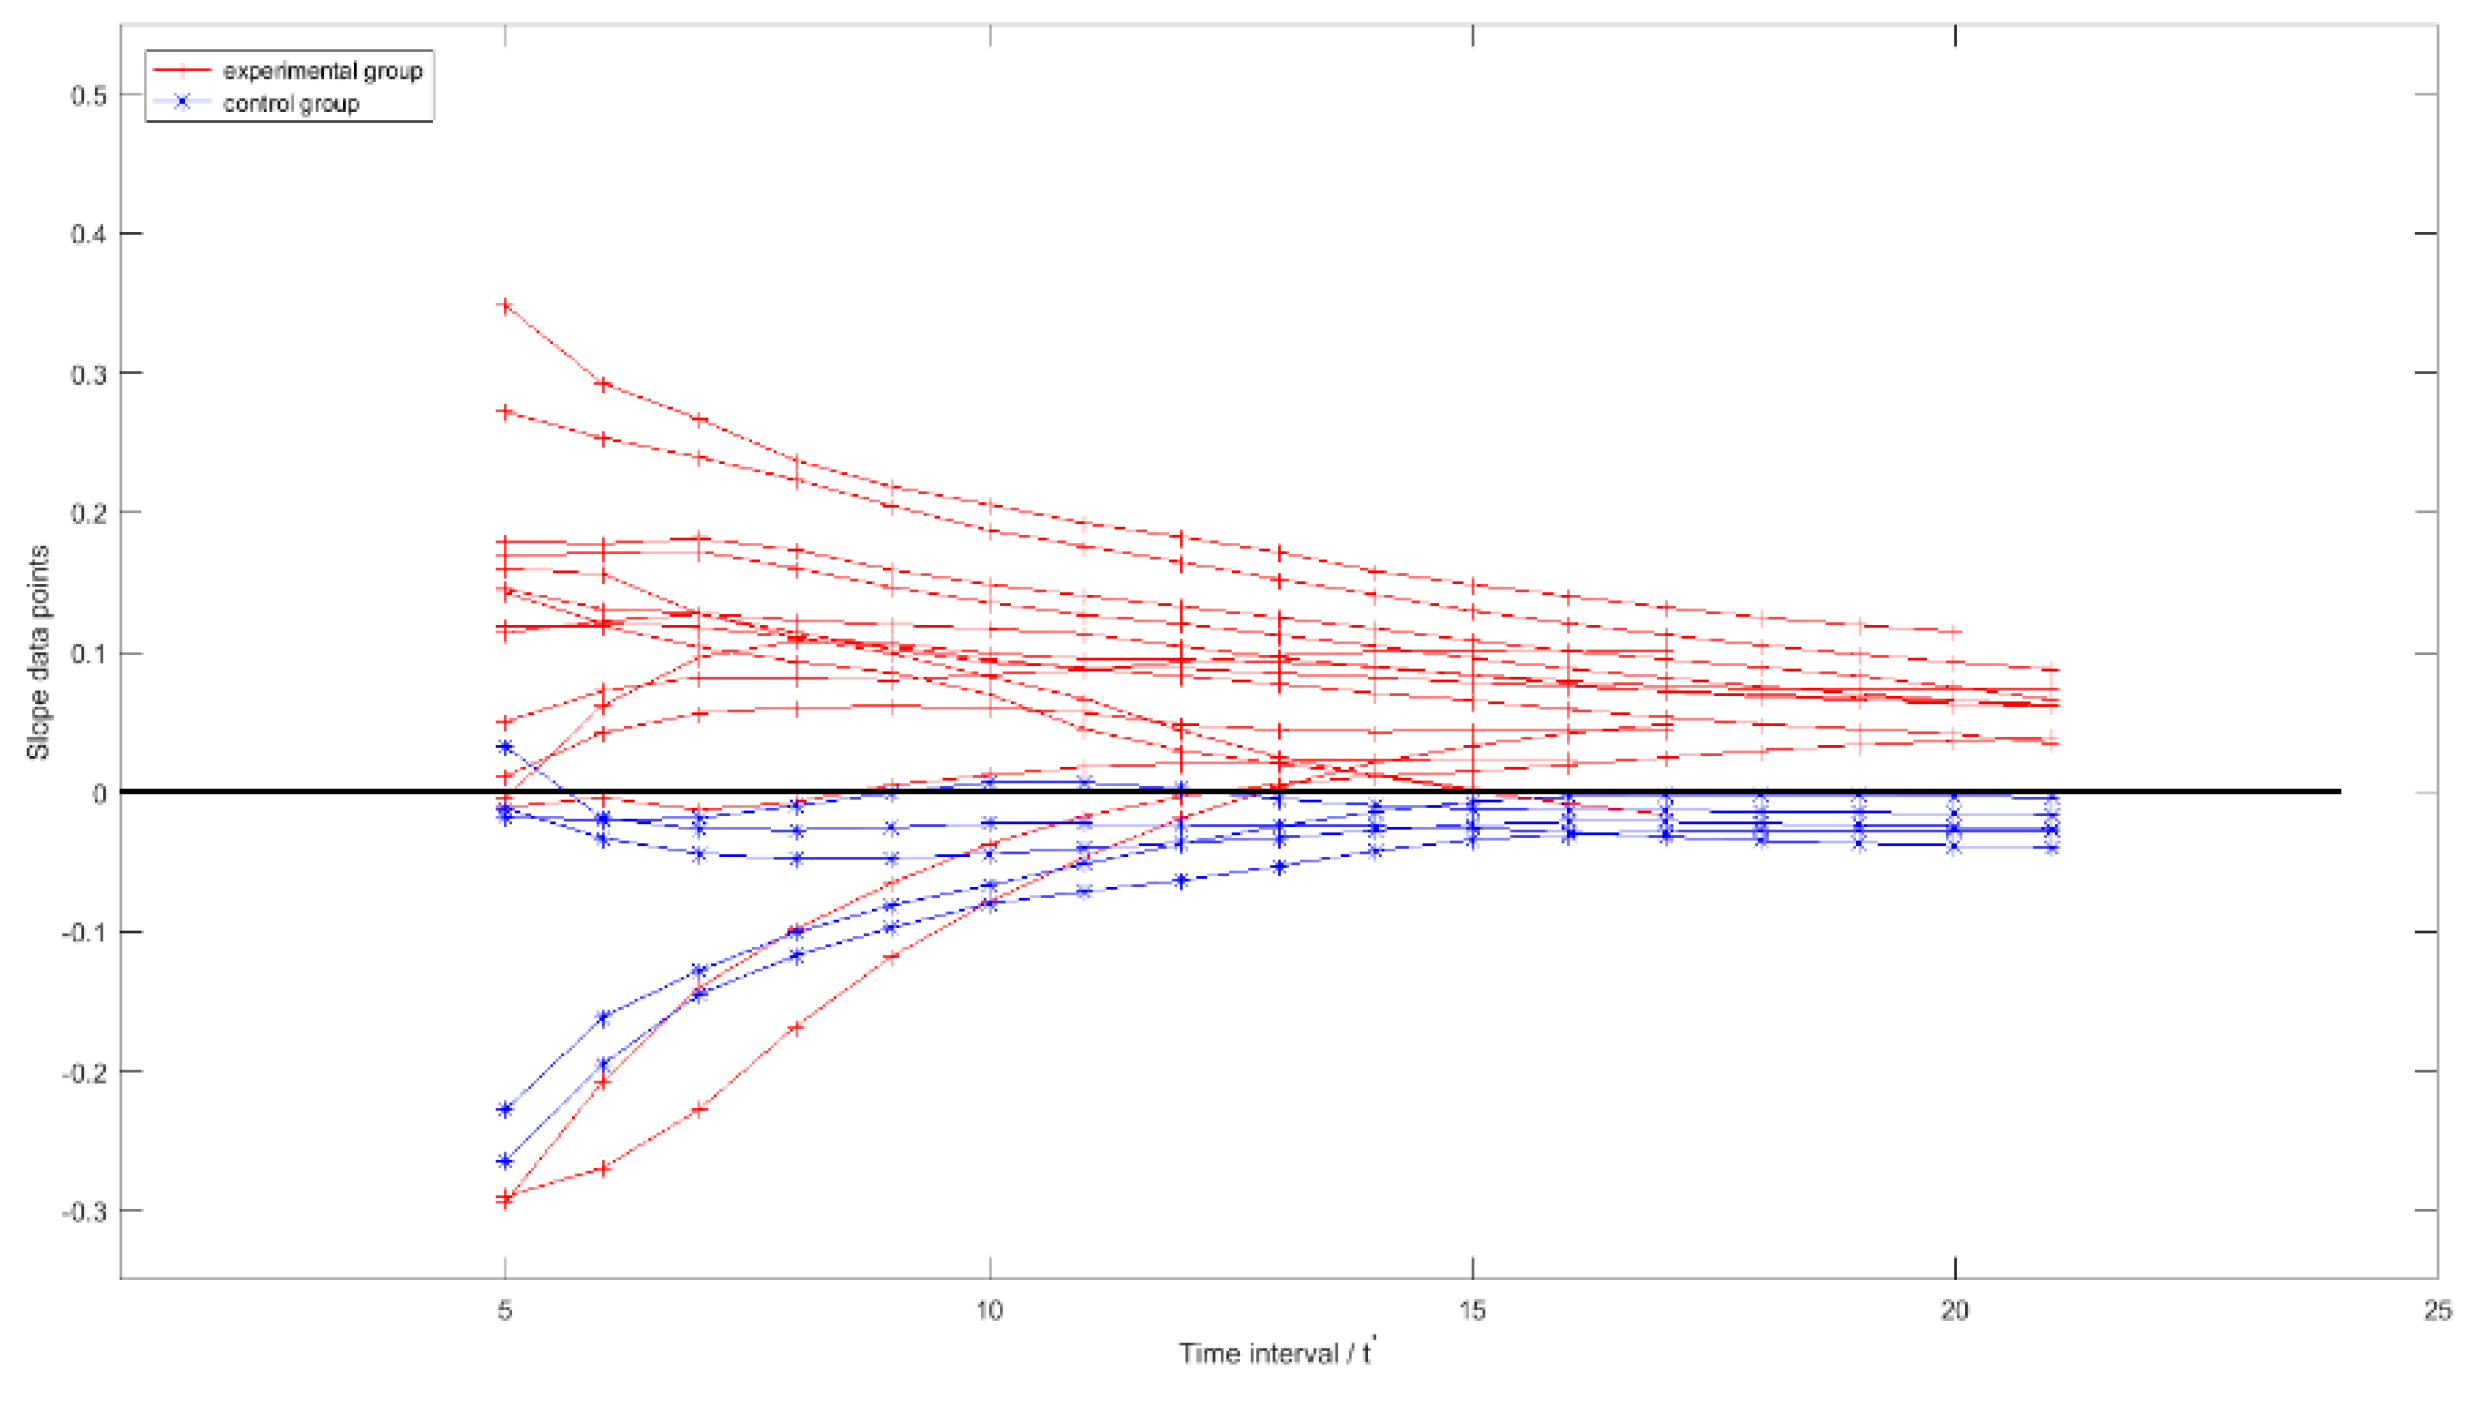
3.2. Overall Trend Analysis for the Smoothed TSRHT

It was observed in Figure 9a that overall trends of slight increase and flat existed in the smoothed TSRHT of broilers in experimental and control groups, respectively. Slope of the straight line fitted by the first t′ (t [5, NIHi], i [ 1 , 20 ] ) elements in a smoothed TSRHTi, which was denoted by S l o p e _ T S R H T i t , was used to describe these two different overall trend features. For the ith broiler, all of its S l o p e _ T S R H T i t formed a slope time series. This series was denoted by S l o p e _ T S R H T i and expressed in expression (11).
S l o p e _ T S R H T i = { S l o p e _ T S R H T i 5 , , S l o p e _ T S R H T i t , ,   S l o p e _ T S R H T i N I H i }   t [ 5 ,   N I H i ] ,   i [ 1 , 20 ]
As the maximum and minimum value of NIHi respectively was 15 and 21, quantity of the elements in each S l o p e _ T S R H T i was between 11 and 17. S l o p e _ T S R H T i of all the 20 broilers are plotted in Figure 13.
Where data points of the broilers in the experimental and control groups are displayed with red cross and blue star points, respectively, the black line is a boundary, which separates slope data points into positive and non-positive groups. For each given t′, the percentage of all the S l o p e _ T S R H T i t (i     [ 1 , 20 ] ) in the experimental and control groups that respectively had positive and non-positive values were listed in Table 2.
Preliminary statistical results in Table 2 indicated that from the 13th time interval on, almost all the S l o p e _ T S R H T i t of the smoothed TSRHT at each t′ in control and experimental groups had non-positive and positive values, respectively. It could be concluded that the positive or non-positive of the S l o p e _ T S R H T i t can be used to identify whether a broiler is febrile at a given time interval.

4. Discussion

An algorithm was developed to extract head surface temperature from top-view thermal image with an individual broiler. Algorithm testing result indicated that head regions in 7.23% of the thermal images were wrongly located. This would bring about a wrong head temperature, which would in turn influence the trend feature of the smoothed TSRHT. Therefore, thermal images, whose head region were wrongly located, were picked out manually before RHT was calculated. This set a barrier against the automatic identification of the febrile broiler. Aiming at this insufficiency, the following two possible solutions are worthy of further study in the future.
The first possible solution is to introduce more image information for head region locating. RGB and thermal cameras can be integrated together to capture RGB and thermal images for a broiler at the same time and from the same angle. Head region can be located based on the fused RGB and thermal images. Where the color of the comb, the shape, and context characters of the boiler head, combined with the fitted ellipse and the surface temperature distribution of the broiler body, can be integrated to improve the ratio of the correct locating of head region. The second possible solution is to identify febrile broiler based on the average temperature time series of all the high temperature regions in a broiler’s body surface. High temperature regions can be located much easier than the head region. However, the relationship between the under-wing temperature and the feature of the average temperature time series of the high temperature regions is still unknown and deserving further study.
It is important to note that the ambient temperature and relative humidity were respectively 27-30 °C and 55–65% in this study. Both of the environmental parameters were stable during the whole process of the thermal images collection. A great deal of studies indicated that ambient temperature and relative humidity had impacts on the animal’s superficial temperature [11]. That is to say, head surface temperature should be considered a dependent variable on several independent variables, such as animal body temperature, ambient temperature, relative humidity, and so on. However, for a different ambient temperature and relative humidity range, as long as the environmental parameters are stable, the same impact would be brought to all the data points in a smoothed TSRHT. That is to say, a different ambient temperature and relative humidity range would not influence the overall trend of the smoothed TSRHT. Therefore, head surface temperature extracted by HSTE should be suitable for febrile broiler identification in different ambient temperatures, as long as the variation range of the environment parameters are small.
Furthermore, it can be observed from Figure 13 that some non-positive data points appeared in the smoothed TSRHT of the broilers in the experimental group in the first several time intervals. If the positive or non-positive of S l o p e _ T S R H T i t is used to identify whether a broiler is febrile, a method to determine the start time of the febrile broiler identification should be developed in further study. Finally, different trend features were found in the smoothed TSRHT of febrile and non-febrile broilers. It can be inferred that a different proportion of febrile broilers in a broiler flock could bring different features of the population mean superficial temperature time series. Combined with the adhesive animal image segmentation methods [21,27,28], HSTE could be employed to extract population mean head surface temperature for broiler flocks. Therefore, the algorithm developed in this research can be regarded as a first step of the development of an automatic warning system for febrile broiler flocks.

5. Conclusions

Ellipse fitting and adaptive K-means clustering were integrated to extract broiler head surface temperature from top-view thermal image with individual broilers in this study. Algorithm testing results indicated that 92.77% of the thermal images could be processed correctly, and the maximum error of the extracted head temperatures was less than 0.1 °C. For the thermal images whose broiler head part was correctly located, correlation coefficient between the maximum temperatures extracted by the developed algorithm and by Smartview was 99.99%. Different overall trend features were observed in the smoothed representative head surface temperature time series (TSRHT) of febrile and non-febrile broilers. A slope time series was constructed based on the slopes of the straight lines fitted by the first several data points in each smoothed TSRHT. Preliminary statistical analyses were carried out for the signs (positive and non-positive) feature of these slope time series, and the result indicated that the signs feature of the data points in a slope time series can be used to identify whether a broiler is febrile or not. The presented method lays a foundation for the development of an automatic system for febrile broiler identification.

Author Contributions

The main contributions of each author of the manuscript were as follows, X.X.: data collection and analysis, algorithm development, programing of the algorithm, writing—original draft preparation; M.L.: funding acquisition, project administration, algorithm development, design of field experiments, writing—review and editing; W.Y.: algorithm testing, data curation; G.D.: setup of field experiment and data collection, data analysis; Q.Y.: setup of field experiments, selection and management of the experimental broilers; M.S.: funding acquisition, supervision of the whole study; T.N.: supervision of the whole study, writing—review and editing; D.B.: supervision of the whole study, writing—review and editing. All authors discussed the results and implications, and everyone provided helpful feedback. The manuscript was written by X.X. and M.L., and revised by all co-authors.

Funding

This work was funded by the National Natural Science Foundation of China (Nr. 31972615), the Key projects of intergovernmental cooperation in international scientific and technological innovation (Nr. 2017YFE0114400), and the “13th Five-Year” National Key R&D Plan Project of China (Nr. 2017YFD0701600). This work was also supported by the Key Project of R&D of Jiangsu Science and Technology Department (Nr. BE2018433), the Natural Science Foundation of Jiangsu Province (Nr. BK20191315), and the Key Project of R&D of Changzhou Science and Technology Department (Nr. CE20172005).

Acknowledgments

All experiments were carried out in compliance with and using protocols approved by the biosafety committee of Nanjing Agricultural University. The handling of the boilers was performed in accordance with the guidelines approved by the experimental animal administration and ethics committee of Nanjing Agricultural University. All the authors would like to acknowledge the work done by Xianchen Meng (animal experimenter of Jiangsu Lihua Animal Husbandry CO., LTD.) in the setup and implementation of the wireless wearable sensor based broiler under-wing temperature monitoring system.

Conflicts of Interest

The authors declare no conflict of interest.

References

  1. Giloh, M.; Shinder, D.; Yahav, S. Skin surface temperature of broiler chickens is correlated to body core temperature and is indicative of their thermoregulatory status. Poult. Sci. 2012, 91, 175–188. [Google Scholar] [CrossRef] [PubMed]
  2. Moller, A.P. Body temperature and fever in a free-living bird. Comp. Biochem. Physiol. B Biochem. Mol. Biol. 2010, 156, 68–74. [Google Scholar] [CrossRef] [PubMed]
  3. Cooper, M.A.; Washburn, K.W. The relationships of body temperature to weight gain, feed consumption, and feed utilization in broilers under heat stress. Poult. Sci. 1998, 77, 237–242. [Google Scholar] [CrossRef] [PubMed]
  4. Iwasaki, W.; Ishida, S.; Kondo, D.; Ito, Y.; Tateno, J.; Tomioka, M. Monitoring of the core body temperature of cows using implantable wireless thermometers. Comp. Electron. Agricult. 2019, 163, 104849. [Google Scholar] [CrossRef]
  5. Nogami, H.; Arai, S.; Okada, H.; Zhan, L.; Itoh, T. Minimized bolus-type wireless sensor node with a built-in three-axis acceleration meter for monitoring a Cow’s Rumen conditions. Sensors 2017, 17, 687. [Google Scholar] [CrossRef]
  6. Andersson, L.M.; Okada, H.; Miura, R.; Zhang, Y.; Yoshioka, K.; Aso, H.; Itoh, T. Wearable wireless estrus detection sensor for cows. Comp. Electron. Agricult. 2016, 127, 101–108. [Google Scholar] [CrossRef]
  7. Reid, E.; Fried, K.; Velasco, J.; Dahl, G. Correlation of rectal temperature and peripheral temperature from implantable radio-frequency microchips in Holstein steers challenged with lipopolysaccharide under thermoneutral and high ambient temperatures. J. Anim. Science 2012, 90, 4788–4794. [Google Scholar] [CrossRef]
  8. Li, L.; Chen, H.; Yu, H.; Huang, R.; Huo, L. Dynamic monitoring device of hens temperature based on wireless transmission. Trans. Chin. Soc. Agricult. Mach. 2013, 6, 242–245. [Google Scholar]
  9. Zaninelli, M.; Redaelli, V.; Luzi, F.; Bronzo, V.; Mitchell, M.; Dell’Orto, V.; Bontempo, V.; Cattaneo, D.; Savoini, G. First evaluation of infrared thermography as a tool for the monitoring of udder health status in farms of dairy cows. Sensors 2018, 18, 862. [Google Scholar] [CrossRef]
  10. Alsaaod, M.; Schaefer, A.; Büscher, W.; Steiner, A. The role of infrared thermography as a non-invasive tool for the detection of lameness in cattle. Sensors 2015, 15, 14513–14525. [Google Scholar] [CrossRef]
  11. Soerensen, D.D.; Pedersen, L.J. Infrared skin temperature measurements for monitoring health in pigs: A review. Acta Veterinaria Scandinavica 2015, 57, 5. [Google Scholar] [CrossRef] [PubMed]
  12. LokeshBabu, D.S.; Jeyakumar, S.; Vasant, P.J.; Sathiyabarathi, M.; Manimaran, A.; Kumaresan, A.; Pushpadass, H.A.; Sivaram, M.; Ramesha, K.P.; Kataktalware, M.A. Siddaramanna, Monitoring foot surface temperature using infrared thermal imaging for assessment of hoof health status in cattle: A review. J. Therm. Biol. 2018, 78, 10–21. [Google Scholar]
  13. Schaefer, A.L.; Cook, N.; Tessaro, S.V.; Deregt, D.; Desroches, G.; Dubeski, P.L.; Tong, A.K.W.; Godson, D.L. Early detection and prediction of infection using infrared thermography. Can. J. Anim. Sci. 2004, 84, 73–80. [Google Scholar] [CrossRef]
  14. Liu, X.; Liu, Y.; Liu, X.; Cao, C.; Lu, H.; Wang, F.; Ge, Y.; Lu, Y. Feasibility study for the use of surface-temperature discriminant poultry health. In 2017 ASABE Annual International Meeting; ASABE: St. Joseph, MI, USA, 2017; p. 1. [Google Scholar]
  15. Naeaes, I.d.A.; Bites Romanini, C.E.; Neves, D.P.; do Nascimento, G.R.; Vercellino, R.d.A. Broiler surface temperature distribution of 42 day old chickens. Scientia Agricola 2010, 67, 497–502. [Google Scholar] [CrossRef]
  16. McManus, C.; Tanure, C.B.; Peripolli, V.; Seixas, L.; Fischer, V.; Gabbi, A.M.; Menegassi, S.R.; Stumpf, M.T.; Kolling, G.J.; Dias, E. Infrared thermography in animal production: An overview. Comp. Electron. Agricult. 2016, 123, 10–16. [Google Scholar] [CrossRef]
  17. Otsu, N. A threshold selection method from gray-level histograms. IEEE Trans. Syst. Man Cybernet. 1979, 9, 62–66. [Google Scholar] [CrossRef]
  18. Vincent, L. Morphological area openings and closings for grey-scale images. In Shape in Picture; Springer: Cham, Switzerland, 1994; pp. 197–208. [Google Scholar]
  19. Barber, C.B.; Dobkin, D.P.; Huhdanpaa, H. The Quickhull algorithm for convex hulls. ACM Trans. Math. Software 1996, 22, 469–483. [Google Scholar] [CrossRef]
  20. Halir, R.; Flusser, J. Numerically Stable Direct Least Squares Fitting of Ellipses; University of West Bohemia Press: Plzen, Czech Republic, 1998; pp. 125–132. [Google Scholar]
  21. Lu, M.; Xiong, Y.; Li, K.; Liu, L.; Yan, L.; Ding, Y.; Lin, X.; Yang, X.; Shen, M. An automatic splitting method for the adhesive piglets’ gray scale image based on the ellipse shape feature. Comp. Electron. Agricult. 2016, 120, 53–62. [Google Scholar] [CrossRef]
  22. Canny, J. A computational approach to edge detection. IEEE Trans. Pattern Anal. Mach. Intell. 1986, 8, 679–698. [Google Scholar] [CrossRef]
  23. Arthur, D.; Vassilvitskii, S. Siam/Acm, k-Means Plus Plus: The Advantages of Careful Seeding; IEEE: Piscataway, NJ, USA, 2007; pp. 1027–1035. [Google Scholar]
  24. Leisch, F. A toolbox for -centroids cluster analysis. Comput. Stat. Data Anal. 2006, 51, 526–544. [Google Scholar] [CrossRef]
  25. Meltzer, A. The effect of body temperature on the growth rate of broilers. Br. Poult. Sci. 1983, 24, 489–495. [Google Scholar] [CrossRef] [PubMed]
  26. Donkoh, A. Ambient-temperature—A factor affecting performance and physiological-response of broiler-chickens. Int. J. Biometeorol. 1989, 33, 259–265. [Google Scholar] [CrossRef] [PubMed]
  27. Nasirahmadi, A.; Richter, U.; Hensel, O.; Edwards, S.; Sturm, B. Using machine vision for investigation of changes in pig group lying patterns. Comp. Electron. Agricult. 2015, 119, 184–190. [Google Scholar] [CrossRef]
  28. Psota, E.T.; Mittek, M.; Pérez, L.C.; Schmidt, T.; Mote, B. Multi-pig part detection and association with a fully-convolutional network. Sensors 2019, 19, 852. [Google Scholar] [CrossRef] [Green Version]
Figure 1. Image system.
Sensors 19 05286 g001
Figure 2. Temperature matrix and thermal image of an IS2 file: (a) Temperature matrix; (b) The corresponding thermal image.
Sensors 19 05286 g002
Figure 3. Image pre-processing: (a) Grayscale image; (b) Binary image; (c) Image after morphological processing; (d) Convex hull image.
Sensors 19 05286 g003
Figure 4. Ellipse fitting for individual broiler body contour: (a) The contour of the convex hull image shown in Figure 3d; (b) The fitted ellipse.
Sensors 19 05286 g004
Figure 5. Flowchart of the candidate head regions extraction.
Sensors 19 05286 g005
Figure 6. Head region locating: (a) The final high temperature regions extracted from the image in Figure 2a; (b) The candidate head regions; (c) The alternative head regions; (d) The extracted head region; (e) Relationship between the extracted head region and the gray-scale thermal image.
Sensors 19 05286 g006
Figure 7. Examples of the head region locating: (ac) Head region locating by using case 1; (df) Head region locating by using case 3.
Sensors 19 05286 g007
Figure 8. Representative head surface temperature (RHT) time series.
Sensors 19 05286 g008
Figure 9. The smoothed representative head surface temperature time series (TSRHT) and under-wing temperature time series: (a) The smoothed TSRHT time series; (b) Under-wing temperature time series.
Sensors 19 05286 g009
Figure 10. Example image of each category: (af) Example images of category (i)–(vi).
Sensors 19 05286 g010
Figure 11. Head temperature extraction: (a) Head temperature extracted manually by using Smartview; (b) Head temperature extracted automatically by HSTE.
Sensors 19 05286 g011
Figure 12. The errors between head temperatures extracted automatically by HSTE and by using Smartview.
Sensors 19 05286 g012
Figure 13. Slope series of each smoothed TSRHTi.
Sensors 19 05286 g013
Table 1. Ratio of correct locating of head region for images in different categories.
Category(i)(ii)(iii)(iv)(v)(vi)
Number of images4178584929513976
Number of correct locating3274580627011856
Ratio of correct locating78.05%94.90%94.94%91.53%84.89%73.68%
Table 2. Percentage of positive and non-positive values for different t′.
t56789101112131415161718192021
E(%)7380808086.786.786.786.710010010092.992.3100100100100
C(%)80100100100100808080100100100100100100100100100
E: experimental group; C: control group.

