Gas Detection Using Portable Deep-UV Absorption Spectrophotometry: A Review


Abstract
1. Introduction
2. UV Spectrophotometry
3. UV Sources
3.1. General Overview
3.2. Challenges and the Latest Advancement
4. Optical Gas Cell
4.1. General Overview
4.2. Challenges and the Latest Advancement
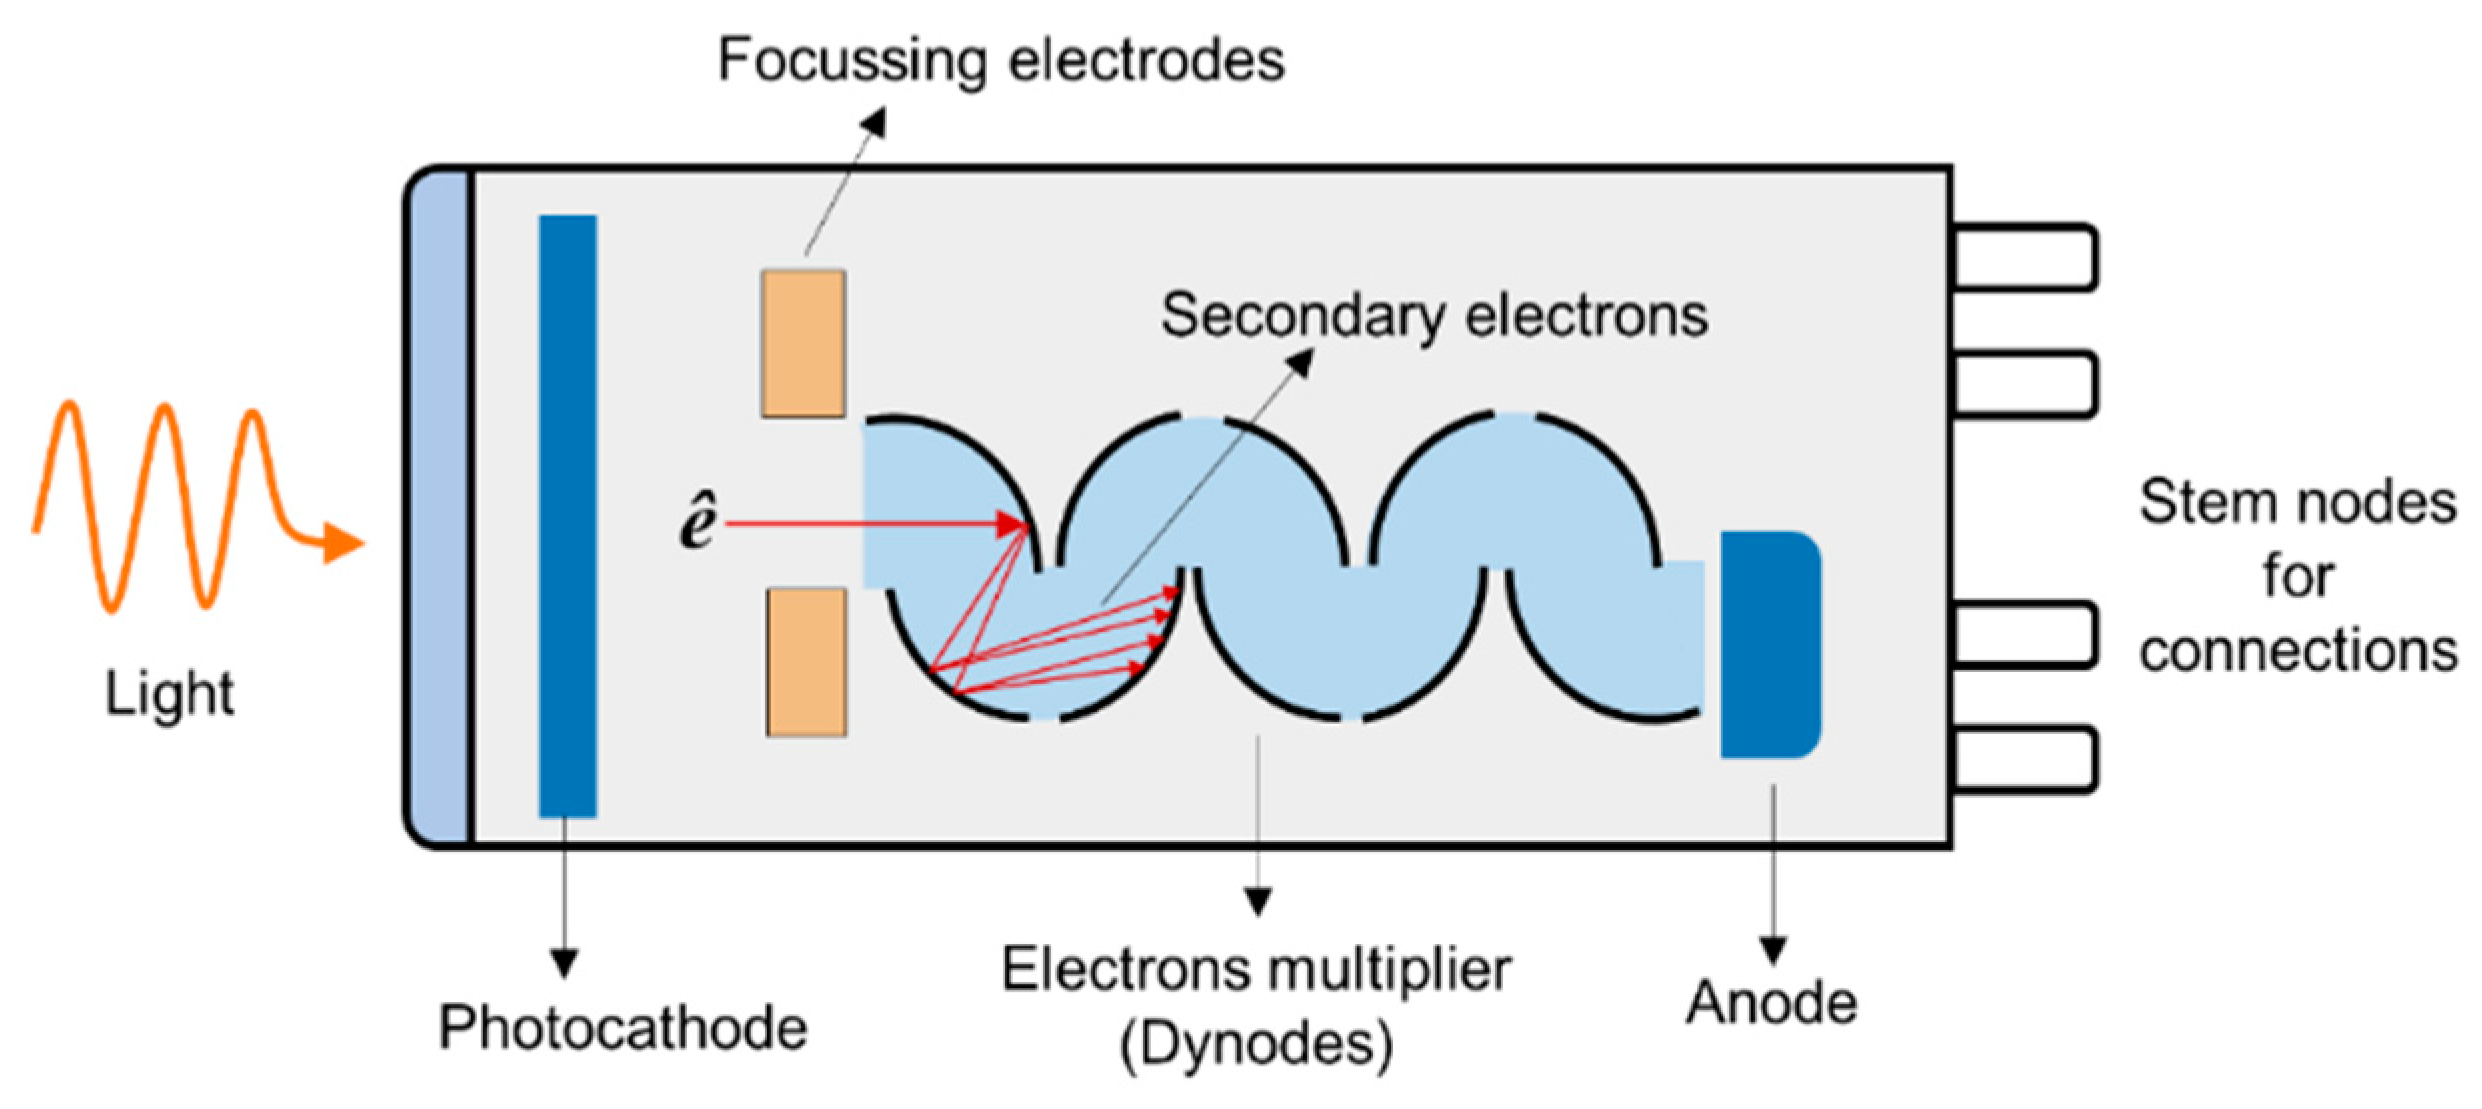
5. UV Photodetectors
5.1. General Overview
5.2. Challenges and the Latest Advancement
6. Applications of Deep-UV Absorption Spectrophotometry
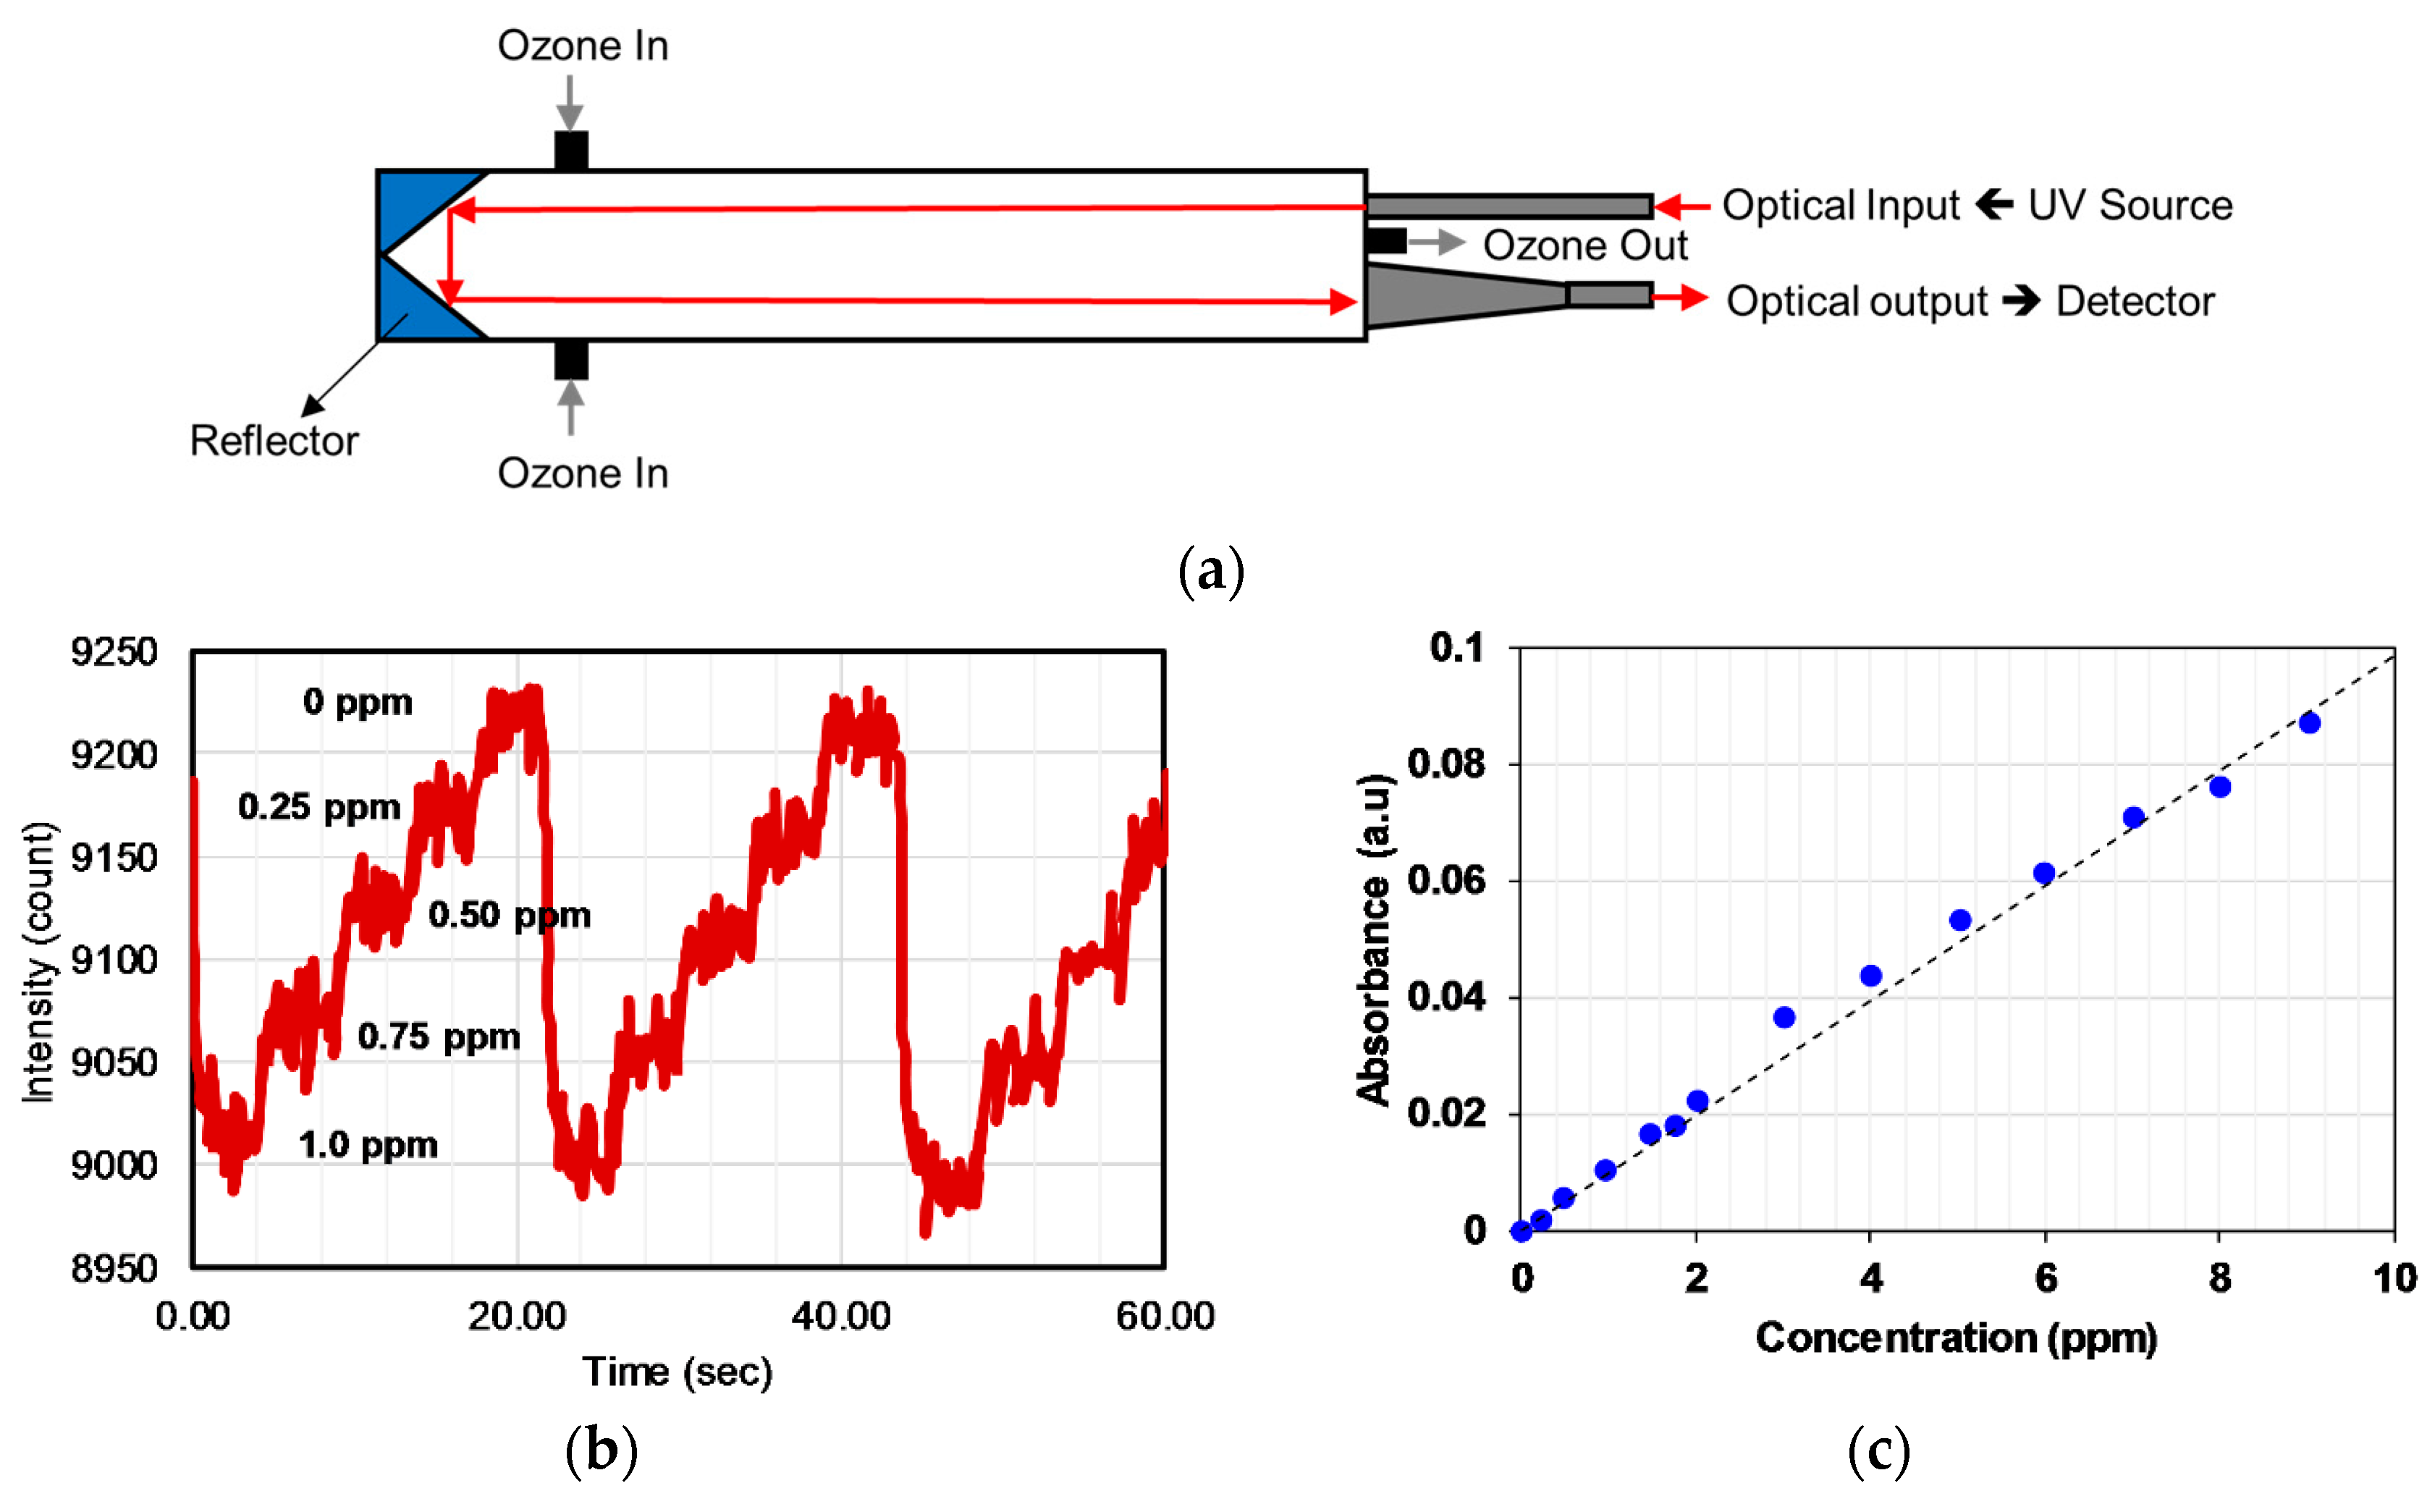
6.1. Ozone
6.2. Nitric Oxide (NO2) and Sulfur Dioxide (SO2)
6.3. BTEX
7. Conclusions and Outlook
Author Contributions
Funding
Conflicts of Interest
References
- Marć, M.; Tobiszewski, M.; Zabiegała, B.; de la Guardia, M.; Namieśnik, J. Current air quality analytics and monitoring: A review. Anal. Chim. Acta 2015, 853, 116–126. [Google Scholar] [CrossRef] [PubMed]
- Mustafa, F.; Andreescu, S. Chemical and biological sensors for food-quality monitoring and smart packaging. Foods 2018, 7, 168. [Google Scholar] [CrossRef] [PubMed]
- Santhanam, K.; Ahamed, N. Greenhouse Gas Sensors Fabricated with New Materials for Climatic Usage: A Review. ChemEngineering 2018, 2, 38. [Google Scholar] [CrossRef]
- Docquier, N.; Candel, S. Combustion control and sensors: A review. Prog. Energy Combust. Sci. 2002, 28, 107–150. [Google Scholar] [CrossRef]
- Gao, Q.; Su, X.; Annabi, M.H.; Schreiter, B.R.; Prince, T.; Ackerman, A.; Morgas, S.; Mata, V.; Williams, H.; Lee, W.Y. Application of Urinary Volatile Organic Compounds (VOCs) for the Diagnosis of Prostate Cancer. Clin. Genitourin. Cancer 2019, 17, 183–190. [Google Scholar] [CrossRef] [PubMed]
- Woollam, M.; Teli, M.; Angarita-Rivera, P.; Liu, S.; Siegel, A.P.; Yokota, H.; Agarwal, M. Detection of Volatile Organic Compounds (VOCs) in Urine via Gas Chromatography-Mass Spectrometry QTOF to Differentiate Between Localized and Metastatic Models of Breast Cancer. Sci. Rep. 2019, 9, 2526. [Google Scholar] [CrossRef]
- Mirzaei, A.; Kim, J.H.; Kim, H.W.; Kim, S.S. Resistive-based gas sensors for detection of benzene, toluene and xylene (BTX) gases: A review. R. Soc. Chem. 2018, 6, 4342–4370. [Google Scholar] [CrossRef]
- Zhou, X.; Lee, S.; Xu, Z.; Yoon, J. Recent Progress on the Development of Chemosensors for Gases. Chem. Rev. 2015, 115, 7944–8000. [Google Scholar] [CrossRef]
- Rezende, G.C.; Le Calvé, S.; Brandner, J.J.; Newport, D. Micro photoionization detectors. Sens. Actuators B Chem. 2019, 287, 86–94. [Google Scholar] [CrossRef]
- Spinelle, L.; Gerboles, M.; Kok, G.; Persijn, S.; Sauerwald, T. Review of Portable and Low-Cost Sensors for the Ambient Air Monitoring of Benzene and Other Volatile Organic Compounds. Sensors 2017, 17, 1520. [Google Scholar] [CrossRef]
- Devkota, J.; Ohodnicki, P.; Greve, D. SAW Sensors for Chemical Vapors and Gases. Sensors 2017, 17, 801. [Google Scholar] [CrossRef] [PubMed]
- Liu, X.; Cheng, S.; Liu, H.; Hu, S.; Zhang, D.; Ning, H. A Survey on Gas Sensing Technology. Sensors 2012, 12, 9635–9665. [Google Scholar] [CrossRef] [PubMed]
- McDonagh, C.; Burke, C.S.; MacCraith, B.D. Optical chemical sensors. Chem. Rev. 2008, 108, 400–422. [Google Scholar] [CrossRef] [PubMed]
- Hodgkinson, J.; Tatam, R.P. Optical gas sensing: A review. Meas. Sci. Technol. 2013, 24, 012004. [Google Scholar] [CrossRef]
- Mikolajczyk, J. Detection of gaseous compounds with different techniques. Metrol. Meas. Syst. 2016, 23, 202–224. [Google Scholar] [CrossRef]
- Qazi, H.; Mohammad, A.; Akram, M. Recent Progress in Optical Chemical Sensors. Sensors 2012, 12, 16522–16556. [Google Scholar] [CrossRef] [PubMed]
- Lackner, M. Tunable diode laser absorption spectroscopy (TDLAS) in the process industries-A review. Rev. Chem. Eng. 2007, 23, 65–147. [Google Scholar] [CrossRef]
- Gordon, I.E.; Rothman, L.S.; Hill, C.; Kochanov, R.V.; Tan, Y.; Bernath, P.F.; Birk, M.; Boudon, V.; Campargue, A.; Chance, K.V.; et al. The HITRAN2016 molecular spectroscopic database. J. Quant. Spectrosc. Radiat. Transf. 2017, 203, 3–69. [Google Scholar] [CrossRef]
- Pena-Pereira, F.; Costas-Mora, I.; Romero, V.; Lavilla, I.; Bendicho, C. Advances in miniaturized UV-Vis spectrometric systems. TrAC Trends Anal. Chem. 2011, 30, 1637–1648. [Google Scholar] [CrossRef]
- Marcus, T.C.E.; Ibrahim, M.H.; Ngajikin, N.H.; Azmi, A.I. Optical path length and absorption cross section optimization for high sensitivity ozone concentration measurement. Sens. Actuators B Chem. 2015, 221, 570–575. [Google Scholar] [CrossRef]
- Marcus, T.C.E.; Ibrahim, M.H.; Ngajikin, N.H.; Azmi, A.I. Transmittance optimization for high sensitivity ozone concentration measurement. Sens. Actuators B Chem. 2016, 229, 528–533. [Google Scholar] [CrossRef]
- Degner, M.; Ewald, H.; Lewis, E. LED based spectroscopy-A low cost solution for high resolution concentration measurements e.g. for gas monitoring applications. In Proceedings of the 2011 Fifth International Conference on Sensing Technology, Palmerston North, New Zealand, 28 November–1 December 2011; pp. 145–150. [Google Scholar]
- Li, Y.; Dvořák, M.; Nesterenko, P.N.; Nuchtavorn, N.; Macka, M. High power deep UV-LEDs for analytical optical instrumentation. Sens. Actuators B Chem. 2018, 255, 1238–1243. [Google Scholar] [CrossRef]
- Khan, S.; Newport, D.; Le Calvé, S. Development of a Toluene Detector Based on Deep UV Absorption Spectrophotometry Using Glass and Aluminum Capillary Tube Gas Cells with a LED Source. Micromachines 2019, 10, 193. [Google Scholar] [CrossRef] [PubMed]
- Light &Amp; Radiation Sources | Hamamatsu Photonics. Available online: https://www.hamamatsu.com/eu/en/product/light-and-radiation-sources/index.html. (accessed on 22 September 2019).
- Coulter, A.M. Minamata Convention on Mercury. Int. Leg. Mater. 2016, 55, 582. [Google Scholar] [CrossRef]
- Schubert, E.F. Light-Emitting Diodes; Cambridge University Press: Cambridge, UK, 2006. [Google Scholar]
- Krames, M.R.; Shchekin, O.B.; Mueller-Mach, R.; Mueller, G.O.; Zhou, L.; Harbers, G.; Craford, M.G. Status and Future of High-Power Light-Emitting Diodes for Solid-State Lighting. J. Disp. Technol. 2007, 3, 160–175. [Google Scholar] [CrossRef]
- Chang, H.M.; Das, D.; Varde, P.V.; Pecht, M. Light emitting diodes reliability review. Microelectron. Reliab. 2012, 52, 762–782. [Google Scholar] [CrossRef]
- Bui, D.A.; Hauser, P.C. Analytical devices based on light-emitting diodes-A review of the state-of-the-art. Anal. Chim. Acta 2015, 853, 46–58. [Google Scholar] [CrossRef]
- Macka, M.; Piasecki, T.; Dasgupta, P.K. Light-Emitting Diodes for Analytical Chemistry. Ann. Rev. Anal. Chem. 2014, 7, 183–207. [Google Scholar] [CrossRef]
- Noori, A.; Mahbub, P.; Dvořák, M.; Lucieer, A.; Macka, M. Radiometric analysis of UV to near infrared LEDs for optical sensing and radiometric measurements in photochemical systems. Sens. Actuators B Chem. 2018, 262, 171–179. [Google Scholar] [CrossRef]
- Venugopalan, H. UVC LEDs enable cost-effective spectroscopic instruments. Laser Focus World 2015, 51, 81–85. [Google Scholar]
- Cooke, M. Going deep for UV sterilization LEDs. Semicond. Today 2010, 5, 82–88. [Google Scholar]
- Krčmová, L.; Stjernlof, A.; Mehlen, S.; Hauser, P.C.; Abele, S.; Paull, B.; Macka, M. Deep-UV-LEDs in photometric detection: A 255 nm LED on-capillary detector in capillary electrophoresis. Analyst 2009, 134, 2394. [Google Scholar] [CrossRef] [PubMed]
- Nikishin, S.A.; Kuryatkov, V.V.; Chandolu, A.; Borisov, B.A.; Kipshidze, G.D.; Ahmad, I.; Holtz, M.; Temkin, H. Deep Ultraviolet Light Emitting Diodes Based on Short Period Superlattices of AlN/AlGa(In)N. Jpn. J. Appl. Phys. 2003, 42, 1362–1365. [Google Scholar] [CrossRef]
- Shatalov, M.; Chitnis, A.; Mandavilli, V.; Pachipulusu, R.; Zhang, J.P.; Adivarahan, V.; Wu, S.; Simin, G.; Khan, M.A.; Tamulaitis, G.; et al. Time-resolved electroluminescence of AlGaN-based light-emitting diodes with emission at 285 nm. Appl. Phys. Lett. 2003, 82, 167–169. [Google Scholar] [CrossRef]
- Park, S.J.; Fothergill, D.W.; Wellenius, P.; Bishop, S.M.; Muth, J.F.; Davis, R.F. Origins of Parasitic Emissions from 353 nm AlGaN-based Ultraviolet Light Emitting Diodes over SiC Substrates. Jpn. J. Appl. Phys. 2006, 45, 4083–4086. [Google Scholar] [CrossRef]
- Chen, K.X.; Dai, Q.; Lee, W.; Kim, J.K.; Schubert, E.F.; Liu, W.; Wu, S.; Li, X.; Smart, J.A. Parasitic sub-band-gap emission originating from compensating native defects in Si doped AlGaN. Appl. Phys. Lett. 2007, 91, 121110. [Google Scholar] [CrossRef]
- Bui, D.A.; Bomastyk, B.; Hauser, P.C. Absorbance detector based on a deep UV light emitting diode for narrow-column HPLC. J. Sep. Sci. 2013, 36, 3152–3157. [Google Scholar] [CrossRef]
- Bui, D.A.; Kraiczek, K.G.; Hauser, P.C. Molecular absorption measurements with an optical fibre coupled array of ultra-violet light-emitting diodes. Anal. Chim. Acta 2017, 986, 95–100. [Google Scholar] [CrossRef]
- Bomastyk, B.; Petrovic, I.; Hauser, P.C. Absorbance detector for high-performance liquid chromatography based on light-emitting diodes for the deep-ultraviolet range. J. Chromatogr. A 2011, 1218, 3750–3756. [Google Scholar] [CrossRef]
- Da Silveira Petruci, J.F.; Liebetanz, M.G.; Cardoso, A.A.; Hauser, P.C. Absorbance detector for high performance liquid chromatography based on a deep-UV light-emitting diode at 235 nm. J. Chromatogr. A 2017, 1512, 143–146. [Google Scholar] [CrossRef]
- Matsuura, Y.; Hongo, A.; Miyagi, M. Dielectric-coated metallic hollow waveguide for 3-μm Er:YAG, 5-μm CO, and 106-μm CO2 laser light transmission. Appl. Opt. 1990, 29, 2213. [Google Scholar] [CrossRef] [PubMed]
- Nubling, R.K.; Harrington, J.A. Hollow-waveguide delivery systems for high-power, industrial CO2lasers. Appl. Opt. 1996, 35, 372. [Google Scholar] [CrossRef] [PubMed]
- Sanghera, J.; Aggarwal, I.D. Infrared Fiber Optics; CRC Press: Boca Raton, FL, USA, 1998. [Google Scholar]
- Frey, C.M.; Luxenburger, F.; Droege, S.; Mackoviak, V.; Mizaikoff, B. Near-infrared hollow waveguide gas sensors. Appl. Spectrosc. 2011, 65, 1269–1274. [Google Scholar] [CrossRef] [PubMed]
- Charlton, C.; Inberg, A.; Croitoru, N.; Mizaikoff, B. Hollow waveguide infrared gas sensing for biomedical applications. In Optical Fibers and Sensors for Medical Applications III; SPIE: Bellingham, DC, USA, 2003; Volume 4957, pp. 116–123. [Google Scholar]
- Temelkuran, B.; Hart, S.D.; Benoit, G.; Joannopoulos, J.D.; Fink, Y. Wavelength-scalable hollow optical fibres with large photonic bandgaps for CO2 laser transmission. Nature 2002, 420, 650–653. [Google Scholar] [CrossRef] [PubMed]
- Fink, Y.; Winn, J.N.; Fan, S.; Chen, C.; Michel, J.; Joannopoulos, J.D.; Thomas, E.L. A dielectric omnidirectional reflector. Science 1998, 282, 1679–1682. [Google Scholar] [CrossRef] [PubMed]
- Hawkins, A.R.; Schmidt, H. Optofluidic waveguides: II. Fabrication and structures. Microfluid. Nanofluid. 2007, 4, 17–32. [Google Scholar] [CrossRef]
- Kim, S.S.; Menegazzo, N.; Young, C.; Chan, J.; Carter, C.; Mizaikoff, B. Mid-Infrared Trace Gas Analysis with Single-Pass Fourier Transform Infrared Hollow Waveguide Gas Sensors. Appl. Spectrosc. 2009, 63, 331–337. [Google Scholar] [CrossRef]
- Chen, J.; Hangauer, A.; Strzoda, R.; Fleischer, M.; Amann, C.M. Low-level and ultralow-volume hollow waveguide based carbon monoxide sensor. Opt. Lett. 2010, 35, 3577–3579. [Google Scholar] [CrossRef][Green Version]
- Li, J.; Luo, G.; Du, Z.; Ma, Y. Hollow waveguide enhanced dimethyl sulfide sensor based on a 3.3 μm interband cascade laser. Sens. Actuators B Chem. 2018, 255, 3550–3557. [Google Scholar] [CrossRef]
- Francis, D.; Hodgkinson, J.; Livingstone, B.; Black, P.; Tatam, R.P. Low-volume, fast response-time hollow silica waveguide gas cells for mid-IR spectroscopy. Appl. Opt. 2016, 55, 6797. [Google Scholar] [CrossRef]
- Kötschau, R.; Eckhardt, H.S.; Klein, K.; Behler, K.; Hillrichs, G. Gas-Analysis in the UV-region using a long-length Hollow-Core-Waveguide. In Optical Fibers and Sensors for Medical Applications III; SPIE: Bellingham, DC, USA, 2003; Volume 4957, pp. 134–141. [Google Scholar]
- Matsuura, Y.; Miyagi, M. Hollow optical fibers for ultraviolet and vacuum ultraviolet light. IEEE J. Sel. Top. Quantum Electron. 2004, 10, 1430–1434. [Google Scholar] [CrossRef]
- Iwata, T.; Katagiri, T.; Matsuura, Y. Real-time analysis of isoprene in breath by using ultraviolet-absorption spectroscopy with a hollow optical fiber gas cell. Sensors 2016, 16, 2058. [Google Scholar] [CrossRef] [PubMed]
- Andersen, P.C.; Williford, C.J.; Birks, J.W. Miniature personal ozone monitor based on UV absorbance. Anal. Chem. 2010, 82, 7924–7928. [Google Scholar] [CrossRef] [PubMed]
- Da Silveira Petruci, J.F.; Wilk, A.; Cardoso, A.A.; Mizaikoff, B. A Hyphenated Preconcentrator-Infrared-Hollow-Waveguide Sensor System for N2O Sensing. Sci. Rep. 2018, 8, 1–6. [Google Scholar] [CrossRef] [PubMed]
- Da Silveira Petruci, J.F.; Winn, J.N.; Fan, S.; Chen, C.; Michel, J.; Joannopoulos, J.D.; Thomas, E.L. Real-time monitoring of ozone in air using substrate-integrated hollow waveguide mid-infrared sensors. Sci. Rep. 2013, 3, 3174. [Google Scholar] [CrossRef]
- Tütüncü, E.; Nägele, M.; Fuchs, P.; Fischer, M.; Mizaikoff, B. iHWG-ICL: Methane Sensing with Substrate-Integrated Hollow Waveguides Directly Coupled to Interband Cascade Lasers. ACS Sens. 2016, 1, 847–851. [Google Scholar] [CrossRef]
- José Gomes da Silva, I.; Tütüncü, E.; Nägele, M.; Fuchs, P.; Fischer, M.; Raimundo, I.M.; Mizaikoff, B. Sensing hydrocarbons with interband cascade lasers and substrate-integrated hollow waveguides. Analyst 2016, 141, 4432–4437. [Google Scholar] [CrossRef]
- Perez-Guaita, D.; Kokoric, V.; Wilk, A.; Garrigues, S.; Mizaikoff, B. Towards the determination of isoprene in human breath using substrate-integrated hollow waveguide mid-infrared sensors. J. Breath Res. 2014, 8, 026003. [Google Scholar] [CrossRef]
- Wilk, A.; Winn, J.N.; Fan, S.; Chen, C.; Michel, J.; Joannopoulos, J.D.; Thomas, E.L. Substrate-integrated hollow waveguides: A new level of integration in mid-infrared gas sensing. Anal. Chem. 2013, 85, 11205–11210. [Google Scholar] [CrossRef]
- Yang, W.; Ferrara, J.; Grutter, K.; Yeh, A.; Chase, C.; Yue, Y.; Willner, A.E.; Wu, M.C.; Chang-Hasnain, C.J. Low loss hollow-core waveguide on a silicon substrate. Nanophotonics. 2012, 1, 23–29. [Google Scholar] [CrossRef]
- Razeghi, M.; Rogalski, A. Semiconductor ultraviolet detectors. J. Appl. Phys. 1996, 79, 7433–7473. [Google Scholar] [CrossRef]
- Shi, L.; Nihtianov, S. Comparative study of silicon-based ultraviolet photodetectors. IEEE Sens. J. 2012, 12, 2453–2459. [Google Scholar] [CrossRef]
- Zou, Y.; Zhang, Y.; Hu, Y.; Gu, H. Ultraviolet detectors based on wide bandgap semiconductor nanowire: A review. Sensors 2018, 18, 2072. [Google Scholar] [CrossRef] [PubMed]
- Monroy, E.; Omnès, F.; Calle, F. Wide-bandgap semiconductor ultraviolet photodetectors. Semicond. Sci. Technol. 2003, 18, 33. [Google Scholar] [CrossRef]
- Omnès, F.; Monroy, E.; Muñoz, E.; J.-Reverchon, L. Wide bandgap UV photodetectors: A short review of devices and applications. In Gallium Nitride Materials and Devices II; SPIE: Bellingham, DC, USA, 2007; p. 64730. [Google Scholar]
- Prasai, D.; John, W.; Weixelbaum, L.; Krüger, O.; Wagner, G.; Sperfeld, P.; Nowy, S.; Friedrich, D.; Winter, S.; Weiss, T. Highly reliable silicon carbide photodiodes for visible-blind ultraviolet detector applications. J. Mater. Res. 2013, 28, 33–37. [Google Scholar]
- UV Photodiodes, UV Sensors &Amp; Radiometers | Sglux. Available online: https://sglux.de/en/ (accessed on 21 September 2019).
- Ashmore, M.R. Assessing the future global impacts of ozone on vegetation. Plant. Cell Environ. 2005, 28, 949–964. [Google Scholar] [CrossRef]
- Mudway, I.S.; Kelly, F.J. Ozone and the lung: A sensitive issue. Mol. Asp. Med. 2000, 21, 1–48. [Google Scholar] [CrossRef]
- De Maria, L.; Rizzi, G.; Serragli, P.; Marini, R.; Fialdini, L. Optical sensor for ozone detection in medium voltage switchboard. In Proceedings of the SENSORS (IEEE), Lecce, Italy, 26–29 October 2008; pp. 1297–1300. [Google Scholar]
- Barson, M. NIOSH-Pocket Guide to Chemical Hazards; U.S Department of Health & Human Services: Pittsburgh, PA, USA, 2007. [Google Scholar]
- Kalnajs, L.E.; Avallone, L.M. A novel lightweight low-power dual-beam ozone photometer utilizing solid-state optoelectronics. J. Atmos. Ocean. Technol. 2010, 27, 869–880. [Google Scholar] [CrossRef]
- Yu, G.W.; Lin, J.; Qian, F. Measurement of Ozone in the Printing Process. Adv. Mater. Res. 2011, 380, 201–204. [Google Scholar] [CrossRef]
- Aoyagi, Y.; Takeuchi, M.; Yoshida, K.; Kurouchi, M.; Araki, T. High-Sensitivity Ozone Sensing Using 280 nm Deep Ultraviolet Light-Emitting Diode for Detection of Natural Hazard Ozone. J. Environ. Prot. 2012, 3, 695–699. [Google Scholar] [CrossRef]
- Anenberg, S.C.; Miller, J.; Minjares, R.; Du, L.; Henze, D.K.; Lacey, F.; Malley, C.S.; Emberson, L.; Franco, V.; Klimont, Z.; et al. Impacts, mitigation of excess diesel-related NOx emissions in 11 major vehicle markets. Nature 2017, 545, 467–471. [Google Scholar] [CrossRef] [PubMed]
- Robinson, E.; Robbins, R.C. Gaseous Nitrogen Compound Pollutants from Urban and Natural Sources. J. Air Pollut. Control Assoc. 1970, 20, 303–306. [Google Scholar] [CrossRef]
- Ehrlich, R. Effect of nitrogen dioxide on resistance to respiratory infection. Bacteriol. Rev. 1966, 30, 604–614. [Google Scholar] [PubMed]
- Genc, S.; Zadeoglulari, Z.; Fuss, S.H.; Genc, K. The Adverse Effects of Air Pollution on the Nervous System. J. Toxicol. 2012, 2012, 1–23. [Google Scholar] [CrossRef] [PubMed]
- Chatterjee, C.; Sen, A. Sensitive colorimetric sensors for visual detection of carbon dioxide and sulfur dioxide. J. Mater. Chem. A 2015, 3, 5642–5647. [Google Scholar] [CrossRef]
- Nisar, J.; Topalian, Z.; De Sarkar, A.; Österlund, L.; Ahuja, R. TiO2-based gas sensor: A possible application to SO2. ACS Appl. Mater. Interfaces 2013, 5, 8516–8522. [Google Scholar] [CrossRef]
- Hawe, E.; Fitzpatrick, C.; Chambers, P.; Dooly, G.; Lewis, E. Hazardous gas detection using an integrating sphere as a multipass gas absorption cell. Sens. Actuators A Phys. 2008, 141, 414–421. [Google Scholar] [CrossRef]
- Degner, M.; Damaschke, N.; Ewald, H.; Lewis, E. Real time exhaust gas sensor with high resolution for onboard sensing of harmful components. In Proceedings of the SENSORS (IEEE), Lecce, Italy, 26–29 October 2008; pp. 973–976. [Google Scholar]
- Degner, M.; Damaschke, N.; Ewald, H.; O’Keeffe, S.; Lewis, E. UV LED-based fiber coupled optical sensor for detection of ozone in the ppm and ppb range. In Proceedings of the SENSORS (IEEE), Christchurch, New Zealand, 25–28 October 2009; pp. 95–99. [Google Scholar]
- Schneider, P.; Gebefügi, I.; Richter, K.; Wölke, G.; Schnelle, J.; Wichmann, H.-E.; Heinrich, J. Indoor and outdoor BTX levels in German cities. Sci. Total Environ. 2001, 267, 41–51. [Google Scholar] [CrossRef]
- Wallace, L.A. Major sources of benzene exposure. Environ. Health Perspect. 1989, 82, 165–169. [Google Scholar] [CrossRef]
- Ilgen, E.; Karfich, N.; Levsen, K.; Angerer, J.; Schneider, P.; Heinrich, J.; Wichmann, H.-E.; Dunemann, L.; Begerow, J. Aromatic hydrocarbons in the atmospheric environment: Part I. Indoor versus outdoor sources, the influence of traffic. Atmos. Environ. 2001, 35, 1235–1252. [Google Scholar] [CrossRef]
- Ayoko, G.A. Volatile Organic Compounds in Indoor Environments. In Environmental Chemistry; Springer: Berlin/Heidelberg, Germany, 2004; pp. 1–35. [Google Scholar]
- Kawamura, K.; Vestergaard, M.; Ishiyama, M.; Nagatani, N.; Hashiba, T.; Tamiya, E. Development of a novel hand-held toluene gas sensor: Possible use in the prevention and control of sick building syndrome. Measurement 2006, 39, 490–496. [Google Scholar] [CrossRef]
- WHO. Exposure to Benzene: A Major Public Health Concern; WHO: Geneva, Switzerland, 2010. [Google Scholar]
- Baan, R.; Grosse, Y.; Straif, K.; Secretan, B.; El Ghissassi, F.; Bouvard, V.; Benbrahim-Tallaa, L.; Guha, N.; Freeman, C.; Galichet, L.; et al. A review of human carcinogens--Part F: Chemical agents and related occupations. Lancet Oncol. 2009, 10, 1143–1144. [Google Scholar] [CrossRef]
- Benzene (IARC Summary & Evaluation, Supplement 7, 1987). Available online: http://www.inchem.org/documents/iarc/suppl7/benzene.html (accessed on 26 March 2017).
- Pyatt, D.; Hays, S. A review of the potential association between childhood leukemia and benzene. Chem. Biol. Interact. 2010, 184, 151–164. [Google Scholar] [CrossRef] [PubMed]
- Patnaik, P. A Comprehensive Guide to the Hazardous Properties of Chemical Substances; John Wiley: Hoboken, NJ, USA, 2007. [Google Scholar]
- Kandyala, R.; Raghavendra, S.P.; Rajasekharan, S. Xylene: An overview of its health hazards and preventive measures. J. Oral Maxillofac. Pathol. 2010, 14, 1. [Google Scholar] [CrossRef] [PubMed]
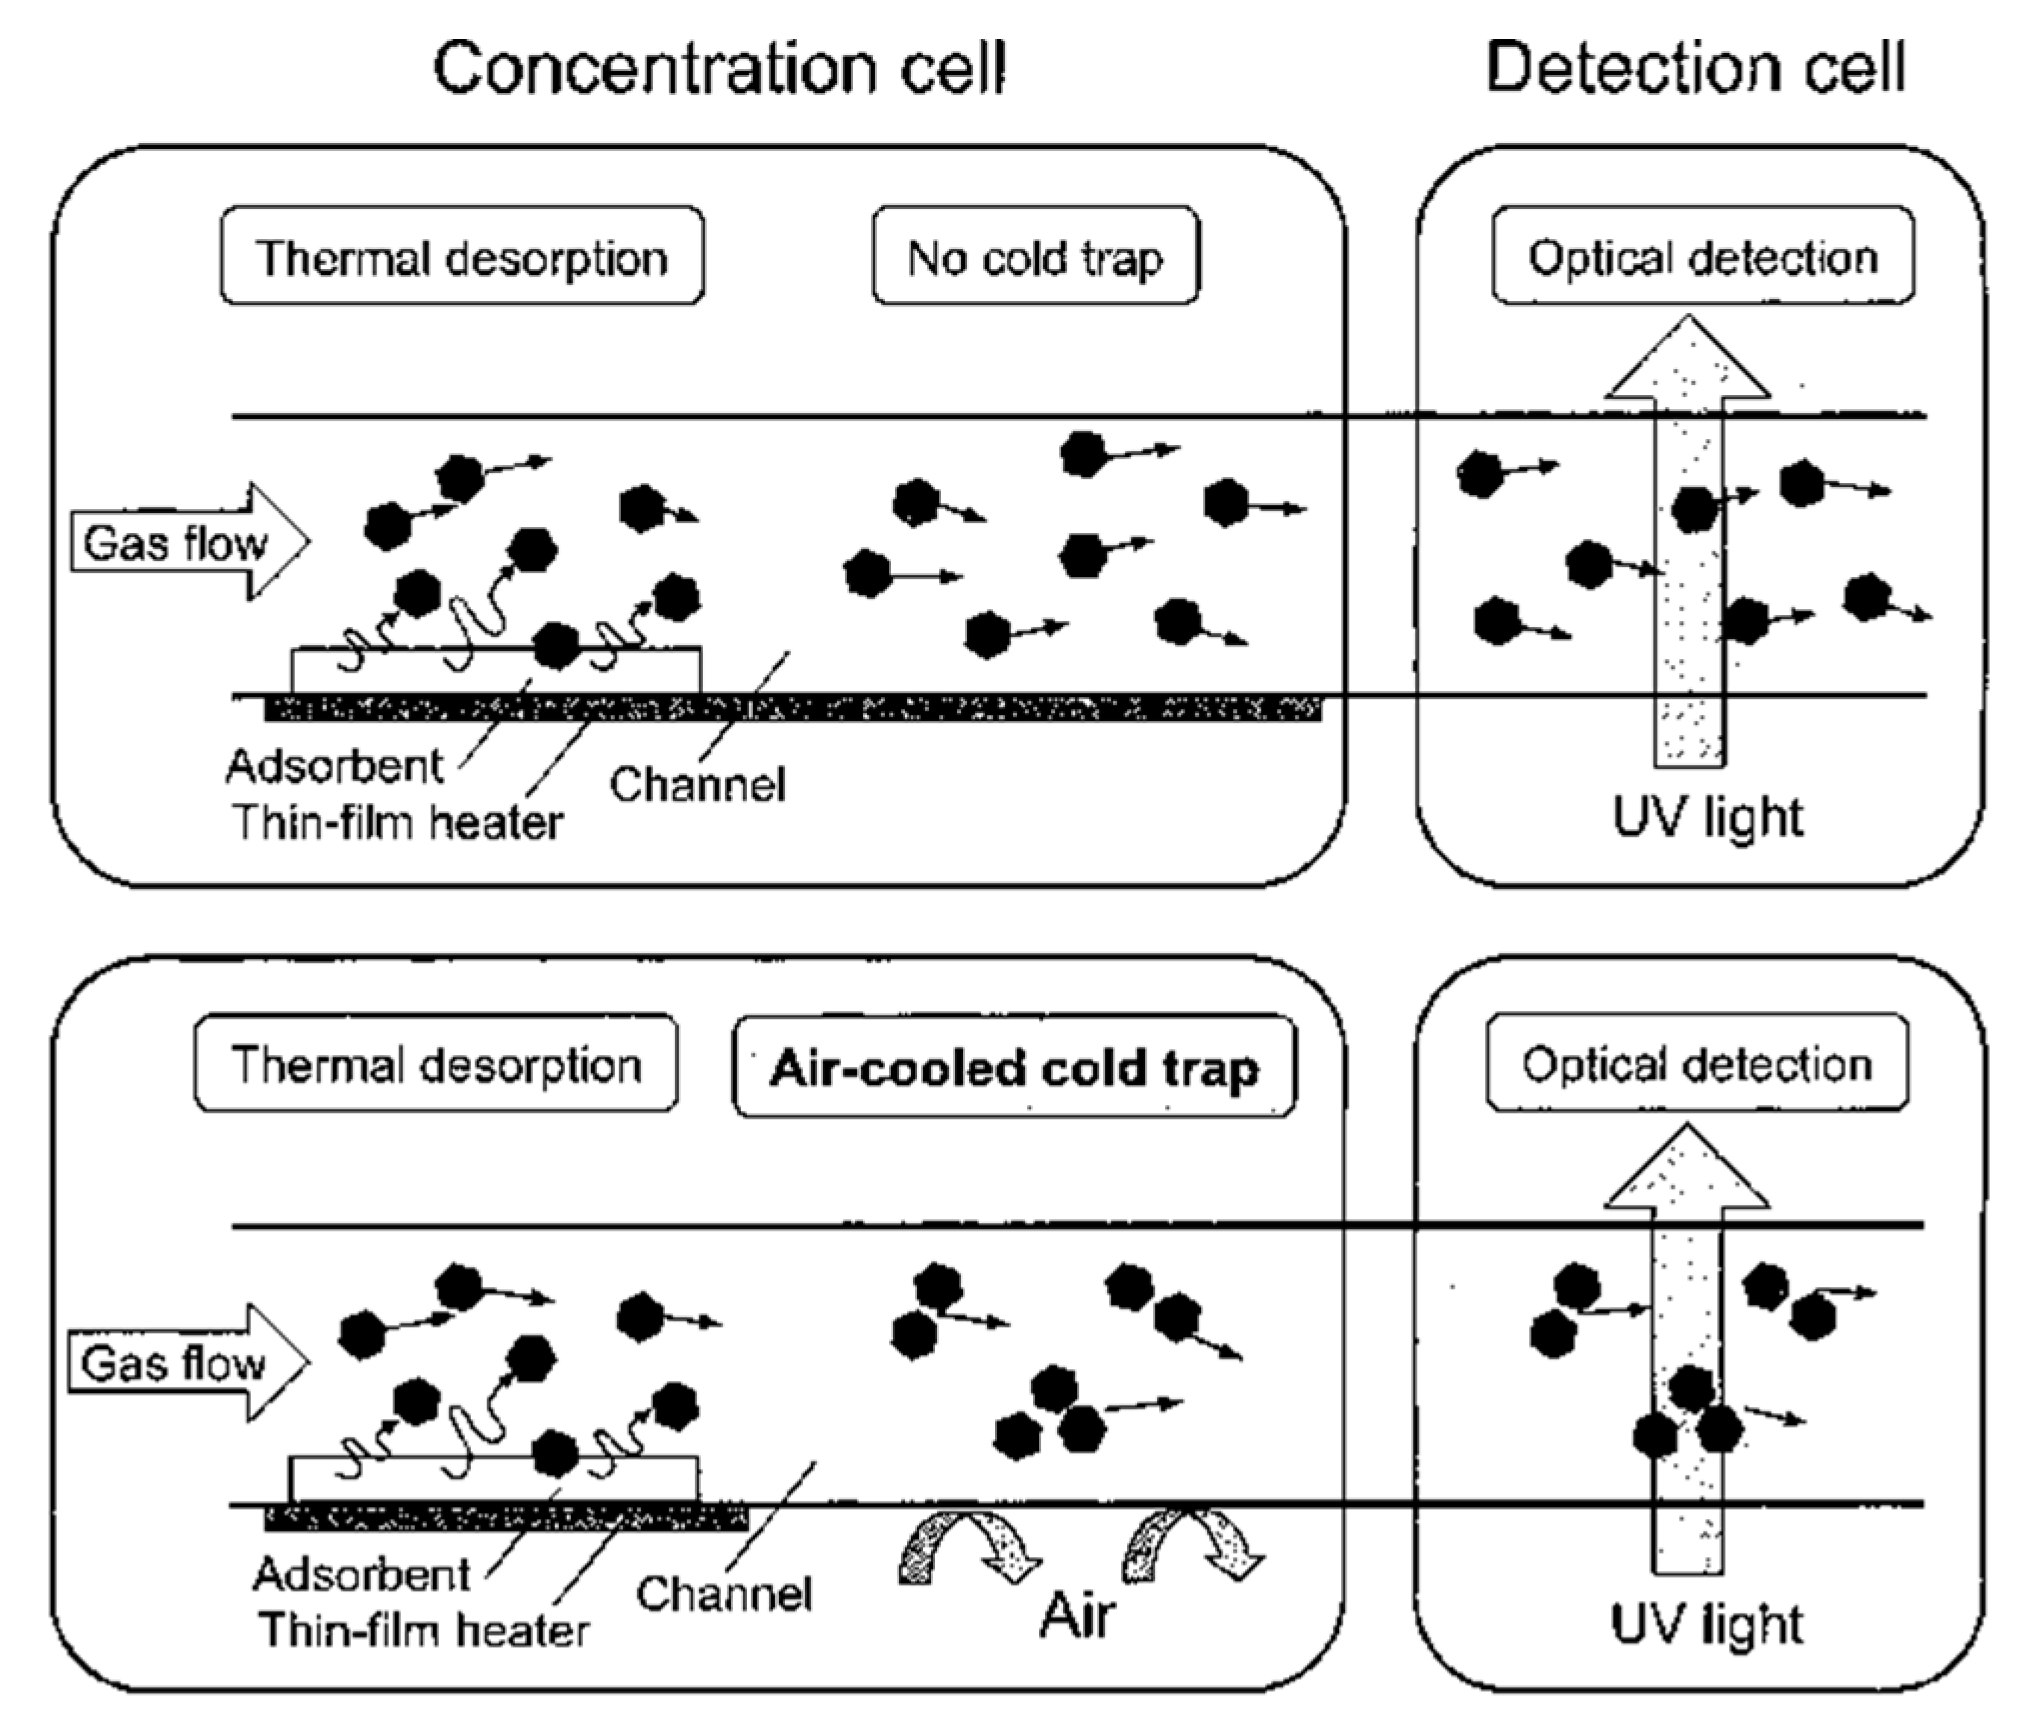
- Ueno, Y.; Horiuchi, T.; Morimoto, T.; Niwa, O. Microfluidic device for airborne BTEX detection. Anal. Chem. 2001, 73, 4688–4693. [Google Scholar] [CrossRef]
- Ueno, Y.; Horiuchi, T.; Niwa, O. Air-Cooled Cold Trap Channel Integrated in a Microfluidic Device for Monitoring Airborne BTEX with an Improved Detection Limit Air-Cooled Cold Trap Channel Integrated in a Microfluidic Device for Monitoring Airborne BTEX with an Improved Detection Limit. Anal. Chem. 2002, 74, 1712–1717. [Google Scholar] [CrossRef]
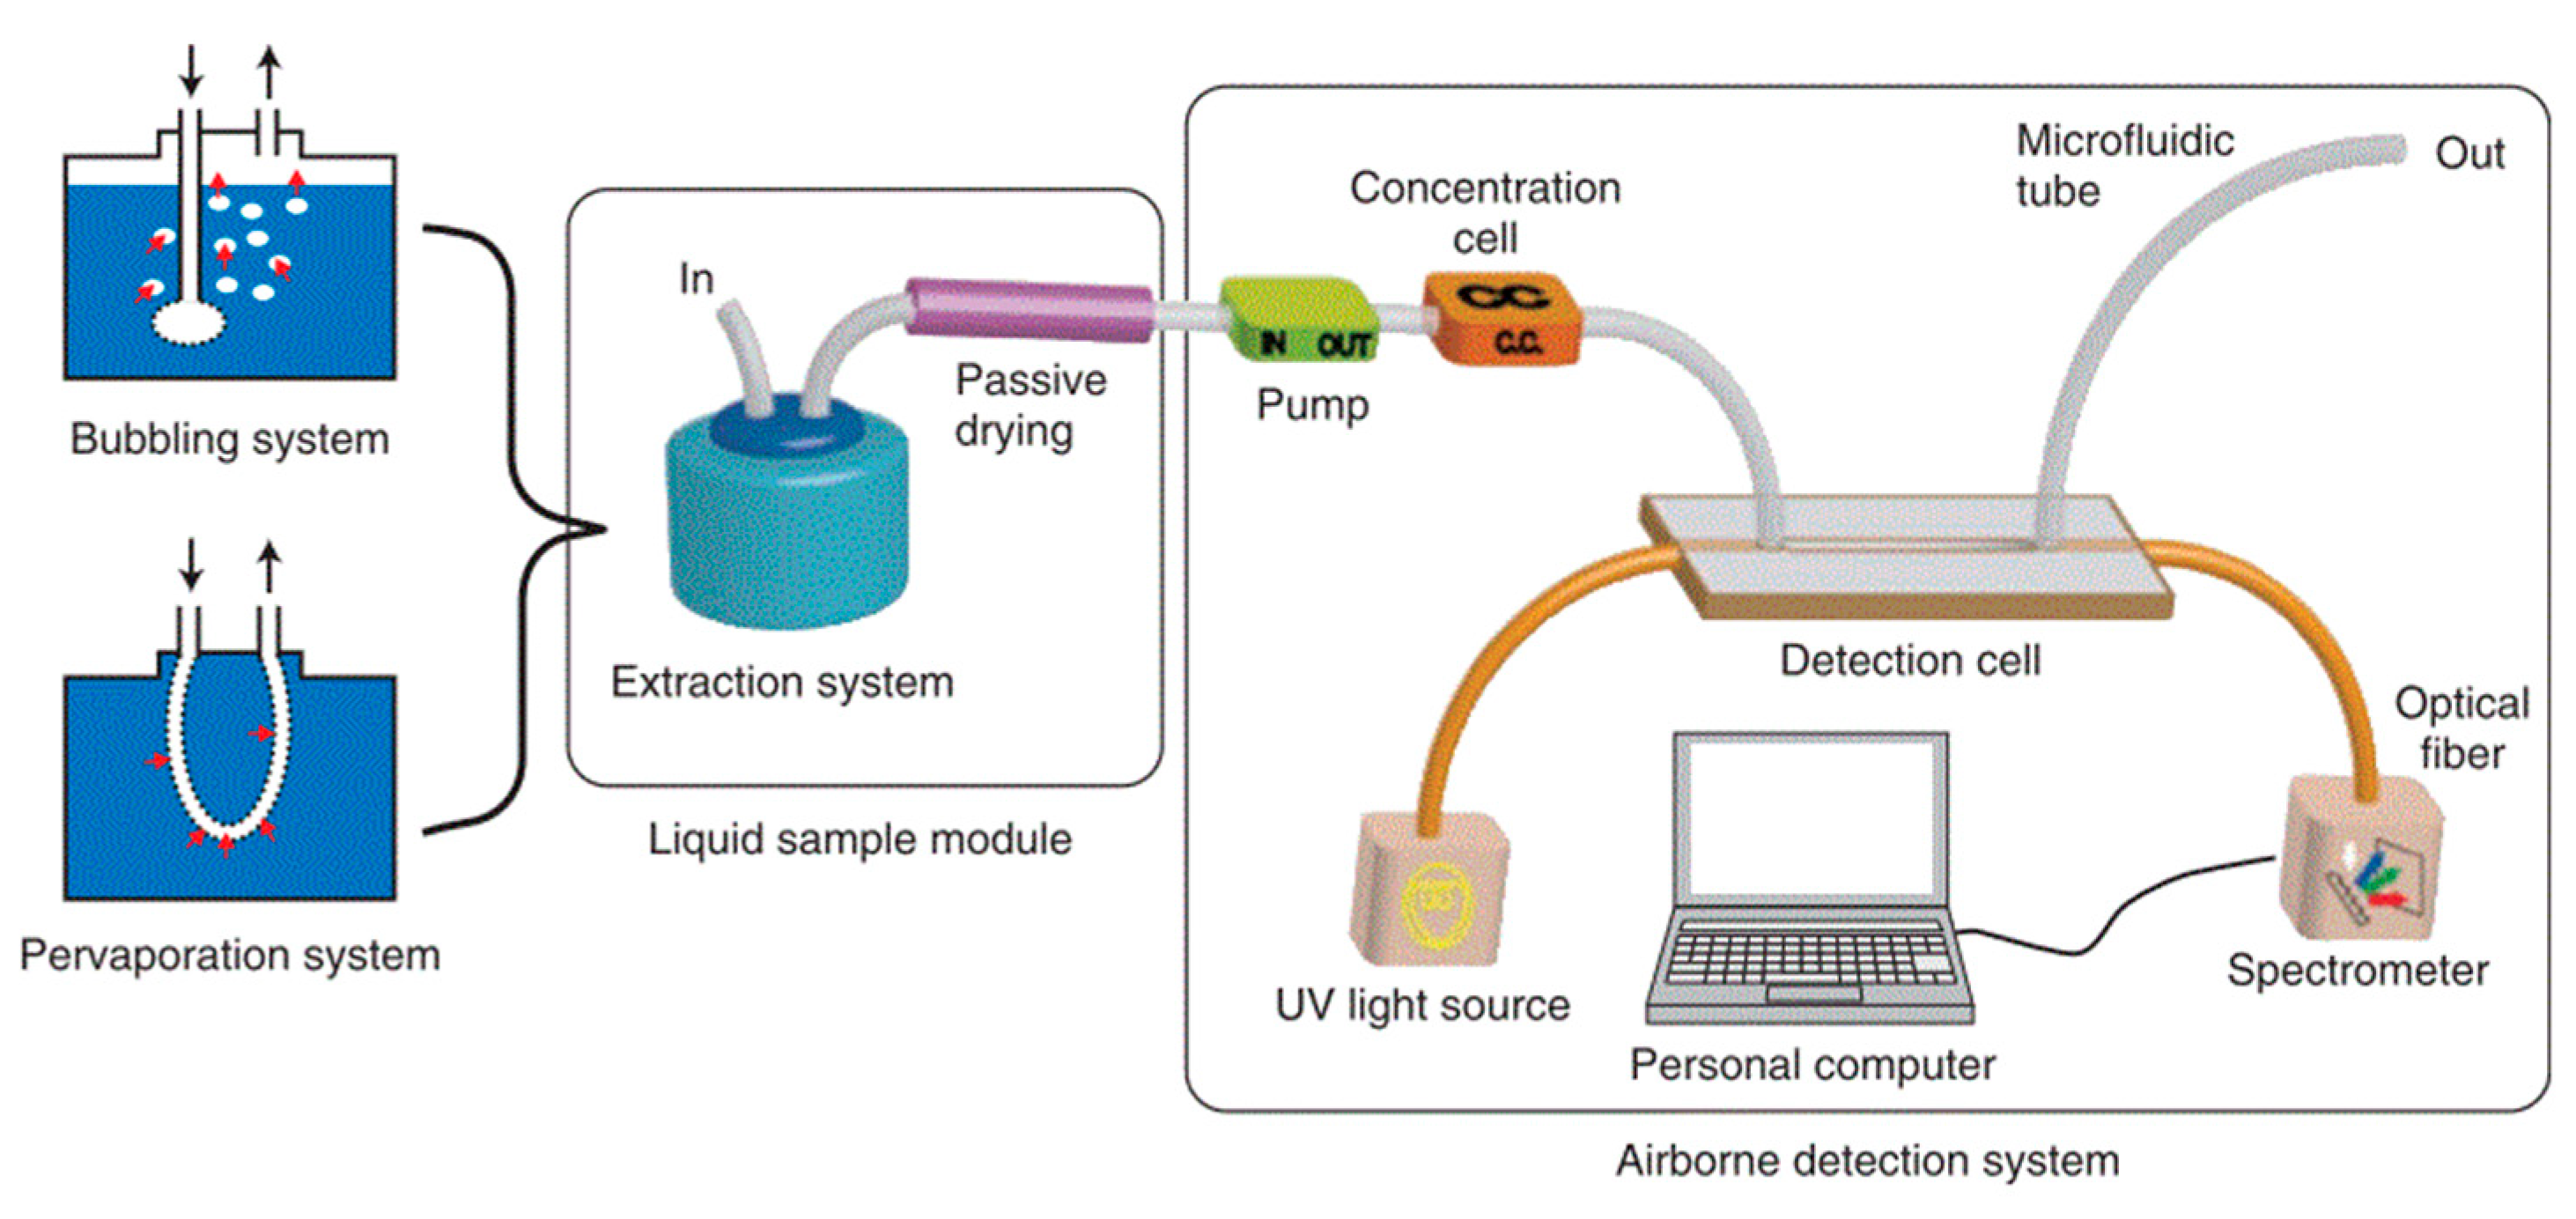
- Camou, S.; Tamechika, E.; Horiuchi, T. Portable sensor for determining benzene concentration from airborne/liquid samples with high accuracy. NTT Tech. Rev. 2012, 10, 10–12. [Google Scholar]
- Huang, X.; Bauder, T.; Do, T.; Suen, H.; Boss, C.; Kwon, P.; Yeom, J. A A Binder Jet Printed, Stainless Steel Preconcentrator as an In-Line Injector of Volatile Organic Compounds. Sensors 2019, 19, 2748. [Google Scholar] [CrossRef]
- James, F.; Breuil, P.; Pijolat, C.; Camara, M.; Briand, D.; Bart, A.; Cozic, R. Development of a MEMS Preconcentrator for Micro-gas Chromatography Analyses. Procedia Eng. 2014, 87, 500–503. [Google Scholar] [CrossRef]
- Horiuchi, T.; Ueno, Y.; Camou, S.; Haga, T.; Tate, A. Portable aromatic VOC gas sensor for onsite continuous air monitoring with 10-ppb benzene detection capability. NTT Tech. Rev. 2006, 4, 30–37. [Google Scholar]
- Dominick, H.; Eckhardt, H.S.; Frank, M.; Grattan, K.T.; Klein, F.K. Gas analysis in the UV region: A hollow-core waveguide sensor system. In Second European Workshop on Optical Fibre Sensors; SPIE: Bellingham, DC, USA, 2004; Volume 5502, pp. 267–270. [Google Scholar]
- Eckhardt, H.-S.; Dominick, H.; Grattan, K.T.V.; Graubner, K.; Klein, K.-F.; Spangenberg, B.; Sun, T. Fiber-optic detection device for GC-UV. In Optical Fibers and Sensors for Medical Diagnostics and Treatment Applications VII; SPIE: Bellingham, DC, USA, 2007; Volume 6433, p. 64330D. [Google Scholar]
- Eckhardt, H.S.; Sun, T.; Graubner, K.; Klein, F.K.; Grattan, K.T.V. Fiber-optic based gas sensing in the UV region. In Optical Fibers and Sensors for Medical Diagnostics and Treatment Applications VI; SPIE: Bellingham, DC, USA, 2006; Volume 6083, p. 60830A. [Google Scholar]
- Eckhardt, H.S.; Behler, K.; Frank, M.; Grattan, K.T.V.; Klein, K.-F.; Tschau, R.K.; Schroeder, U. Further improvements of high-precision gas analysis in DUV region. In Optical Fibers and Sensors for Medical Diagnostics and Treatment Applications IV; SPIE: Bellingham, DC, USA, 2004; Volume 5317, p. 186. [Google Scholar]
- Bui, D.A.; Hauser, P.C. A deep-UV light-emitting diode-based absorption detector for benzene, toluene, ethylbenzene, and the xylene compounds. Sens. Actuators B Chem. 2016, 235, 622–626. [Google Scholar] [CrossRef]


| Method/Technique | Advantages | Limitations |
|---|---|---|
| Metal Oxide Semiconductor | Good sensitivity. Low cost. Quick Time response. Easily to integrate. | Relative low selectivity. High-operating temperature. Zero-drift and ageing effect. Mostly affected by humidity and temperature. |
| Electro-Chemical | Relative sensitive. Reliable. Low power consumption. Quick time response. Lower cost | Zero drift. Aging, which leads to a shorter life. |
| PID | High sensitivity to aromatics. Quick response. Portable. | Low selectivity, all the gases with IP equal or lower the photon may be detected (total VOC concentration). Cost. |
| Piezoelectric | Good sensitivity. Portable. Good dynamic range. | Large measurement noise. Weak selectivity. Zero drift and cross-reactivity. Interference from humidity and temperature. |
| Optical sensors | Excellent sensitivity. High gas specificity. Minimal drift and cross-response. Non-destructive. Ultra-fast response. | Size High cost |
| LED | Deuterium Lamp | Xenon Flash Lamp | Mercury Lamp | |
|---|---|---|---|---|
| Wavelength | Single peak | Relatively wide spectrum 120–400 nm | Broad-spectrum 160–2000 nm | Broad-spectrum 185–2000 nm |
| Stability of light output | Excellent temporal and spatial stability. | Good. Fluctuation <0.005% | Relatively poor. Fluctuation <3% | Relatively poor. Fluctuation <2% |
| Warm-up time | Instantaneous | 20–30 min | Instantaneous | 1–15 min |
| Life (hours) | 3000–10,000 | 2000–4000 | 400–5000 | 500–3000 |
| Input wattage (W) | DC powered 6–10 V | 5–150 | 2–60 | 50–500 |
| Thermal effect on samples | None. LEDs do not emit forward heat | Sample can be affected by the heat from the lamp | None | Sample can be affected by the heat from the lamp |
| Cost | Low | High | High | Low |
| Drive electronics | Simple | Complex | Complex | Complex |
| Safety | Low voltage and cold light source | High power supply (Input wattage 5–150 W) and hot lamp surface | High voltage supply (Input wattage 2–300 W): sparking risk | High voltage supply (Input wattage 50–500 W) and contains mercury in fragile quartz envelop |
| Photodetector | Advantages | Disadvantages |
|---|---|---|
| Photoconductor | Simple design, easy process control, high gain | Large dark current, slow time response |
| Schottky UV detector | Low dark current, quick time response, high sensitivity, and quantum efficiency | Higher absorption losses, shallow-semiconductor contact |
| p-n and p-i-n detectors | Fast time response, high impedance, low dark current, low bias operation, high-frequency operation, easier fabrication | The response is dependent on the dopant used which impairs the spectral response |
| Metal-semiconductor-metal (MSM) | Fast time response, minimally affected by bias, simple fabrication process, low cost, easy integration | Lower gain and spectral response |
| Molecules | NIOSH-Recommended Exposure Limit (ppm) a | OSHA -Permissible Exposure Limit (ppm) b | ACGIH-Threshold Limit Value (ppm) c | ANSES (VGAI) France-Long Exposure (ppm) d |
|---|---|---|---|---|
| Ozone | 0.1 | 0.1 | 0.05–0.2 e | - |
| NO2 | 1 | 5 | 0.2 | - |
| SO2 | 2 [TWA] | 5 | 0.25 | - |
| Benzene | 0.1 | 1 | 0.5 | 0.0006 |
| Toluene | 100 | 200 | 20 | 5.31 |
| Ethylbenzene | 10 | 10 | 10 | 0.345 |
| Xylene(m-,o-,p-) | 100 | 100 | 100 | - |
| S. No. | Molecules Detected | Source | Peak Wave Length | Detector | Gas Cell (Materials) | Optical Path Length | Characterization | Remarks | Ref. | |||
|---|---|---|---|---|---|---|---|---|---|---|---|---|
| Limit of Detection | Sensitivity (μAU/ppm) | Linearity | Time Response | |||||||||
| 1 | BTEX | Deep UV LED | 260 nm | Photodiode | Aluminum | 40 cm | Benzene = 1.2 ppm Toluene = 658 ppb Ethyl-Benzene = 612 ppb O-Xylene = 600 ppb m-Xylene = 607 ppb p-Xylene = 457 ppb | Benzene -62 Toluene -152 Ethylbenzene-166 Xylene(-o)-185 m-Xylene(-m)-169 p-Xylene(-p) -235 | 934 ppb-60 ppm | fast | Good reproducibility of RSD 2%. Carrier gas: N2 | [111] |
| 2 | Toluene | Deep UV LED | 260 nm | spectrometer | Aluminum and glass HCW with aluminum coatings | 25 cm | 8.1 ppm | 200 | 10–100 ppm | - | Good RSD 2.5%. Carrier gas: N2 | [24] |
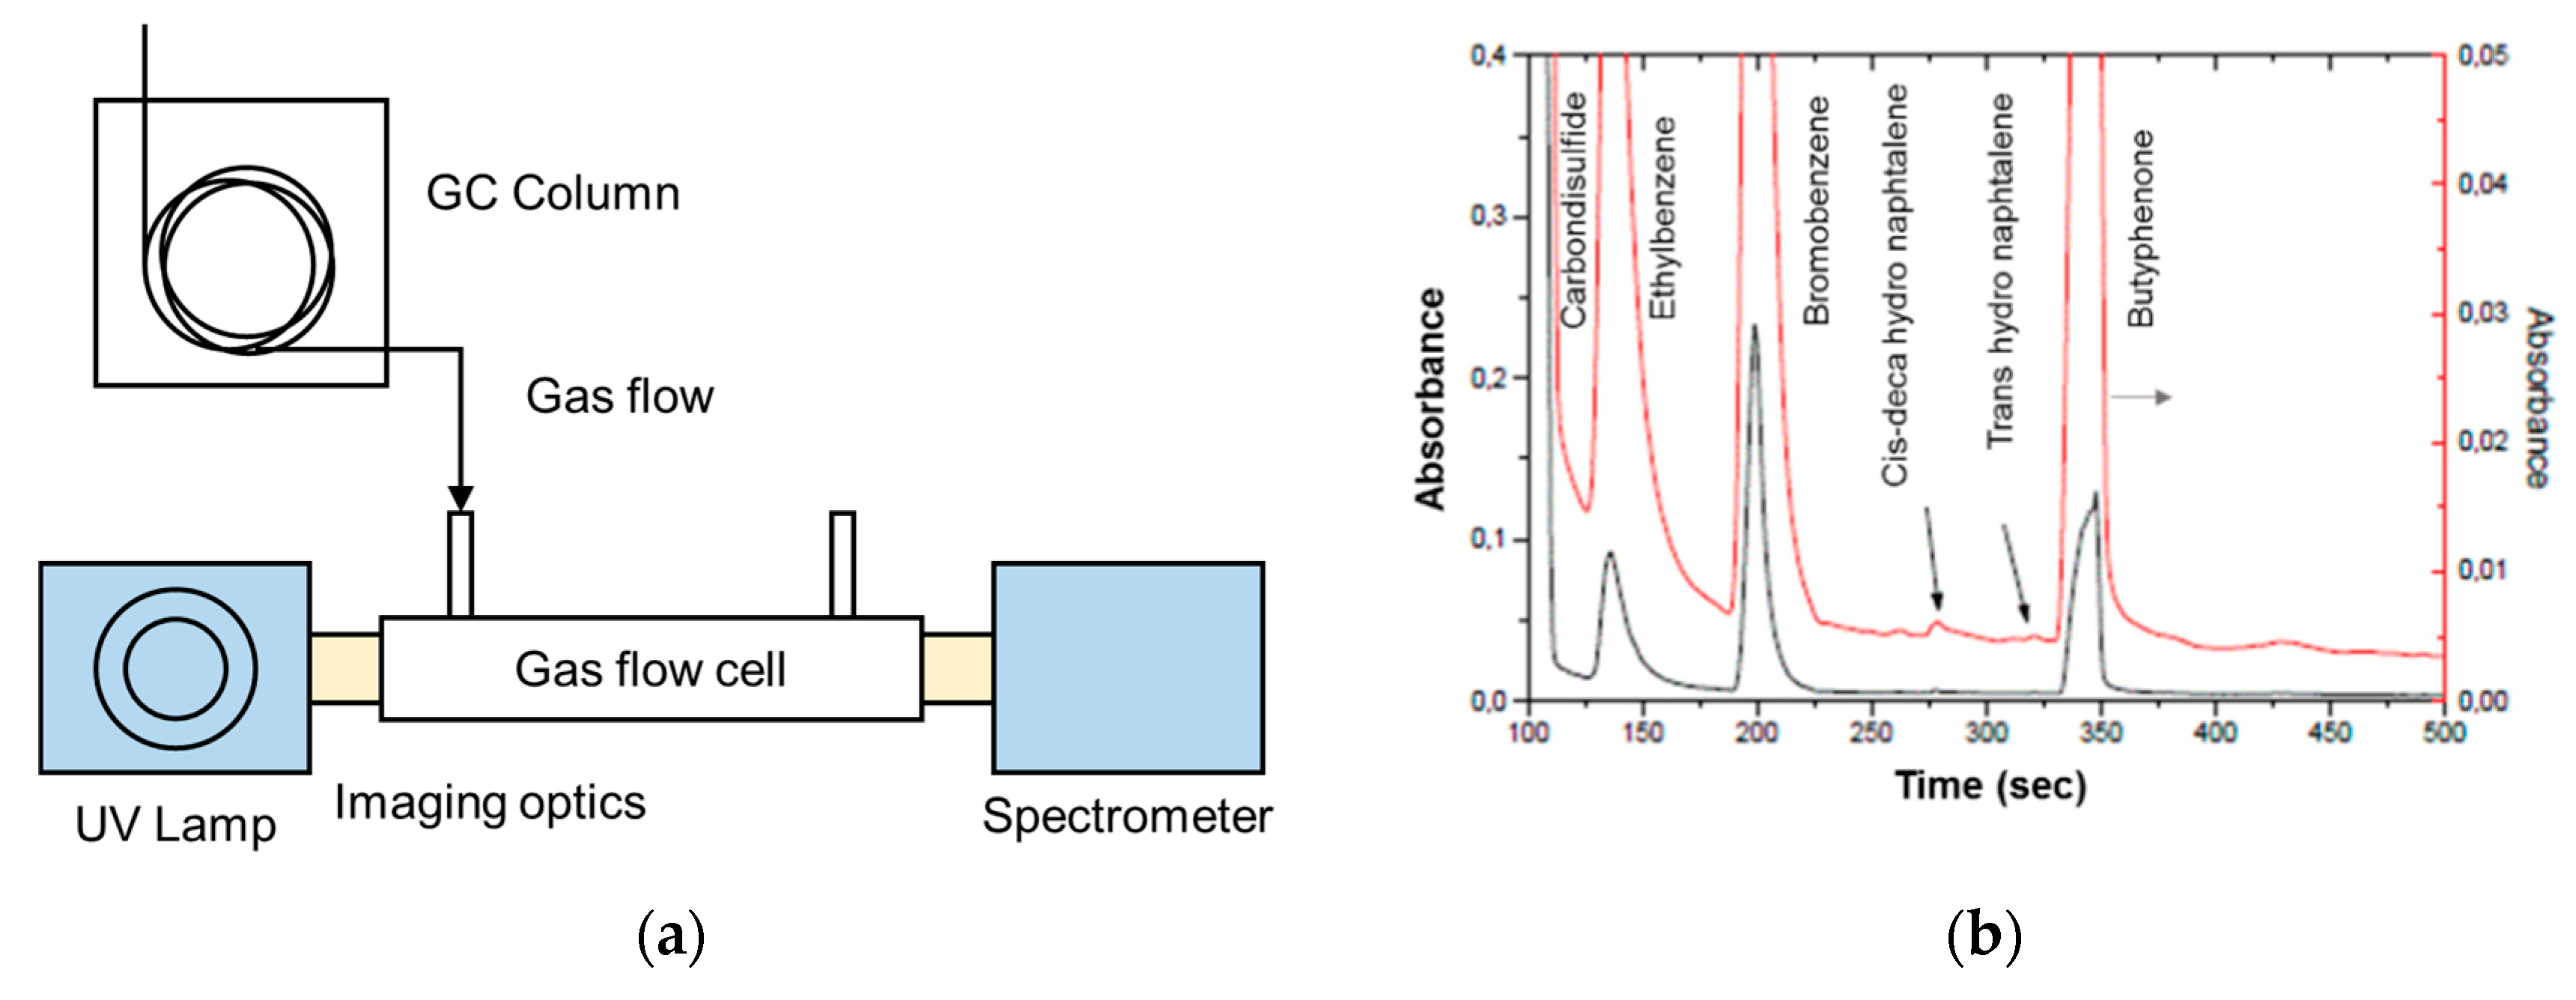
| 3 | SO2, NO2, Ammonia, Ethyl benzene, bromobenzene, cis-decahydronaphtalene, trans-decahydronaphtalene, Buthyrophenone, diphenylsulfoxide, carbon disulphide | Deuterium lamp | 175–210 nm | spectrometer | Aluminum-coated silica HCW | 1 m | 1.1 ppm of SO2 was analyzed | - | - | - | UV and IR absorption were compared. Carrier gas: N2 | [107] [110] [108] |
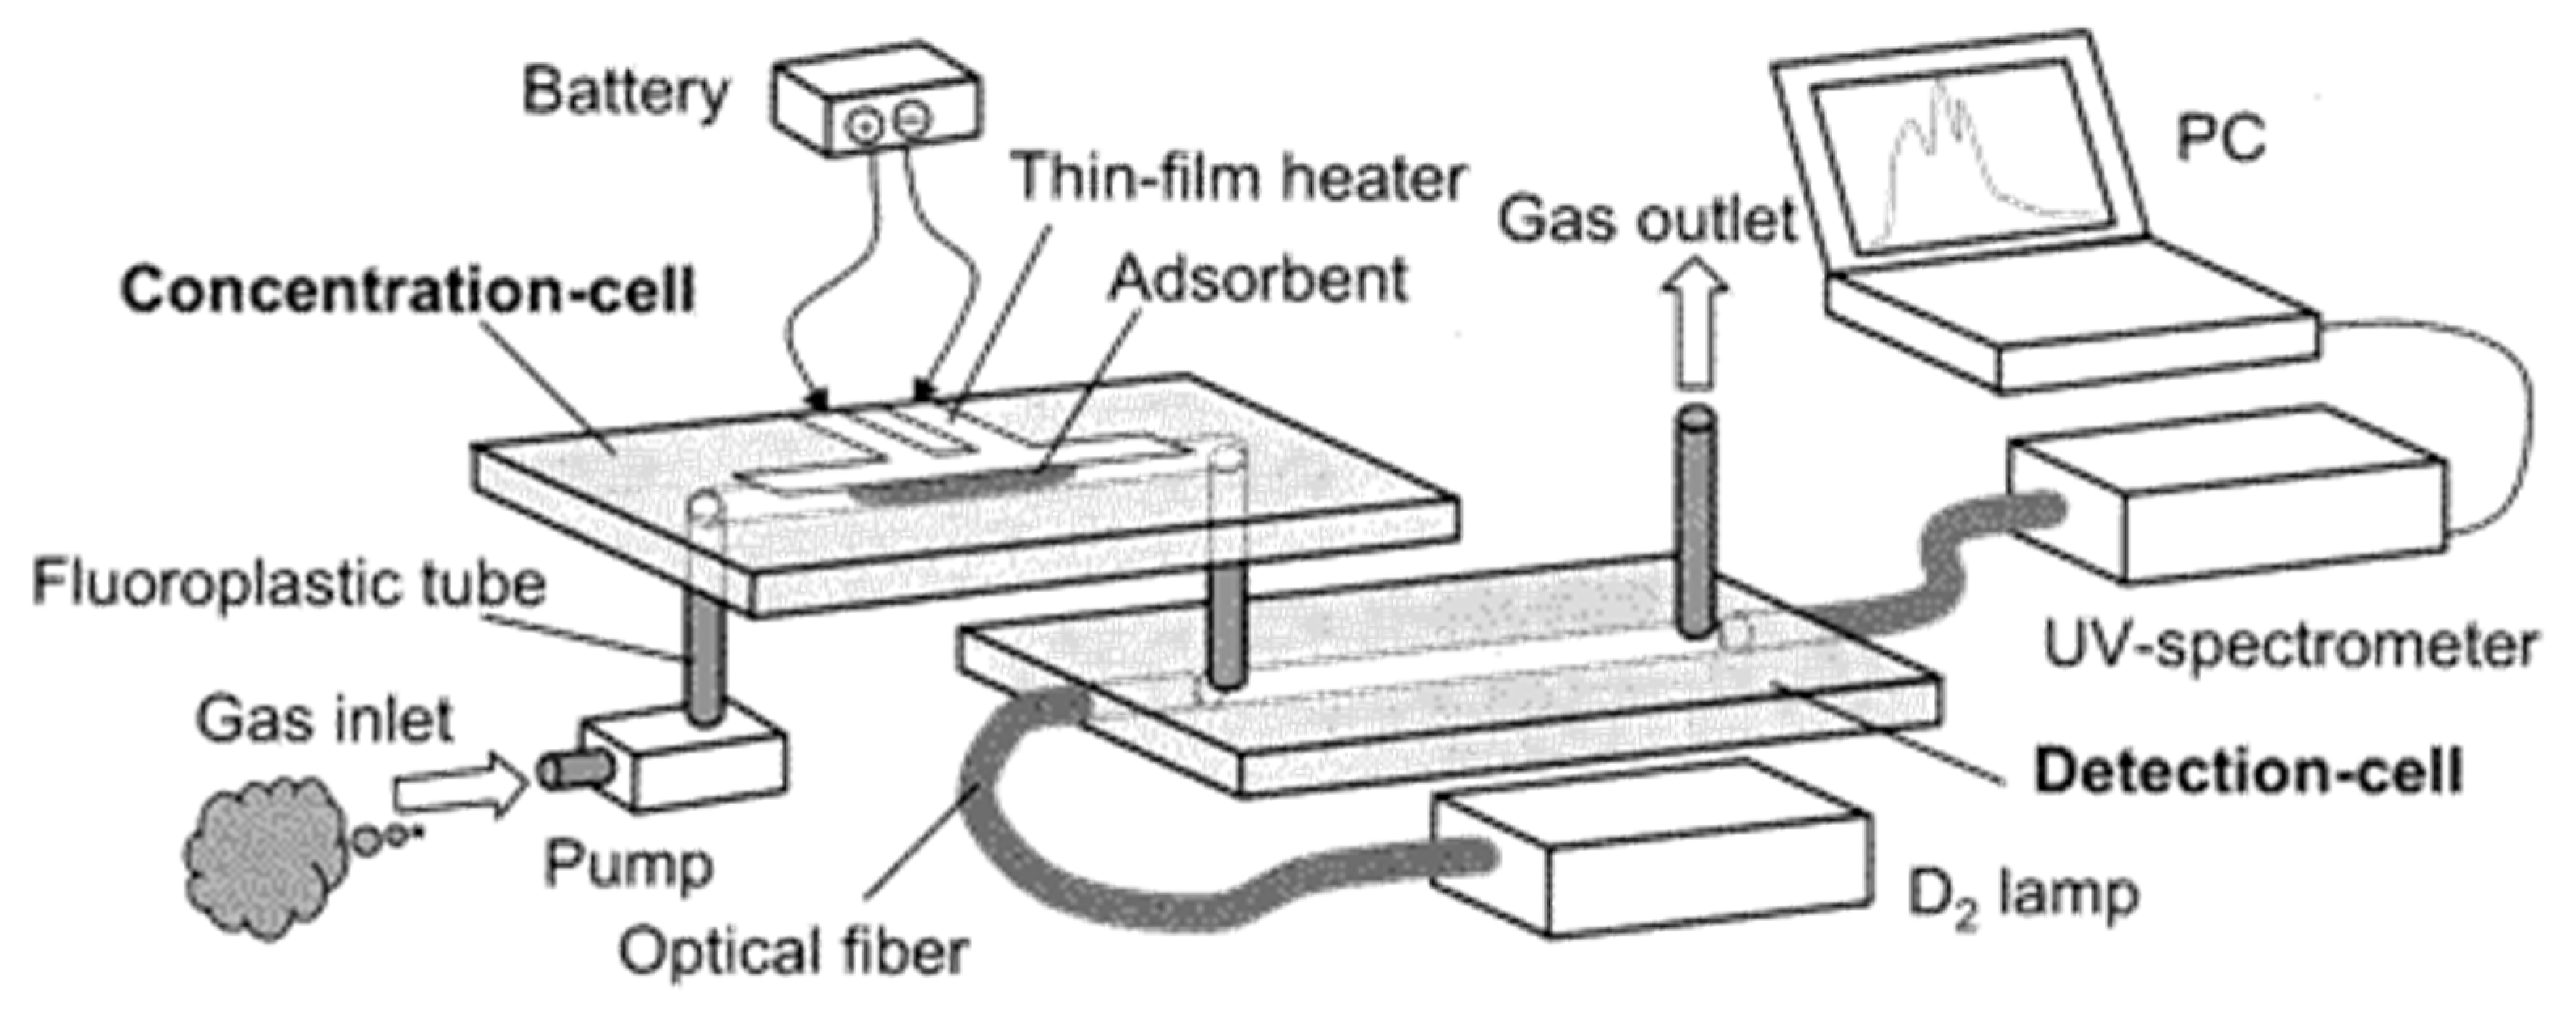
| 4 | BTX | UV D2 lamp | 230–270 nm | UV spectrometer | Pyrex wafer with Platinum coating | 2 cm | 4 ppm for toluene | - | - | 20 sec for detection cell (The total analysis time is different and depend on the pre- concentration time) | Microfluidics-based device. Pre-concentrator enhanced the LOD from 4 ppm to 100 ppm for toluene. Carrier gas: N2 | [101] |
| 5 | BTX | UV D2 lamp | 230–270 nm | UV spectrometer | Pyrex wafer with the Platinum coating | 2 cm | 0.05 ppm for toluene | - | - | Sampling time 30 min | Air-cooled traps were placed to avoid adsorbed gases dilution. Carrier gas: N2 | [102] |
| 6 | BTX | UV D2 lamp | 230–270 nm | UV spectrometer | Channel in glass substrate with platinum coating | 2 cm | 10 ppb for benzene | - | 10–100 ppb | 50 min total sampling time | Several parameters were optimized to enhance the LOD to 10 ppb. Carrier gas: N2 | [106] |
| 7 | Ozone | Deuterium lamp | Wavelength range | Spectrometer with filter | PTFE (Polytetrafluoroethylene) | 40 cm | 0.1 ppm | 0.1–10 ppm | The optical path was increased by using a reflector on one side. Carrier gas: Air | [76] | ||
| 8 | Ozone | Low -pressure Hg lamp | 255 nm | Photodiode with an interference filter | Aluminum with Quartz lining | 15 cm | Precision is less than 2 ppb LOD 4.5 ppb | - | - | 10 s | The device is small in size with low power consumption. Carrier gas: Air. Nafion tubes were installed to remove humidity from the air. | [59] |
| 9 | Ozone | LED | 280 nm | AlGaN detector | - | 20 cm | 0.1 ppm | - | 0–1 ppm form plot | - | Photodiodes were discussed in detail. | [80] |
| 10 | Ozone | LED | 254 nm | SiC photdiodes | Teflon tubes | 48.8 cm | - | - | - | - | Optoelectronics and data acquisition were discussed in detail | [78] |
| 11 | Ozone | LED | 255 nm | photodiode | Aluminum | 40 cm and 4 cm | Sub ppb to 100 ppm | - | - | - | - Carrier gas: Air | [89] |
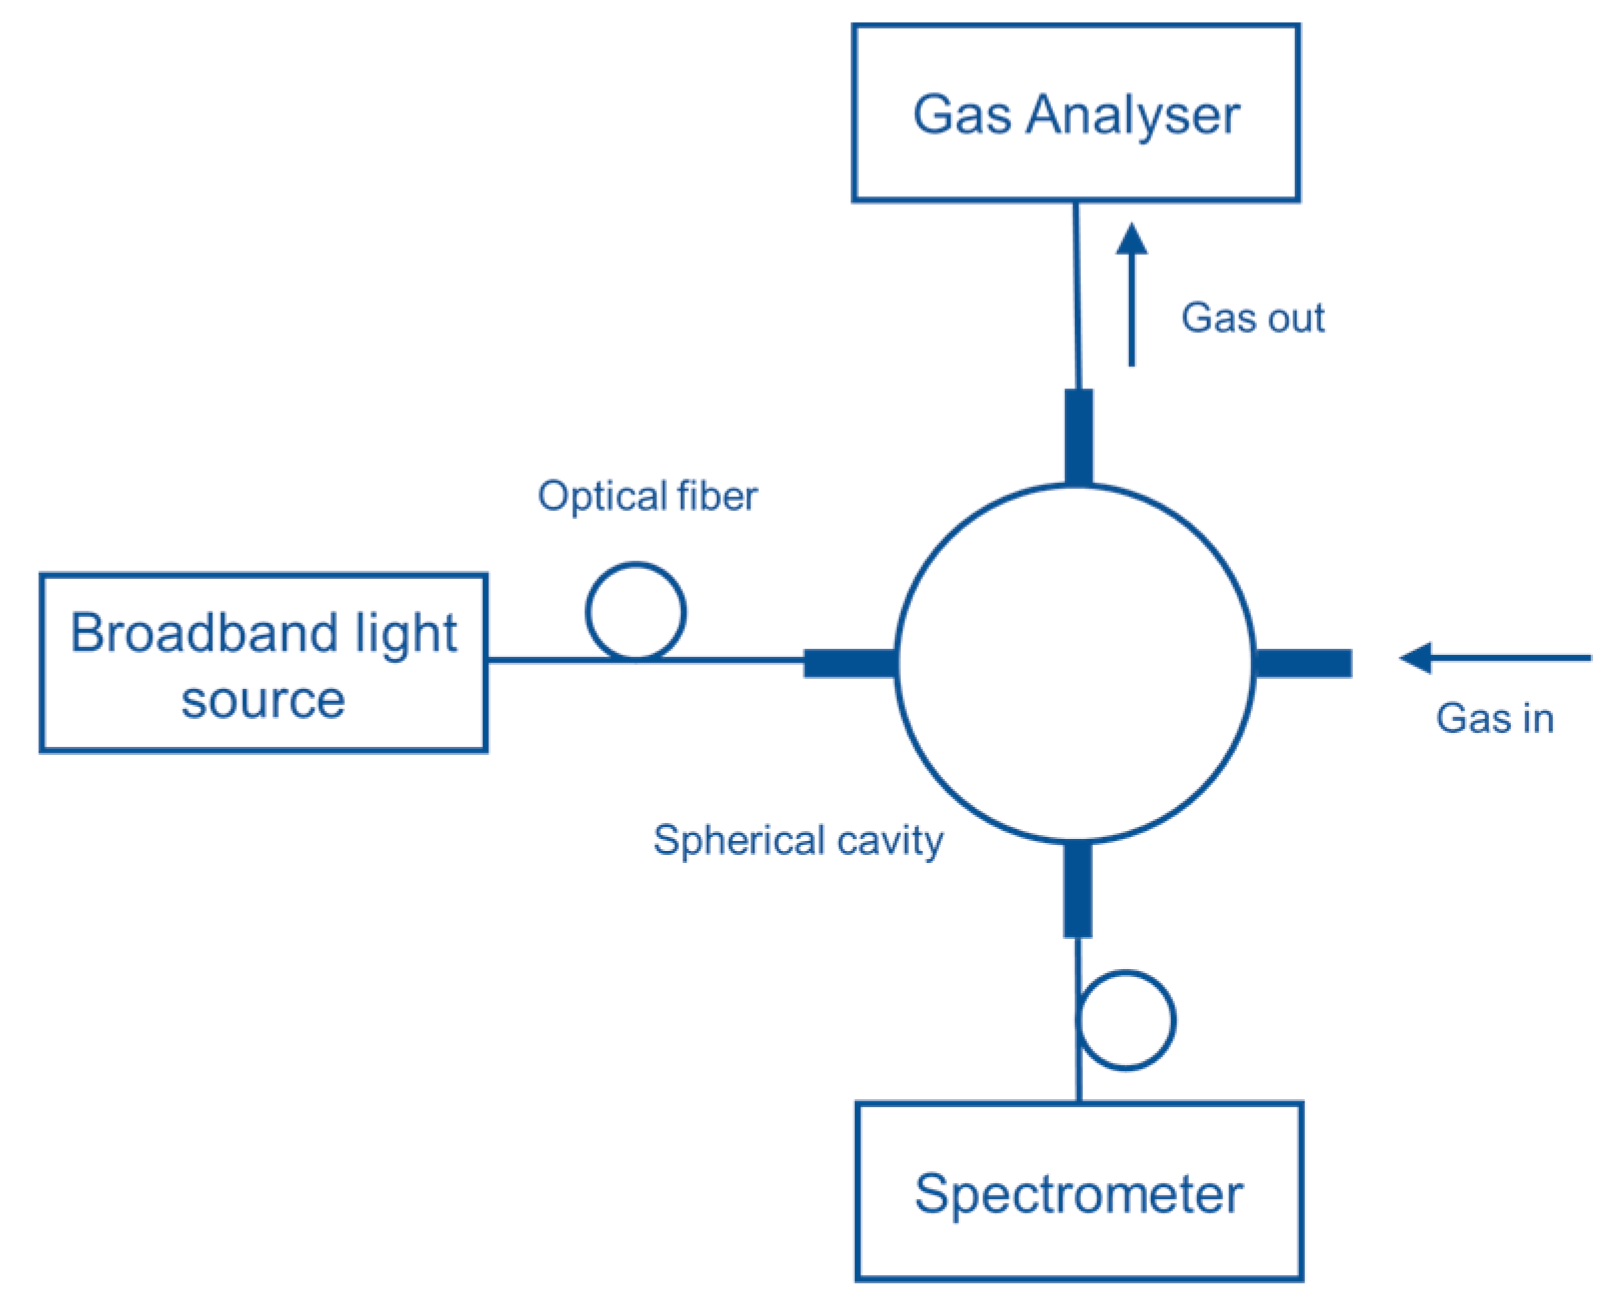
| 12 | NO2, SO2 | Deuterium/halogen lamp and LED | Spectrometer and photodiode | Multi-pass spherical gas absorption | 40–50 cm (Effective optical path length) | 4 ppm NO2 11 ppm SO2 | NA | 0–50 ppm | 2–4 sec | Integrating sphere (multi-pass gas cell) was tested. Carrier gas: N2 | [87] | |
| 13 | NO2, SO2 | LED | 255 nm, 285 nm, 320 nm, 405 nm and 590 nm | photodiode | Aluminum | 20 cm and 8 cm | Resolution 1 ppm | Up to 100 ppm | 10 ms | Carrier gas: N2 | [88] | |
© 2019 by the authors. Licensee MDPI, Basel, Switzerland. This article is an open access article distributed under the terms and conditions of the Creative Commons Attribution (CC BY) license (http://creativecommons.org/licenses/by/4.0/).
Share and Cite
Khan, S.; Newport, D.; Le Calvé, S. Gas Detection Using Portable Deep-UV Absorption Spectrophotometry: A Review. Sensors 2019, 19, 5210. https://doi.org/10.3390/s19235210
Khan S, Newport D, Le Calvé S. Gas Detection Using Portable Deep-UV Absorption Spectrophotometry: A Review. Sensors. 2019; 19(23):5210. https://doi.org/10.3390/s19235210
Chicago/Turabian StyleKhan, Sulaiman, David Newport, and Stéphane Le Calvé. 2019. "Gas Detection Using Portable Deep-UV Absorption Spectrophotometry: A Review" Sensors 19, no. 23: 5210. https://doi.org/10.3390/s19235210
APA StyleKhan, S., Newport, D., & Le Calvé, S. (2019). Gas Detection Using Portable Deep-UV Absorption Spectrophotometry: A Review. Sensors, 19(23), 5210. https://doi.org/10.3390/s19235210