A Weather Forecast Model Accuracy Analysis and ECMWF Enhancement Proposal by Neural Network

 , , ,
, , ,  and
and
Abstract
1. Introduction
Background and Motivation
- The region of interest (model domain) can be freely defined, as well as the range and frequency of forecasts (ALADIN provides updates four times per day, ECMWF two times per day);
- the spatial and temporal resolution of forecasts is freely definable (according to the available computing power);
- a focus on regional physical processes is enabled (ECMWF is used for lateral boundary conditions);
- possibility of local observations usage, e.g., radar and satellite for more accurate prediction.
2. State of the Art
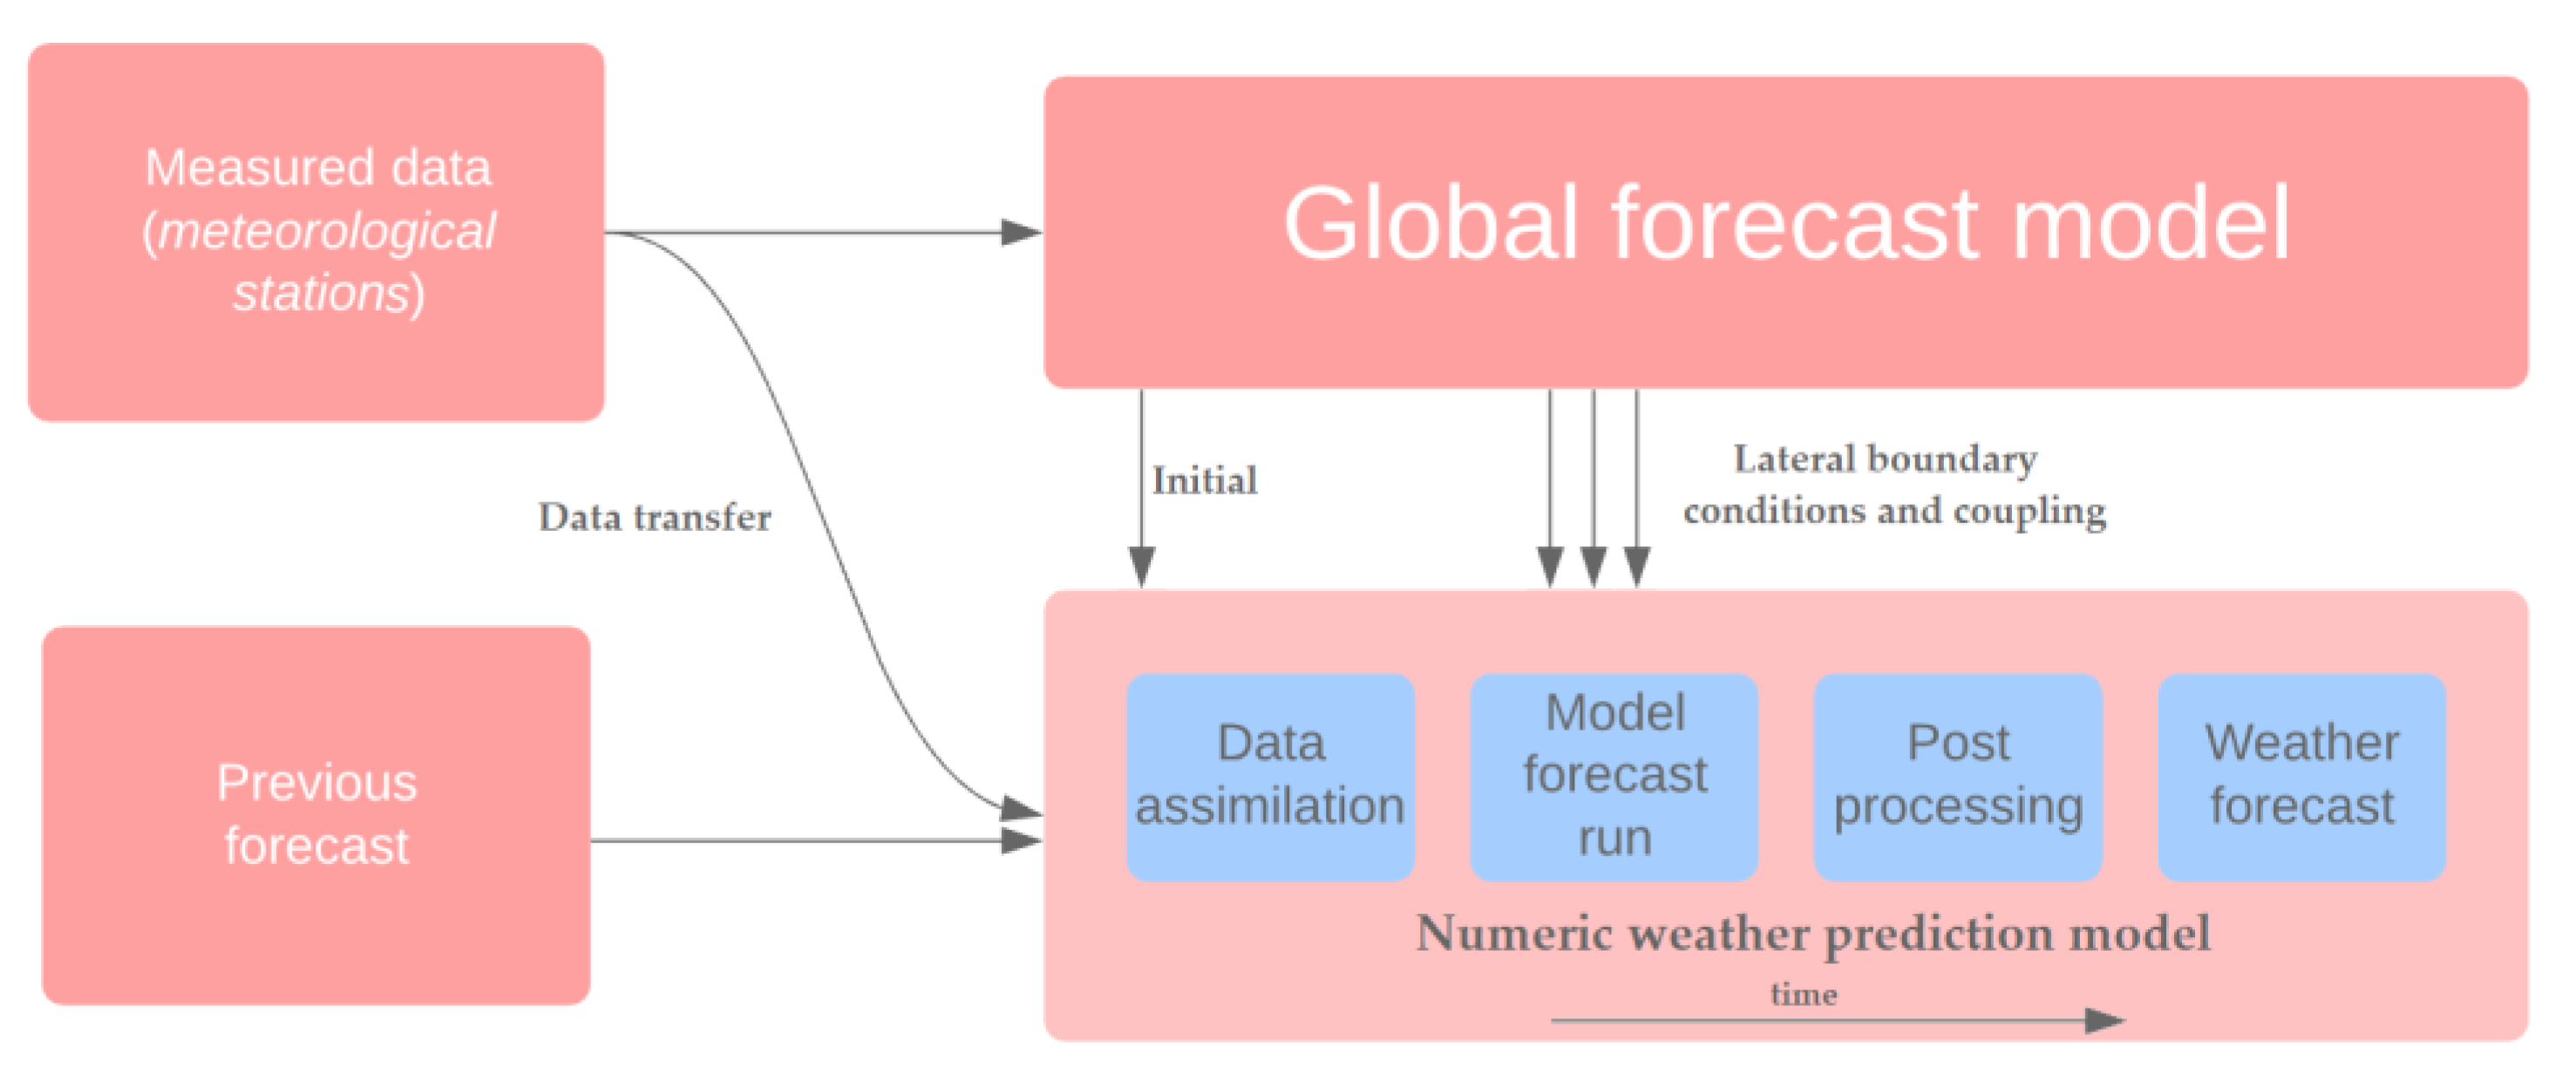
3. Methodology
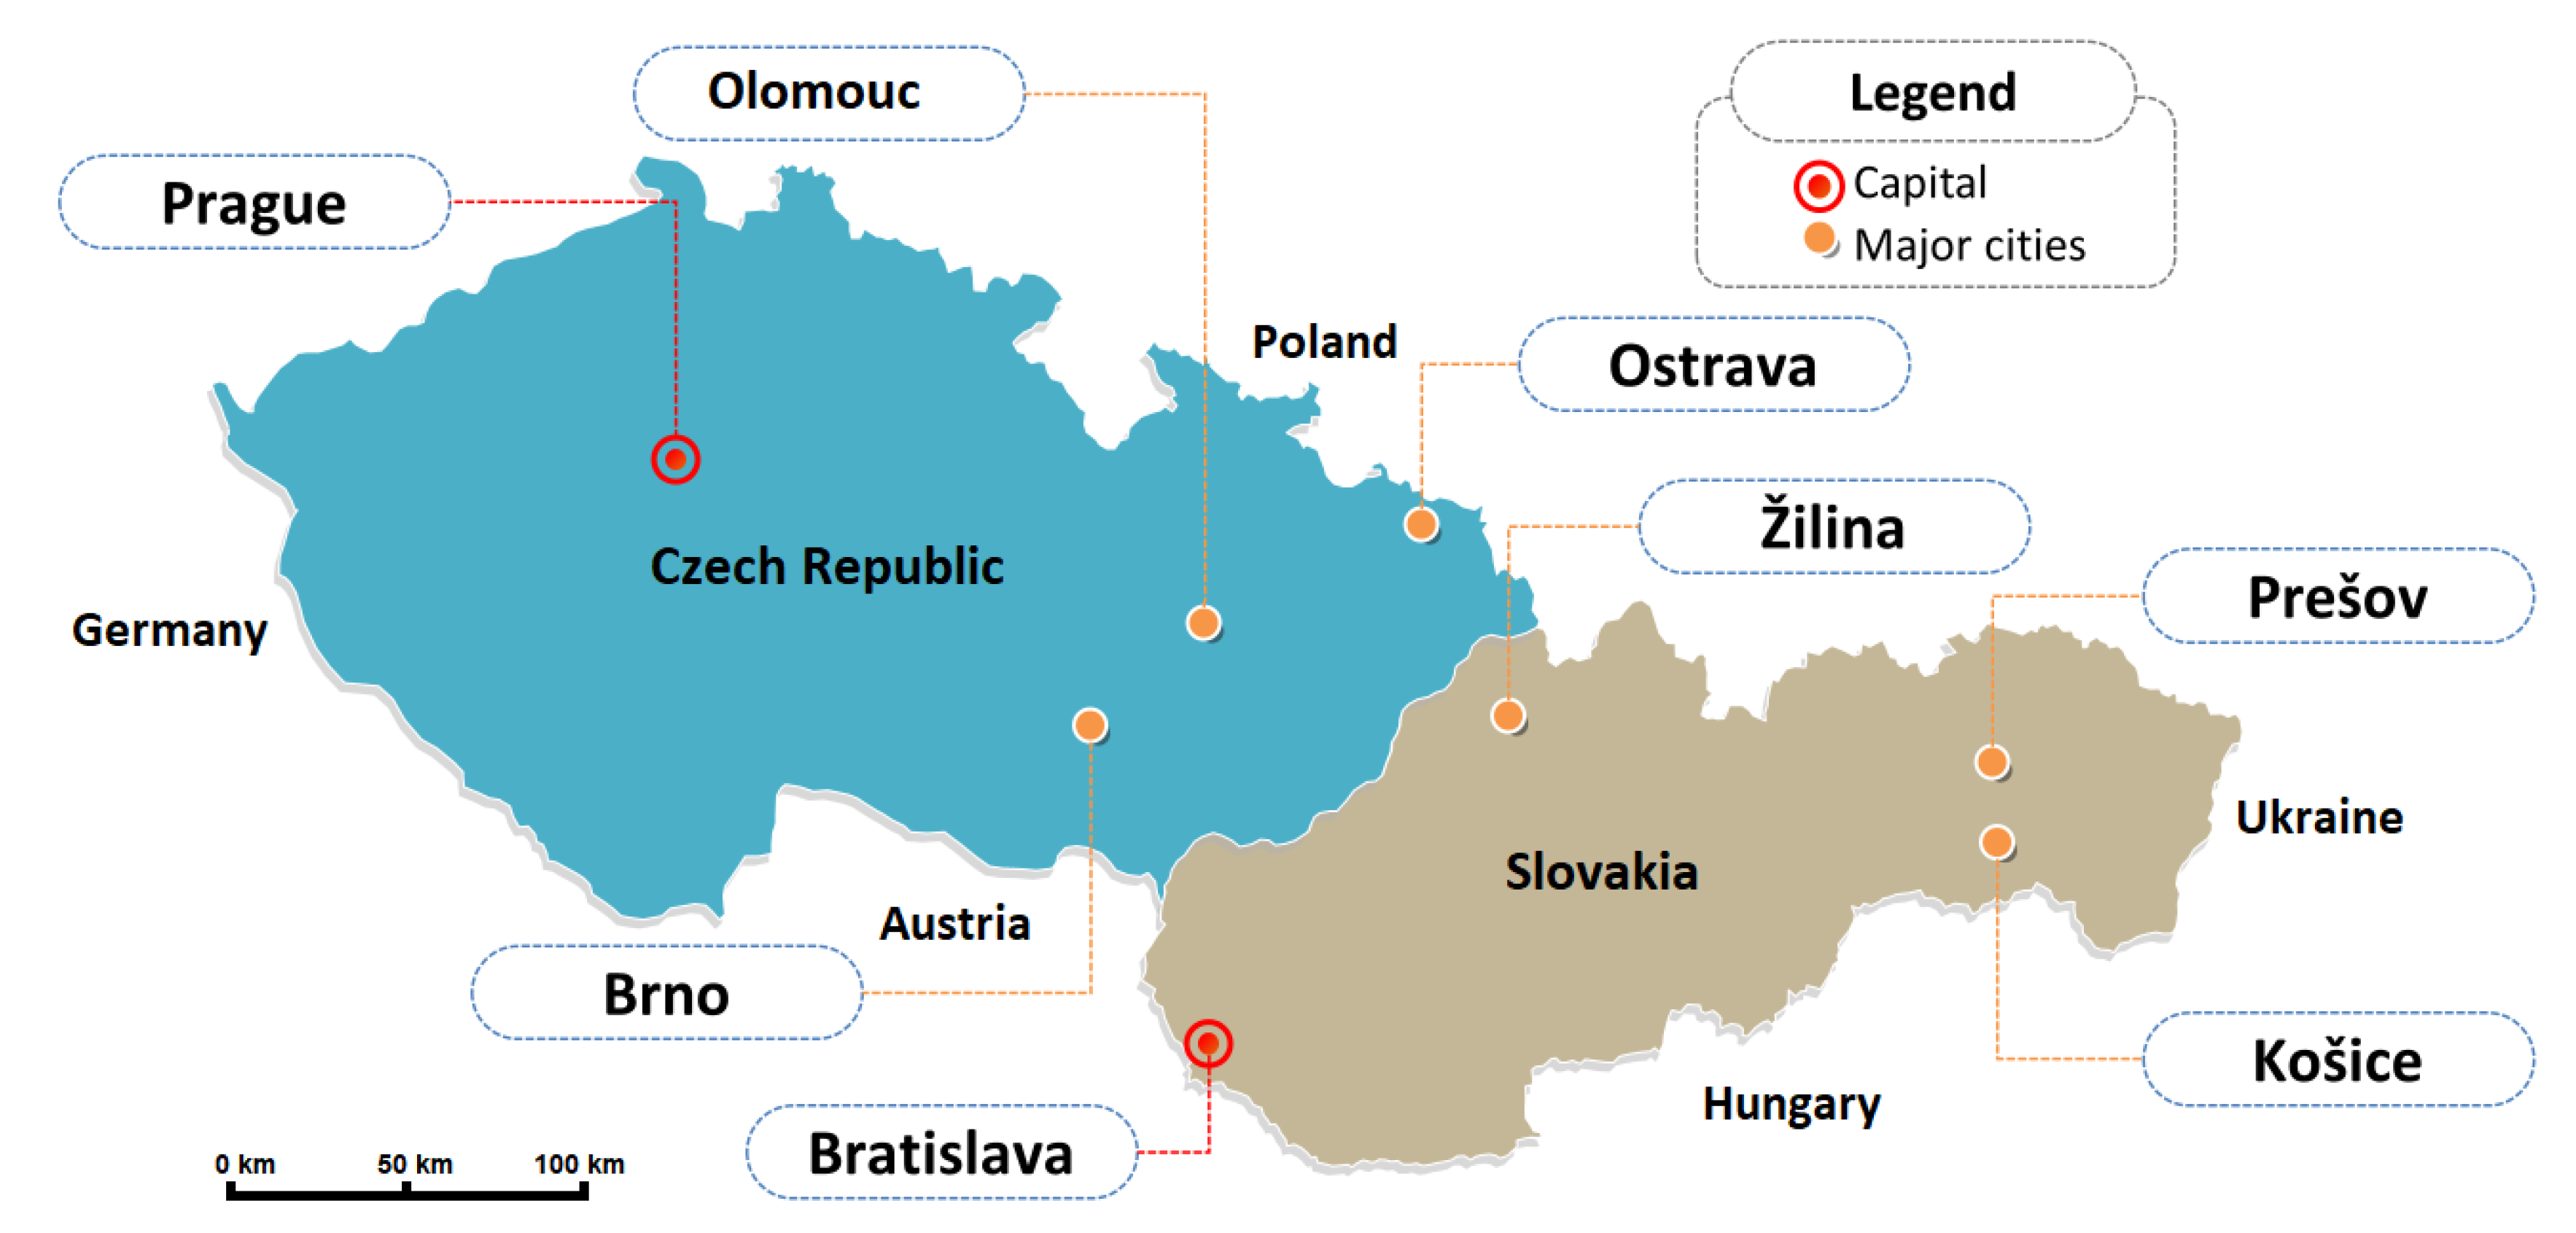
3.1. Data Collection
- Percentage of accuracy expressed as a ratio between the predicted and measured value;
- pivot table providing data regarding the number of cases when the phenomenon was predicted either correctly or falsely.
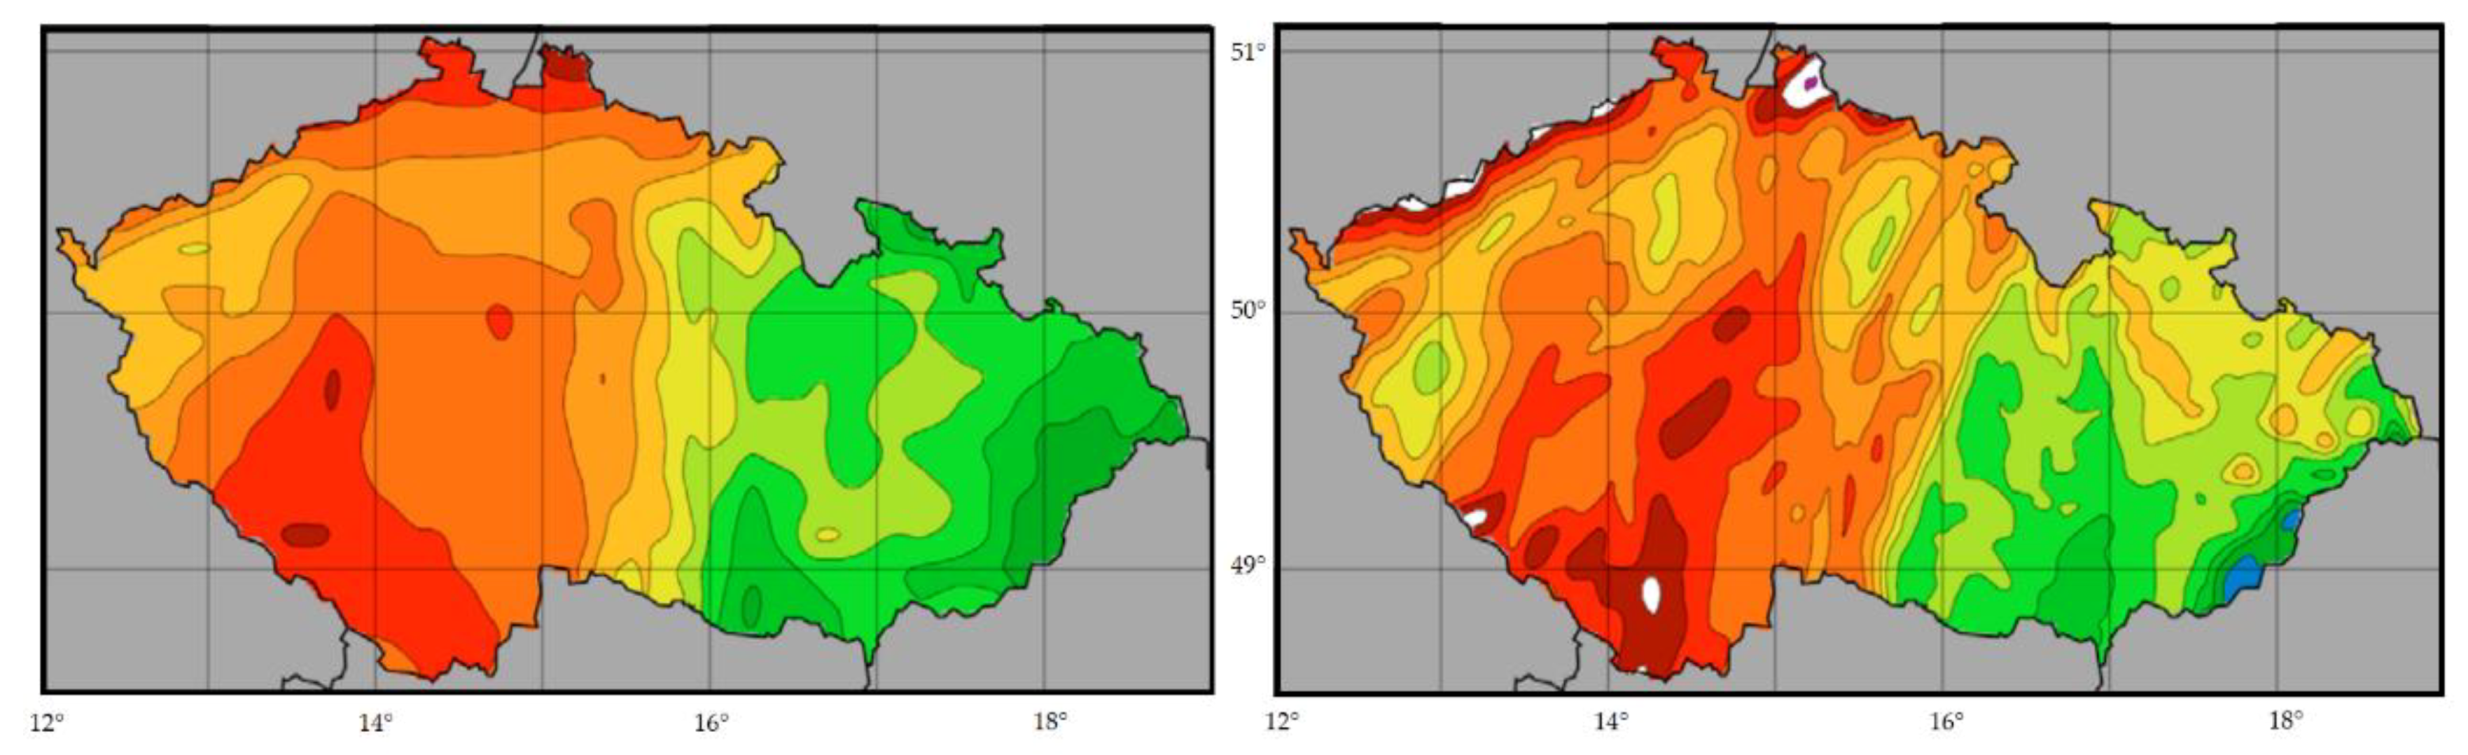
3.2. Analysis of Key Features Affecting the Urban Climate
3.3. Data Integration
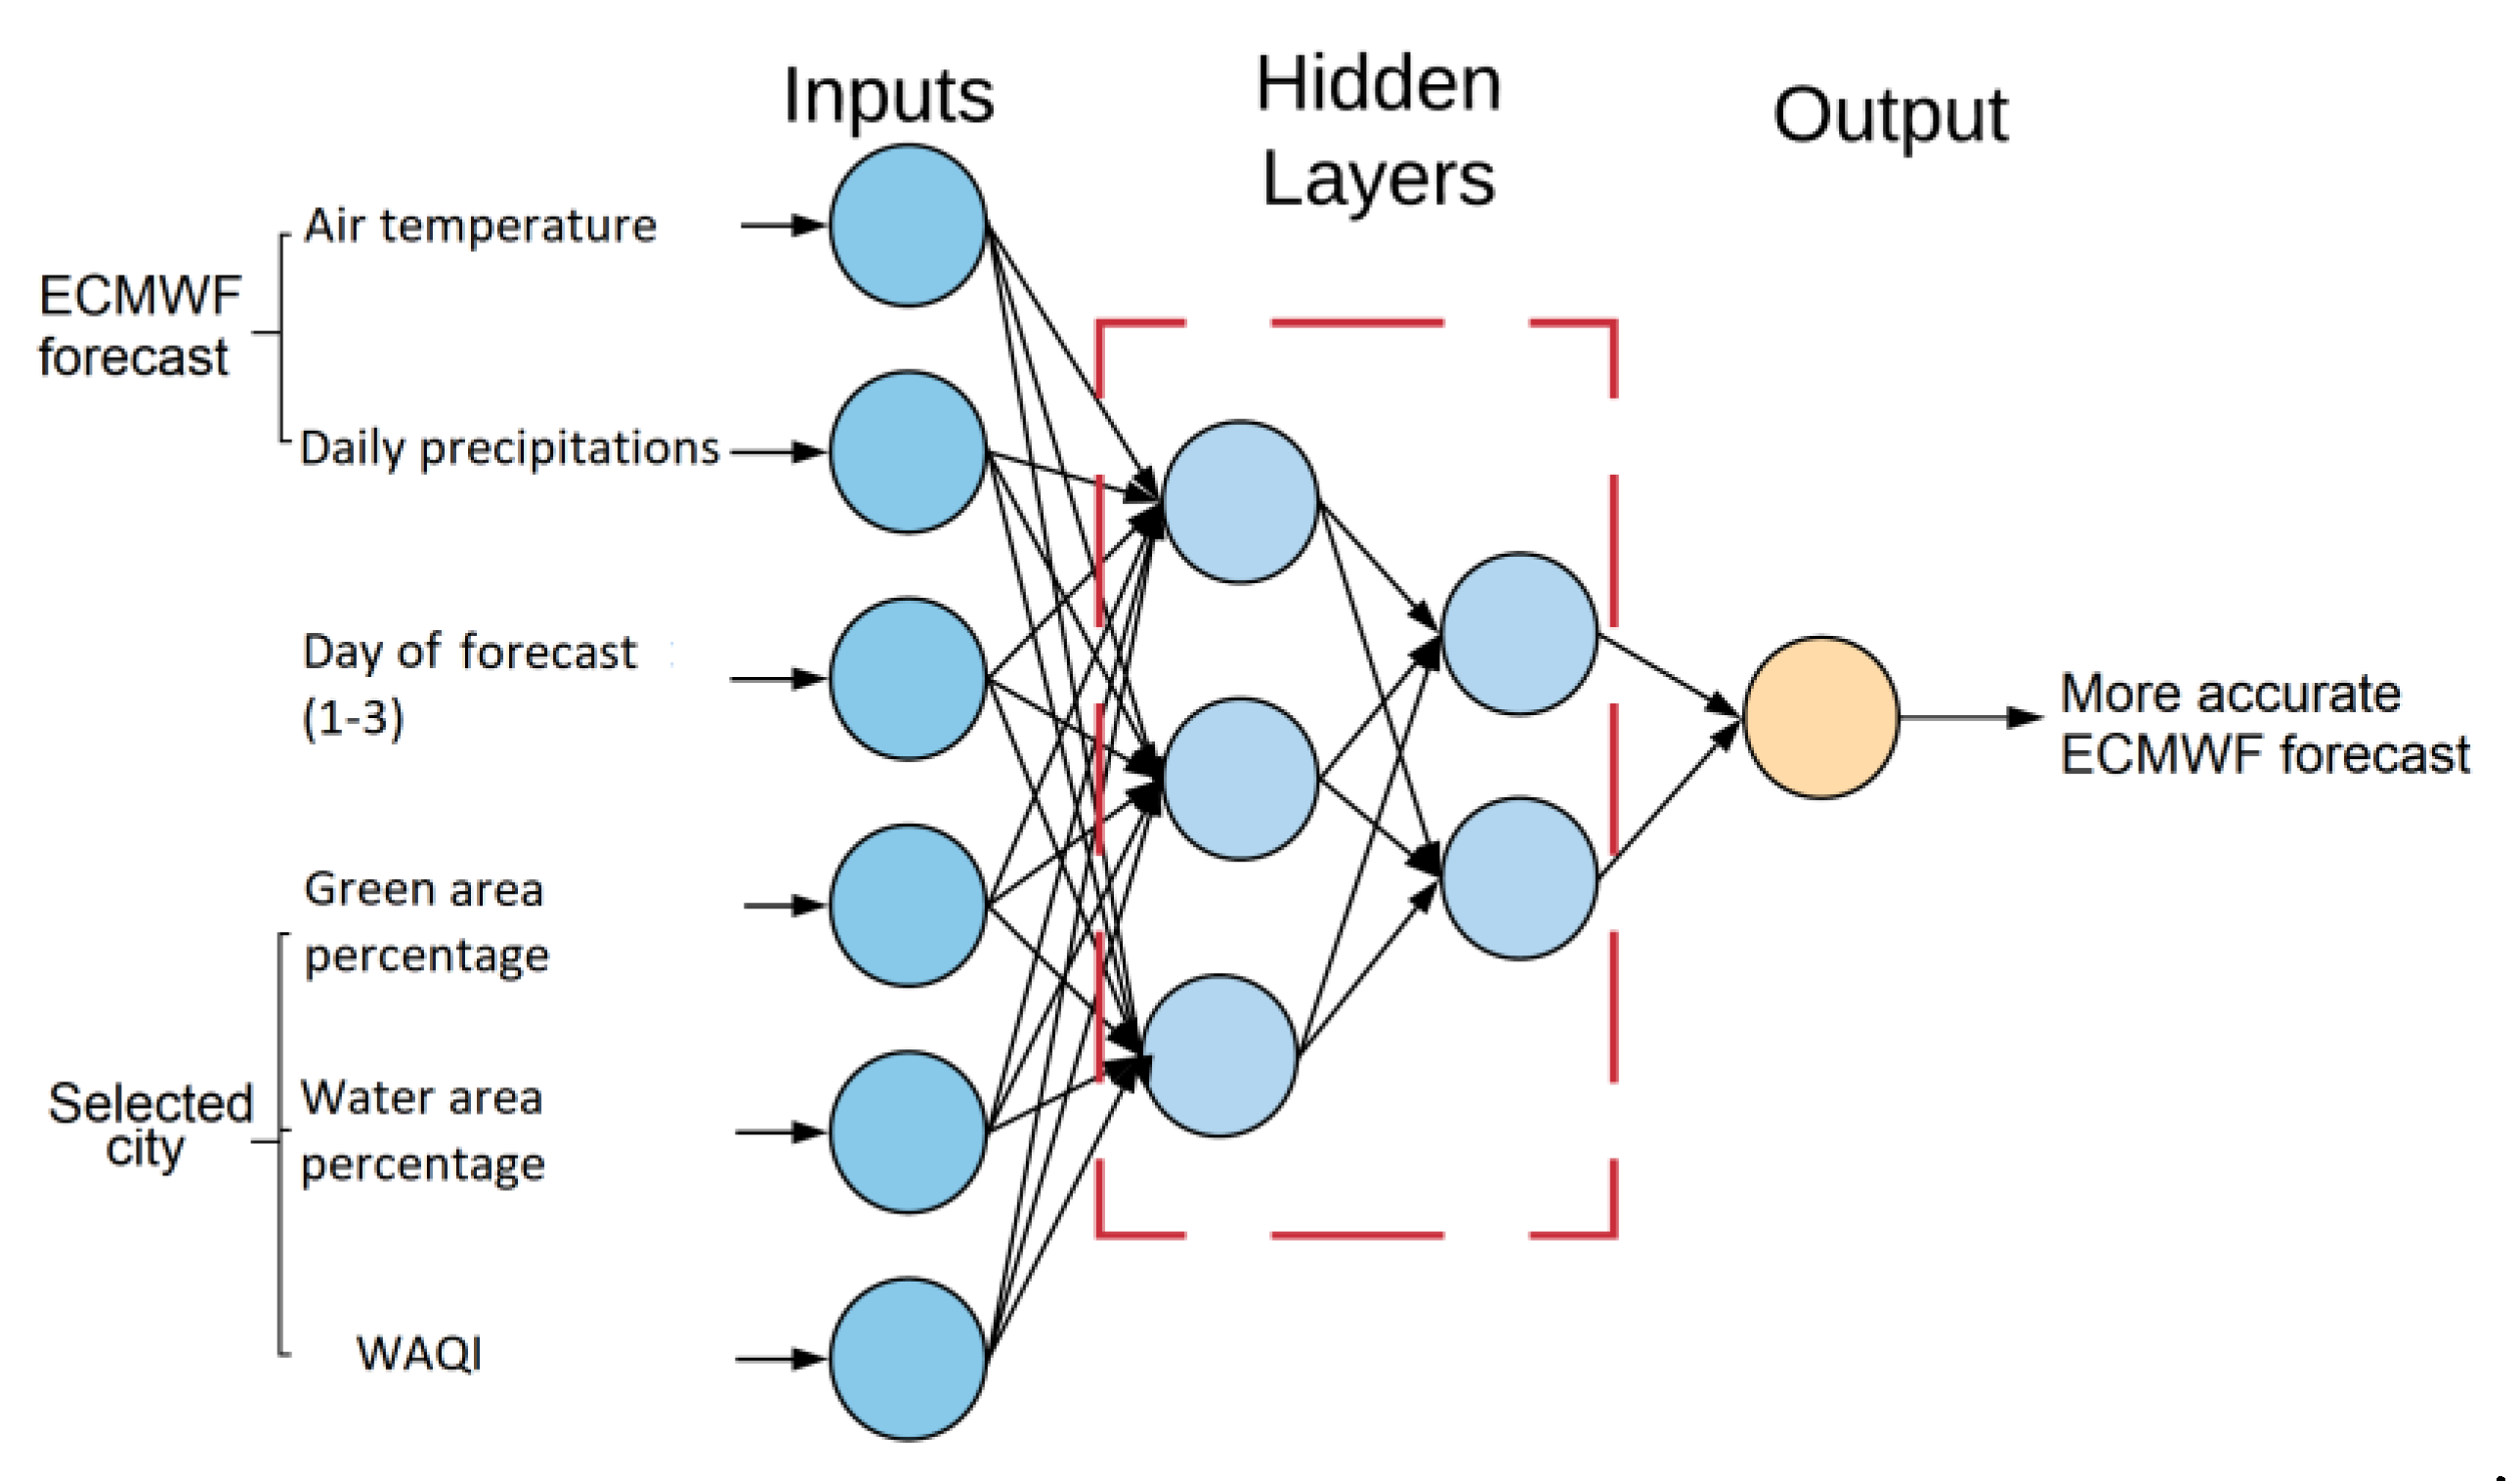
3.4. Neural Network Modelling
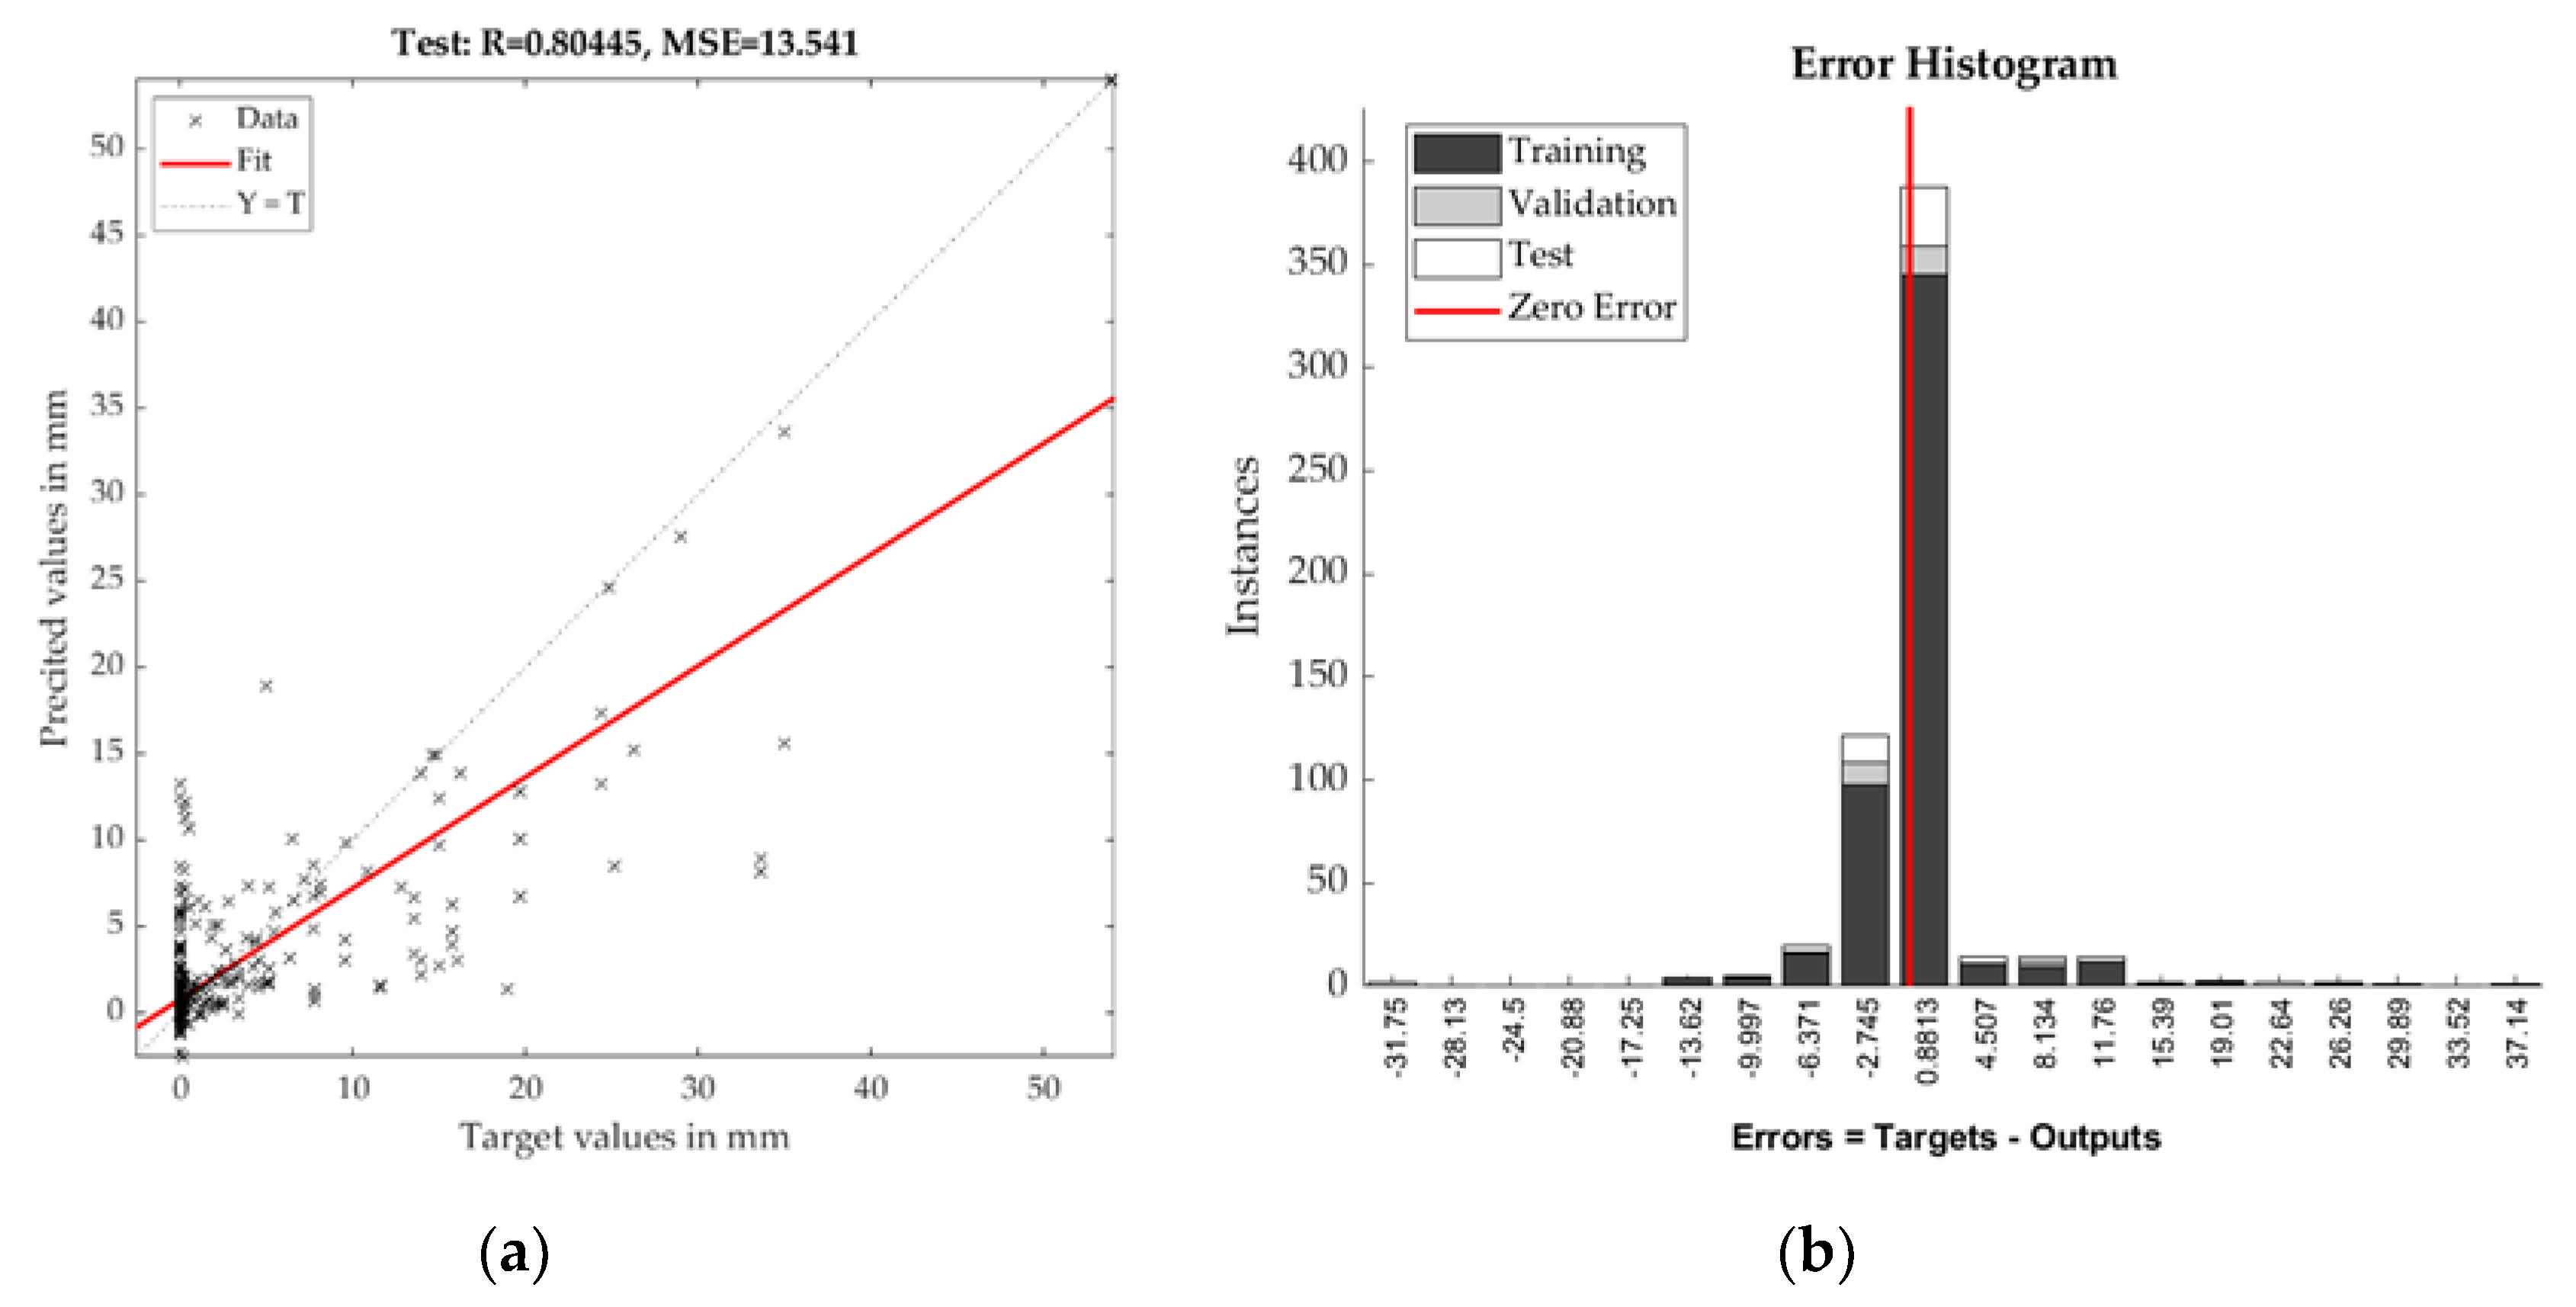
4. Results
- A: Intervention—number of cases when the phenomenon was predicted and really happened. Good forecast.
- B: Error—the phenomenon was not predicted and occurred. Wrong forecast.
- C: False—the phenomenon was predicted and did not arise. Wrong forecast.
- D: Correct—the phenomenon was not predicted and did not happen. Good forecast.
- hour air temperature: ≥ 30 °C
- amount of daily precipitation: ≥ 20 mm/24 h
Cross-Validation of the Proposed Enhancement ECMWF Forecast Model
5. Discussion
6. Conclusions
Author Contributions
Funding
Acknowledgments
Conflicts of Interest
References
- ECMWF—Advancing Global NWP through International Collaboration Home Page. Available online: https://www.ecmwf.int/ (accessed on 20 September 2019).
- Saur, D. Evaluation of the accuracy of numerical weather prediction models. In Artificial Intelligence Perspectives and Applications; Springer: Berlin/Heidelberg, Germany, 2015; Volume 347, pp. 181–191. [Google Scholar] [CrossRef]
- ALADIN—Centre National de Recherches Météorologiques Home Page. Available online: http://www.umr-cnrm.fr/aladin/ (accessed on 20 September 2019).
- Eurostat Home Page. Available online: https://ec.europa.eu/eurostat/home? (accessed on 20 September 2019).
- Chvila, B.; Bludovic, M. Experience with the Operation of New Automatic Weather Stations in Slovakia; Slovak Hydrometeorological Institute: Bratislava, Slovakia, 2017; Available online: https://www.wmo.int/pages/prog/www/IMOP/AWS-conference/Presentations/Topic_3/P3_6_Experiences%20with%20the%20operation%20of%20new%20AWS%20in%20Slovakia.pdf (accessed on 4 November 2019).
- Fournier-Viger, P.; Yang, P.; Lin, J.C.W.; Duong, Q.H.; Dam, T.L.; Frnda, J.; Sevcik, L.; Voznak, M. Discovering periodic itemsets using novel periodicity measures. Adv. Electr. Electron. Eng. 2019, 17, 33–44. [Google Scholar] [CrossRef]
- Frnda, J.; Nedoma, J.; Vanus, J.; Martinek, R. A Hybrid QoS-QoE Estimation Systemfor IPTV Service. Electronics 2019, 8, 585. [Google Scholar] [CrossRef]
- Wang, Y.; Belluš, M.; Ehrlich, A.; Mile, M.; Pristov, N.; Smolíková, P.; Klarić, D.; Španiel, O.; Cedilnik, J.; Mašek, J.; et al. 27 Years of Regional Cooperation for Limited Area Modelling in Central Europe. Bull. Am. Meteorol. Soc. 2018, 99, 1415–1432. [Google Scholar] [CrossRef]
- Sekula, P.; Bokwa, A.; Bochenek, B.; Zimnoch, M. Prediction of Air Temperature in the Polish Western Carpathian Mountains with the ALADIN-HIRLAM Numerical Weather Prediction System. Atmosphere 2019, 10, 186. [Google Scholar] [CrossRef]
- Vokoun, M.; Hanel, M. Comparing ALADIN-CZ and ALADIN-LAEF Precipitation Forecasts for Hydrological Modelling in the Czech. Republic. Adv. Meteorol. 2018, 5368438. [Google Scholar] [CrossRef]
- Ernst, S.; LaDue, D.; Gerard, A. Understanding emergency manager forecastuse in severe weather events. J. Oper. Meteorol. 2018, 6, 95–105. [Google Scholar] [CrossRef]
- Jhun, I.; Coull, B.A.; Schwartz, J.; Hubbell, B.; Koutrakis, P. The impact of weather changes on air quality and health in the United States in 1994–2012. Environ. Res. Lett. 2015, 10. [Google Scholar] [CrossRef] [PubMed]
- Pearce, J.L.; Beringer, J.; Nicholls, N.; Hyndman, R.J.; Tapper, N.J. Quantifying the influence of local meteorology on air quality using generalized additive models. Atmos. Environ. 2011, 45, 1328–1336. [Google Scholar] [CrossRef]
- Ramsey, N.R.; Klein, P.M.; Moore, B. The impact of meteorological parameters on urban air quality. Atmos. Environ. 2014, 86, 58–67. [Google Scholar] [CrossRef]
- Chen, Y.C.; Liao, Y.J.; Yao, C.K.; Honjo, T.; Wang, C.K.; Lin, T.P. The application of a high-density street-level air temperature observation network (HiSAN): The relationship between air temperature, urban development, and geographic features. Sci. Total Environ. 2019, 685, 710–722. [Google Scholar] [CrossRef] [PubMed]
- Acero, J.A.; Herranz-Pascual, K. A comparison of thermal comfort conditions in four urban spaces by means of measurements and modelling techniques. Build. Environ. 2015, 93, 245–257. [Google Scholar] [CrossRef]
- Bastin, J.F.; Finegold, Y.; Garcia, C.; Mollicone, D.; Rezende, M.; Routh, D.; Zohner, C.M.; Crowther, T.W. The global tree restoration potential. Science 2019, 365, 76–79. [Google Scholar] [CrossRef] [PubMed]
- New Urban Agenda—United Nations Home Page. Available online: http://habitat3.org/the-new-urban-agenda/ (accessed on 24 September 2019).
- Bastin, J.F.; Clark, E.; Elliott, T.; Hart, S.; van den Hoogen, J.; Hordijk, I.; Mo, L.; Ma, H.; Majumder, S.; Manoli, G.; et al. Understanding climate change from a global analysis of city analogues. PLoS ONE 2019, 14. [Google Scholar] [CrossRef]
- Rahman, M.M.; Mazaheri, M.; Clifford, S.; Morawska, L. Estimate of main local sources to ambient ultra fine particle number concentrations in an urban area. Atmos. Res. 2017, 194, 178–189. [Google Scholar] [CrossRef]
- Dueben, P.D.; Bauer, P. Challenges and design choices for global weather and climate models based on machine learning. Geosci. Model Dev. 2018, 11, 3999–4009. [Google Scholar] [CrossRef]
- Rasp, S.; Lerch, S. Neural Networks for Postprocessing Ensemble Weather Forecasts. Mon. Weather Rev. 2018, 146, 3885–3900. [Google Scholar] [CrossRef]
- Slovak Hydrometeorological Institute Home Page. Available online: http://www.shmu.sk/en/?page=1793 (accessed on 24 September 2019).
- Czech Hydrometeorological Institute Home Page. Available online: http://portal.chmi.cz/?l=en (accessed on 24 September 2019).
- Urban Atlas—European Environment Agency Home Page. Available online: https://www.eea.europa.eu/data-and-maps/data/copernicus-land-monitoring-service-urban-atlas#tab-data-visualisations (accessed on 24 September 2019).
- Air Quality Index Visual Map Home Page. Available online: https://aqicn.org/map/world/ (accessed on 24 September 2019).


| City/Weather Station | Population (Thousands) | Area (Square km) | Altitude (Metres above Sea Level) | ALADIN Model Altitude | ECMWF Model Altitude |
|---|---|---|---|---|---|
| Prague/Prague-Karlov Brno/Brno-Žabovřesky Ostrava/Slezká Ostrava | 1309 381 289 | 496 230 214 | 260 236 269 | 190 214 219 | 262 273 227 |
| Bratislava/Brat. Mlynská Dolina | 433 | 367 | 182 | 160 | 161 |
| Žilina/Žilina mesto Košice/Košice mesto Olomouc/Olomouc Holice | 81 239 101 | 80 243 100 | 365 203 210 | 386 242 225 | 509 327 230 |
| Prešov/Prešov vojsko | 89 | 70 | 307 | 291 | 386 |
| City | Percentage of Green Urban Areas | Percentage of Urban Water Areas | Air Quality Index—30 Days Summary (Example: August 31) |
|---|---|---|---|
| Prague Brno Ostrava | 18.77 30.63 20.16 | 1.5 1.4 2.3 | 60%—Good, 39%—Moderate, 1%—Unhealthy, 53%—Good, 46%—Moderate, 1%—Unhealthy 56%—Good, 42%—Moderate, 1%—Unhealthy for Sensitive Groups, 1%—Unhealthy |
| Bratislava | 11.05 | 4.5 | 57%—Good, 43%—Moderate |
| Žilina Košice Olomouc | 33.25 16.15 13.54 | 4.2 0.6 1.2 | 57%—Good, 43%—Moderate 50%—Good, 49%—Moderate, 1%—Unhealthy for Sensitive Groups 77%—Good, 22%—Moderate, 1%—Unhealthy for Sensitive Groups |
| Prešov | 37.51 | 0.4 | 43%—Good, 57%—Moderate |
| Type of Parameter | Description |
|---|---|
| Forecast meteorological variables: Forecast models (meteograms) Measuring system (forecast verification) Forecast period Forecast run Air pollution impact | Air temperature (3 h step), precipitation (24 h summary) ECMWF, ALADIN, yr.no Weather stations in selected cities (inner-city location) 1st, 2nd, or 3rd day 00:00 UTC WAQI |
| Green infrastructure | Vegetation and water areas ratio |
| Numerical Model | Relative Accuracy of the Forecast |
|---|---|
| ALADIN (SK+ CZ) ECMWF Yr.no | 0.9921 0.9857 0.9956 |
| Numerical Model | Relative Accuracy of the Forecast |
|---|---|
| ALADIN (SK+ CZ) ECMWF Yr.no | 0.7292 0.824 0.7824 |
| Model | ALADIN | ECMWF | YR.NO | |||
|---|---|---|---|---|---|---|
| Variable | T/°C | mm/24 h | T/°C | mm/24 h | T/°C | mm/24 h |
| Number of Occurrences | ||||||
| a | 120 | 6 | 92 | 2 | 98 | 2 |
| b | 28 | 11 | 51 | 15 | 36 | 15 |
| c | 27 | 9 | 14 | 0 | 25 | 4 |
| d | 1013 | 568 | 1031 | 577 | 1029 | 573 |
| POD | 0.811 | 0.353 | 0.643 | 0.118 | 0.731 | 0.118 |
| FAR | 0.184 | 0.6 | 0.132 | 0 | 0.203 | 0.667 |
| Numerical Model | Relative Accuracy of Forecast |
|---|---|
| ALADIN (SK+CZ) | 0.9637 |
| ECMWF | 0.953 |
| Yr.no | 0.9876 |
| Our Model | 0.9678 |
| Numerical Model | Relative Accuracy of Forecast |
|---|---|
| ALADIN (SK+CZ) | 0.783 |
| ECMWF | 0.6916 |
| Yr.no | 0.8152 |
| Our Model | 0.7689 |
© 2019 by the authors. Licensee MDPI, Basel, Switzerland. This article is an open access article distributed under the terms and conditions of the Creative Commons Attribution (CC BY) license (http://creativecommons.org/licenses/by/4.0/).
Share and Cite
Frnda, J.; Durica, M.; Nedoma, J.; Zabka, S.; Martinek, R.; Kostelansky, M. A Weather Forecast Model Accuracy Analysis and ECMWF Enhancement Proposal by Neural Network. Sensors 2019, 19, 5144. https://doi.org/10.3390/s19235144
Frnda J, Durica M, Nedoma J, Zabka S, Martinek R, Kostelansky M. A Weather Forecast Model Accuracy Analysis and ECMWF Enhancement Proposal by Neural Network. Sensors. 2019; 19(23):5144. https://doi.org/10.3390/s19235144
Chicago/Turabian StyleFrnda, Jaroslav, Marek Durica, Jan Nedoma, Stanislav Zabka, Radek Martinek, and Michal Kostelansky. 2019. "A Weather Forecast Model Accuracy Analysis and ECMWF Enhancement Proposal by Neural Network" Sensors 19, no. 23: 5144. https://doi.org/10.3390/s19235144
APA StyleFrnda, J., Durica, M., Nedoma, J., Zabka, S., Martinek, R., & Kostelansky, M. (2019). A Weather Forecast Model Accuracy Analysis and ECMWF Enhancement Proposal by Neural Network. Sensors, 19(23), 5144. https://doi.org/10.3390/s19235144