Absolute Distance Measurement Using Frequency-Scanning Interferometry Based on Hilbert Phase Subdivision


Abstract
:1. Introduction
2. Materials and Methods
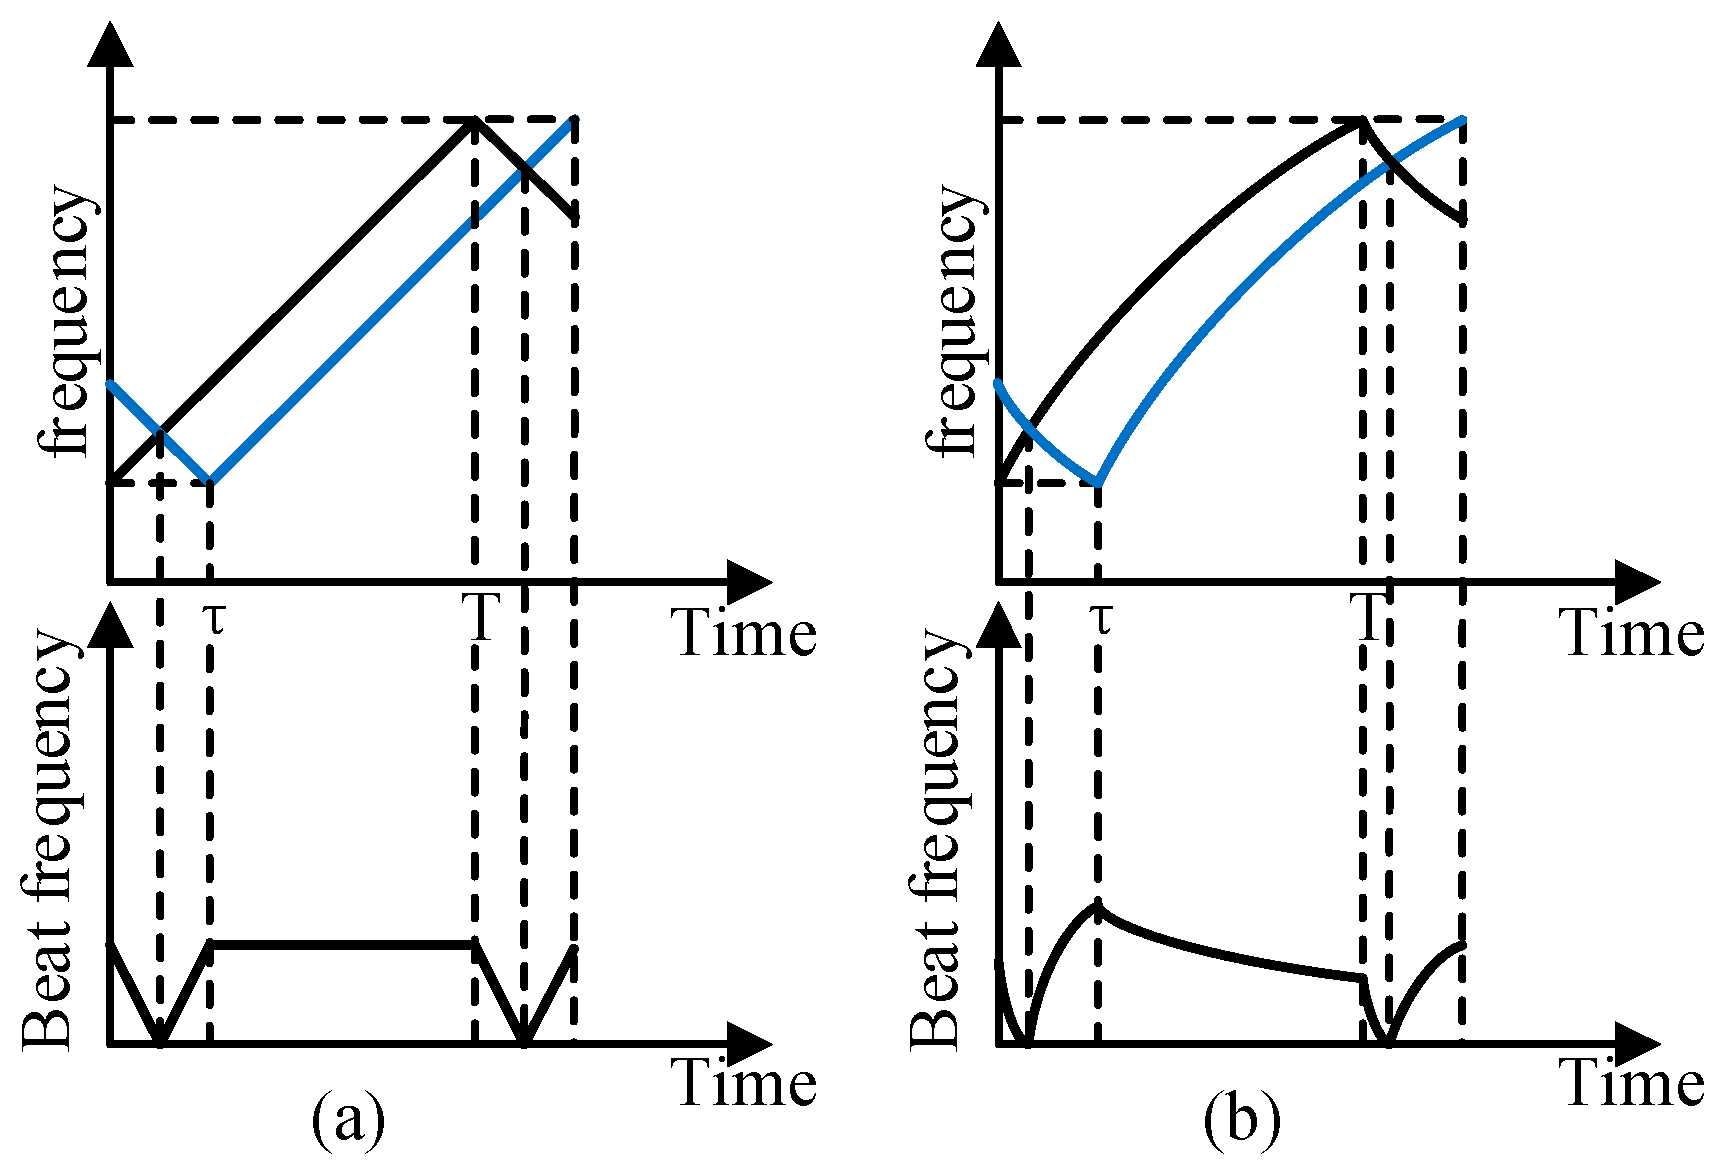
2.1. The Basic Principle of FSI
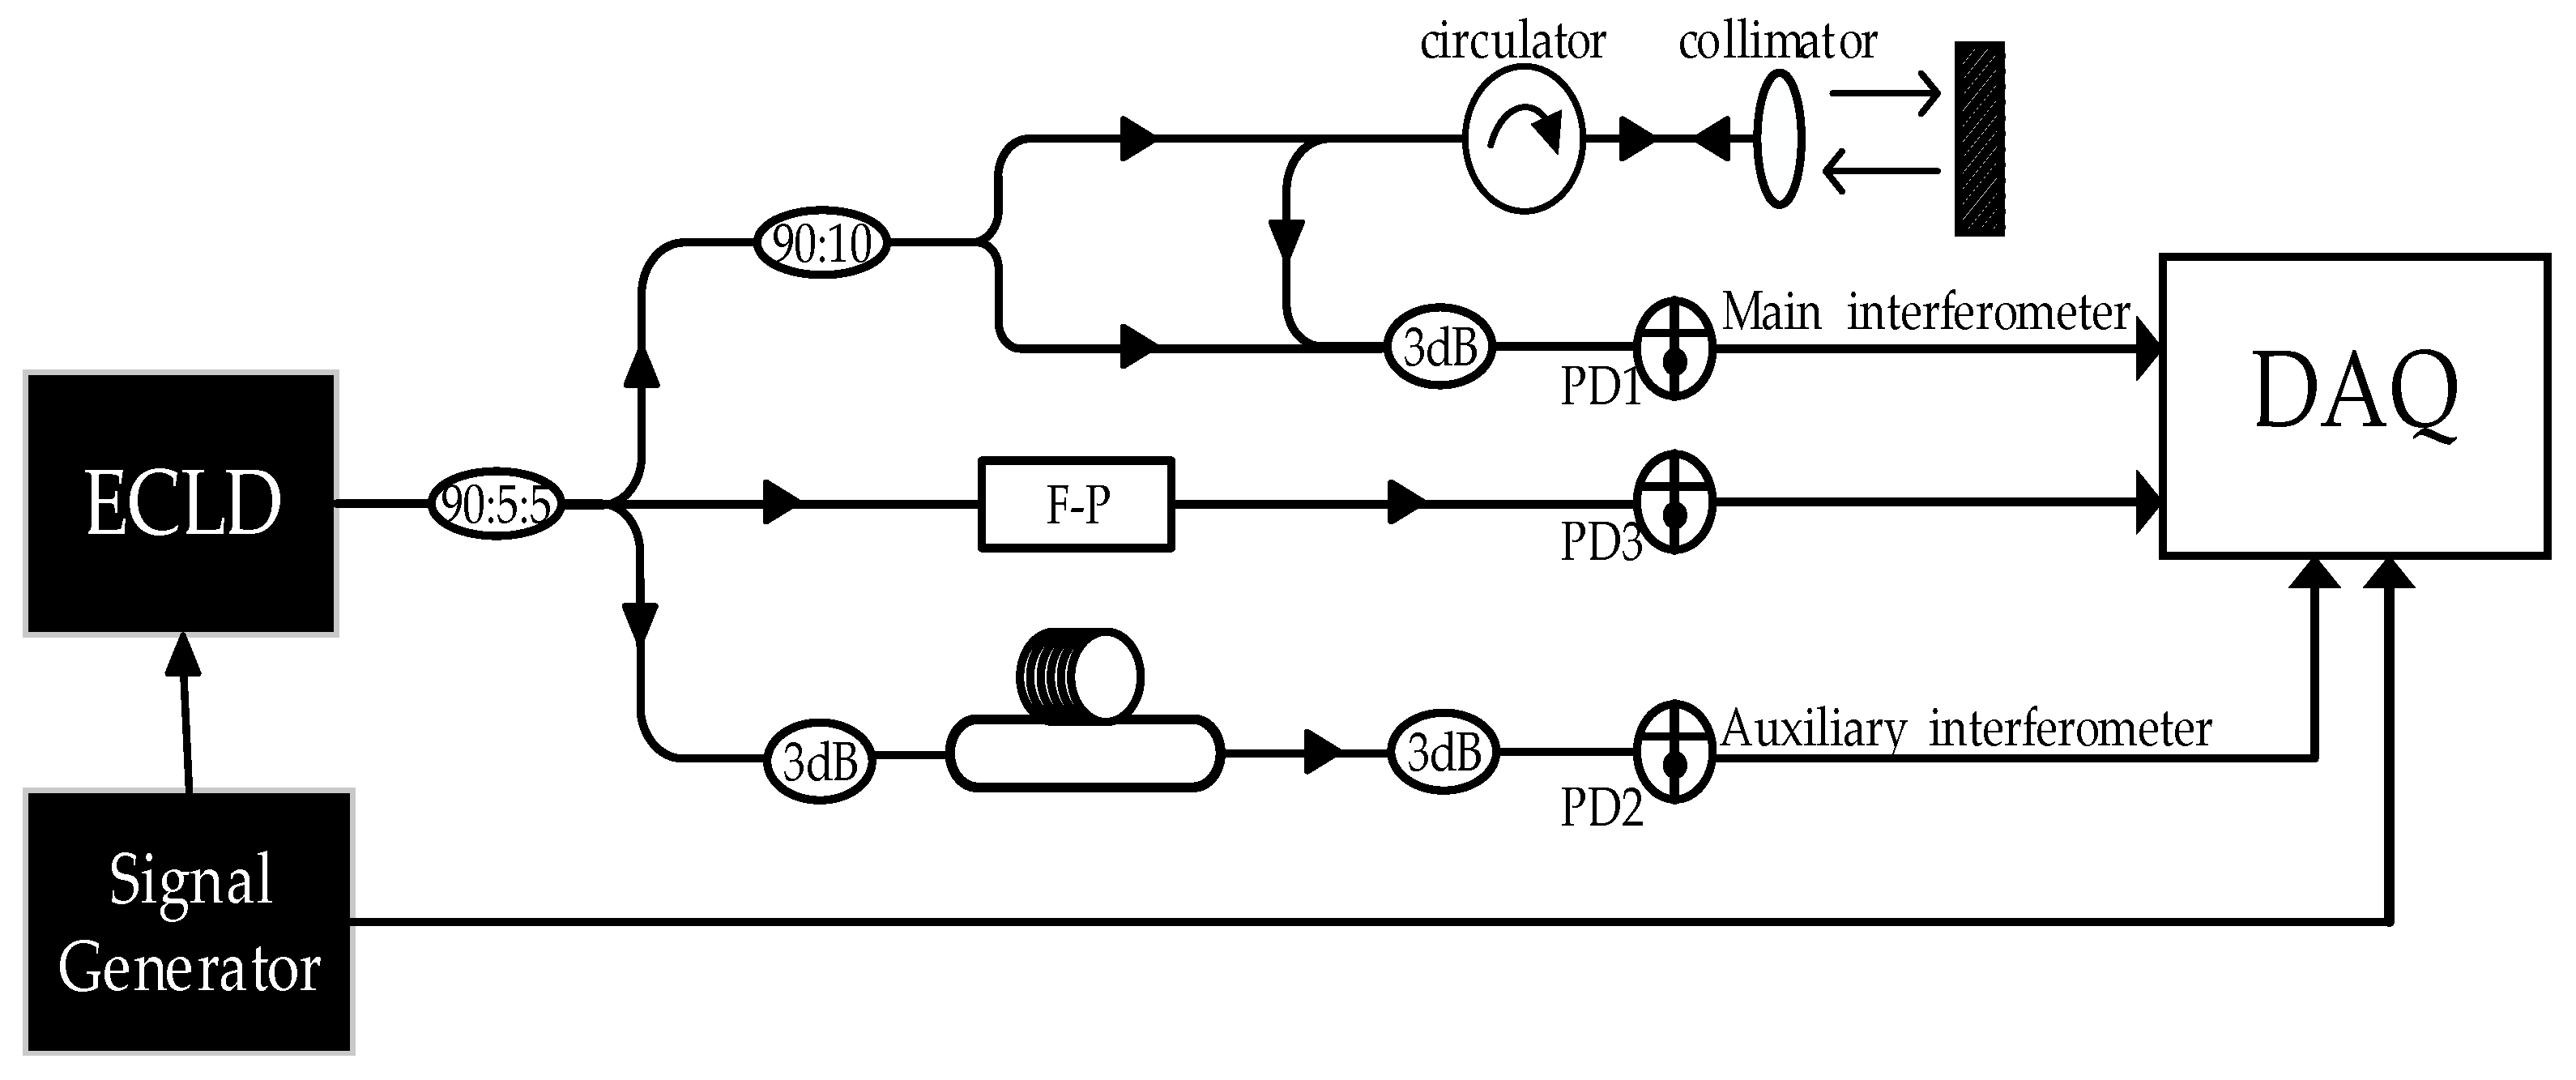
2.2. System Description
2.3. The Principle of the Frequency-Sampling Method
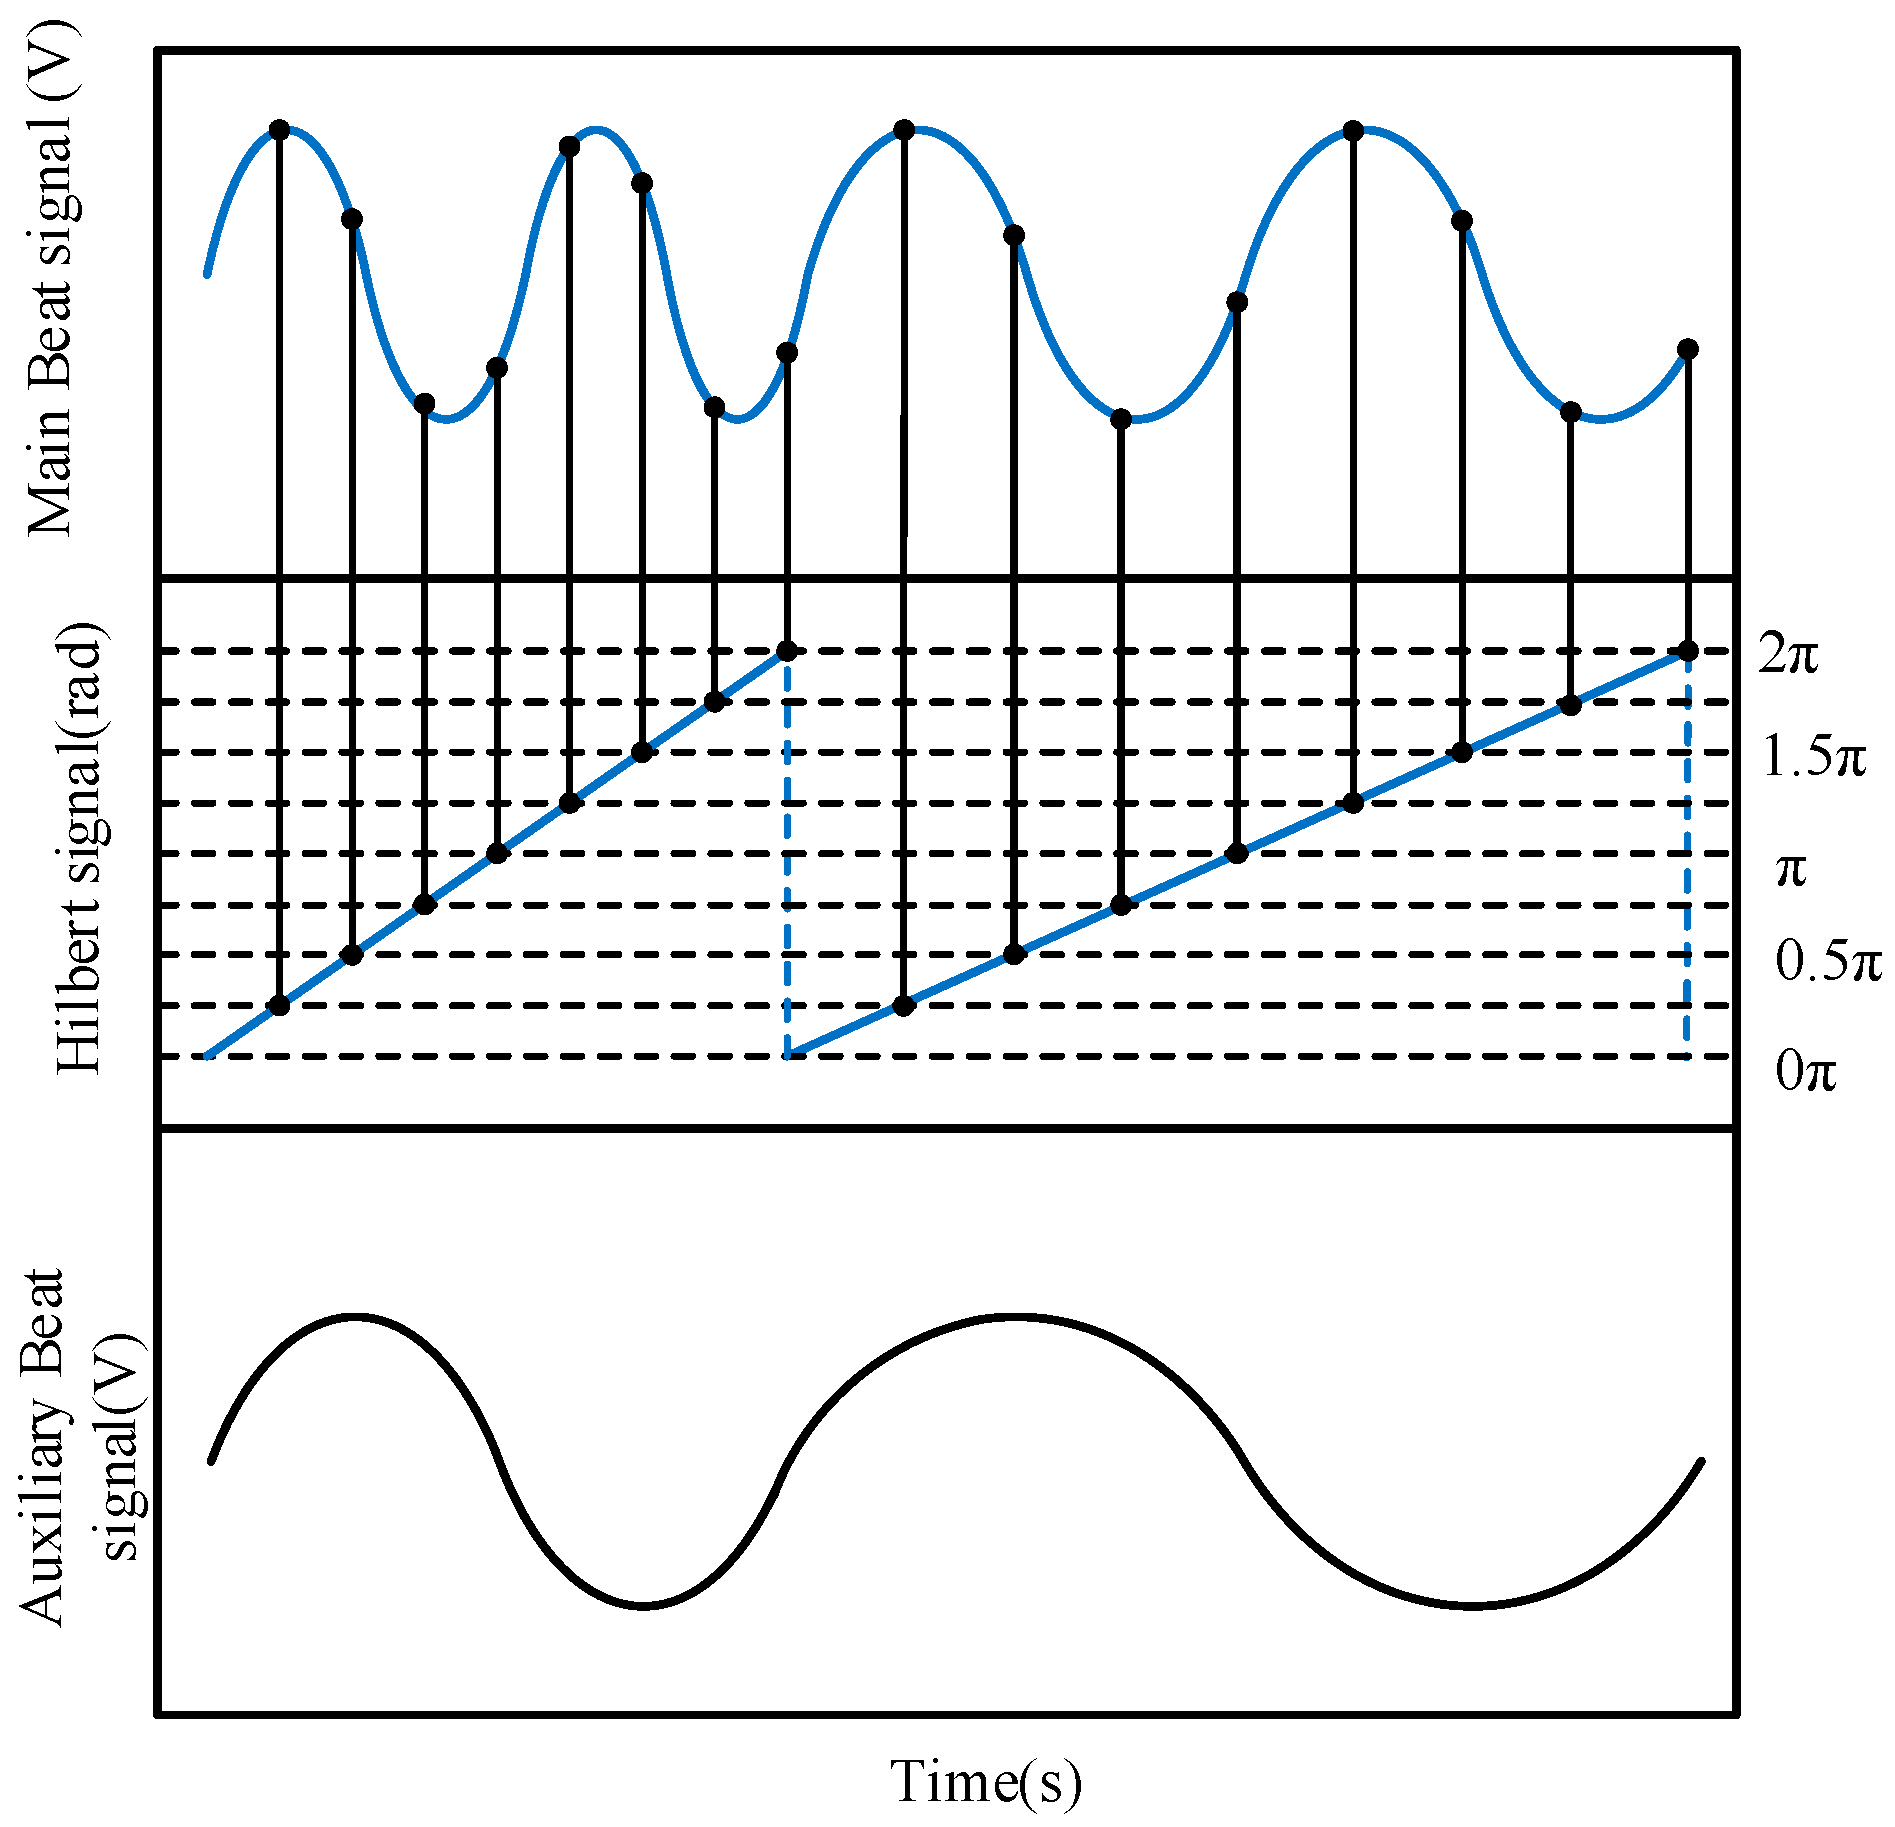
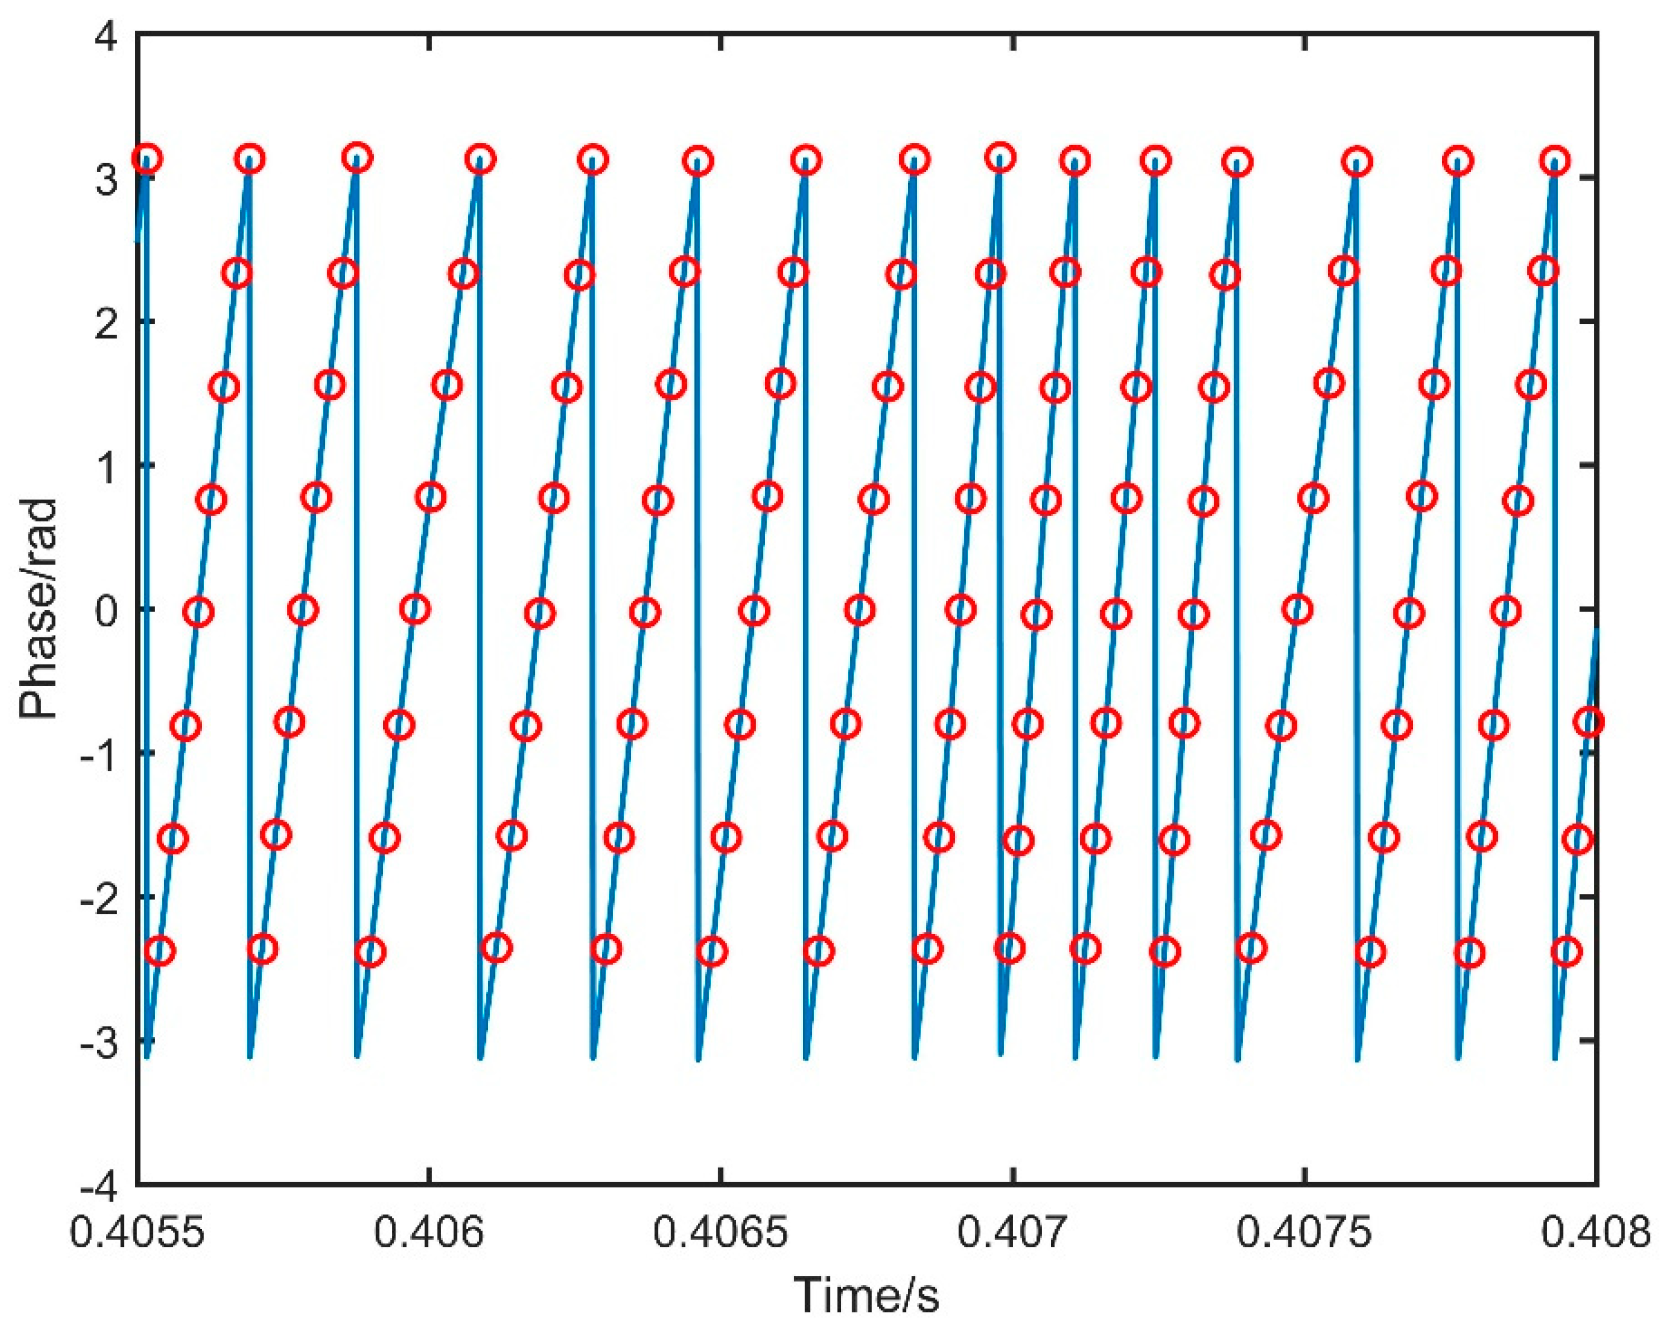
2.4. The Principle of Hilbert Phase Subdivision Resampling
3. Experiments and Results
3.1. Experiment
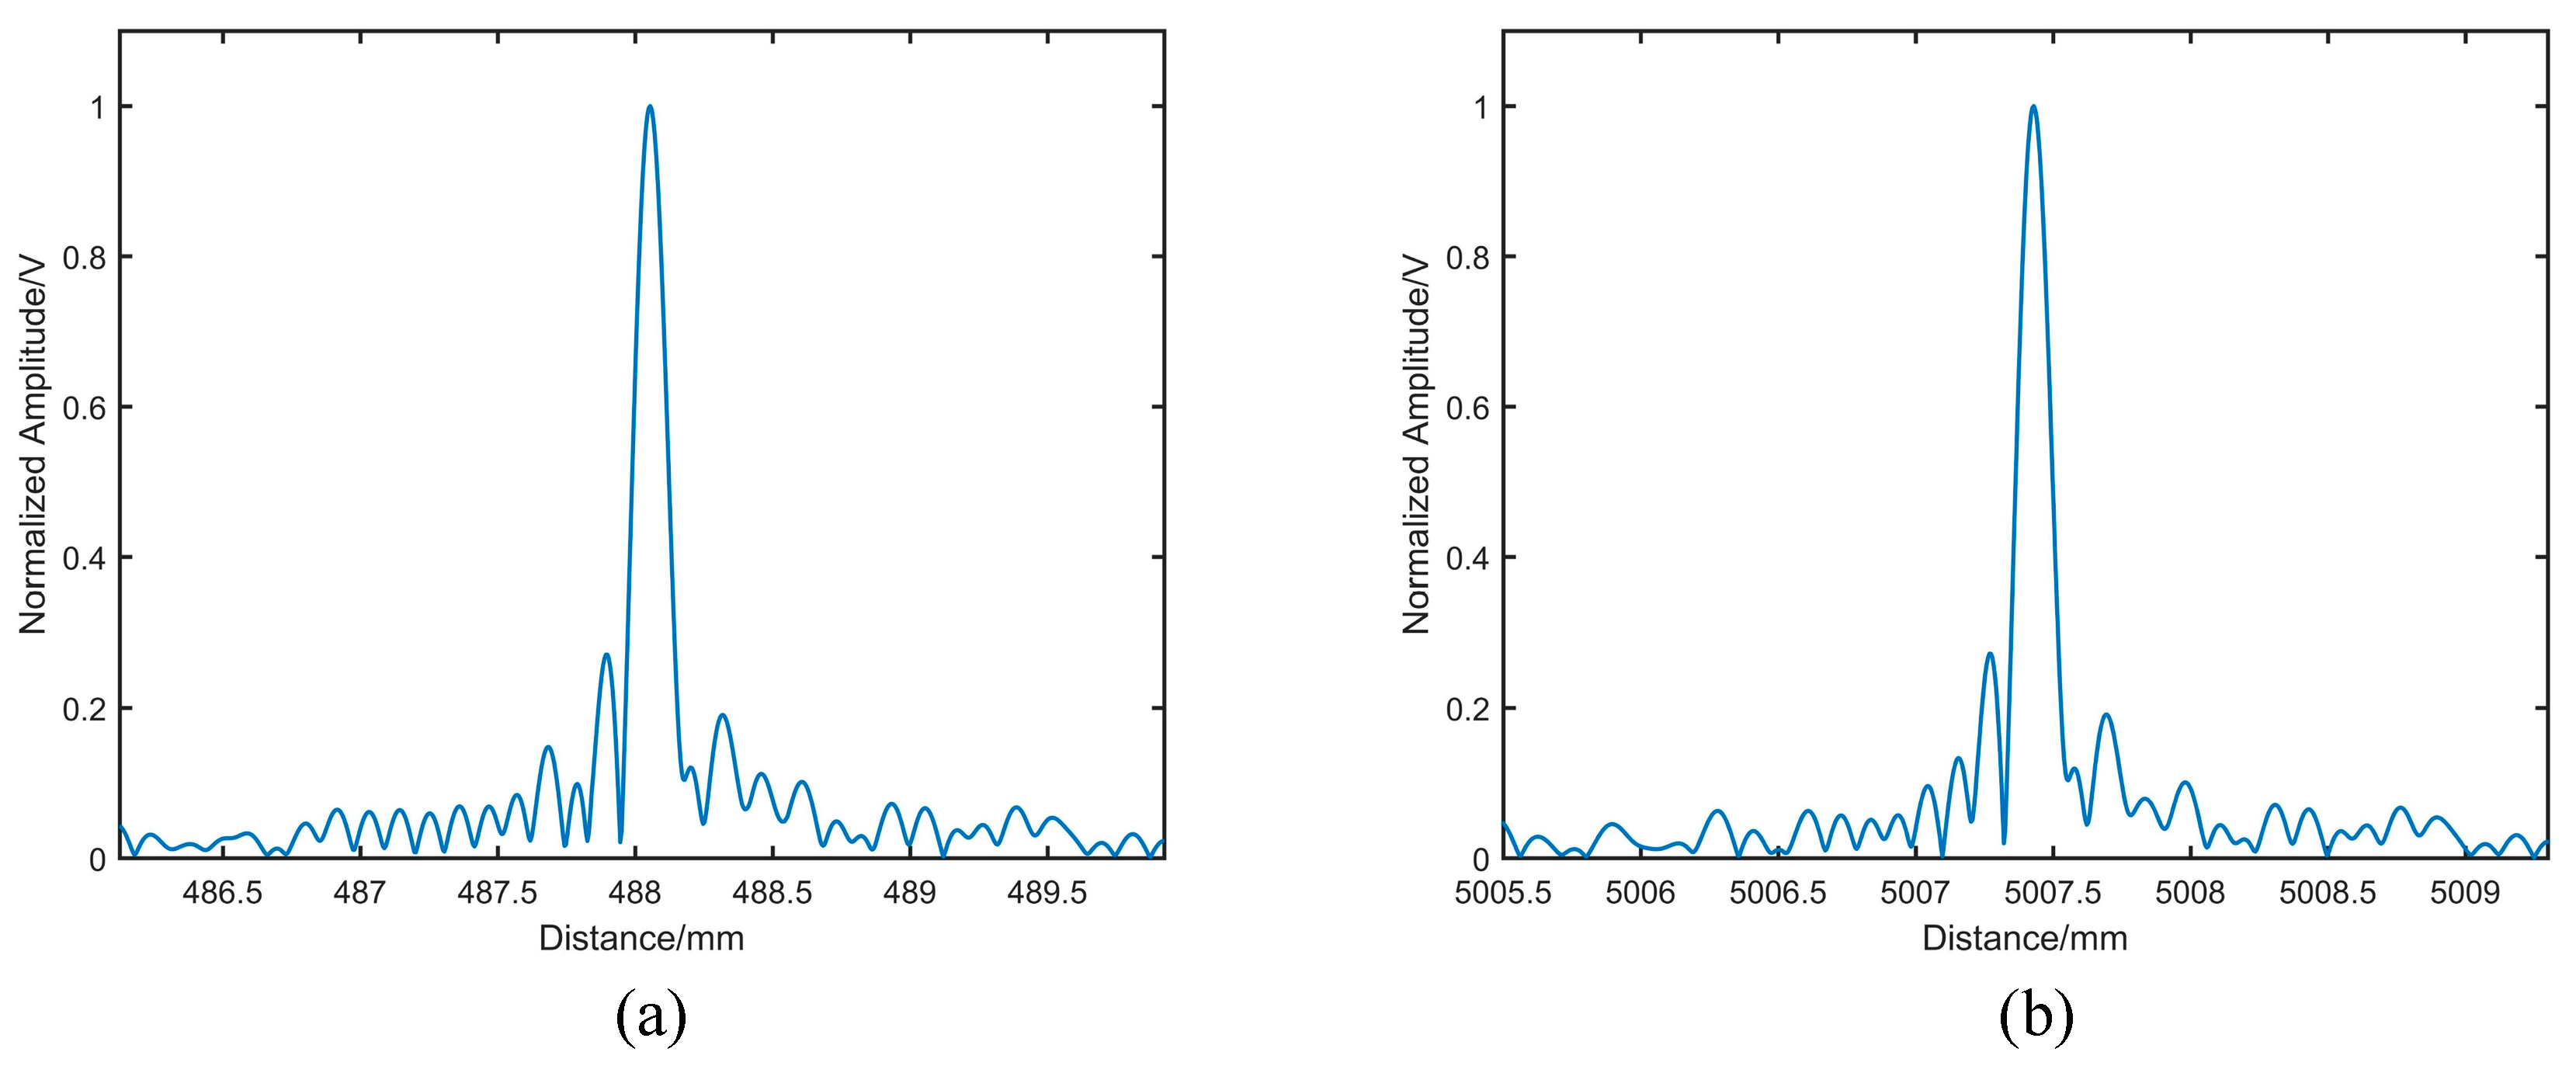
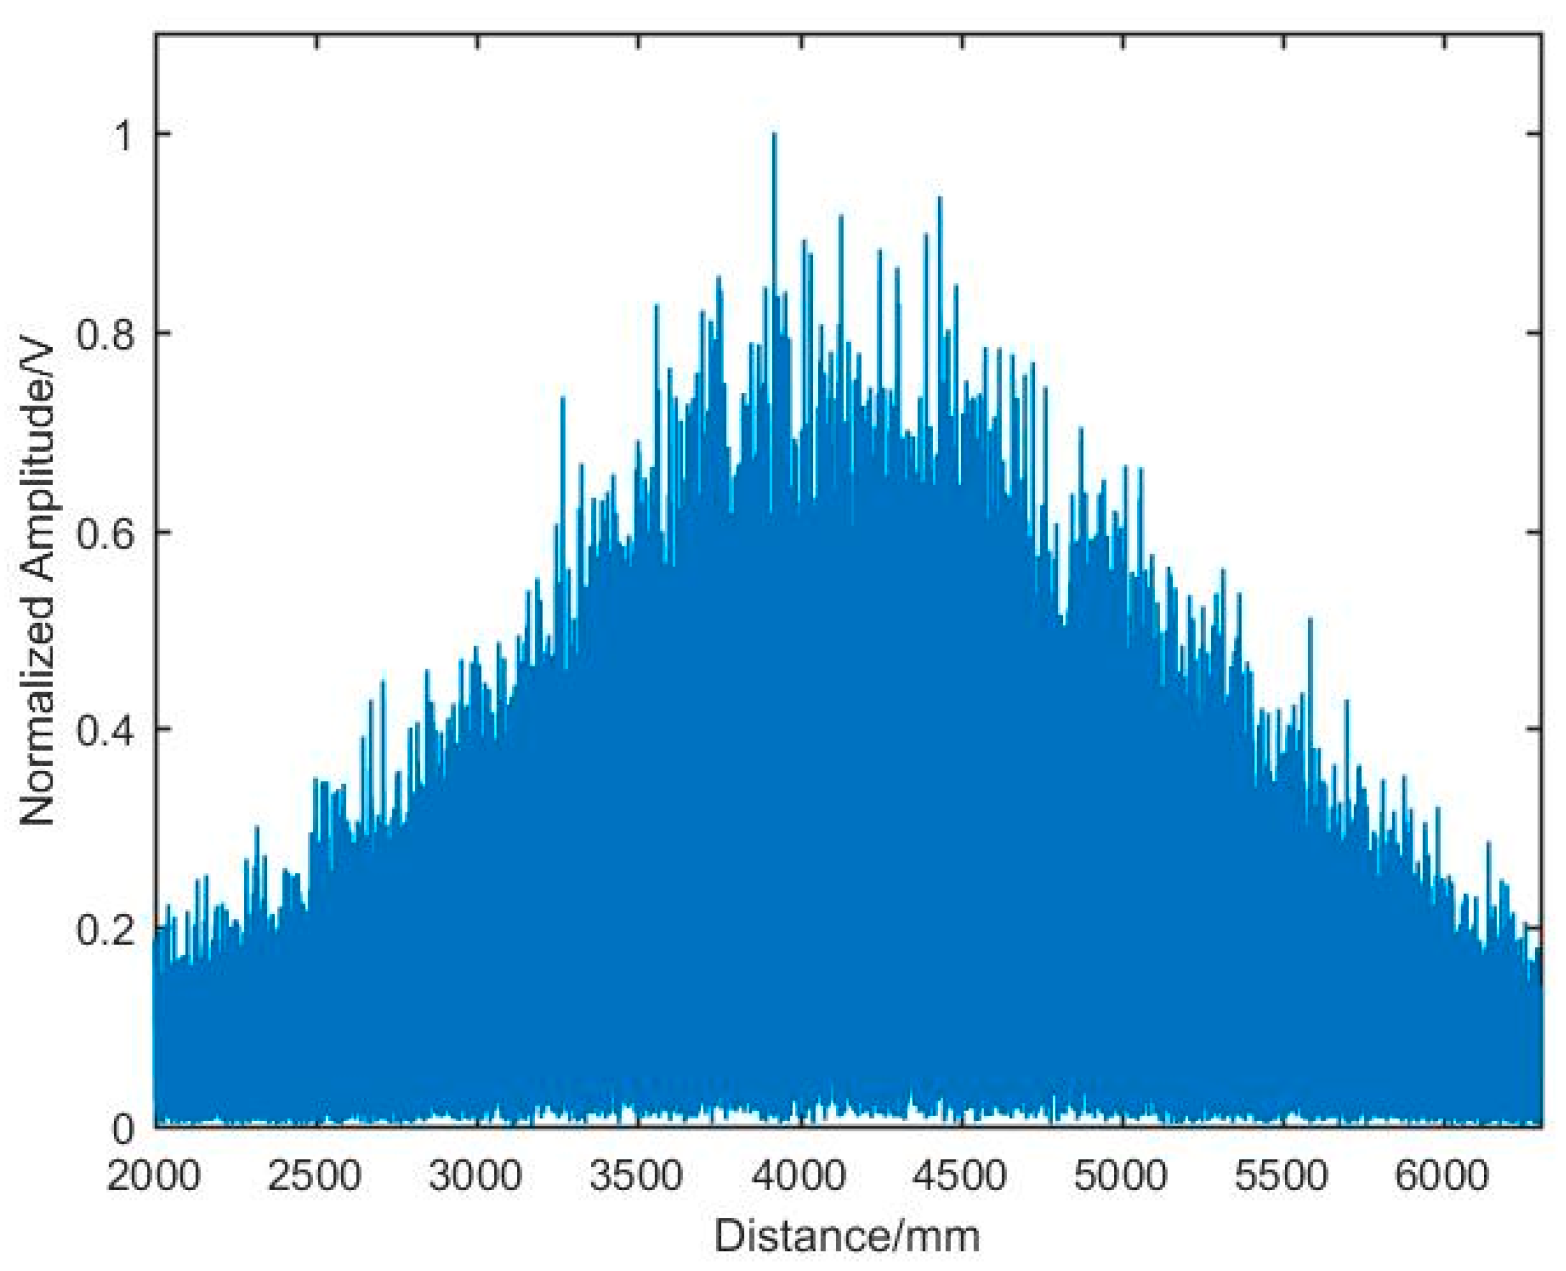
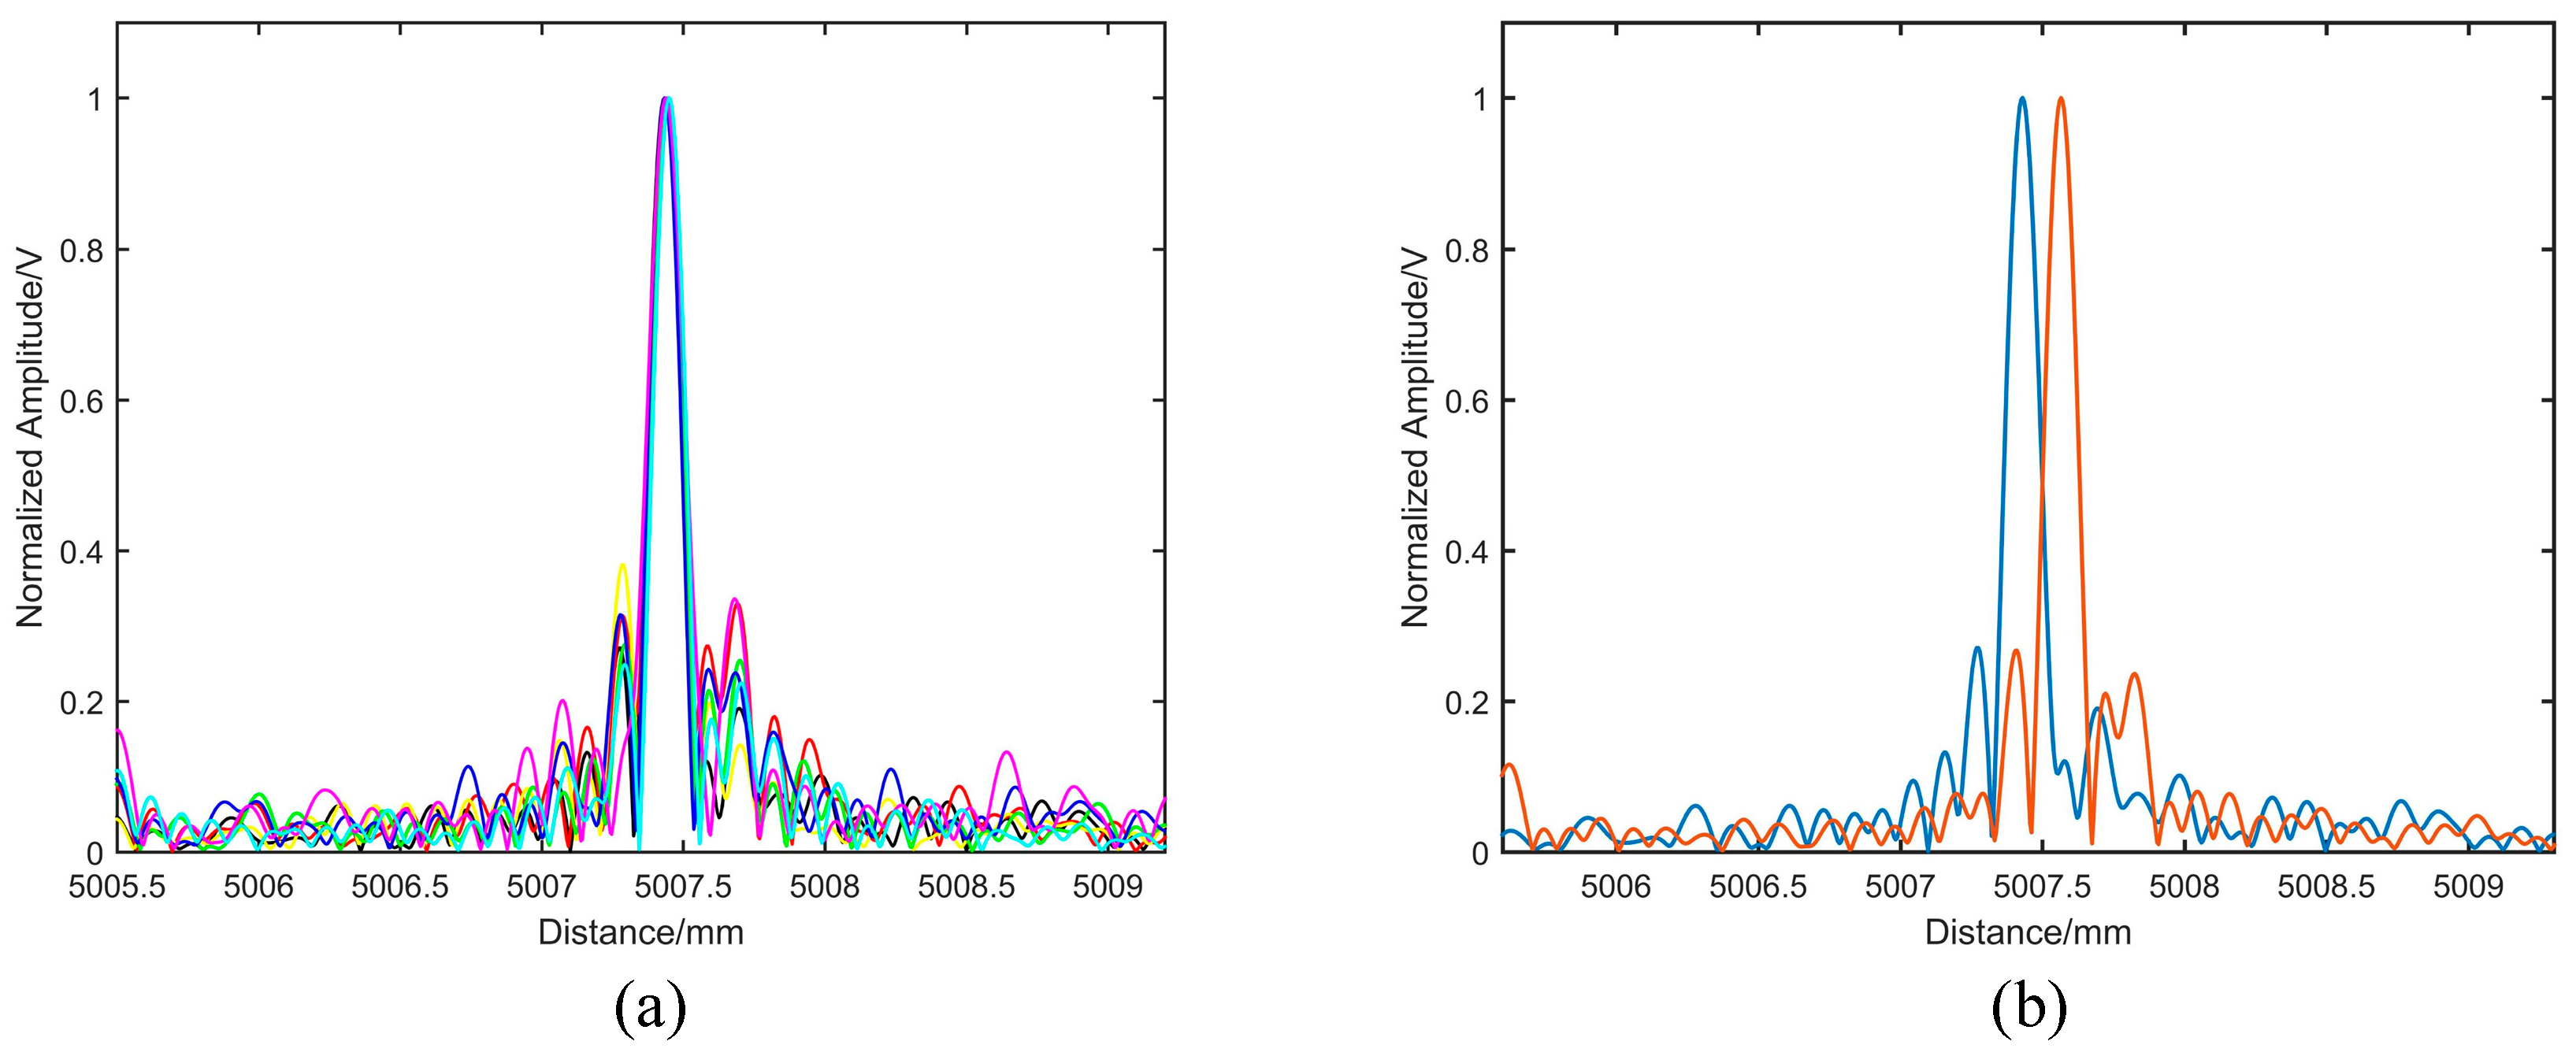
3.2. Results
4. Discussion
5. Conclusions
Author Contributions
Funding
Conflicts of Interest
References
- Zheng, J. Analysis of optical frequency-modulated continuous-waveinterference. Appl. Opt. 2004, 43, 4189–4197. [Google Scholar] [CrossRef] [PubMed]
- Headrick, J.M.; Thomason, J.F. Applications of high-frequency radar. Radio Sci. 1998, 33, 1045–1054. [Google Scholar] [CrossRef]
- Yang, H.-J.; Deibel, J.; Nyberg, S.; Riles, K. High-precision absolute distance and vibration measurement with frequency scannedinterferometry. Appl. Opt. 2005, 44, 3937–3944. [Google Scholar] [CrossRef] [PubMed]
- Cabral, A.; Rebordão, J. Accuracy of frequency-sweeping interferometry for absolute distance metrology. Opt. Eng. 2007, 46, 073602. [Google Scholar] [CrossRef]
- Shi, G.; Zhang, F.; Qu, X.; Meng, X. High-resolution frequency-modulated continuous-wave laser ranging for precision distance metrology applications. Opt. Eng. 2014, 53, 122402. [Google Scholar] [CrossRef]
- Wu, X.; Wei, H.; Zhang, H.; Ren, L.; Li, Y.; Zhang, J. Absolute distance measurement using frequency-sweeping heterodyne interferometer calibrated by an optical frequency comb. Appl. Opt. 2013, 10, 2042–2048. [Google Scholar] [CrossRef] [PubMed]
- Satyan, N.; Vasilyev, A.; Rakuljic, G.; Leyva, V.; Yariv, A. Precise control of broadband frequency chirps using optoelectronic feedback. Opt. Express 2009, 17, 15991–15999. [Google Scholar] [CrossRef] [PubMed]
- Roos, P.A.; Reibel, R.R.; Berg, T.; Kaylor, B.; Barber, Z.W.; Babbitt, W.R. Ultrabroadband optical chirp linearization for precision metrology applications. Opt. Lett. 2009, 34, 3692–3694. [Google Scholar] [CrossRef] [PubMed]
- Iiyama, K.; Matsui, S.; Kobayashi, T.; Maruyama, T. High-Resolution FMCW Reflectometry Using a Single-Mode Vertical-Cavity Surface-Emitting Laser. IEEE Photonics Technol. Lett. 2011, 23, 703–705. [Google Scholar] [CrossRef]
- Shi, G.; Wang, W.; Zhang, F. Precision improvement of frequency-modulated continuous-wave laser ranging system with two auxiliary interferometers. Opt. Commun. 2018, 411, 152–157. [Google Scholar] [CrossRef]
- Deng, W.; Liu, Z.; Deng, Z.; Jia, X.; Wang, Z. Extraction of interference phase in frequency-scanning interferometry based on empirical mode decomposition and Hilbert transform. Appl. Opt. 2018, 57, 2299–2305. [Google Scholar] [CrossRef] [PubMed]
- Lu, C.; Xiang, Y.; Gan, Y.; Liu, B.; Chen, F.; Liu, X.; Liu, G. FSI-based non-cooperative target absolute distance measurement method using PLL correction for the influence of a nonlinear clock. Opt. Lett. 2018, 43, 2098. [Google Scholar] [CrossRef] [PubMed]


© 2019 by the authors. Licensee MDPI, Basel, Switzerland. This article is an open access article distributed under the terms and conditions of the Creative Commons Attribution (CC BY) license (http://creativecommons.org/licenses/by/4.0/).
Share and Cite
Jiang, S.; Liu, B.; Wang, H.; Zhao, B. Absolute Distance Measurement Using Frequency-Scanning Interferometry Based on Hilbert Phase Subdivision. Sensors 2019, 19, 5132. https://doi.org/10.3390/s19235132
Jiang S, Liu B, Wang H, Zhao B. Absolute Distance Measurement Using Frequency-Scanning Interferometry Based on Hilbert Phase Subdivision. Sensors. 2019; 19(23):5132. https://doi.org/10.3390/s19235132
Chicago/Turabian StyleJiang, Shuo, Bo Liu, Huachuang Wang, and Bin Zhao. 2019. "Absolute Distance Measurement Using Frequency-Scanning Interferometry Based on Hilbert Phase Subdivision" Sensors 19, no. 23: 5132. https://doi.org/10.3390/s19235132
APA StyleJiang, S., Liu, B., Wang, H., & Zhao, B. (2019). Absolute Distance Measurement Using Frequency-Scanning Interferometry Based on Hilbert Phase Subdivision. Sensors, 19(23), 5132. https://doi.org/10.3390/s19235132