Effect of Adhesive Debonding on the Performance of Piezoelectric Sensors in Structural Health Monitoring Systems

Abstract
:1. Introduction
2. Theory of Piezoelectric Element Debonding Based on Lamb Wave Propagation
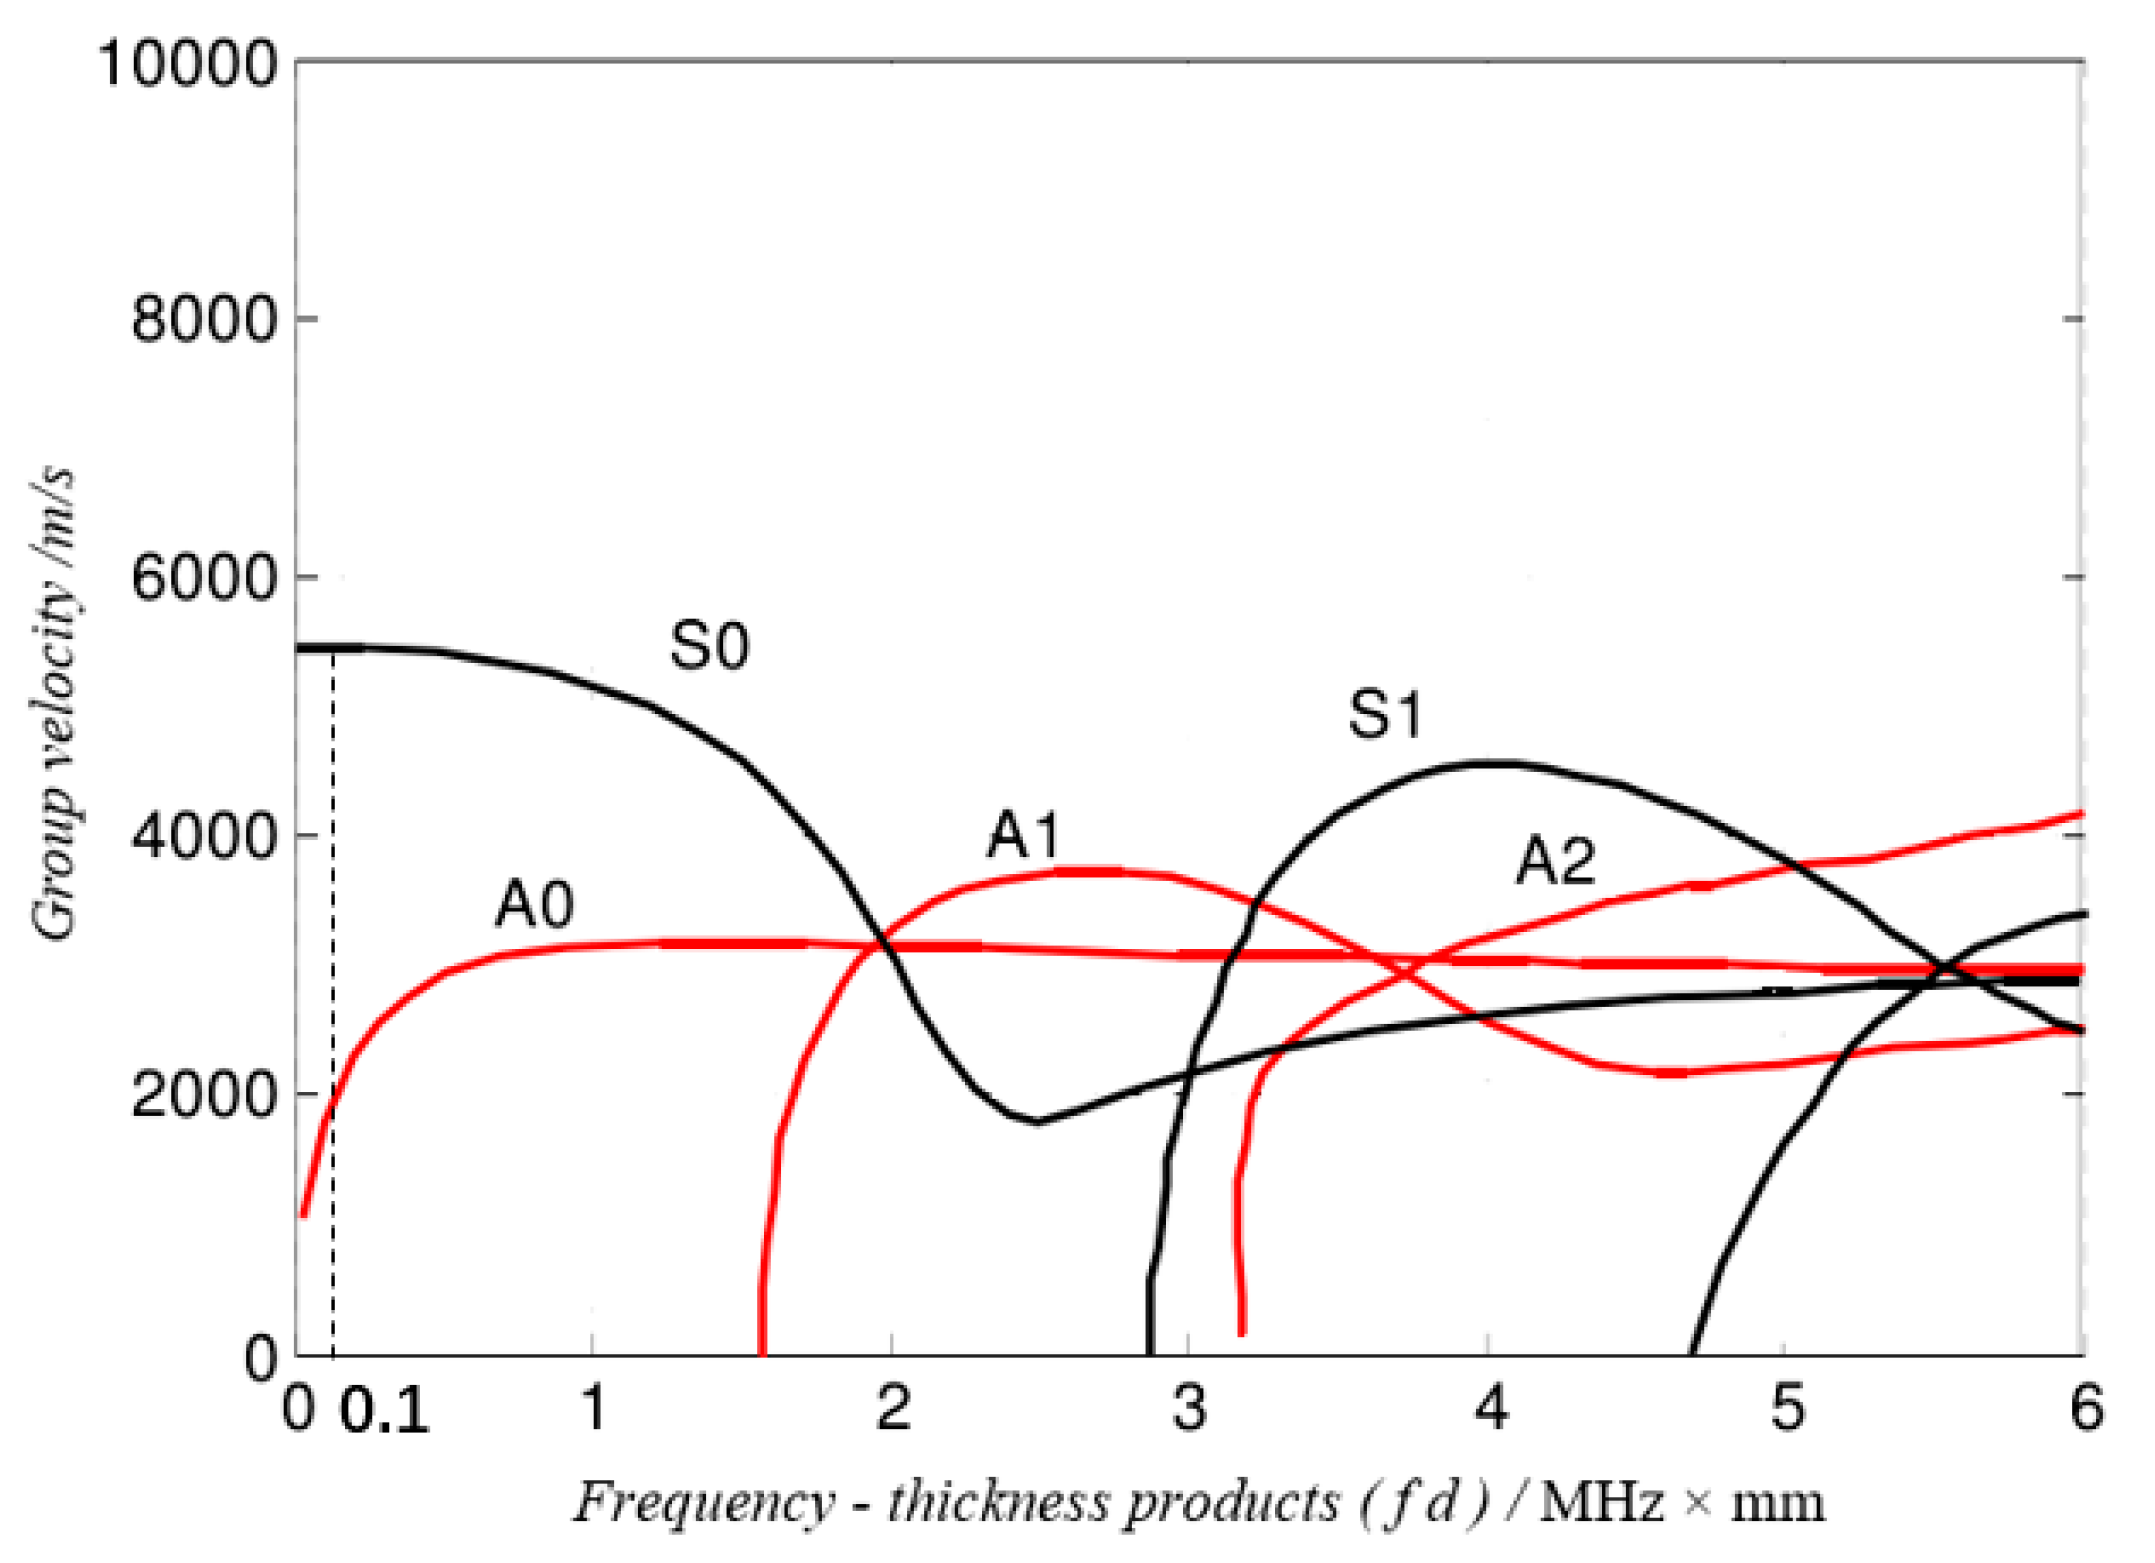
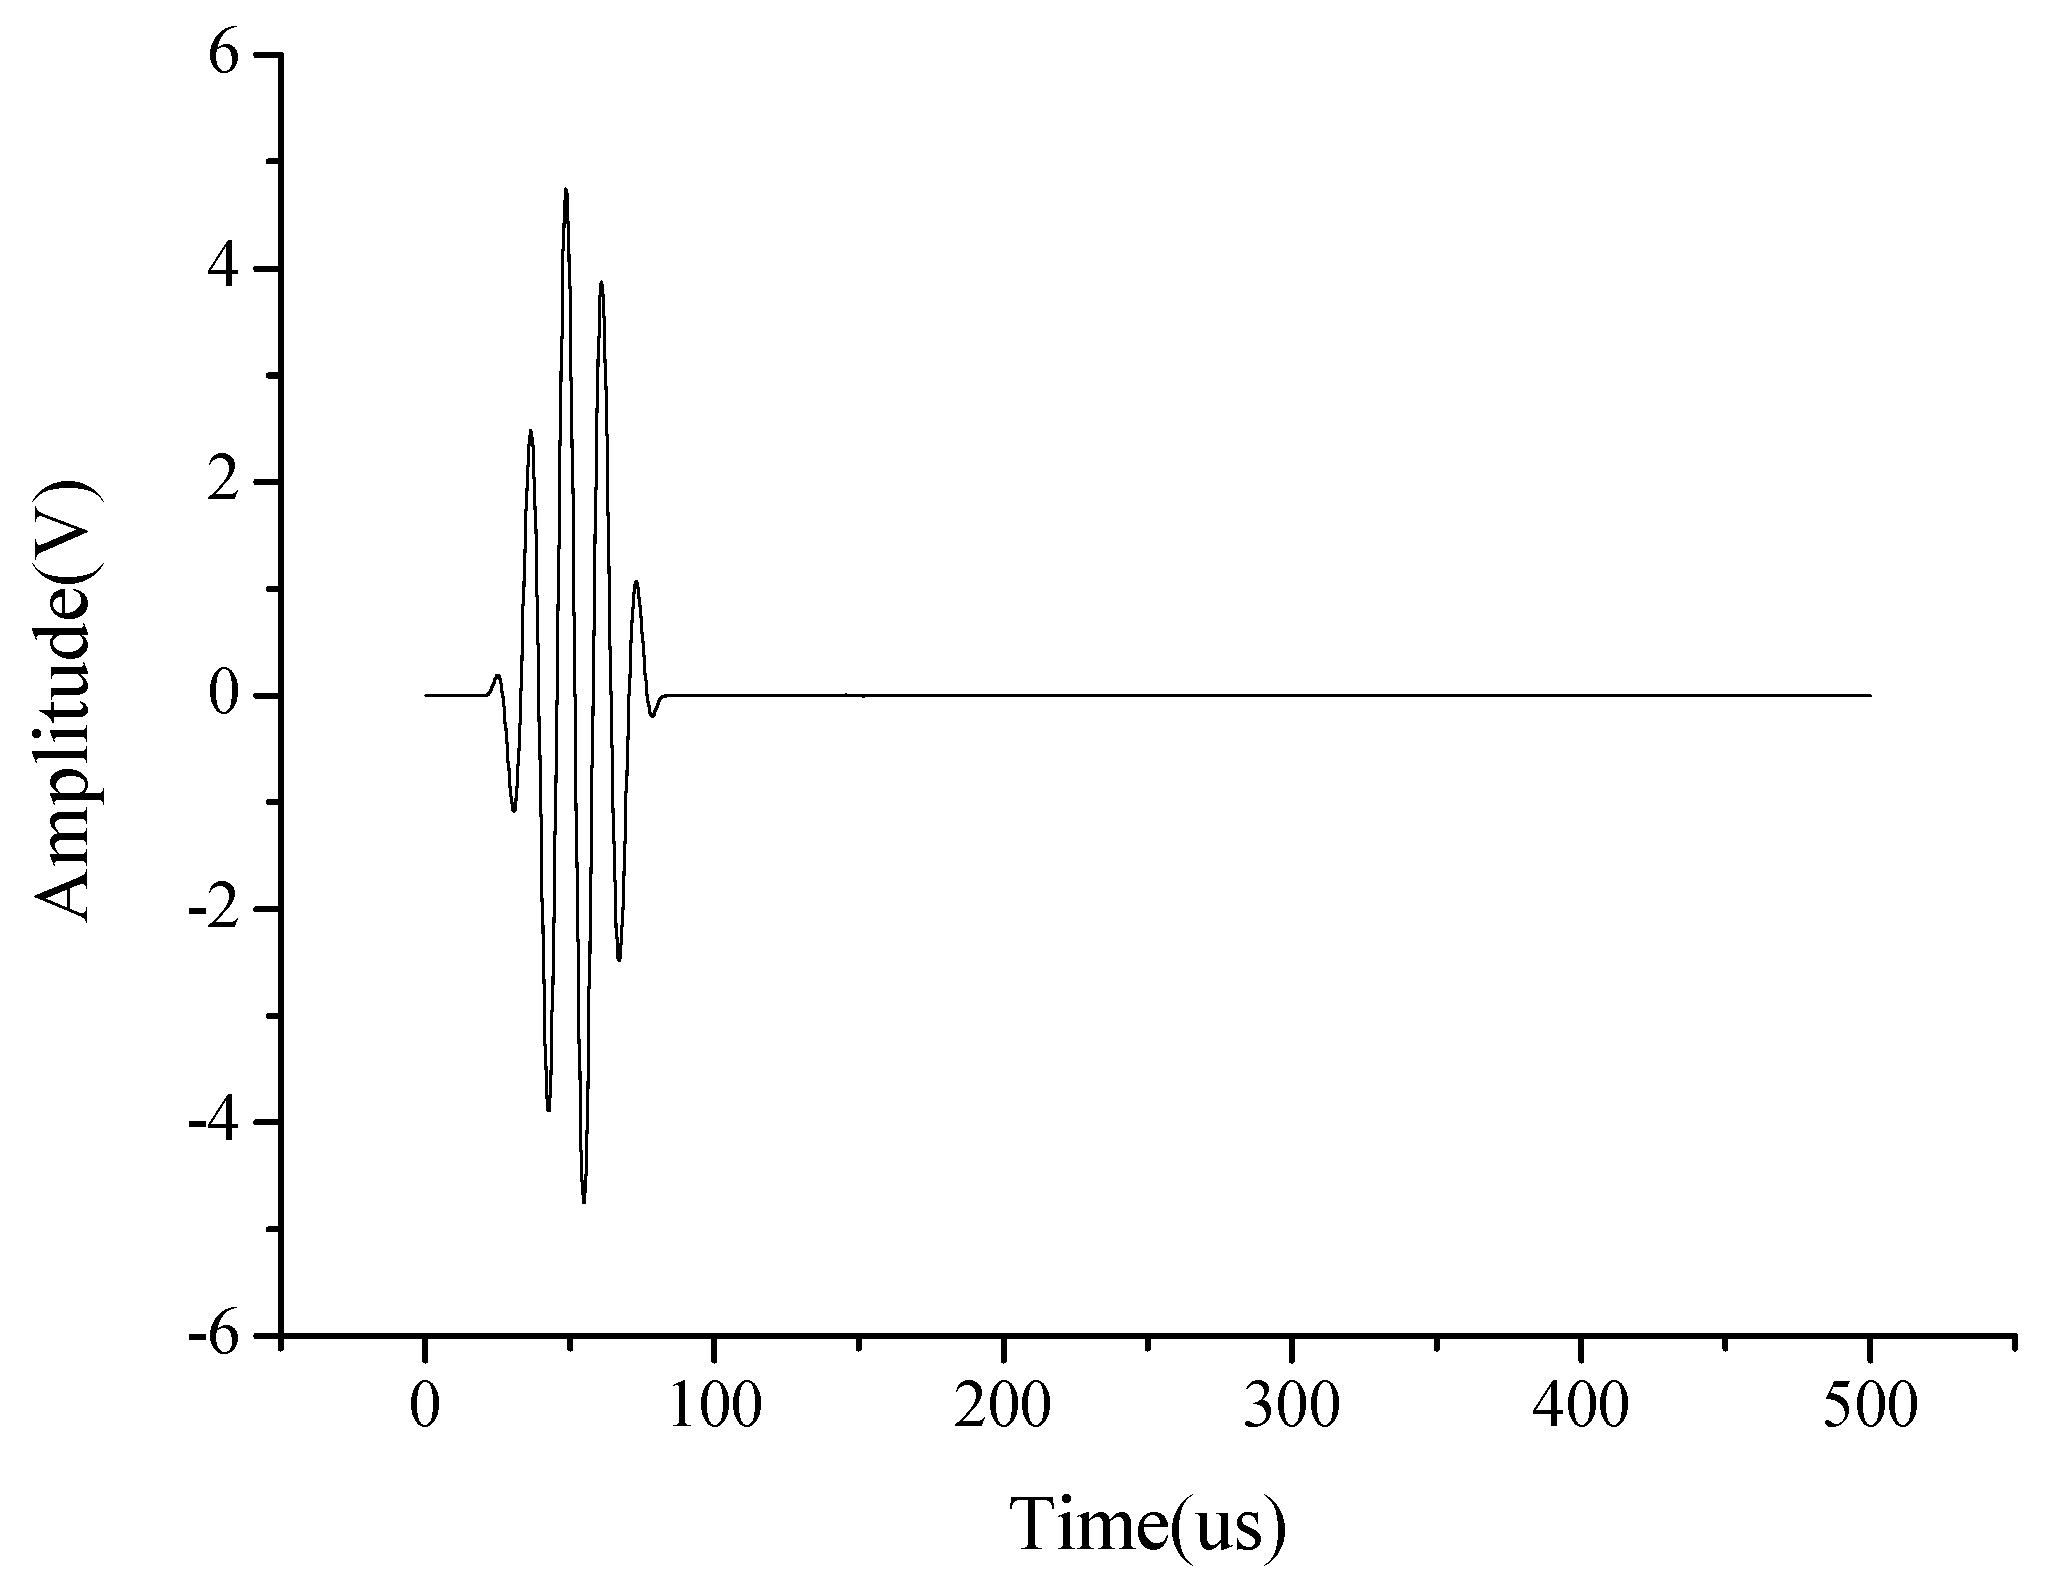
2.1. Lamb Wave Propagation in Aluminum Plate
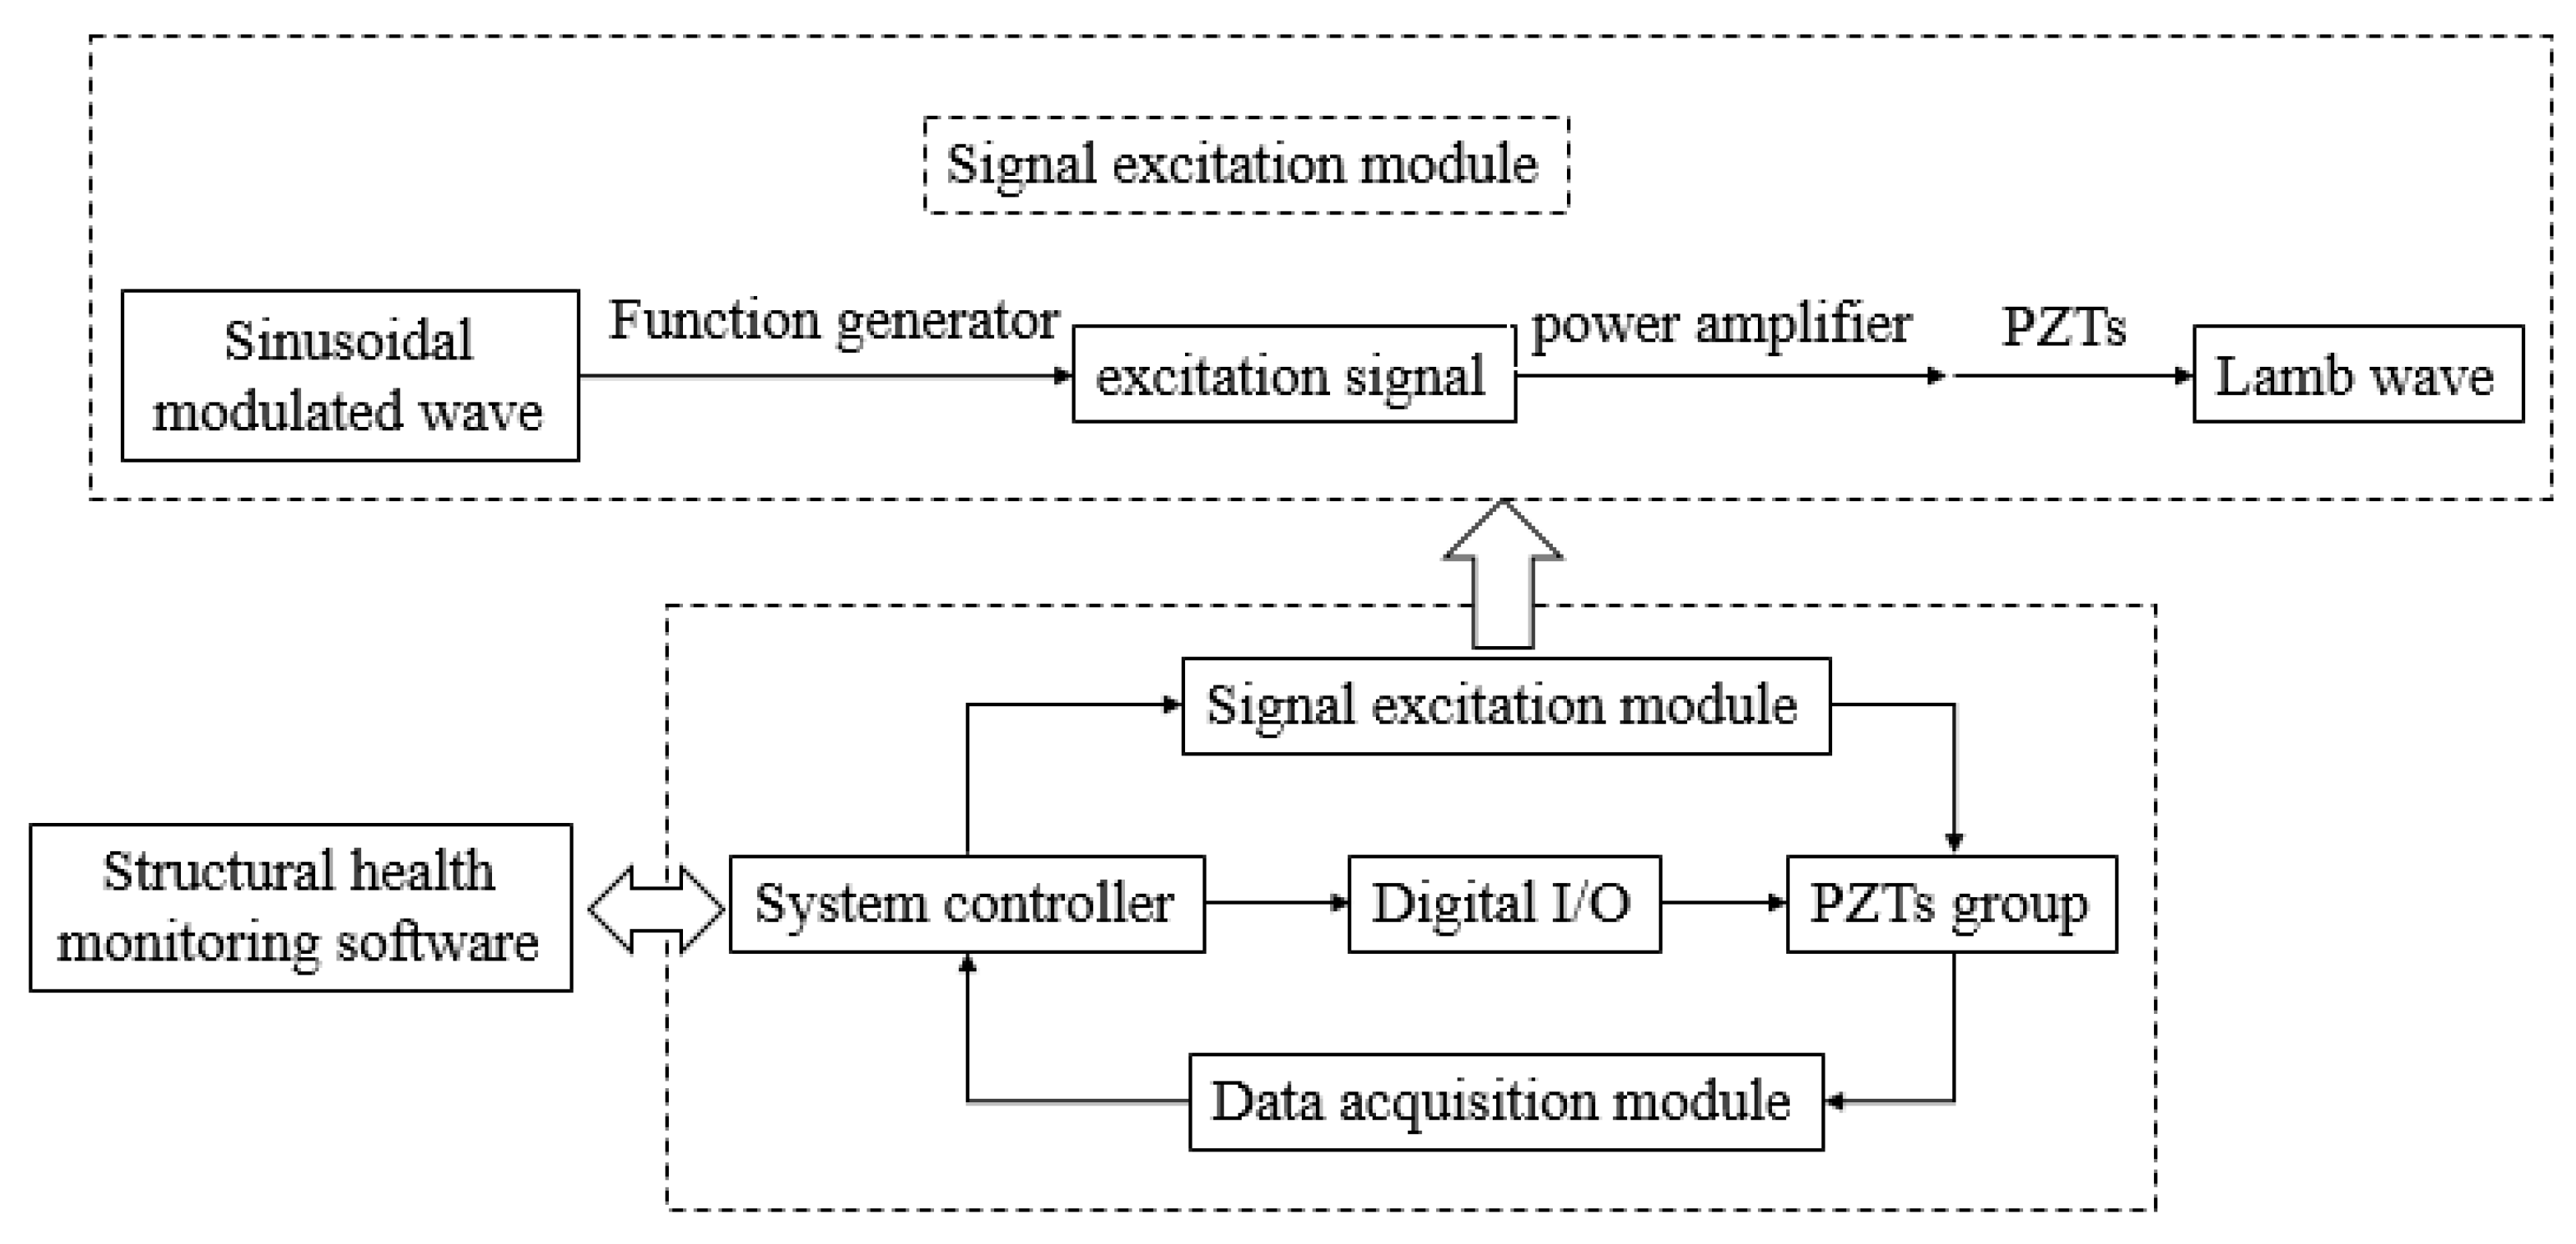
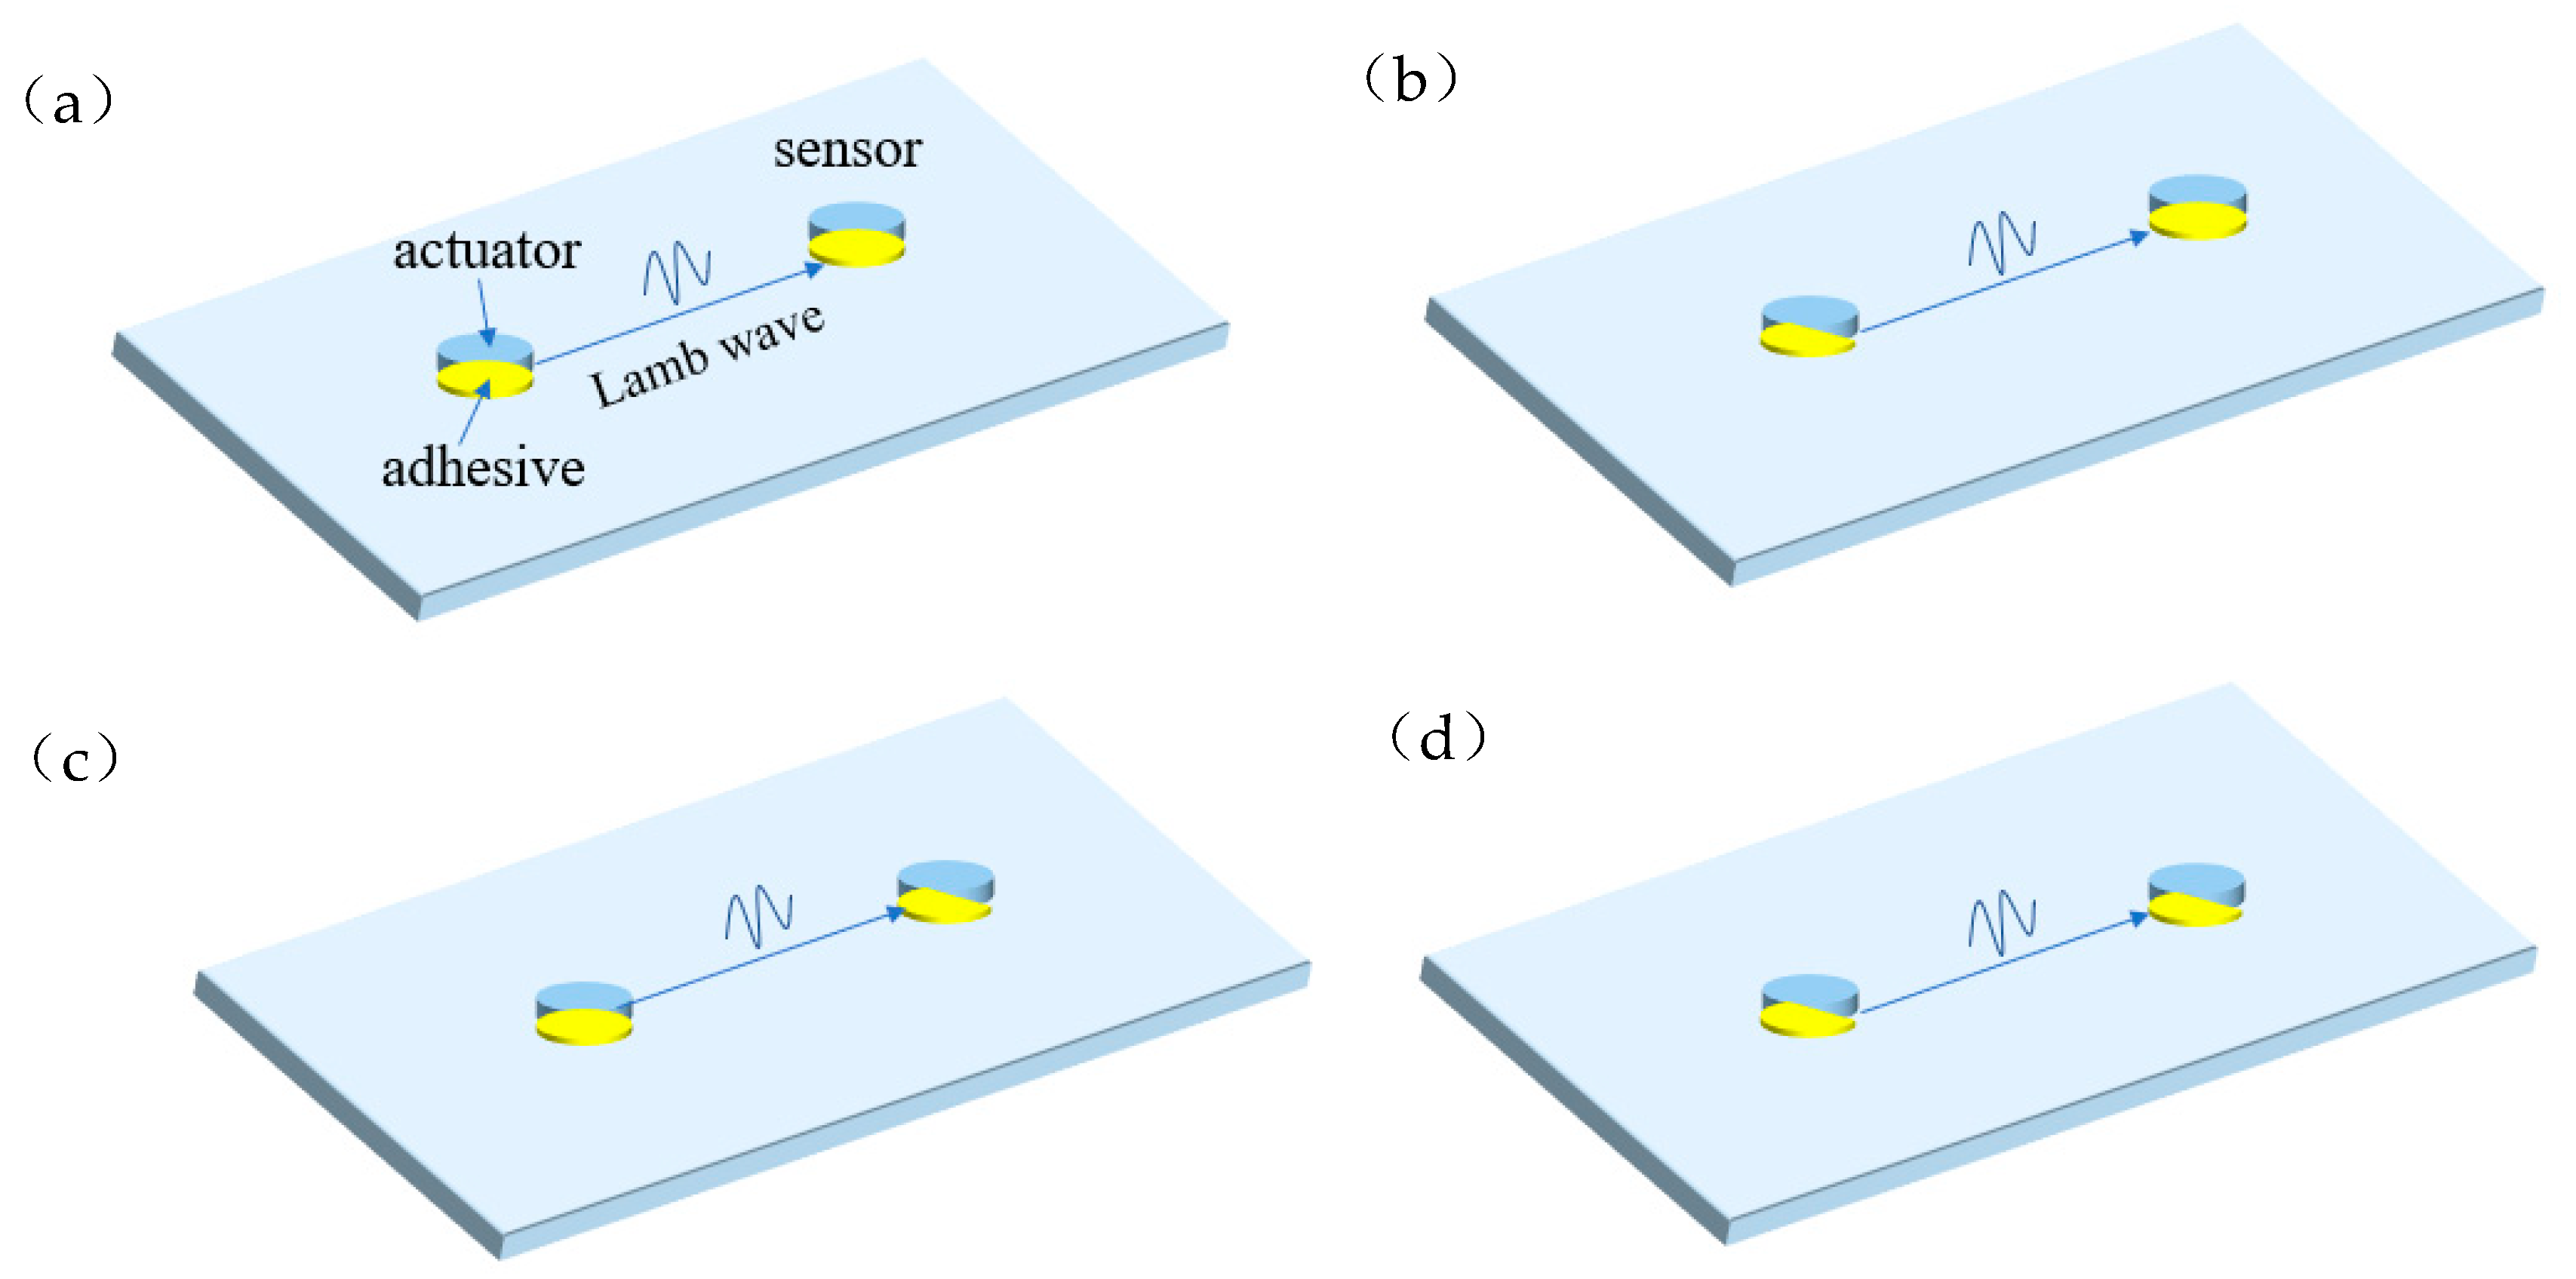
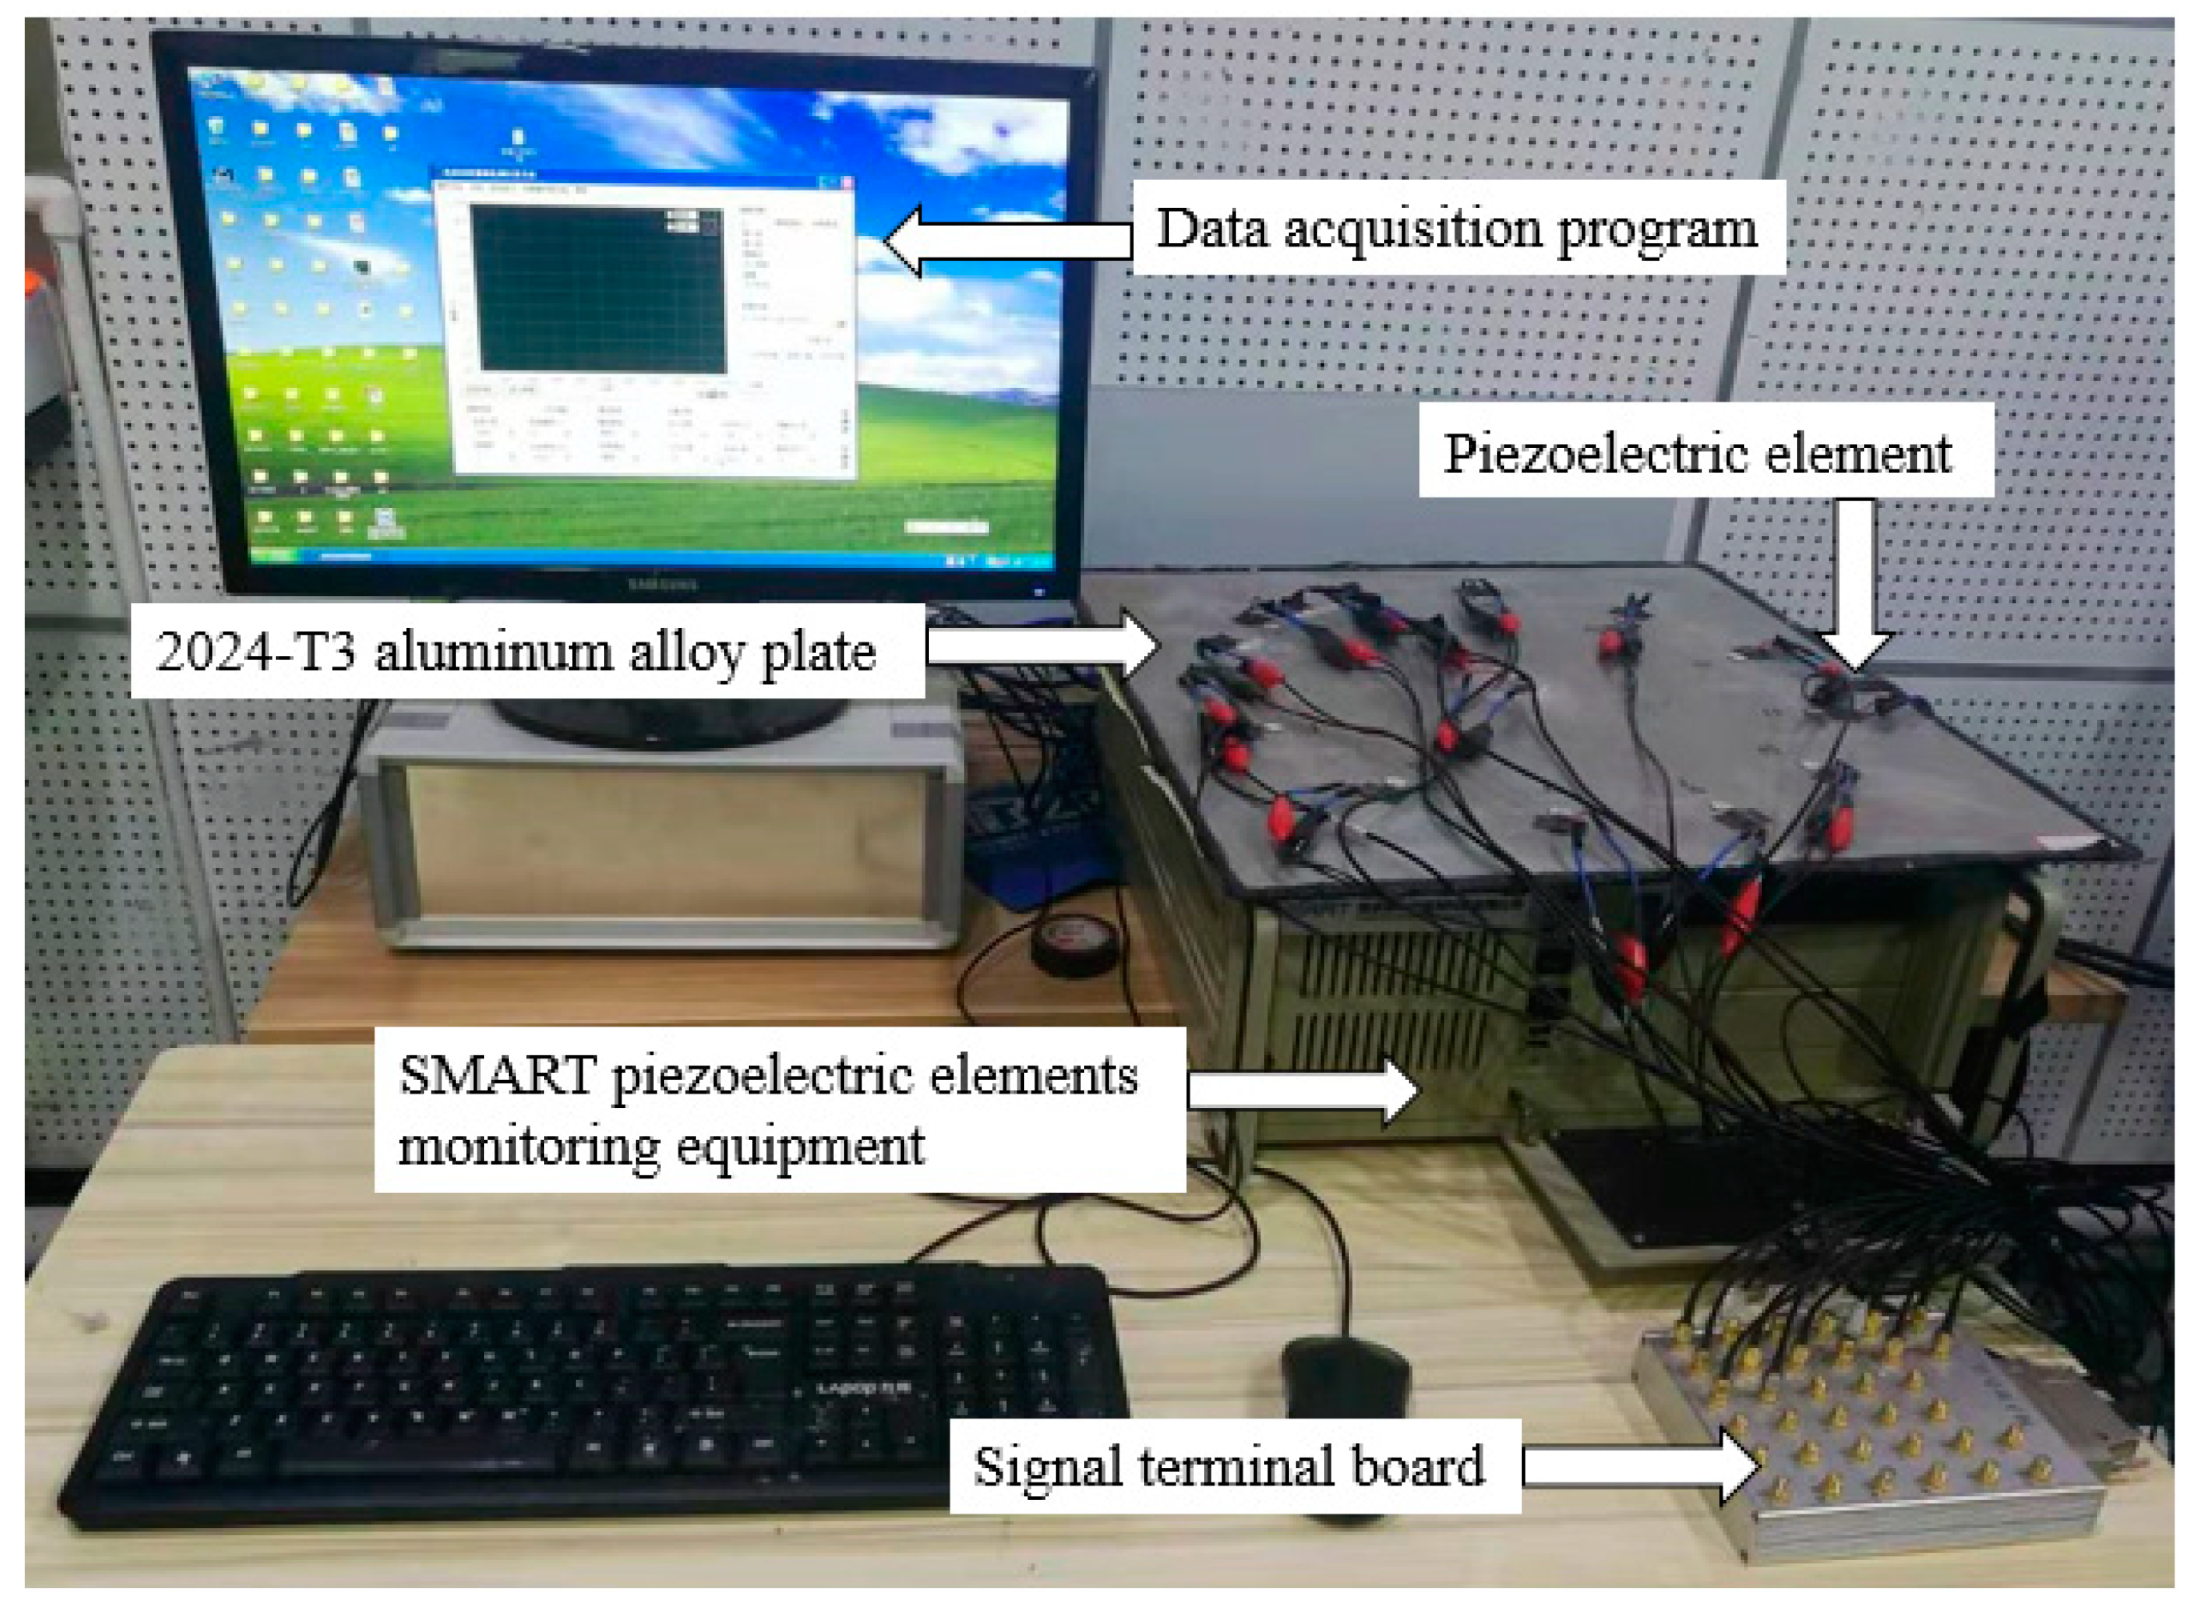
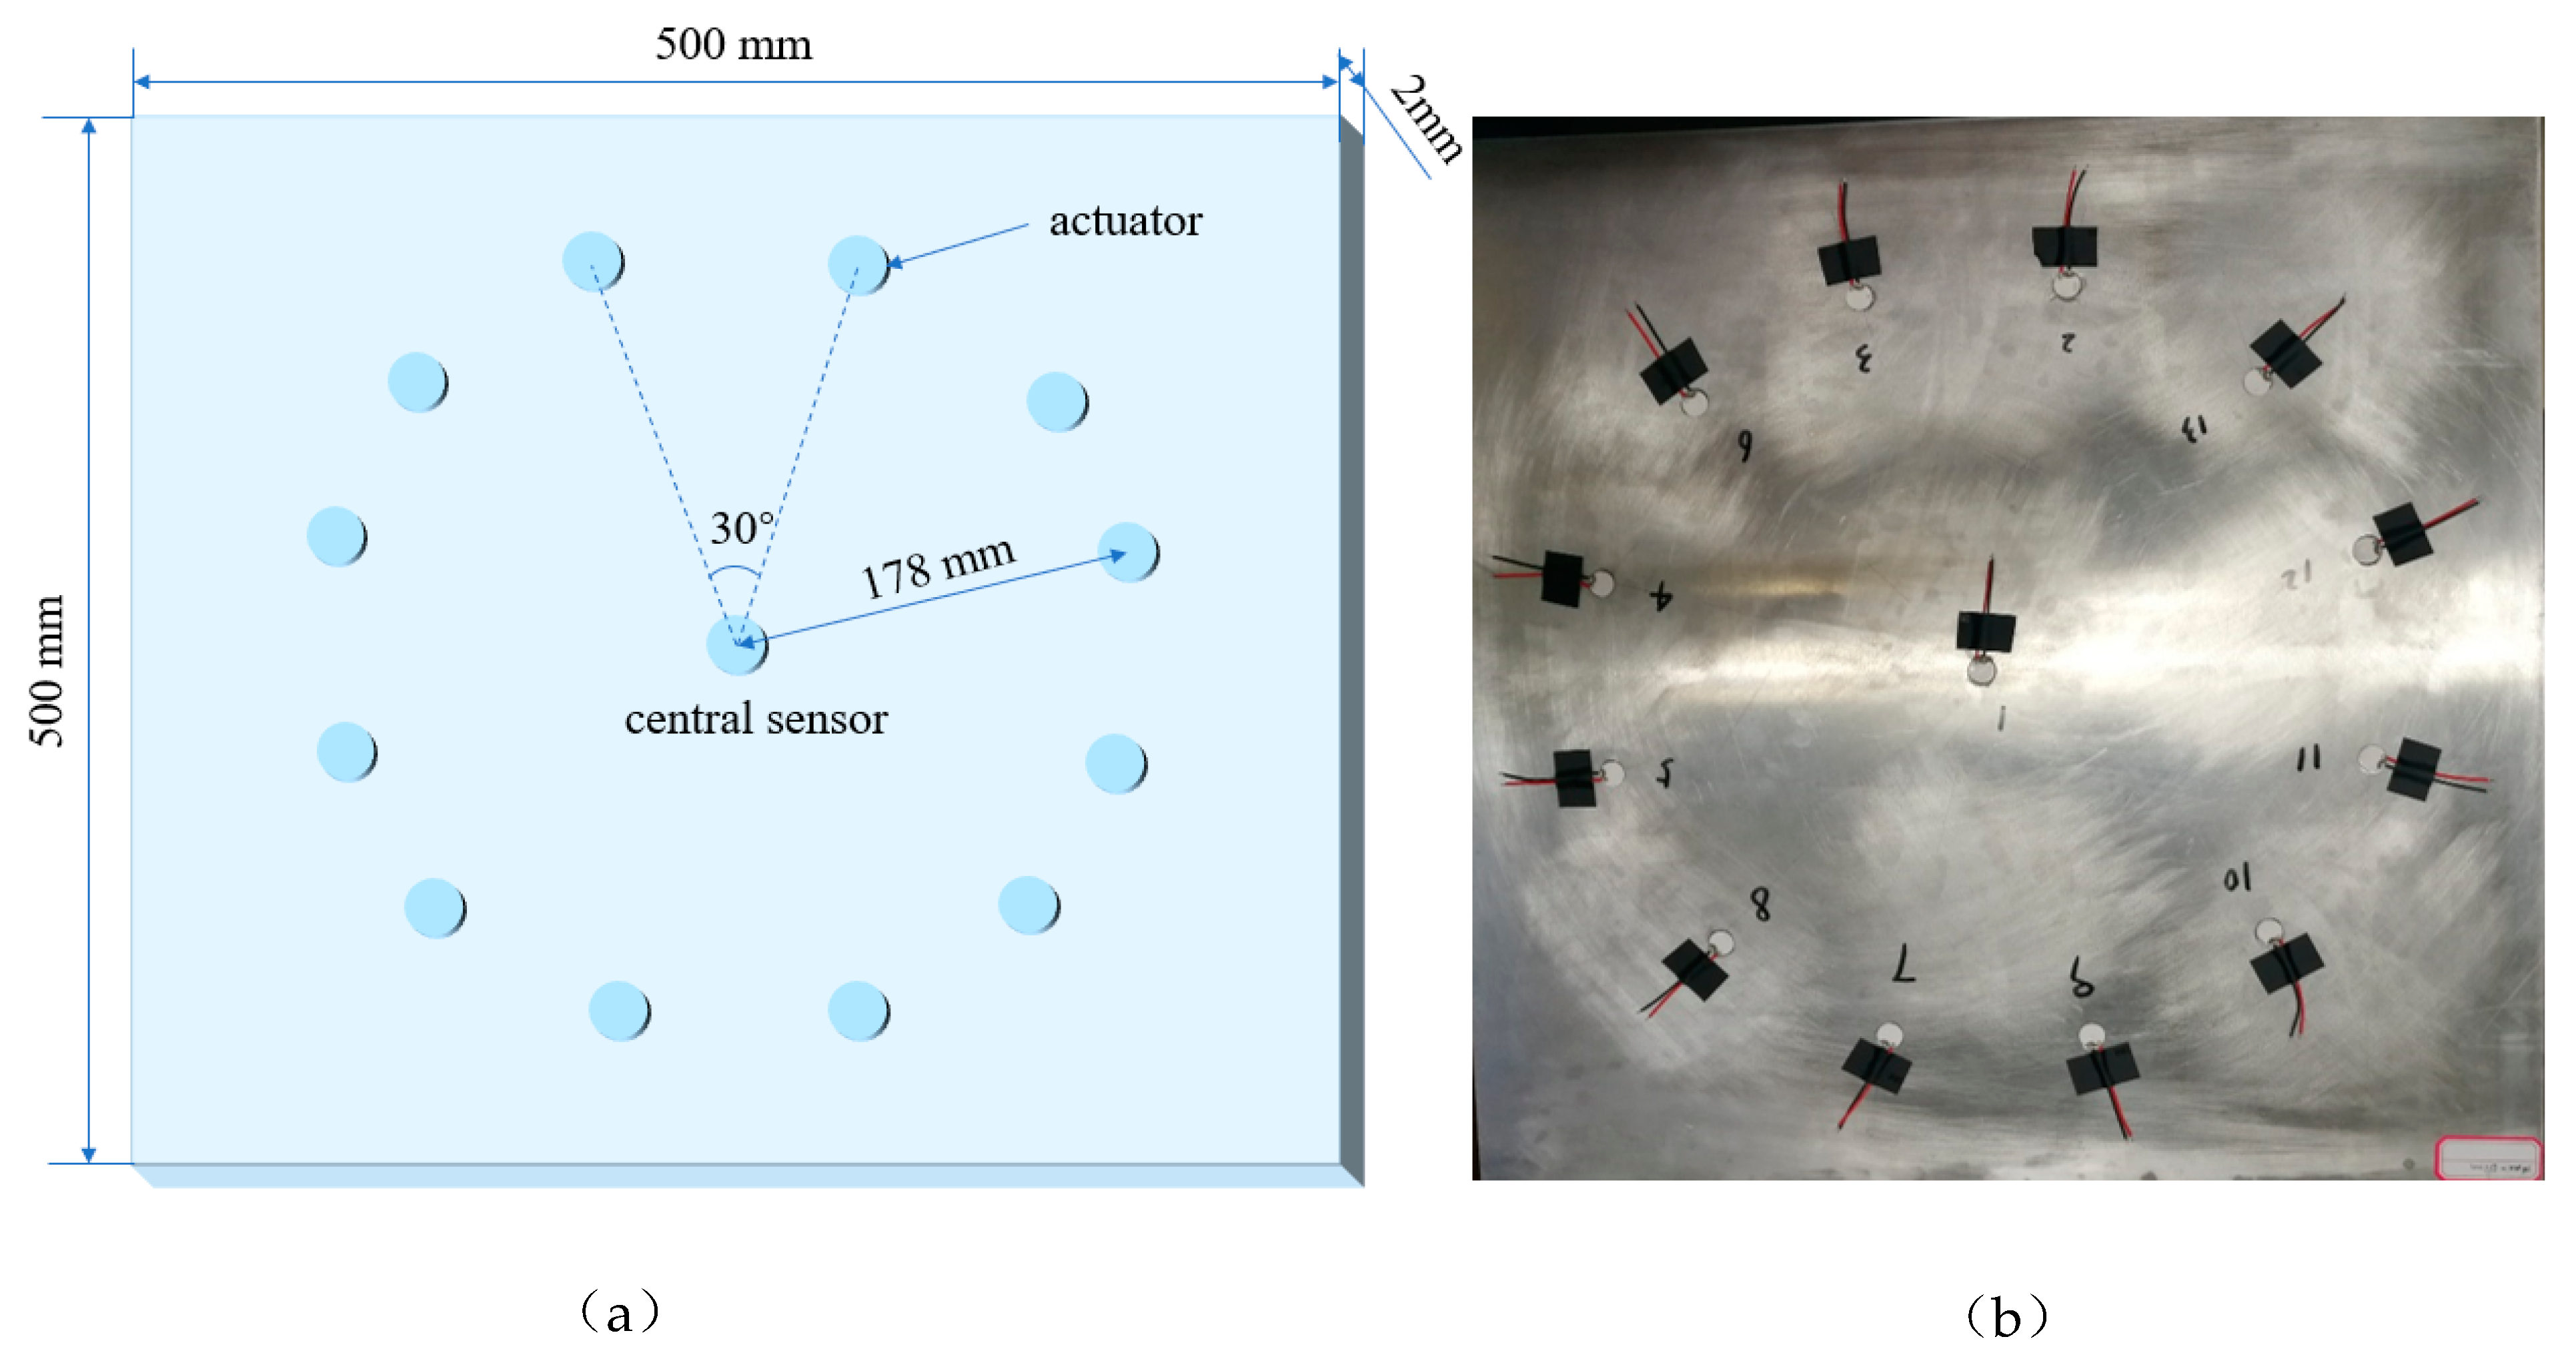
2.2. Monitoring System Setup for Debonding Tests
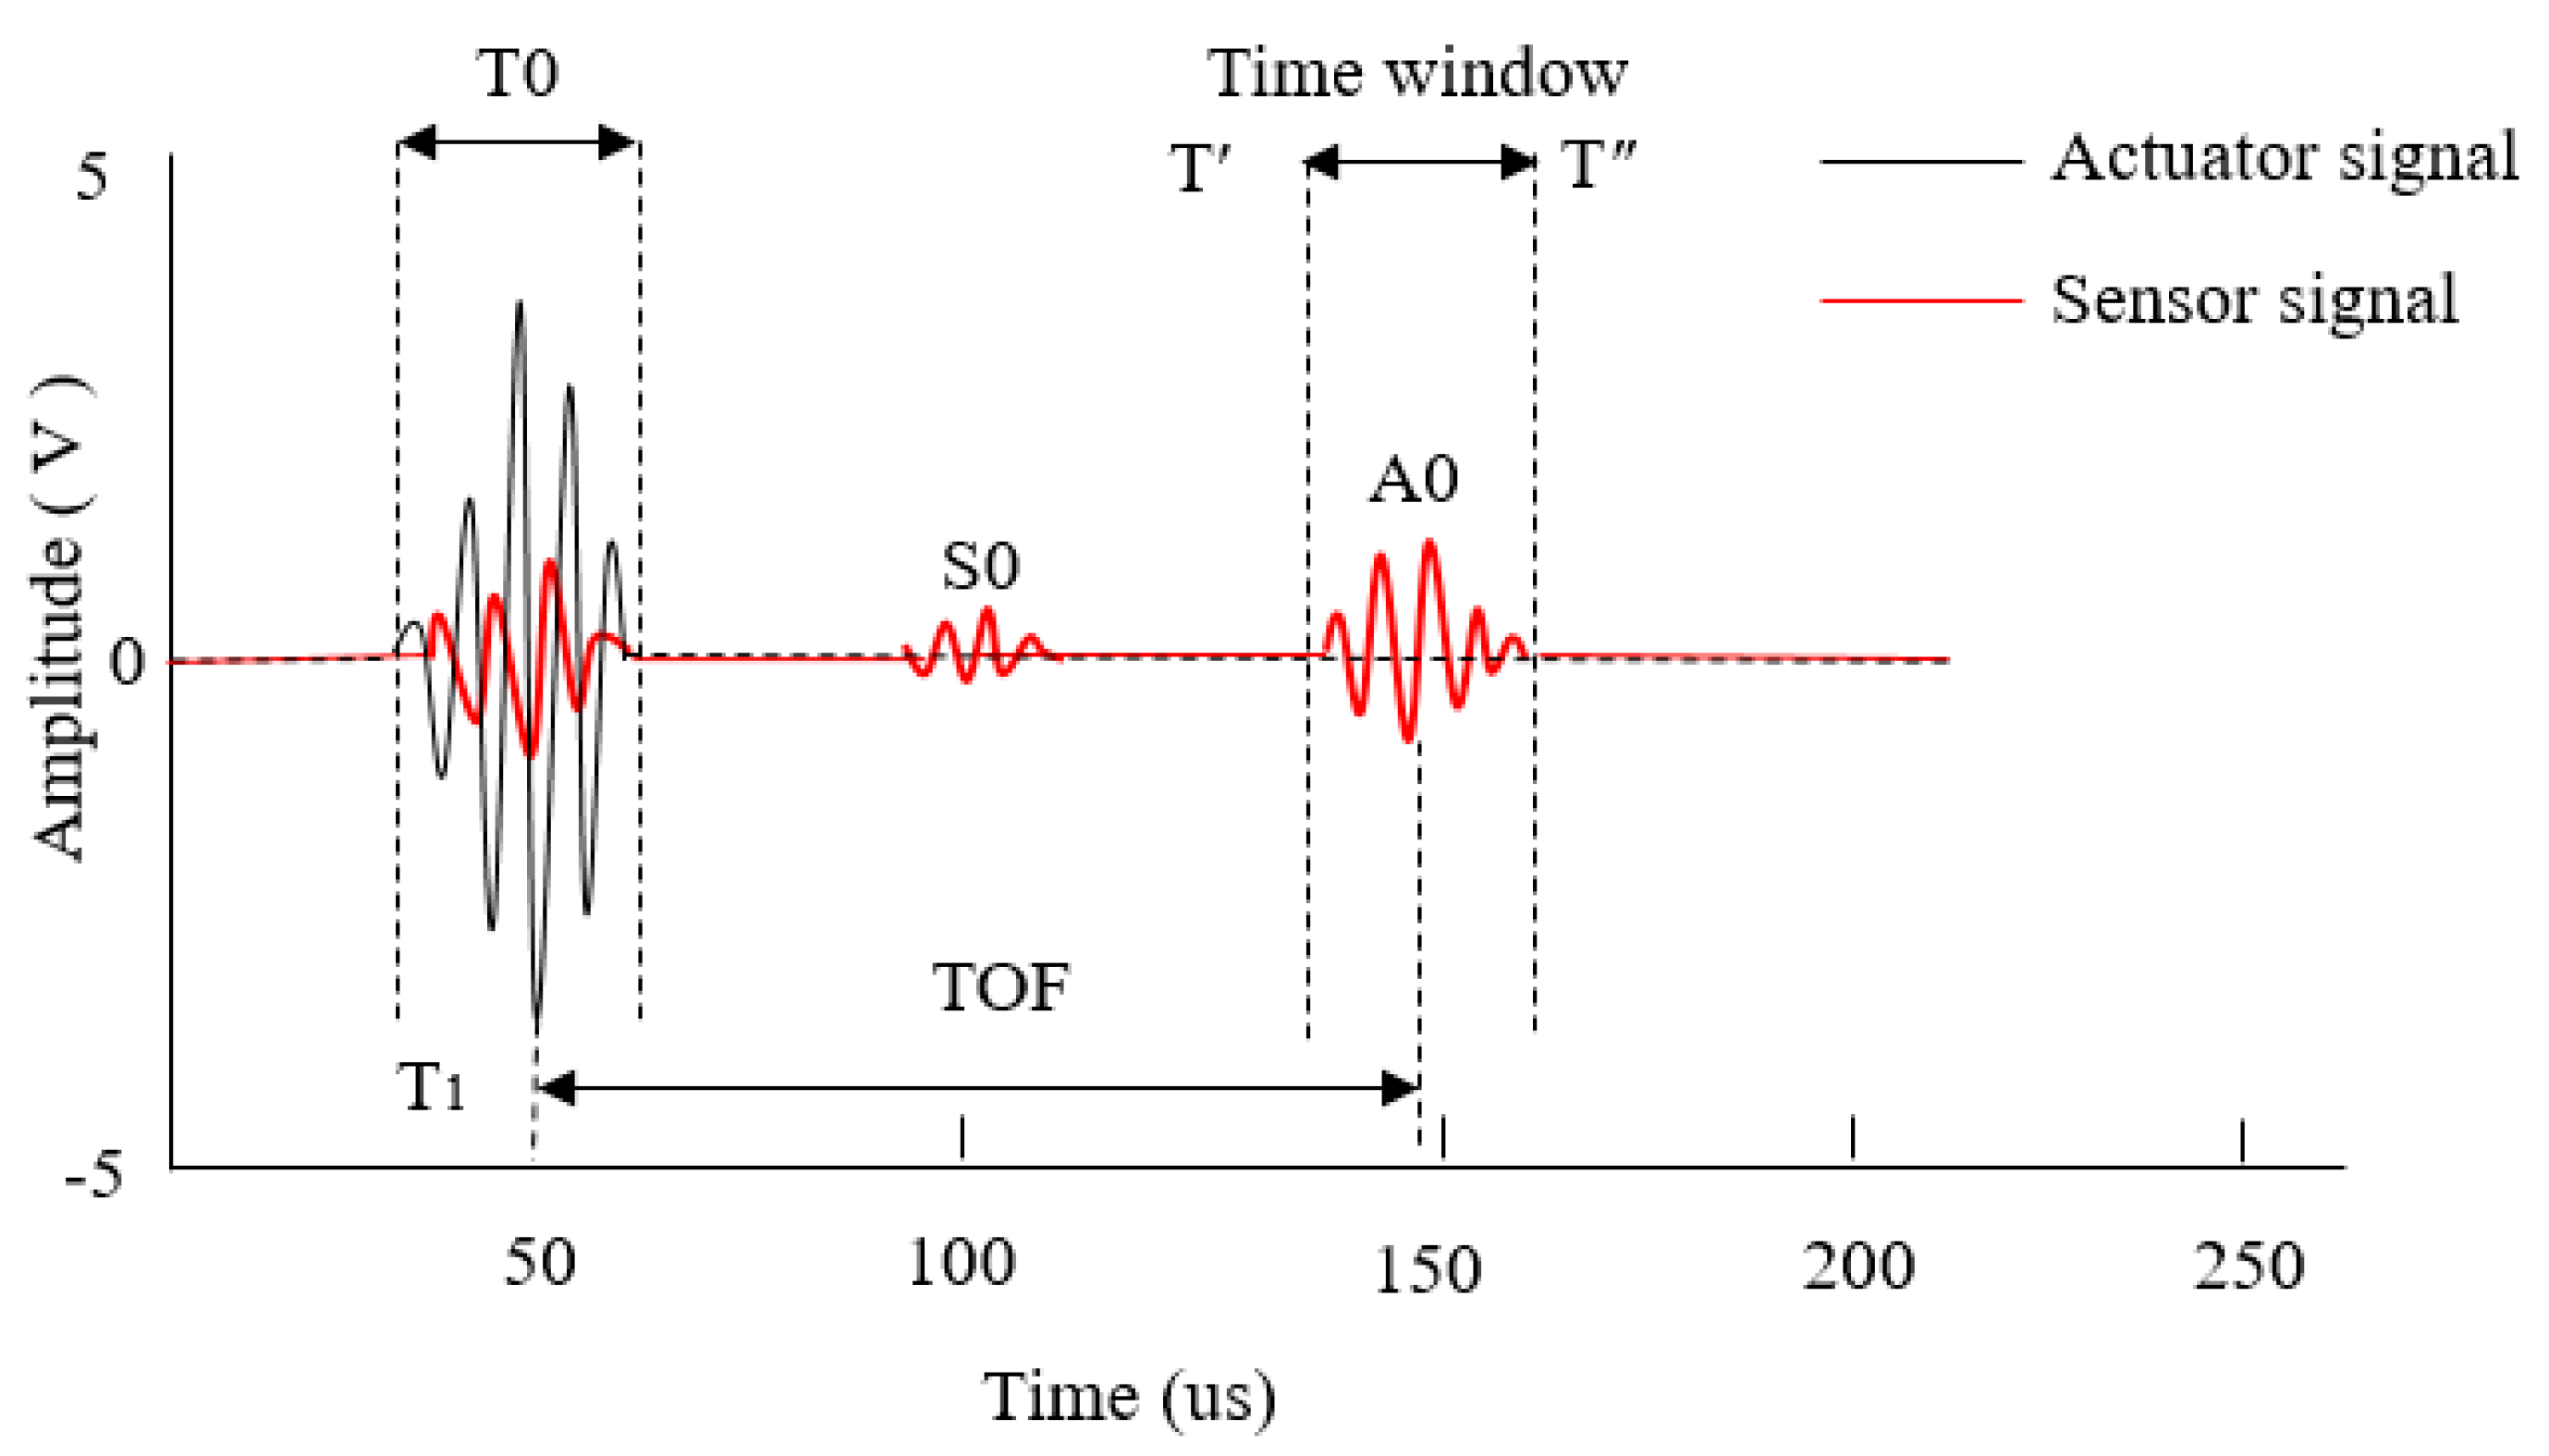
2.3. Extraction of Characteristic Parameters
3. Debonding Test Design
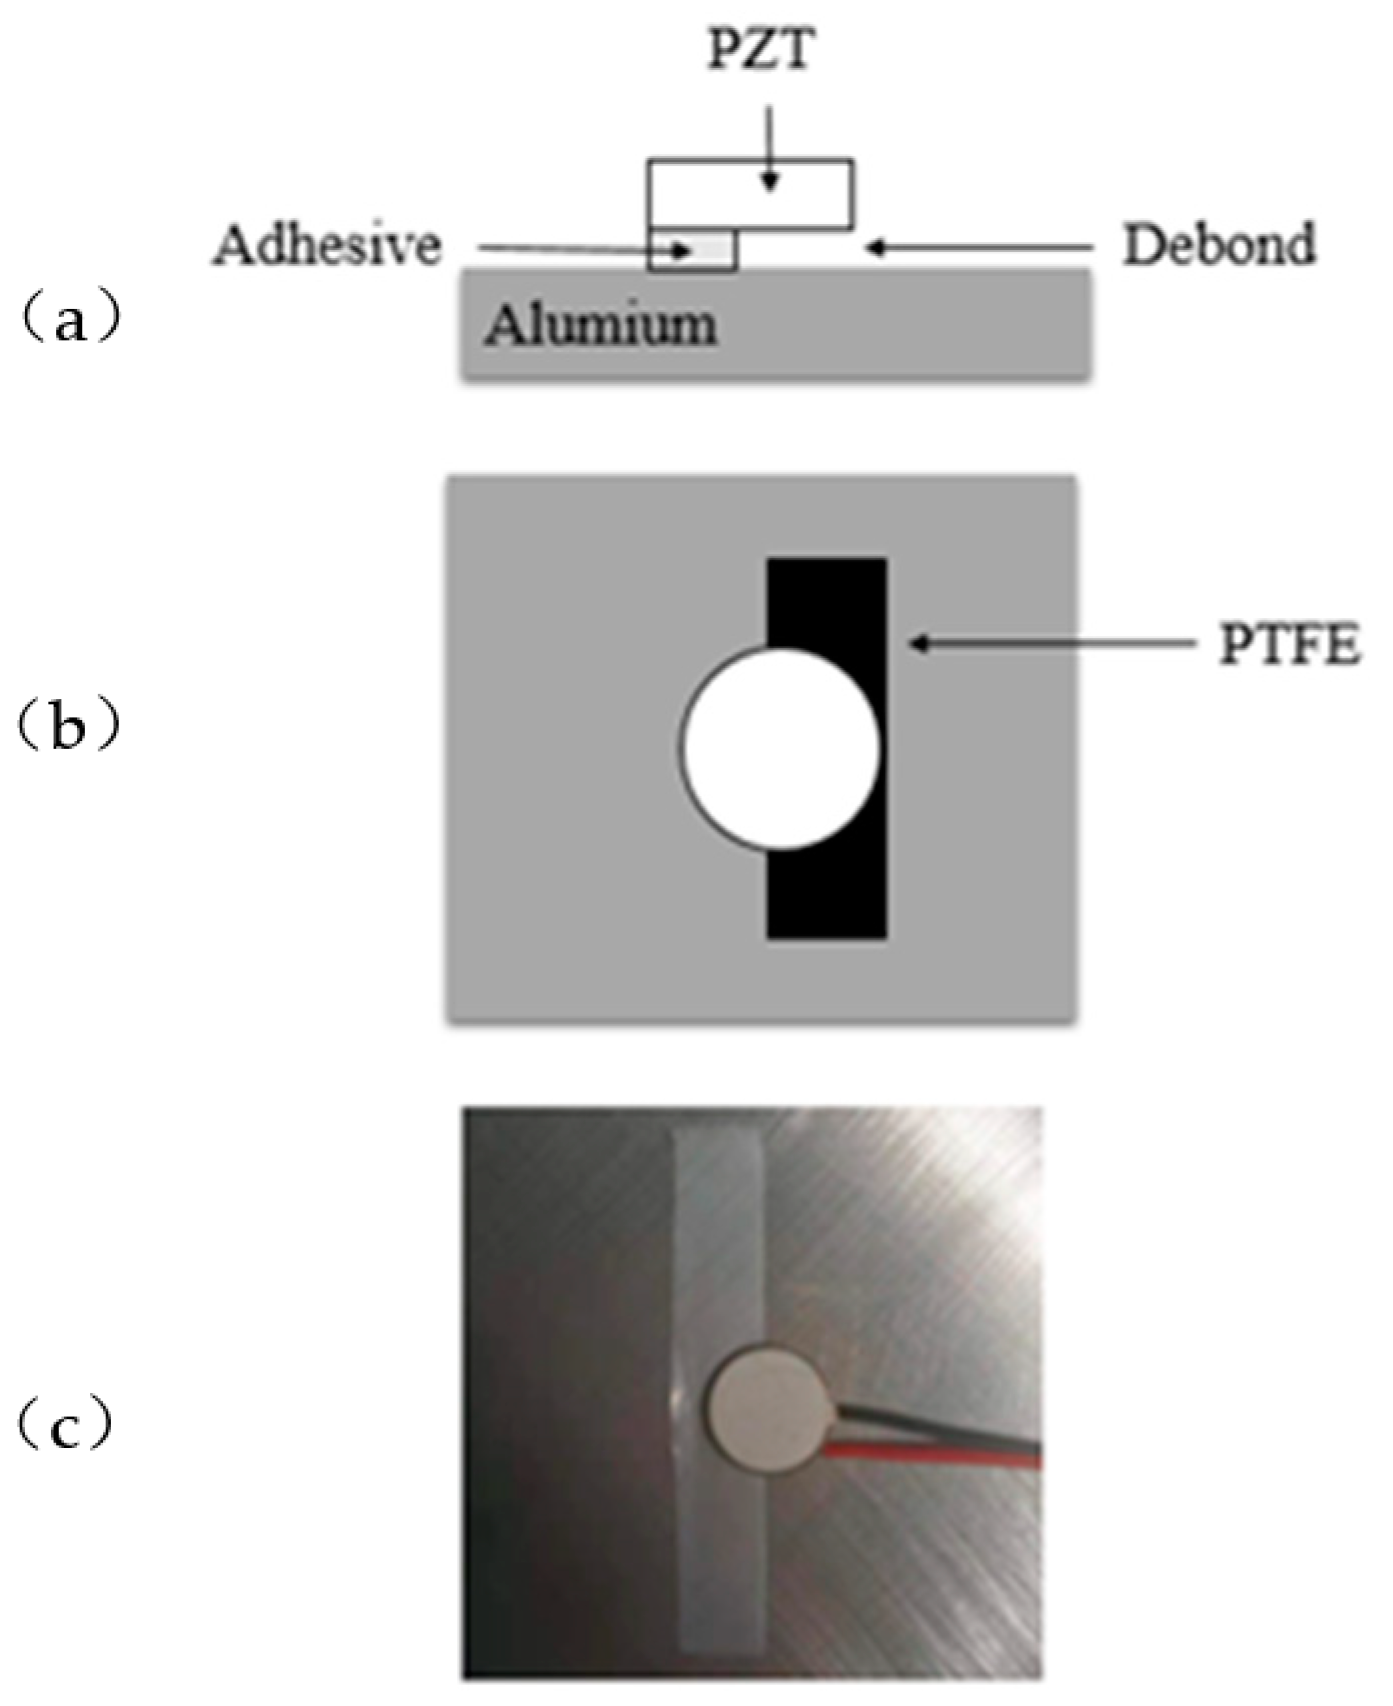
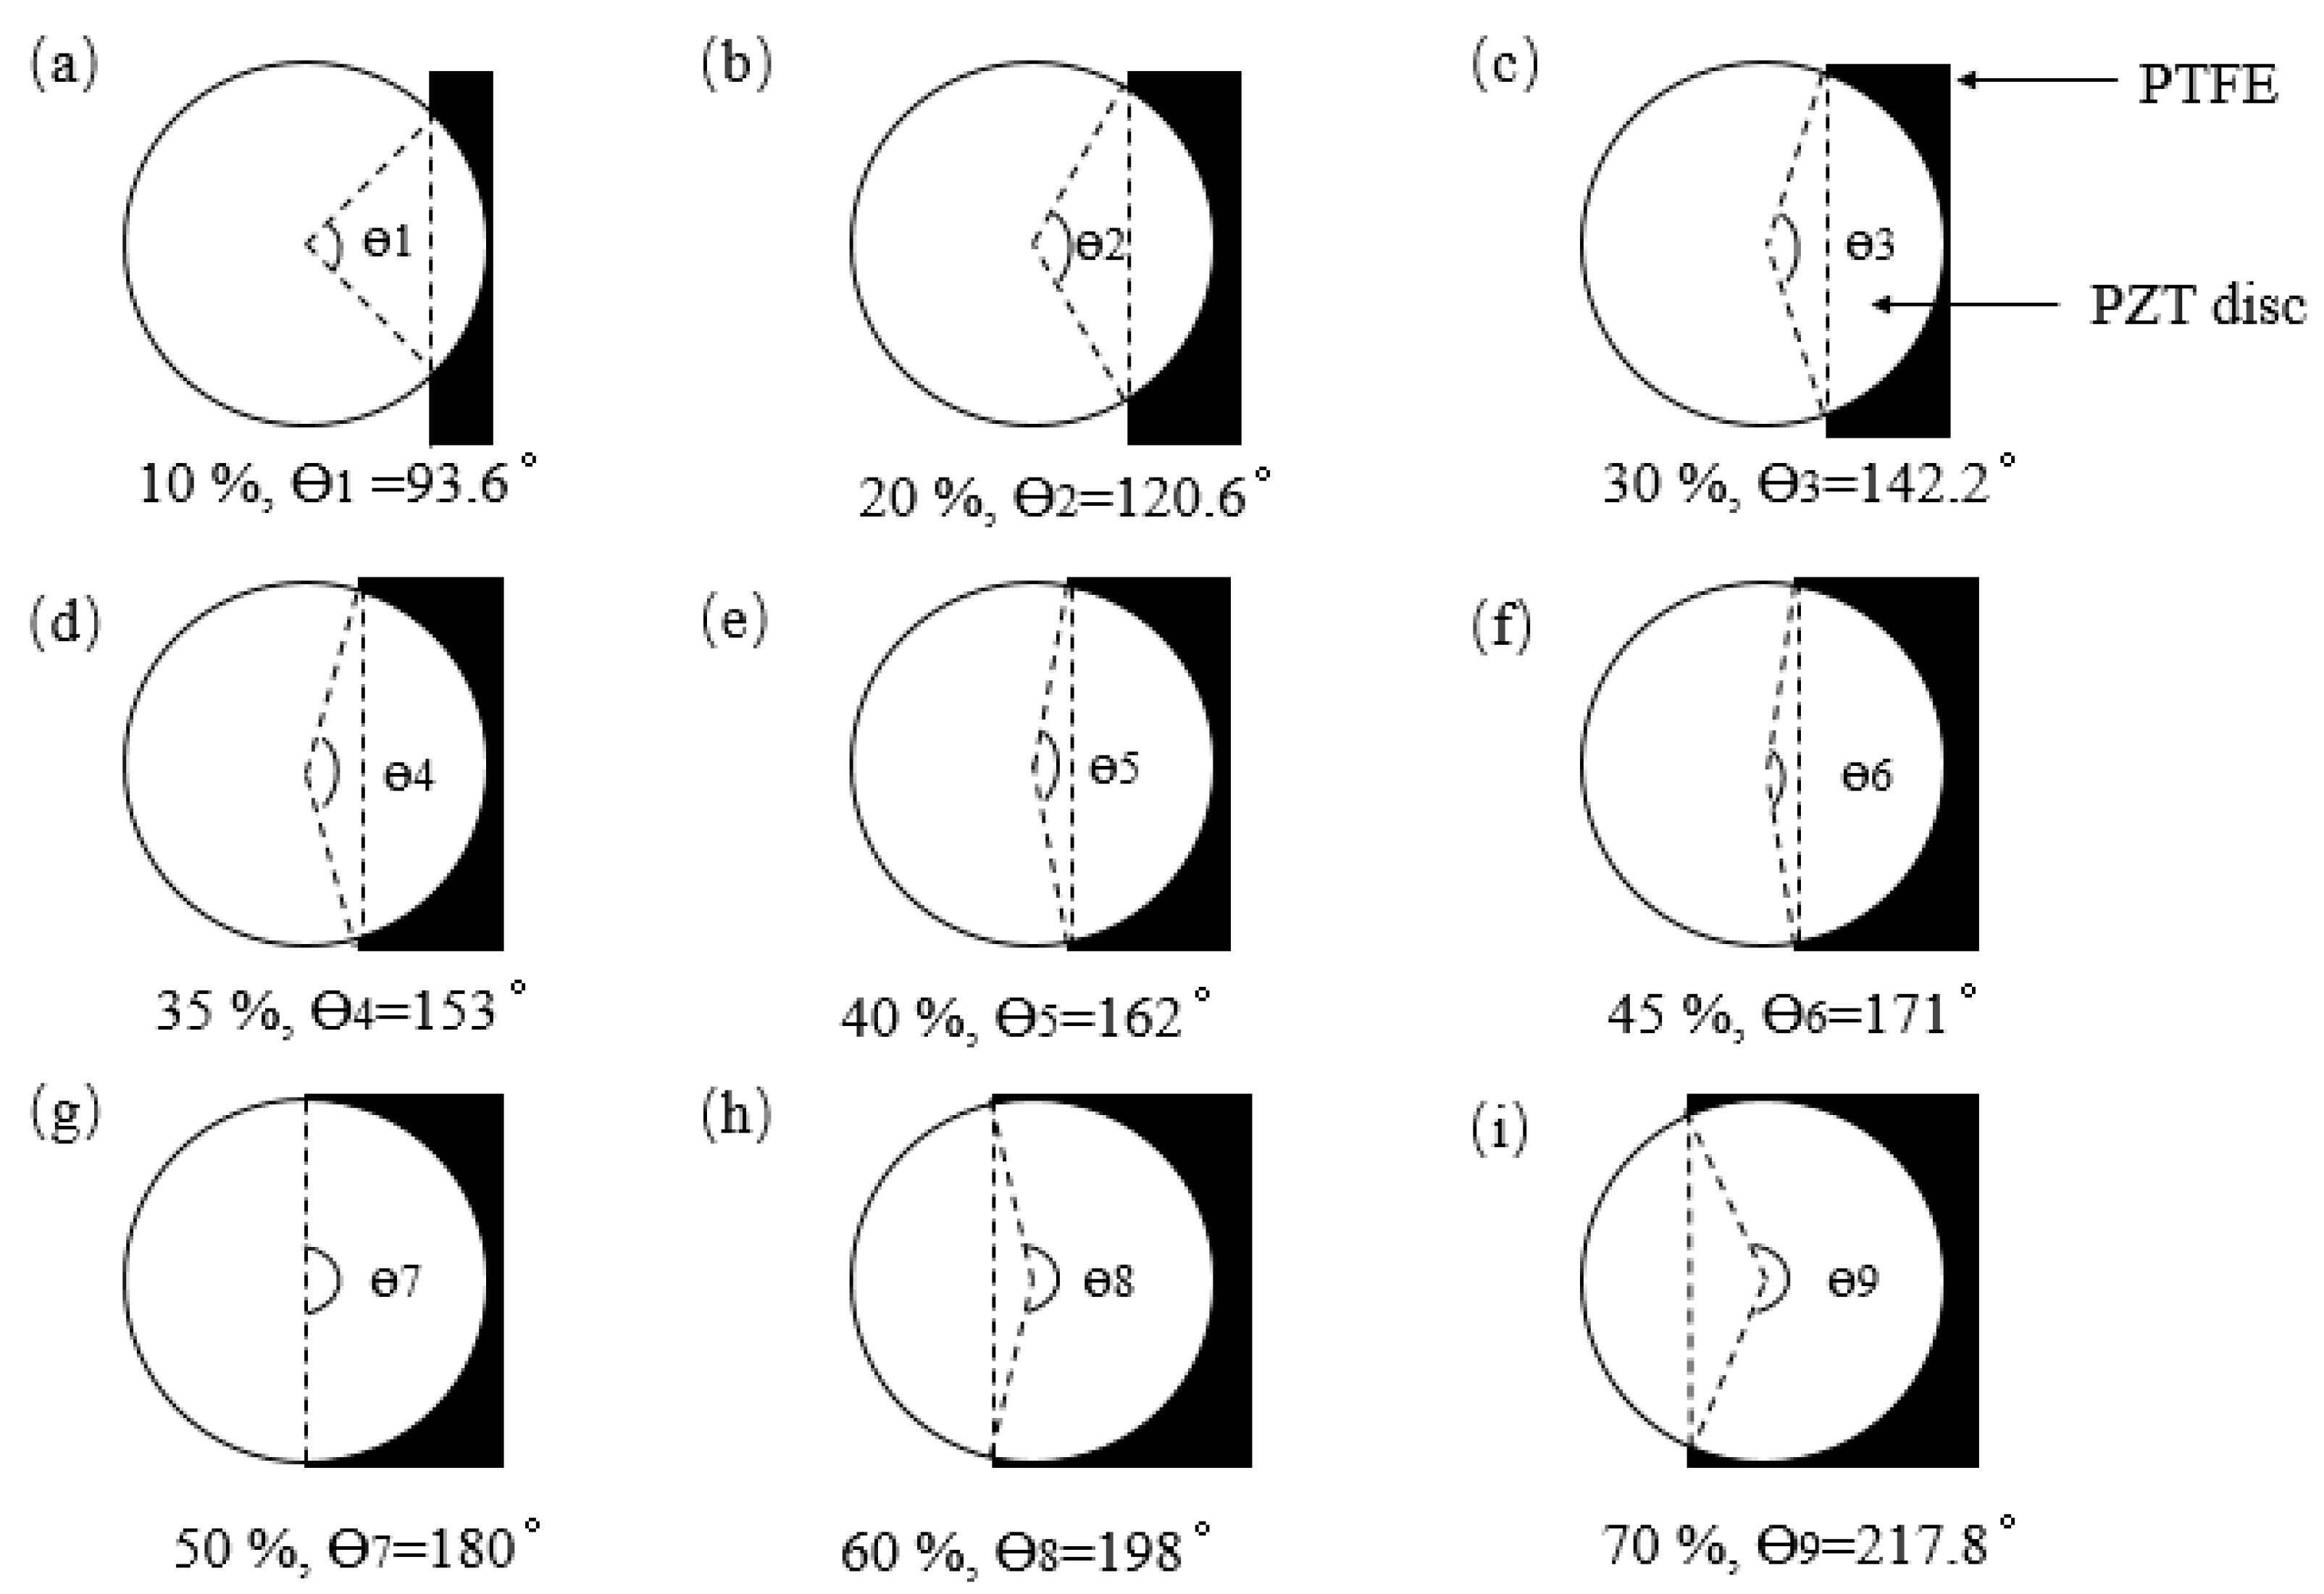
3.1. Debonding Design
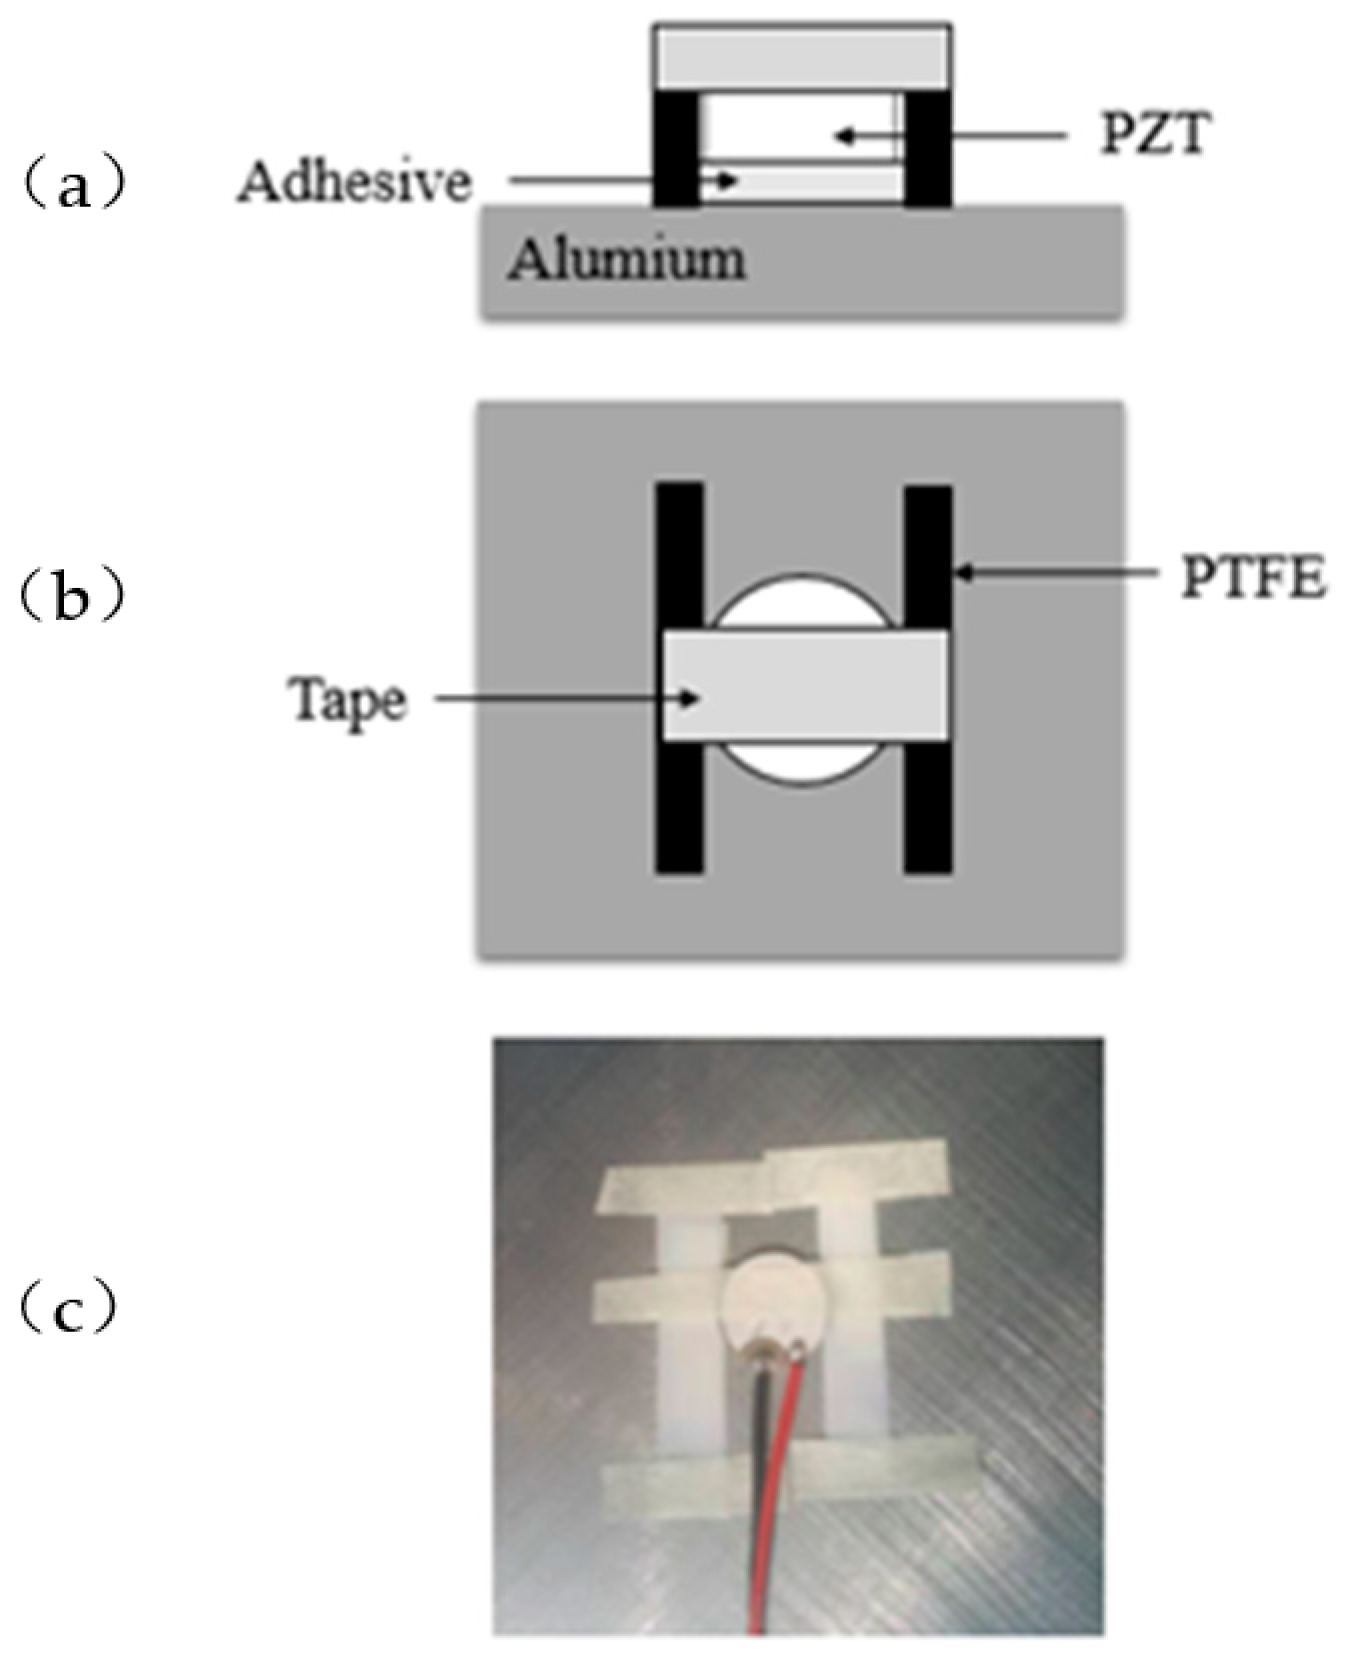
3.2. Debonding Manufacturing Process
4. Results analysis
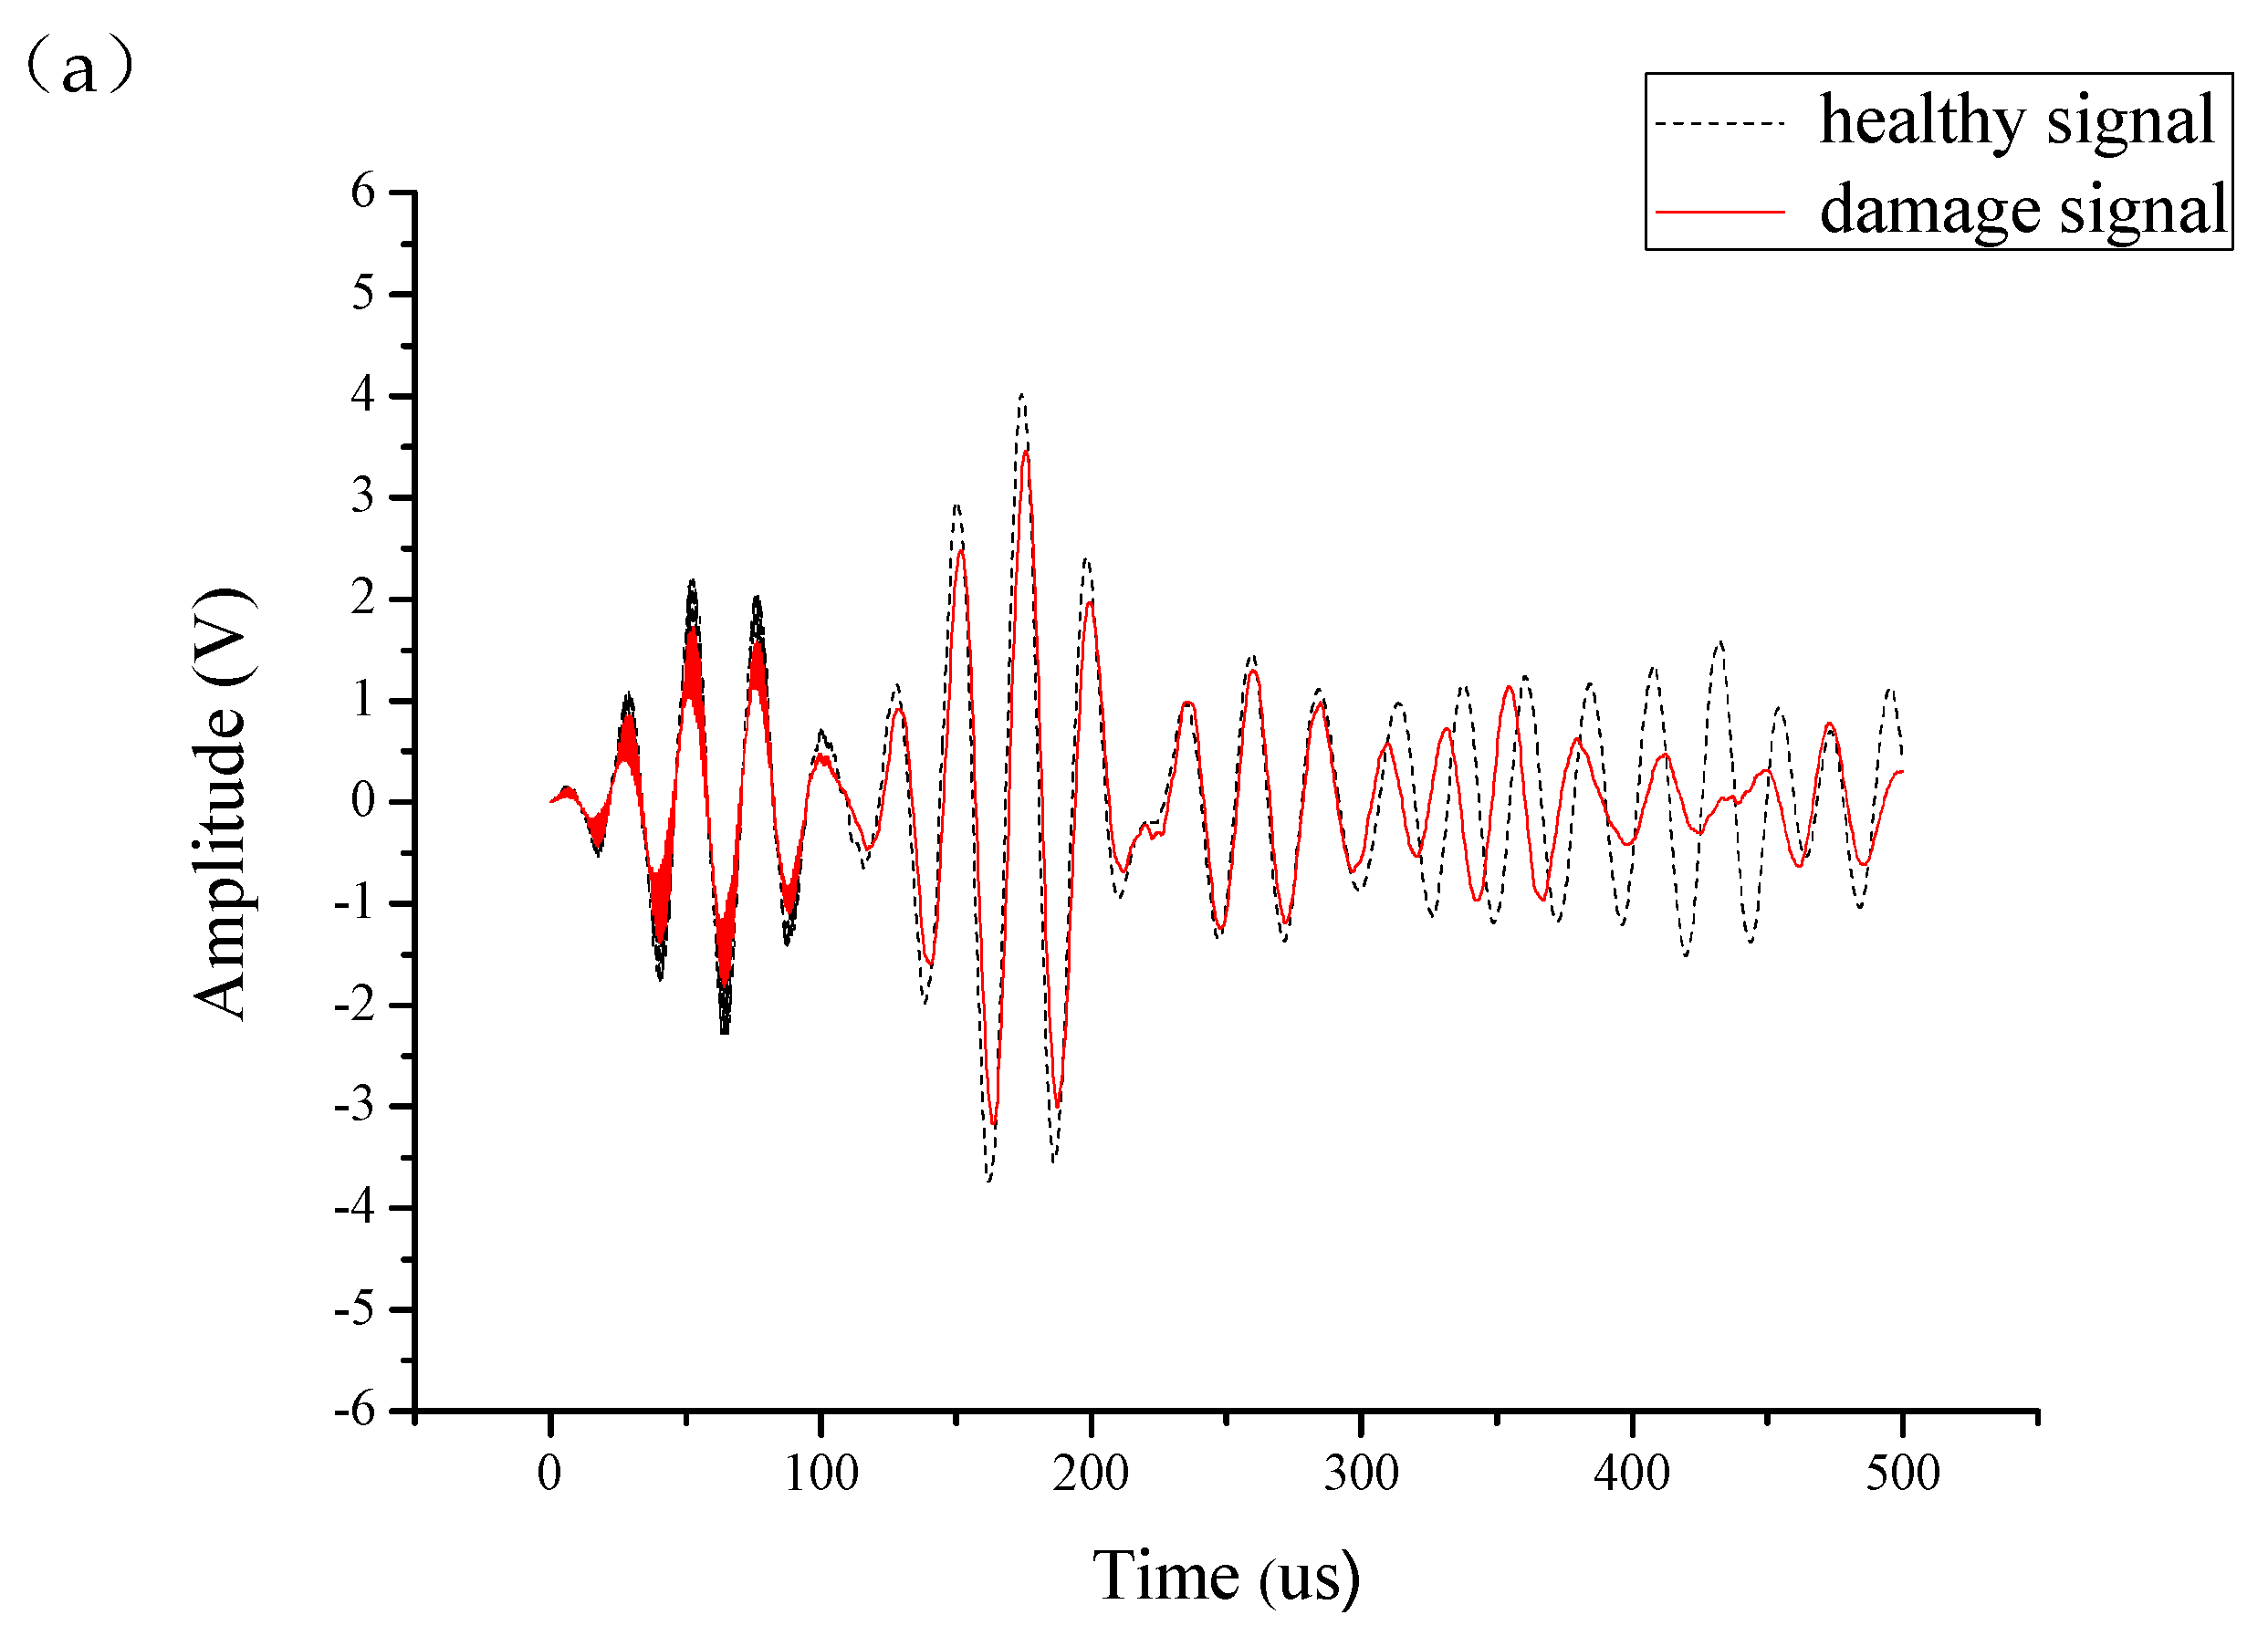
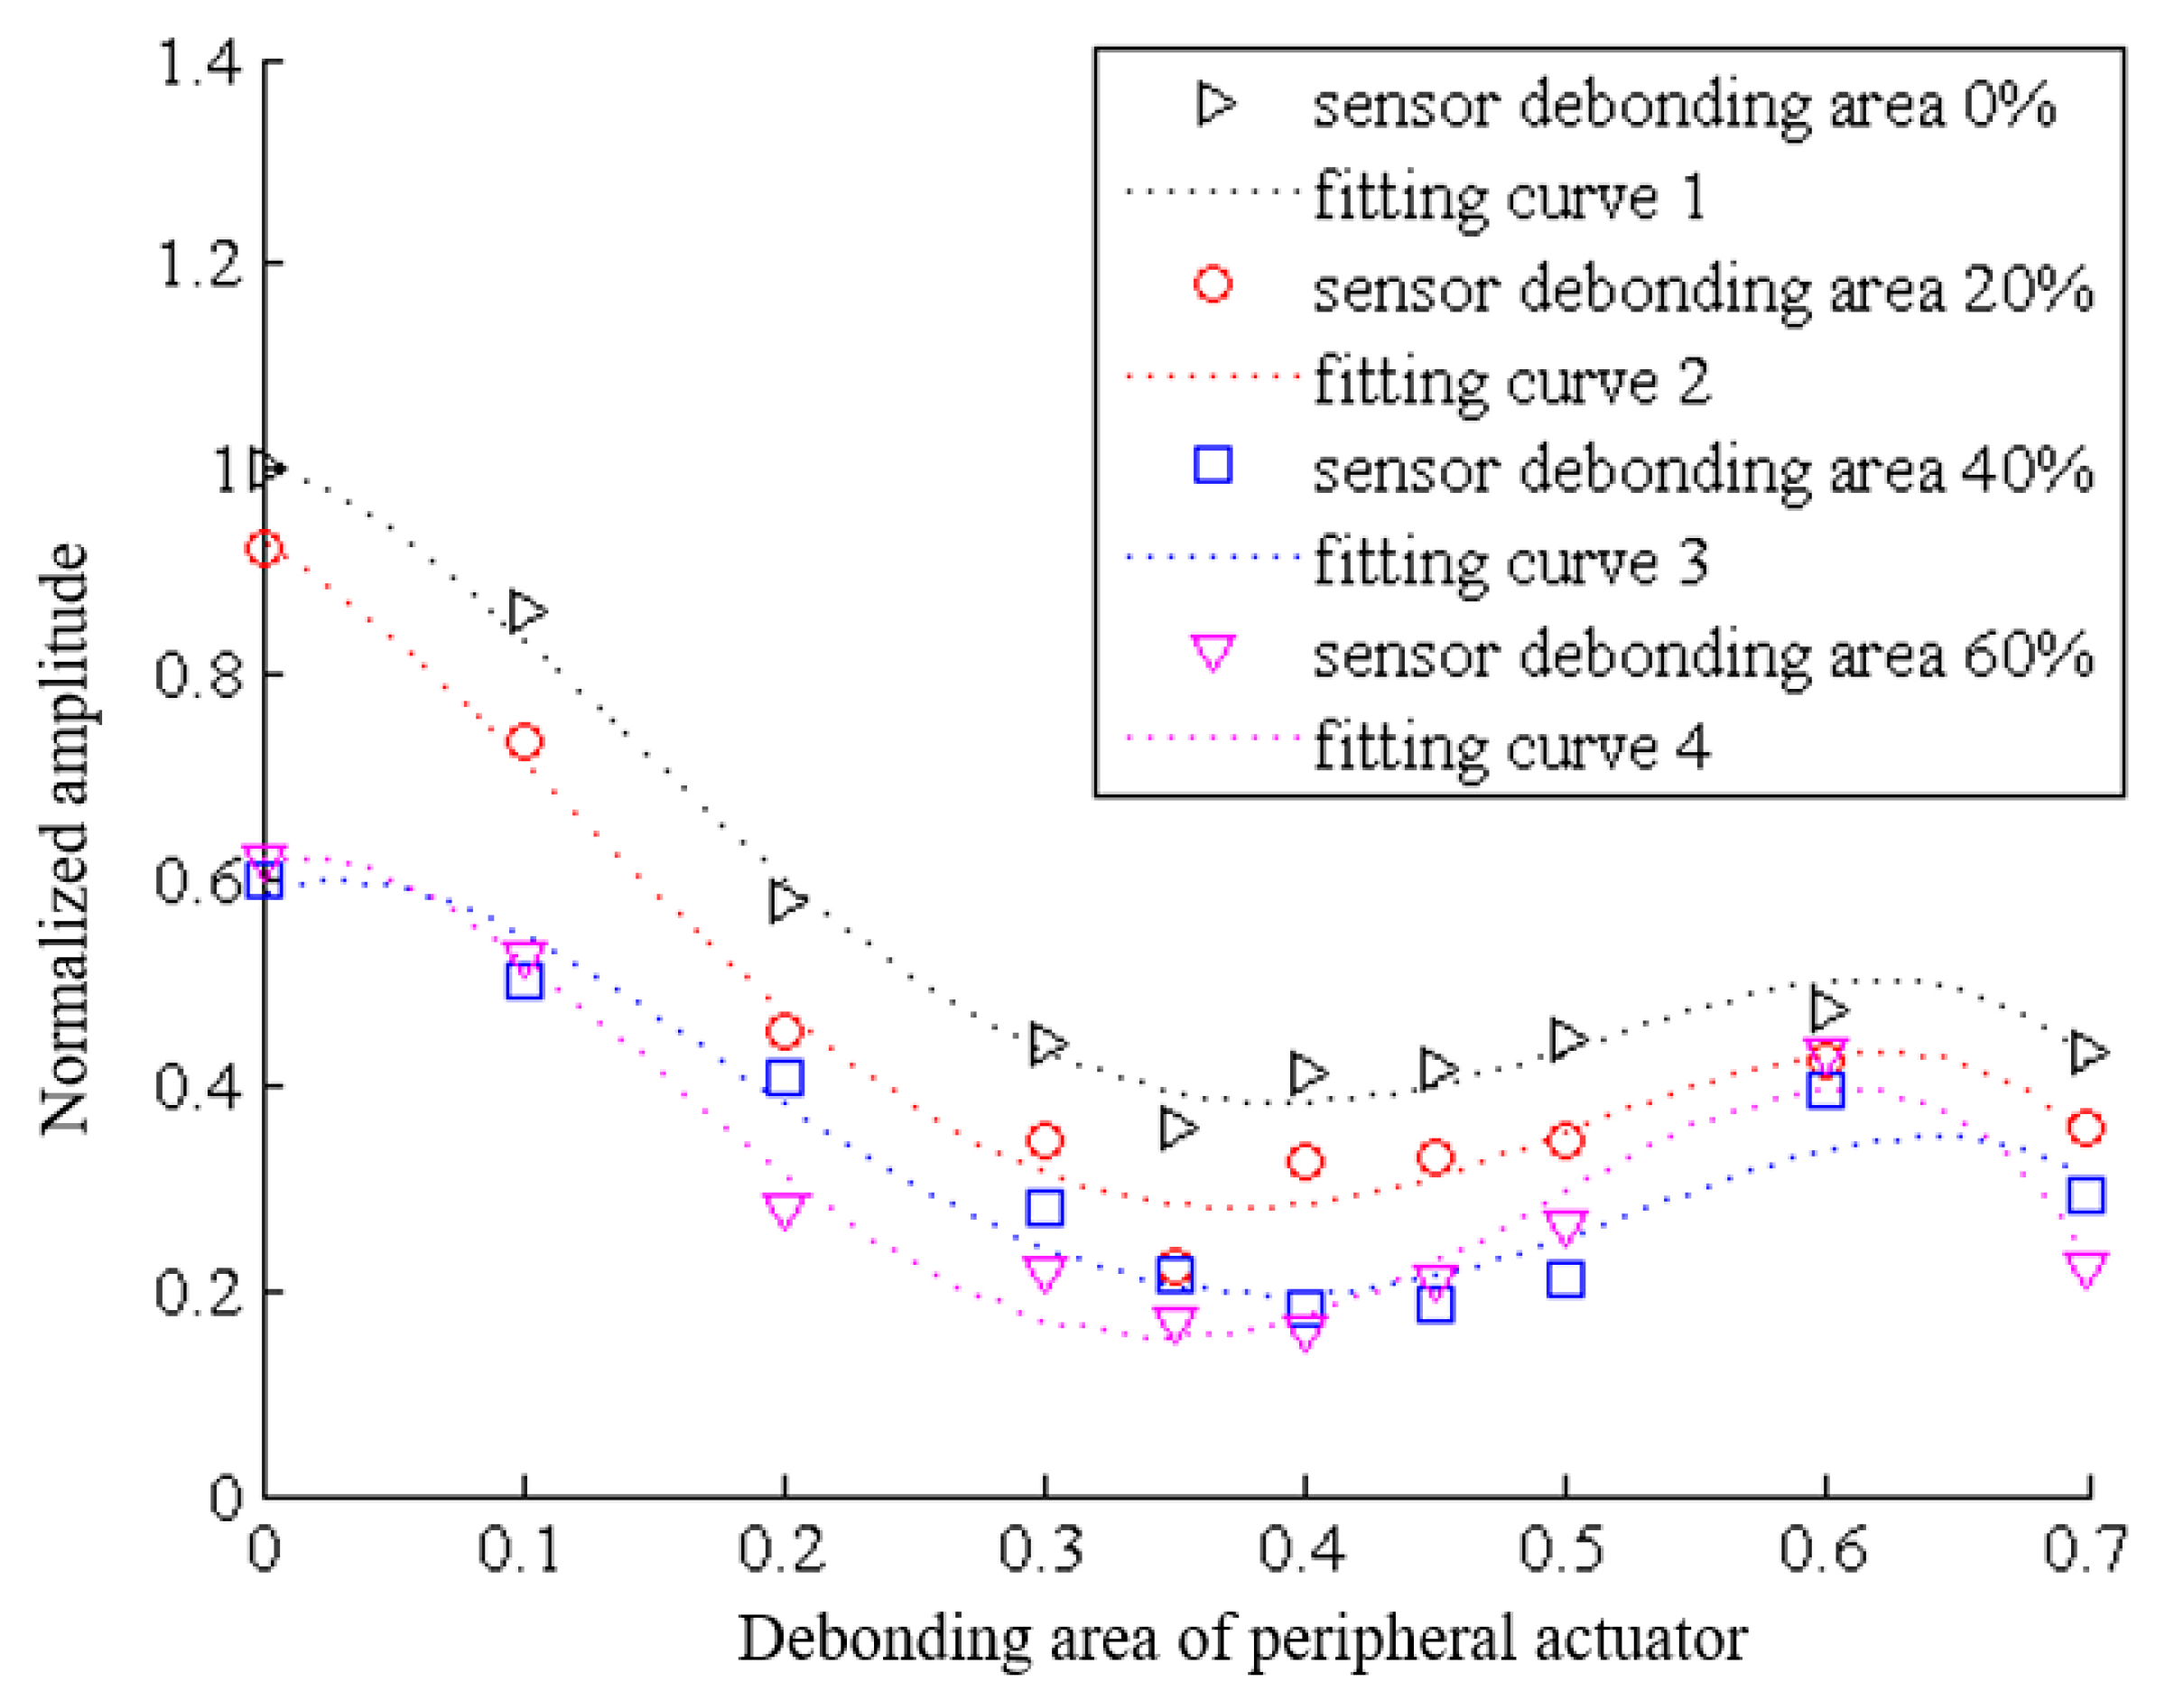
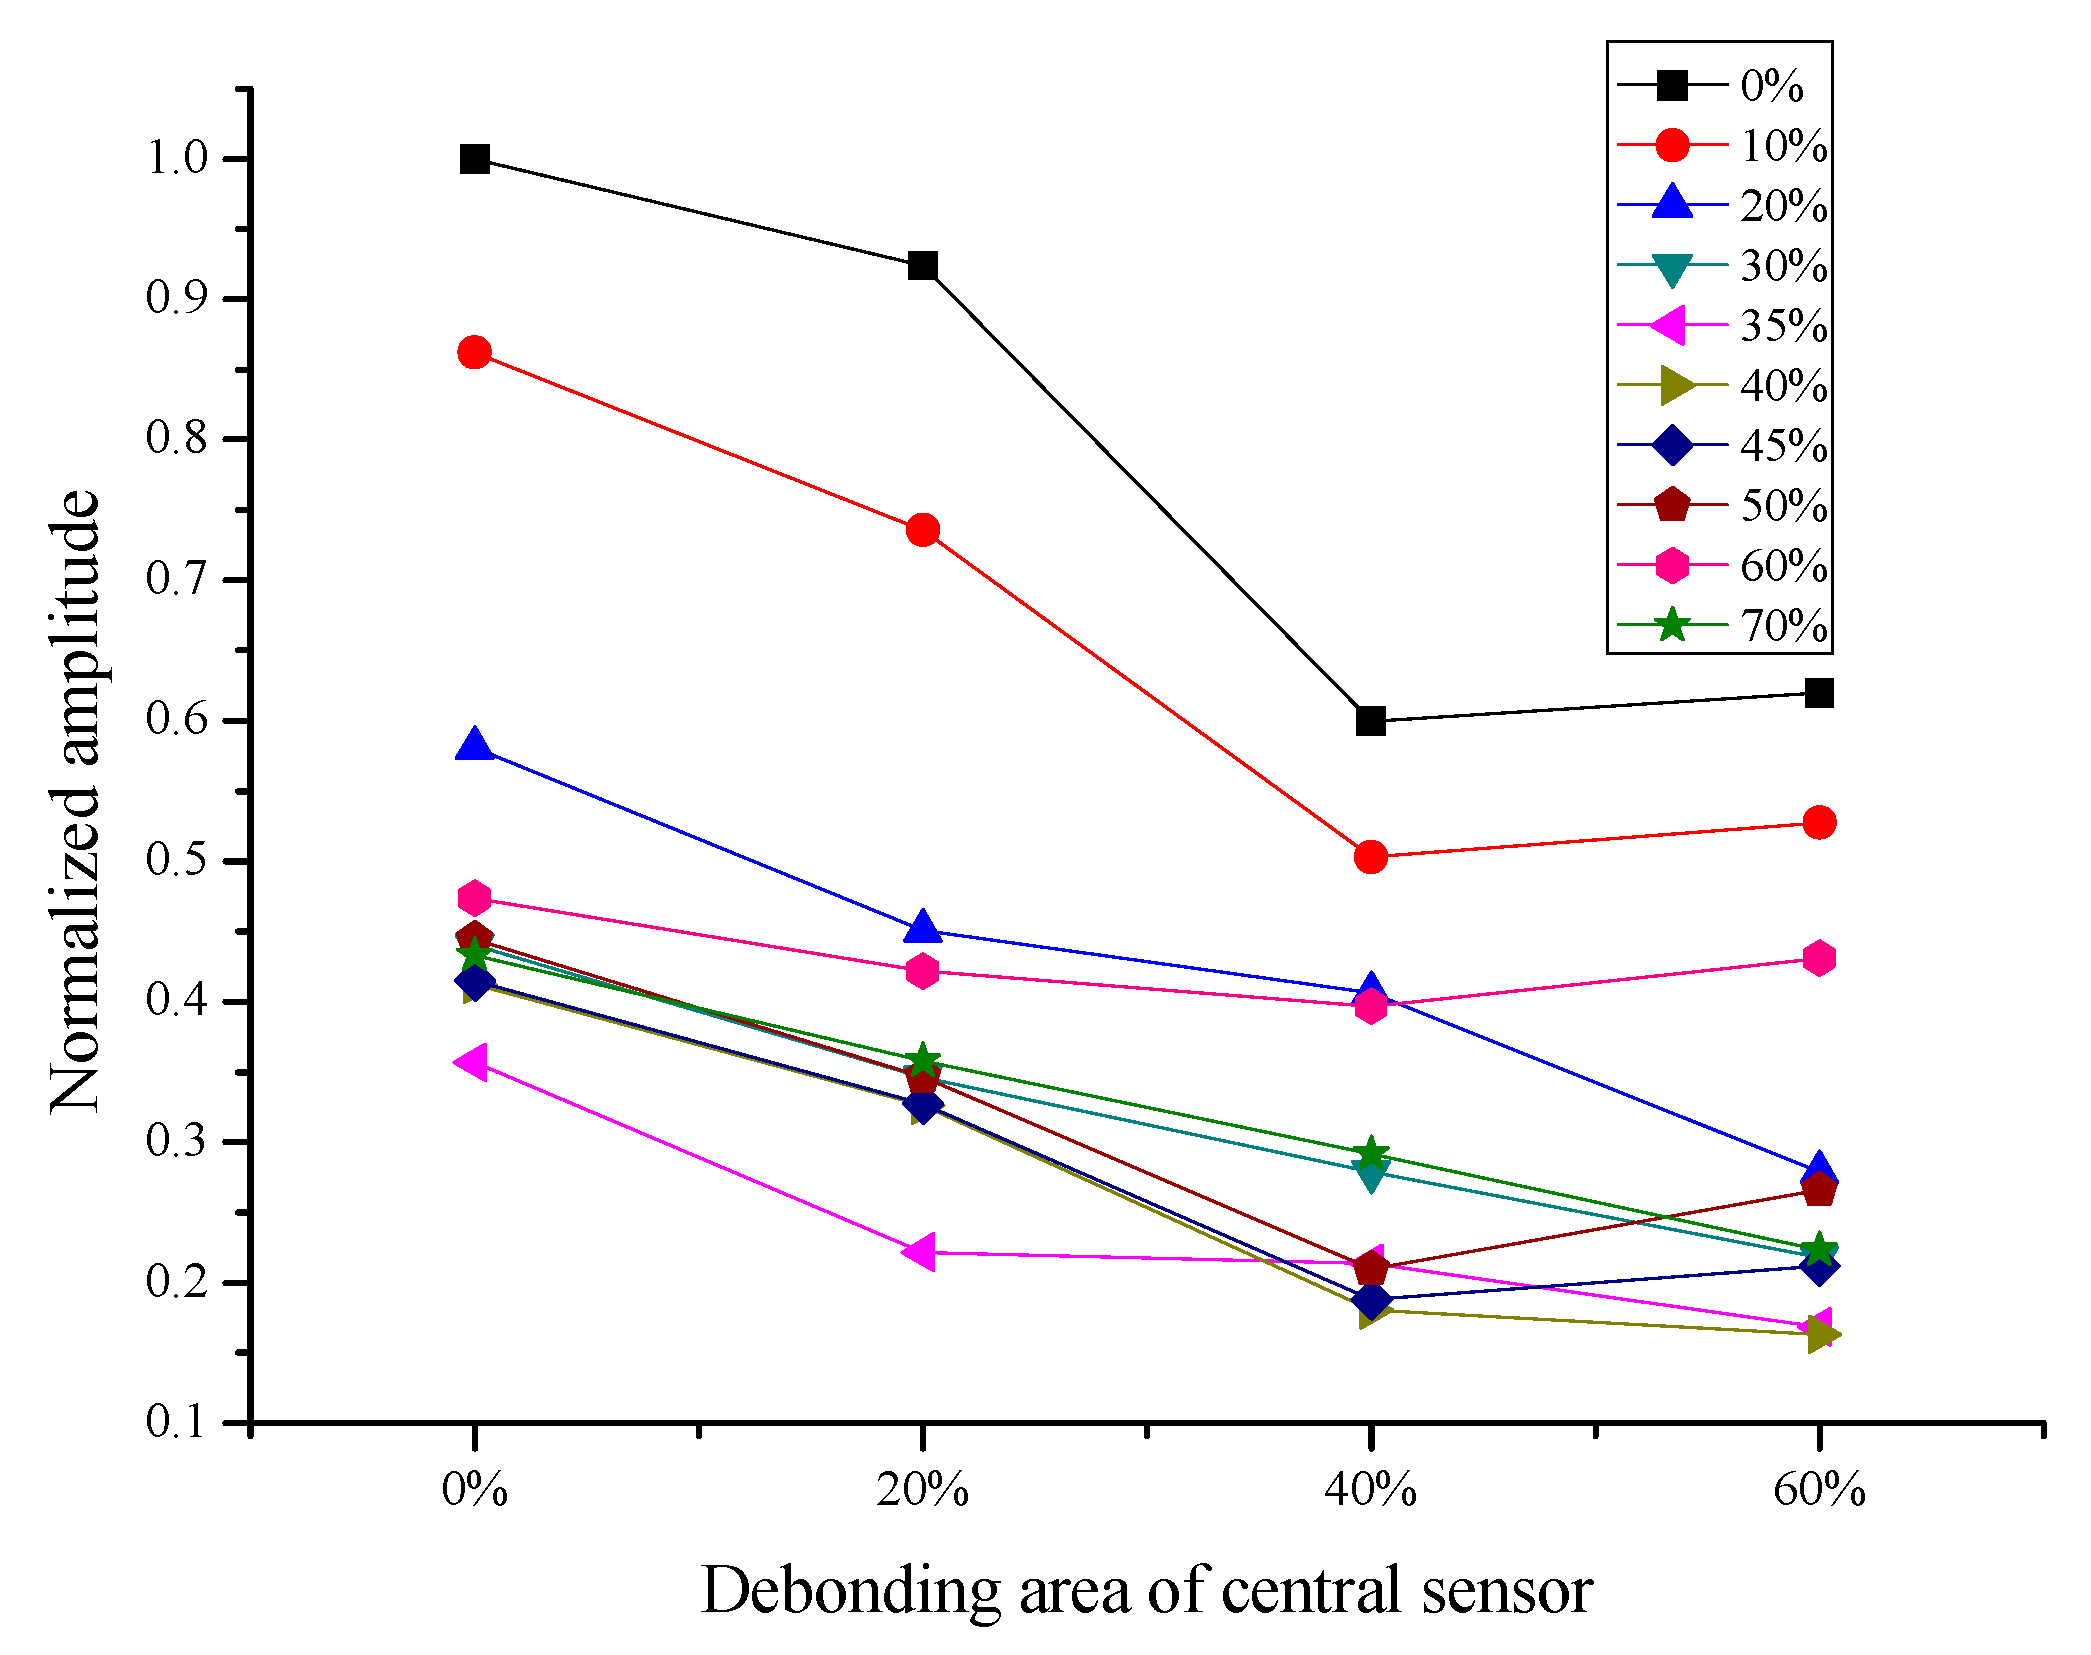
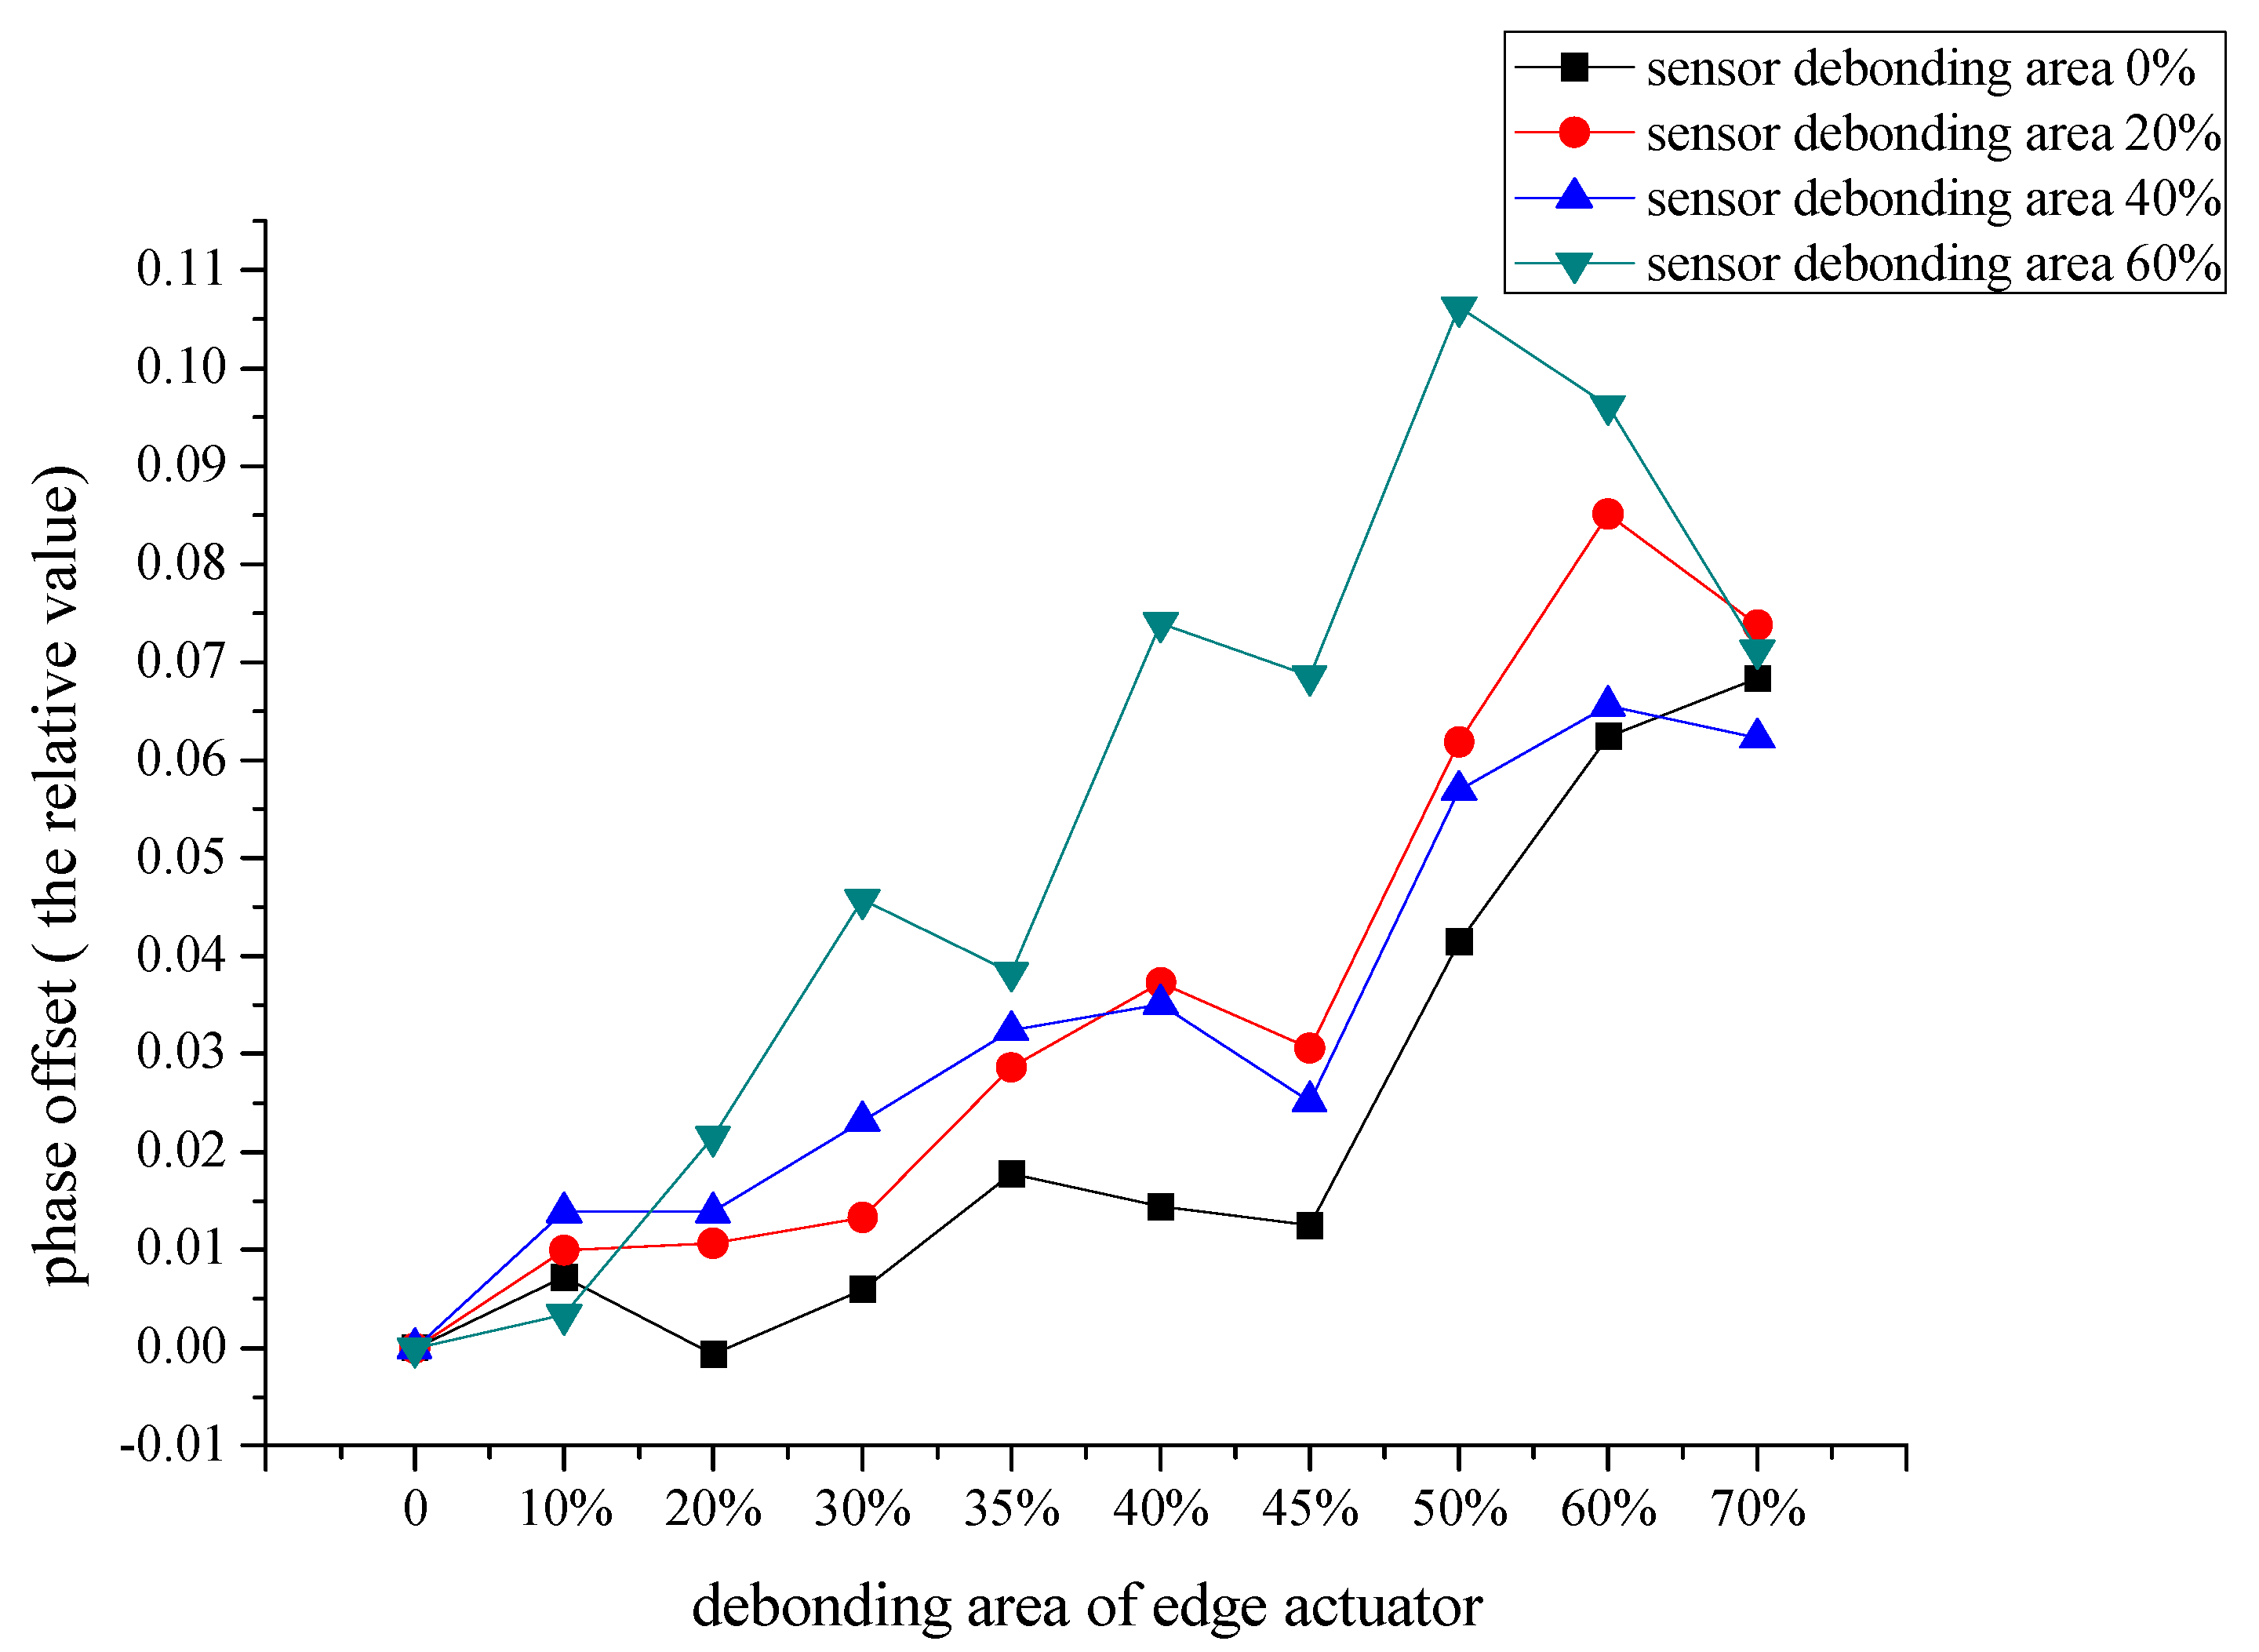
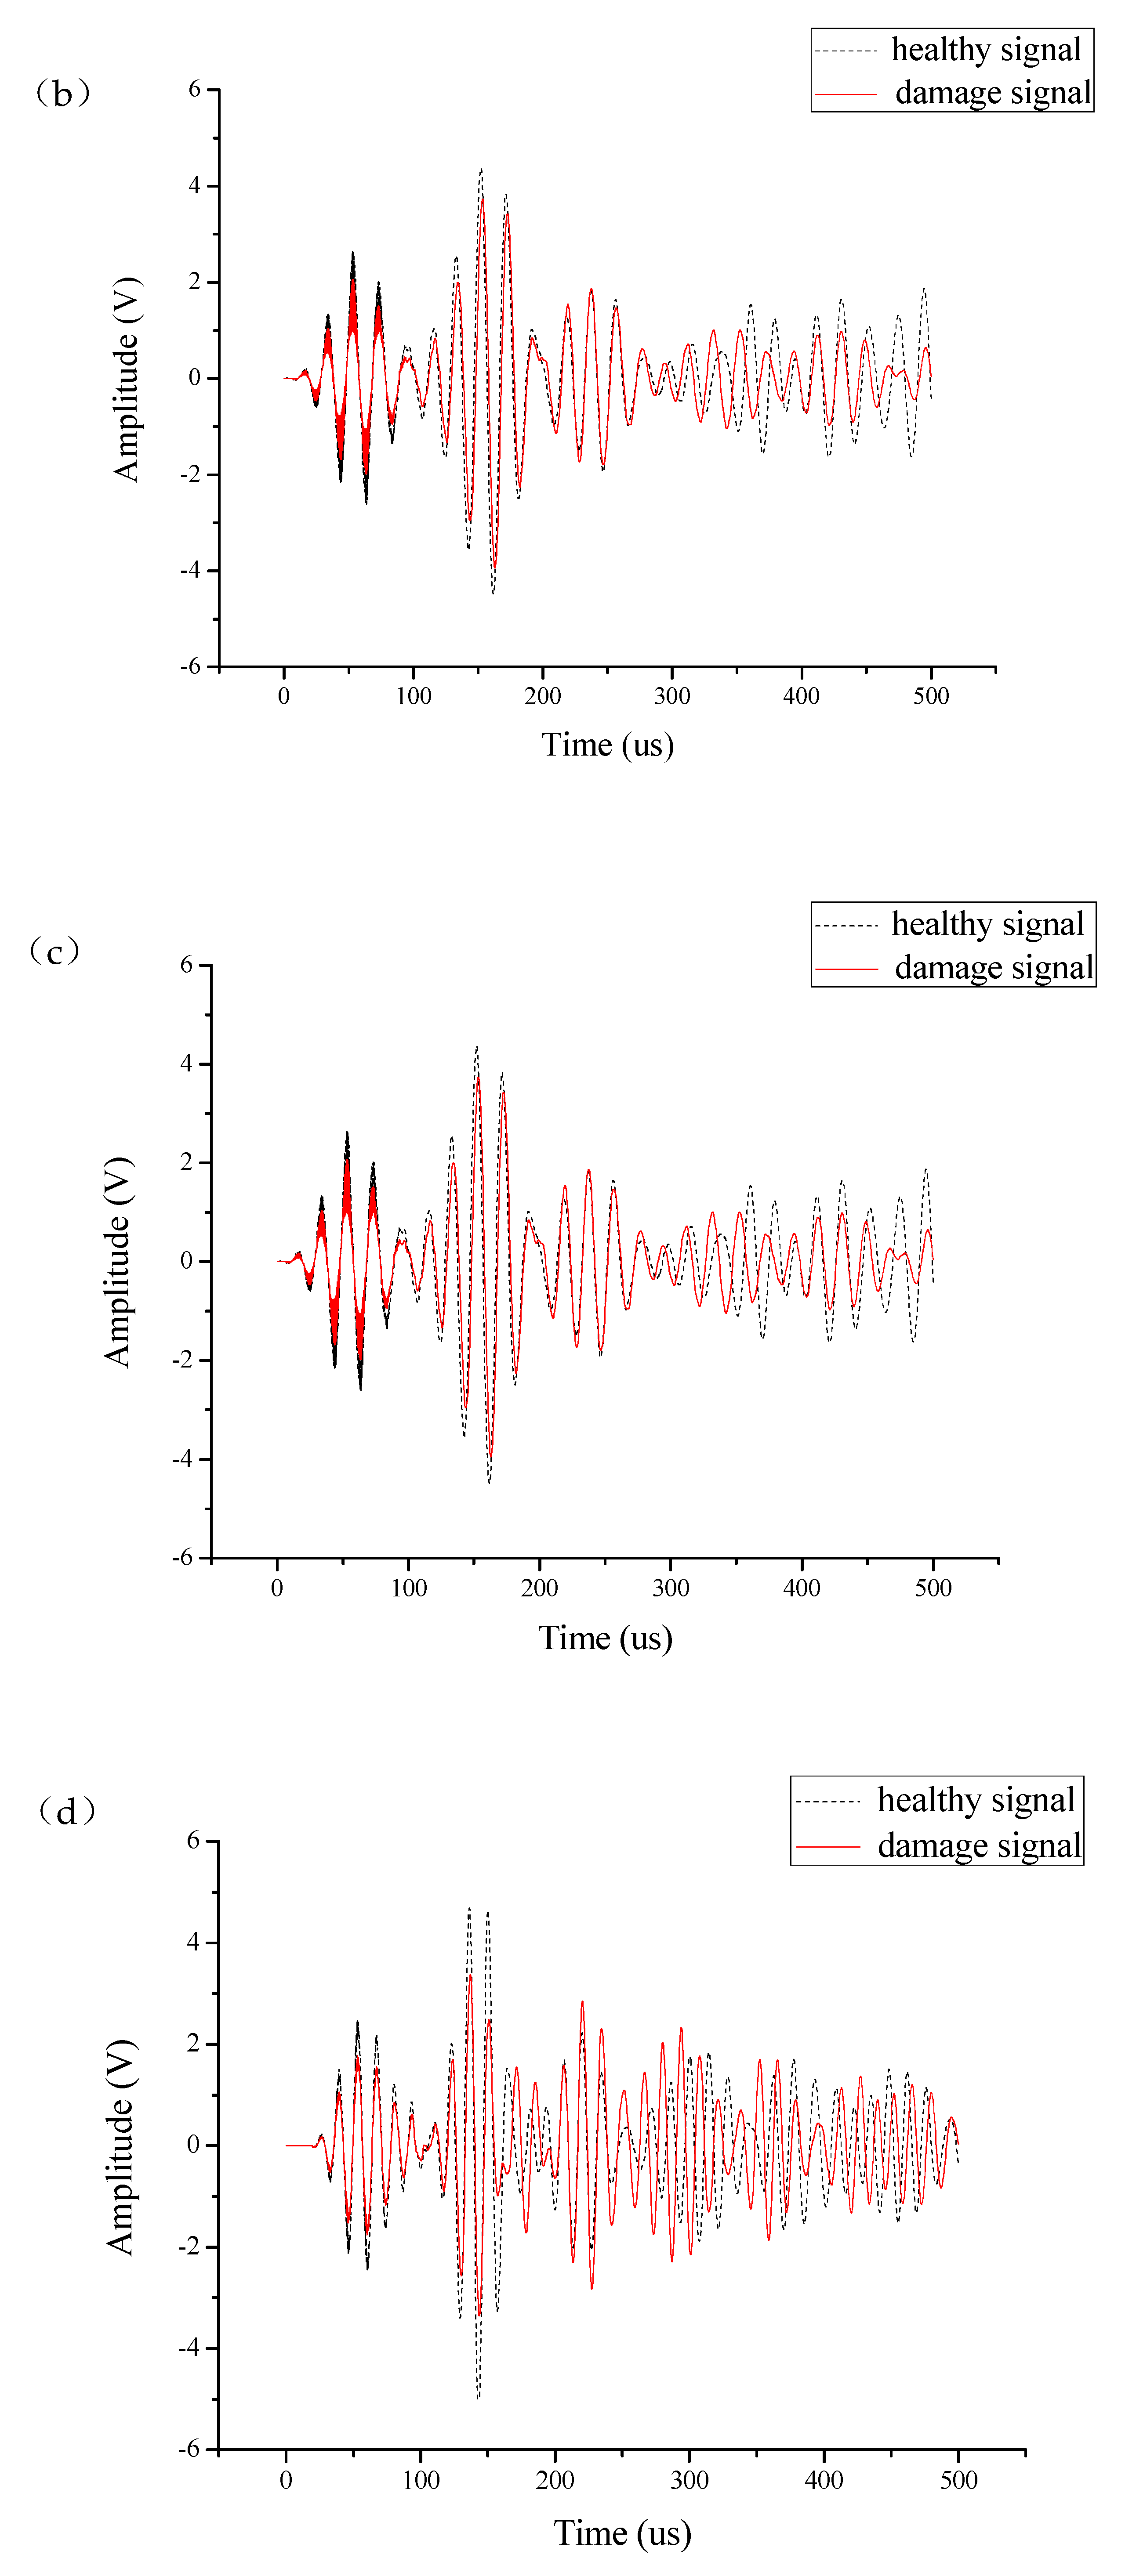
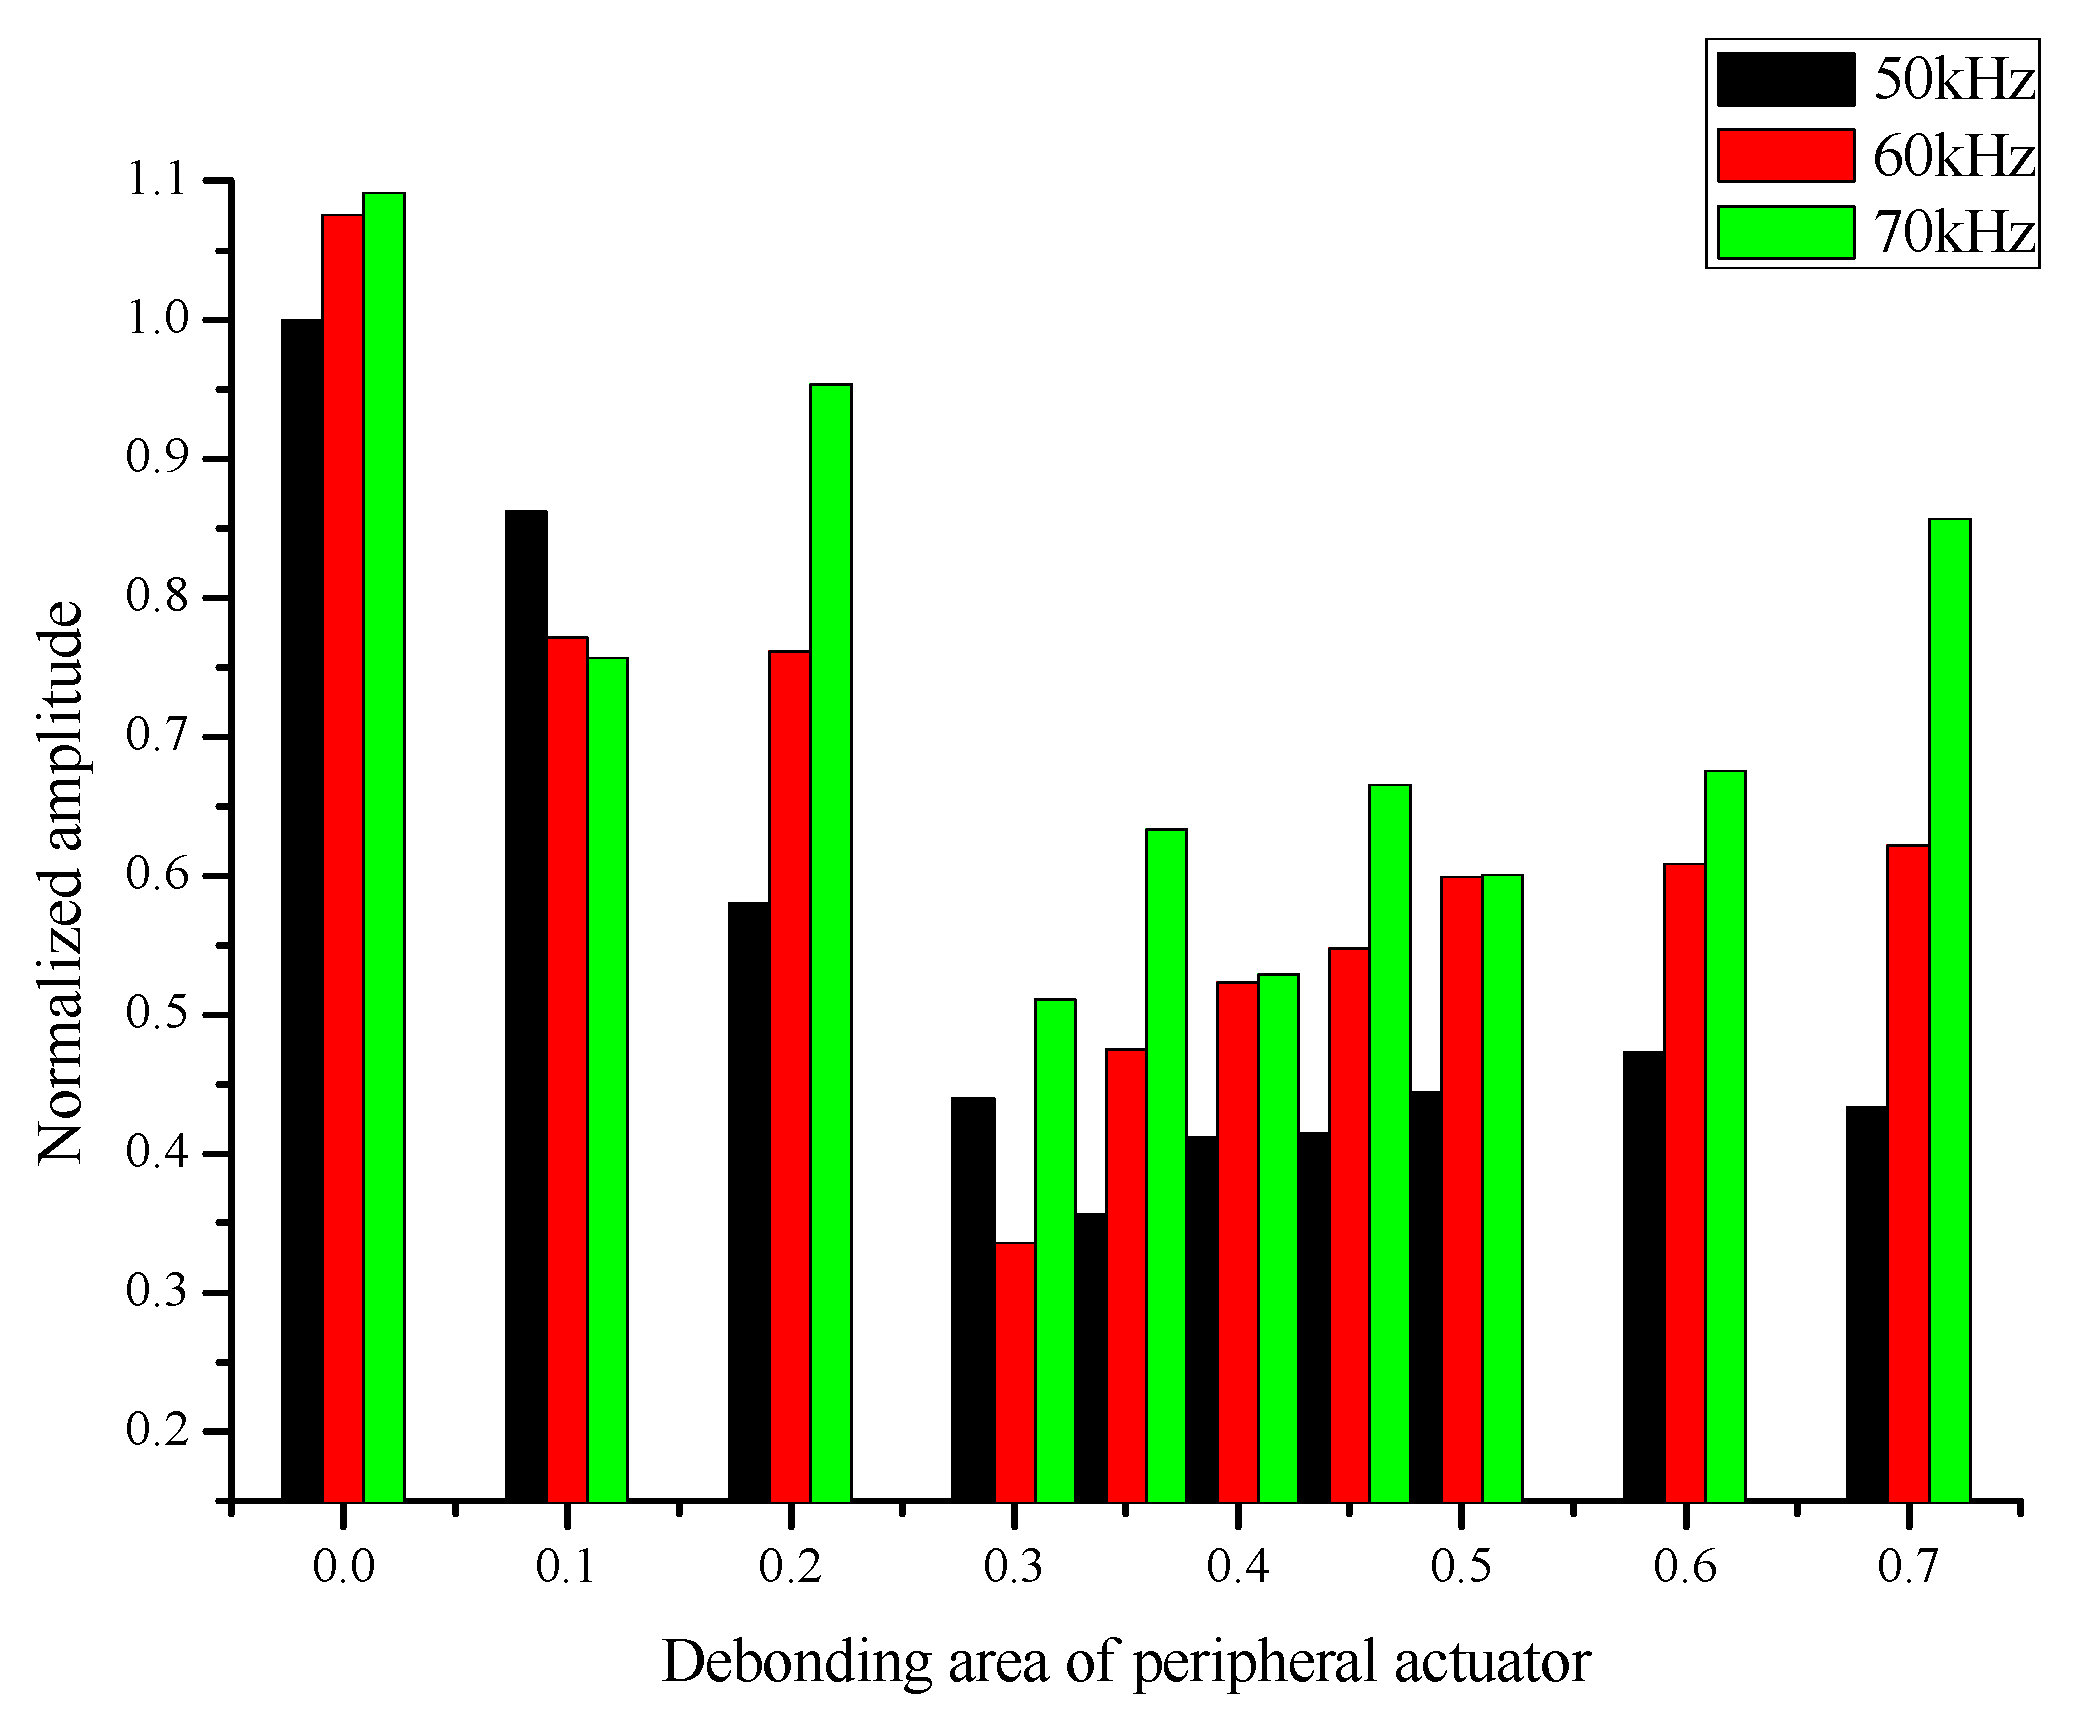
4.1. Effect of Debonding Area in Different Percentages on Signal
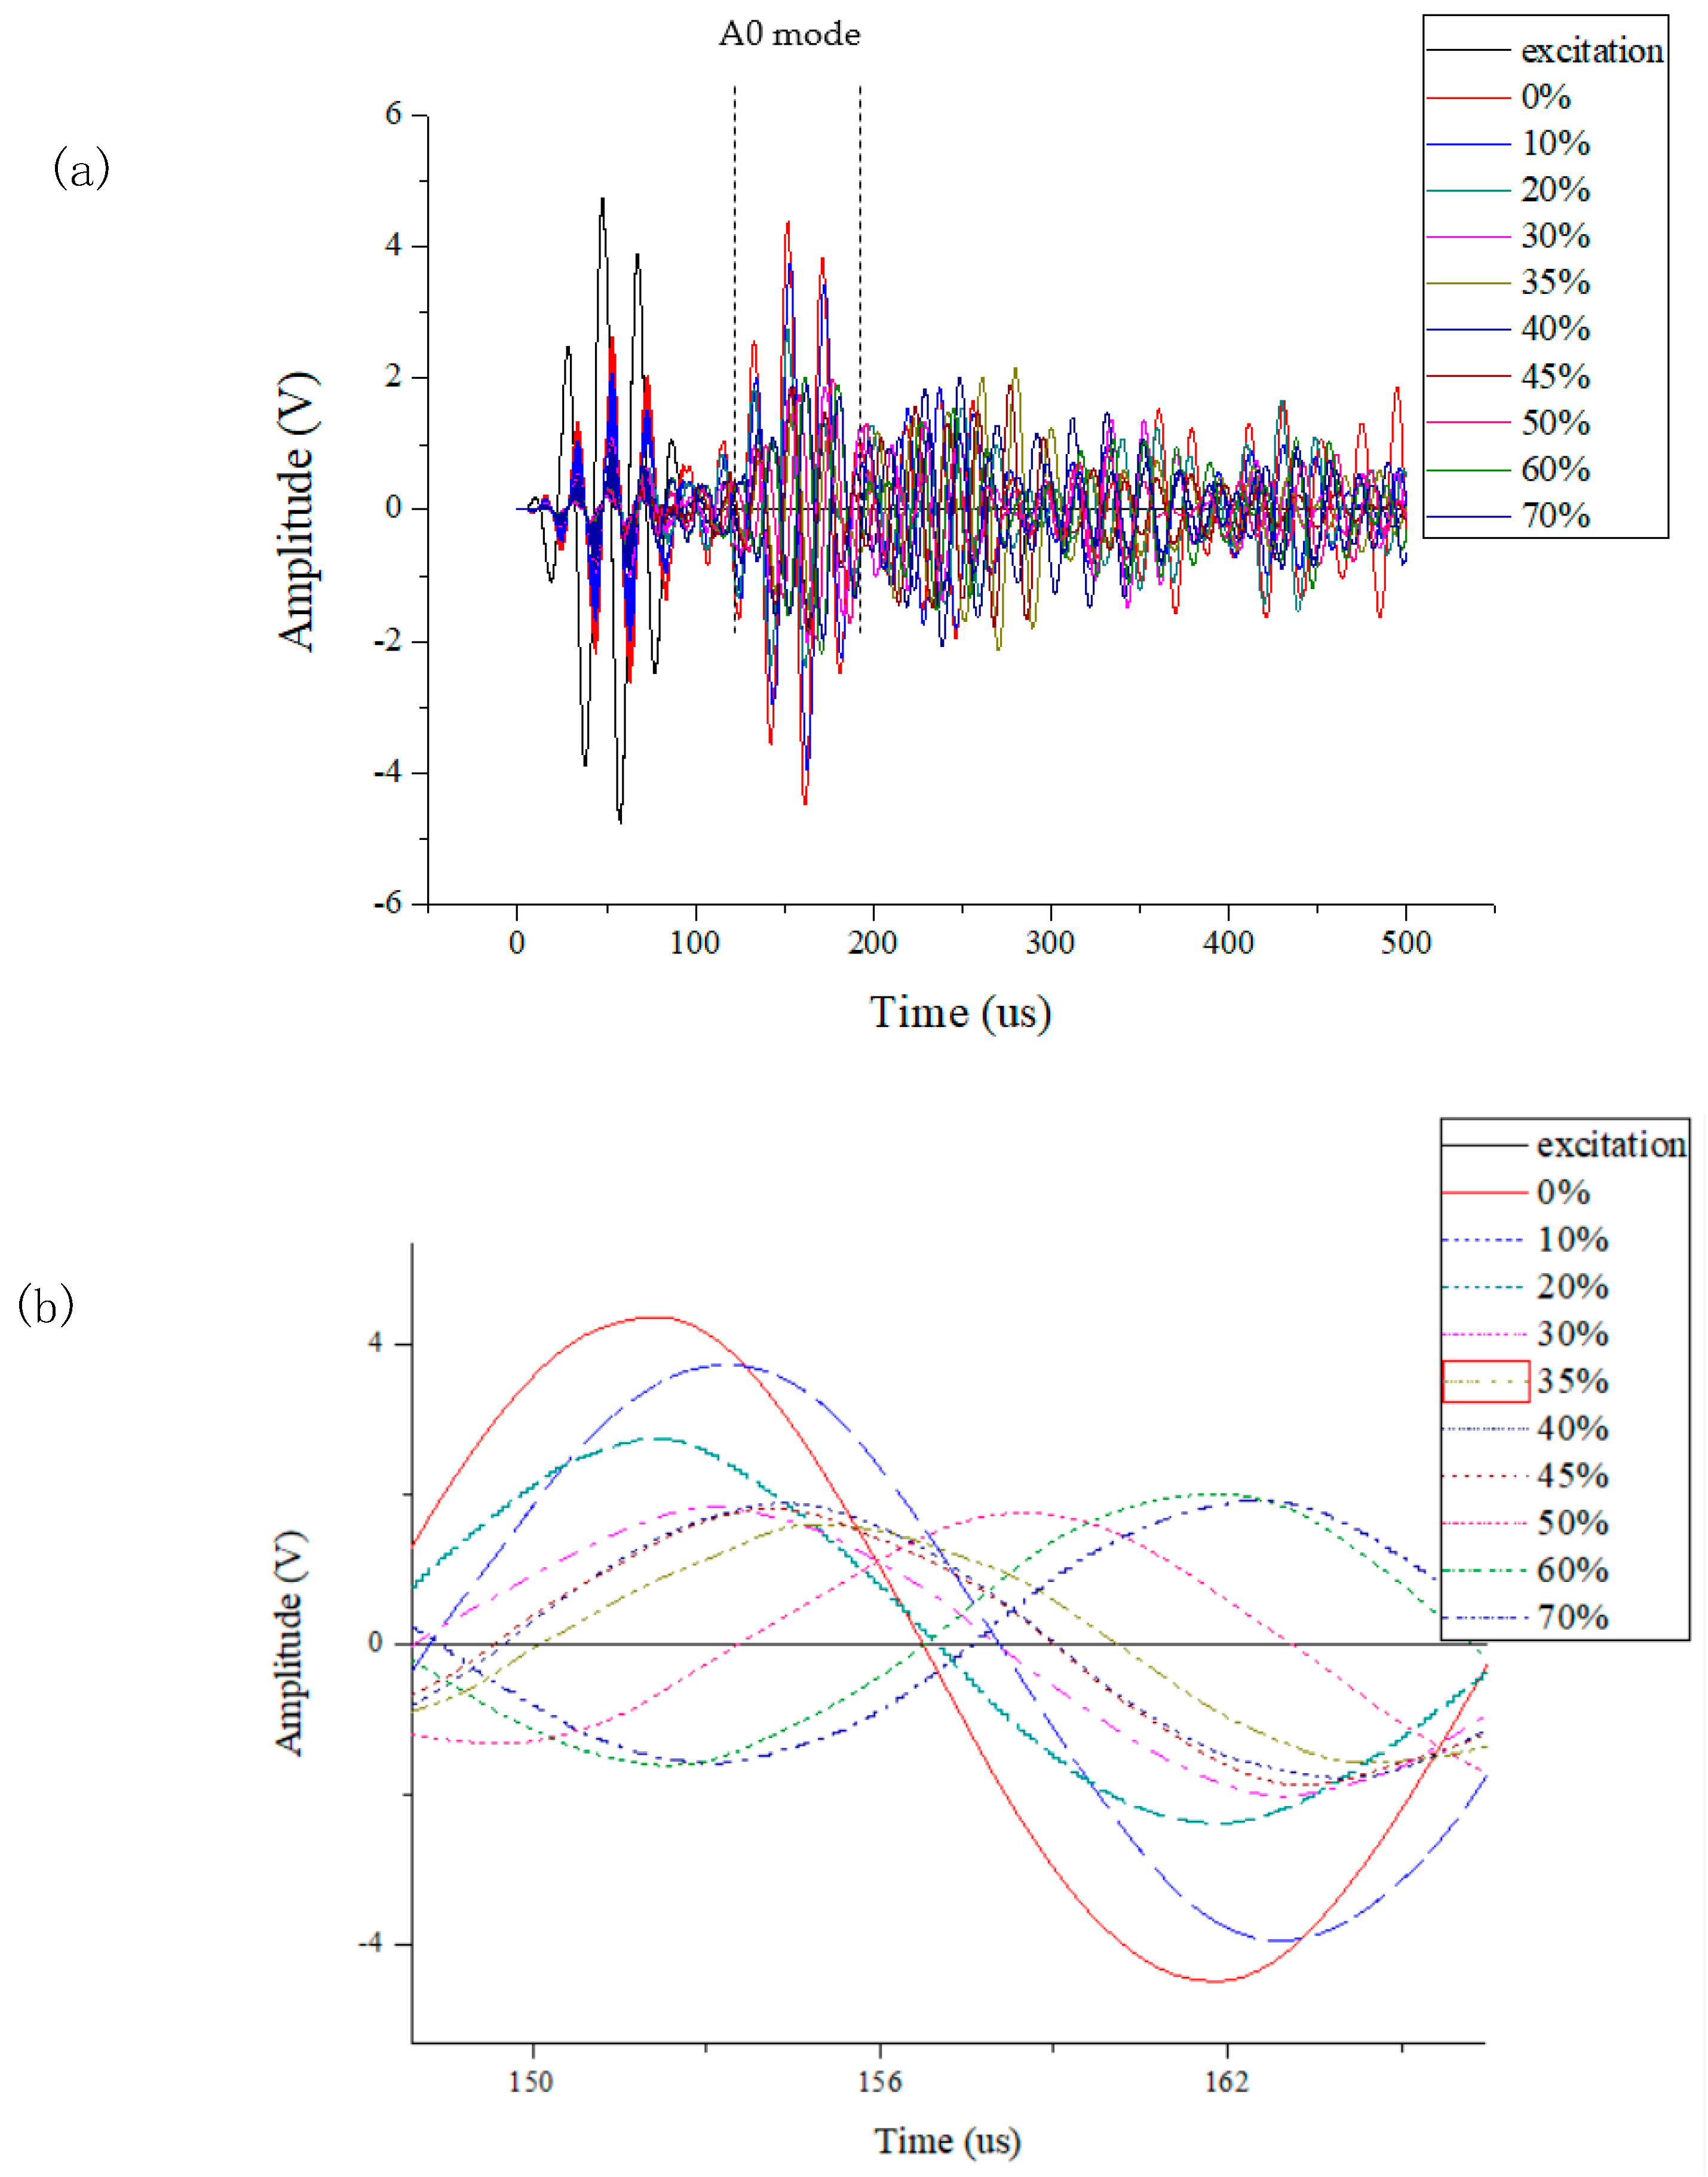
4.2. Effect of Excitation Frequency on Monitoring Signal
5. Conclusions
Author Contributions
Funding
Conflicts of Interest
References
- Farrar, C.R.; Worden, K. An introduction to structural health monitoring. CISM. Int. Cent. Mech. Sci. Courses Lect. 2010, 520, 1–17. [Google Scholar] [CrossRef]
- Lin, M.; Qing, X.; Kumar, A.; Beard, S.J. SMART Layer and SMART Suitcase for structural health monitoring applications. Proc. SPIE Int. Soc. Opt. Eng. 2001, 4332, 98–106. [Google Scholar] [CrossRef]
- Martin, S.A.; Blackshire, J.L. Effect of adhesive properties on elastic wave generation by bonded sensors. Sens. Syst. Networks Phenomena Technol. Appl. NDE Heal. Monit. 2007, 6530, 65300J. [Google Scholar] [CrossRef]
- Levin, E.M. Book Reviews. IEEE Circuits Devices Mag. 2005, 15, 65. [Google Scholar] [CrossRef]
- Blackshire, J.L.; Cooney, A. Evaluation and improvement in sensor performance and durability for structural health monitoring systems. Adv. Sens. Technol. Nondestruct. Eval. Struct. Heal. Monit. II 2006, 6179, 61790K. [Google Scholar] [CrossRef]
- Blackshire, J.L.; Cooney, A.T. Characterization of bonded piezoelectric sensor performance and durability in simulated aircraft environments. AIP Conf. Proc. 2006, 820 II, 1694–1701. [Google Scholar] [CrossRef]
- Blackshire, J.L.; Giurgiutiu, V.; Cooney, A.; Doane, J. Characterization of sensor performance and durability for structural health monitoring systems. Adv. Sens. Technol. Nondestruct. Eval. Struct Heal Monit. 2005, 5770, 66. [Google Scholar] [CrossRef]
- Lichtenwalner, P.F.; Dunne, J.P.; Becker, R.S.; Baumann, E.W. Active damage interrogation system for structural health monitoring. Smart Struct. Mater. 1997, 3044, 186. [Google Scholar] [CrossRef]
- Chaudhry, Z.; Fredric, L.; Ganino, A.; Rogers, C.A. Monitoring the integrity of composite patch structural repair via piezoelectric actuators/sensors. In Proceedings of the 36th Structures, Structural Dynamics and Materials Conference, New Orleans, LA, USA, 10–13 April 1995; Volume 4, pp. 2243–2248. [Google Scholar]
- Badcock, R.A.; Birt, E.A. The use of 0-3 piezocomposite embedded Lamb wave sensors for damage detection in advanced fibre composites. In Proceedings of the 4th ESSM and 2nd MIMR Conference, Harrogate, UK, 6–8 July 1998; pp. 373–380. [Google Scholar]
- Koh, Y.L.; Rajic, N.; Chiu, W.K.; Galea, S. Smart structure for composite repair. Compos. Struct. 1999, 47, 745–752. [Google Scholar] [CrossRef]
- Bhuiyan, Y.; Lin, B.; Giurgiutiu, V. Characterization of piezoelectric wafer active sensor for acoustic emission sensing. Ultrasonics 2018. [Google Scholar] [CrossRef]
- Ghajari, M.; Aliabadi, M.H. Impact damage detection in composite plates using a self-diagnostic electro-mechanical impedance-based structural health monitoring system. J. Multiscale Model. 2015, 6, 1–23. [Google Scholar] [CrossRef]
- Peair, D.; Park, G.; Inman, D.J. Improving Accessibility of the Impedance-based structural health monitoring method. J. Intell. Mater. Syst. Struct. 2004, 15, 129–139. [Google Scholar] [CrossRef]
- Park, G.; Sohn, H.; Farrar, C.; Inman, D.J. Overview of piezoelectric impedance-based health monitoring and path forward. Shock Vib. Dig. 2003, 35, 451–463. [Google Scholar] [CrossRef]
- Lee, B.C.; Staszewski, W.J. Modeling of Lamb wave for damage detection in metallic structures: Part II. Wave interactions with damage. Smart Mater. Struct. 2003, 12, 815–824. [Google Scholar] [CrossRef]
- Giurgiutiu, V.; Zagrai, A.; Bao, J.J. Piezoelectric wafer embedded active sensors for aging aircraft structural health monitoring. Struct. Heal. Monit. 2002, 1, 41–61. [Google Scholar] [CrossRef]
- Park, G.; Farrar, C.R.; Di Scalea, F.L.; Coccia, S. Performance assessment and validation of piezoelectric active-sensors in structural health monitoring. Smart Mater. Struct. 2006, 15, 1673–1683. [Google Scholar] [CrossRef]
- Qing, X.P.; Chan, H.L.; Beard, S.J.; Ooi, T.K.; Marotta, S.A. Effect of adhesive on the performance of piezoelectric elements used to monitor structural health. Int. J. Adhes. Adhes. 2006, 26, 622–628. [Google Scholar] [CrossRef]
- Blackshire, J.L.; Martin, S.A.; Na, J.K. Disbonding effects on elastic wave generation and reception by bonded piezoelectric sensor systems. Sens. Syst. Networks Phenomena Technol. Appl. NDE Heal. Monit. 2007, 6530, 65300L. [Google Scholar] [CrossRef]
- Lanzara, G.; Yoon, Y.; Kim, Y.; Chang, F.K. Influence of interface degradation on the performance of piezoelectric actuators. J. Intell. Mater. Syst. Struct. 2009, 20, 1699–16710. [Google Scholar] [CrossRef]
- Worlton, D.C. Experimental confirmation of Lamb waves at megacycle frequencies. J. Appl. Phys. 1961, 32, 967–971. [Google Scholar] [CrossRef]
- Monkhouse, R.S.C.; Wilcox, P.D.; Cawley, P. Flexible interdigital PVDF transducers for the generation of Lamb waves in structures. Ultrasonics 1997, 35, 489–498. [Google Scholar] [CrossRef]
- Wilcox, P.D. Mode and Transducer Selection for Long Range Lamb Wave Inspection. Key Eng. Mater. 2001, 168, 152–161. [Google Scholar] [CrossRef]
- Zhou, C.; Su, Z.; Cheng, L. Quantitative evaluation of orientation-specific damage using elastic waves and probability-based diagnostic imaging. Mech. Syst. Signal Process. 2011, 25, 2135–2156. [Google Scholar] [CrossRef]
- Yang, J.; He, J.; Guan, X.; Wang, D.; Chen, H. A probabilistic crack size quantification method using in-situ Lamb wave test and Bayesian updating. Mech. Syst. Signal Process. 2016, 78, 118–133. [Google Scholar] [CrossRef]
- Rugina, C.; Enciu, D.; Tudose, M. Numerical and experimental study of circular disc electromechanical impedance spectroscopy signature changes due to structural damage and sensor degradation. Struct. Health Monit. Int. J. 2015, 14, 663–681. [Google Scholar] [CrossRef]
- Giurgiutiu, V.; Postolache, C.; Tudose, M. Radiation, temperature, and vacuum effects on piezoelectric wafer active sensors. Smart Mater. Struct. 2016, 25, 3. [Google Scholar] [CrossRef]
- Quaegebeur, N.; Ostiguy, P.C.; Masson, P. Correlation-based imaging technique for fatigue monitoring of riveted lap-joint structure. Smart Mater. Struct. 2014, 23. [Google Scholar] [CrossRef]
- Lin, X.; Yuan, F.G. Diagnostic Lamb waves in an integrated piezoelectric sensor/actuator plate: analytical and experimental studies. Smart Mater. Struct. Diagnostic 2001, 907, 907–913. [Google Scholar] [CrossRef]
- Lemistre, M.; Balageas, D. Structural health monitoring system based on diffracted Lamb wave analysis by multiresolution processing. Smart Mater. Struct. 2001, 10, 504–511. [Google Scholar] [CrossRef]
- Roth, W.; Giurgiutiu, V. Structural health monitoring of an adhesive disbond through electromechanical impedance spectroscopy. Int. J. Adhes. Adhes. 2017, 73, 109–117. [Google Scholar] [CrossRef]


| Debonding Area (Percentage, %) | 10 | 20 | 30 | 35 | 40 | 45 | 50 | 60 | 70 |
|---|---|---|---|---|---|---|---|---|---|
| Ɵi (°) | 93.6 | 120.6 | 142.2 | 153 | 162 | 171 | 180 | 198 | 217.8 |
| Debonding area (mm2) | 11.31 | 22.62 | 33.93 | 39.58 | 45.24 | 50.89 | 56.55 | 67.86 | 79.17 |
| Material | Material | Tensile Strength (MPa) | Modulus of Elasticity (MPa) |
|---|---|---|---|
| 2024-T3 aluminuium alloy | ≥245 | ≥390 | 72,000 |
| Product number | SMD12T06R412WL |
| Material | SM412 |
| Dimensions | 12 mm x 0.6 mm |
| Resonant frequency | 3.4 MHz ± 5% |
| Resonant impedance | ≤6 Ω |
| Static capacitance | 2.5 nF ± 30% |
| Test Condition | 25 ± 3 °C; 40~70% R.H (Relative Humidity) |
| Model Numbers | Glass Transition Temperature (°C) | Bending Strength (MPa) | Flexural Modulus (MPa) | Floating Roll Peeling Test (N/mm) |
|---|---|---|---|---|
| AW106/HV9533U | 45 | 60.4 | 1904.1 | 5 |
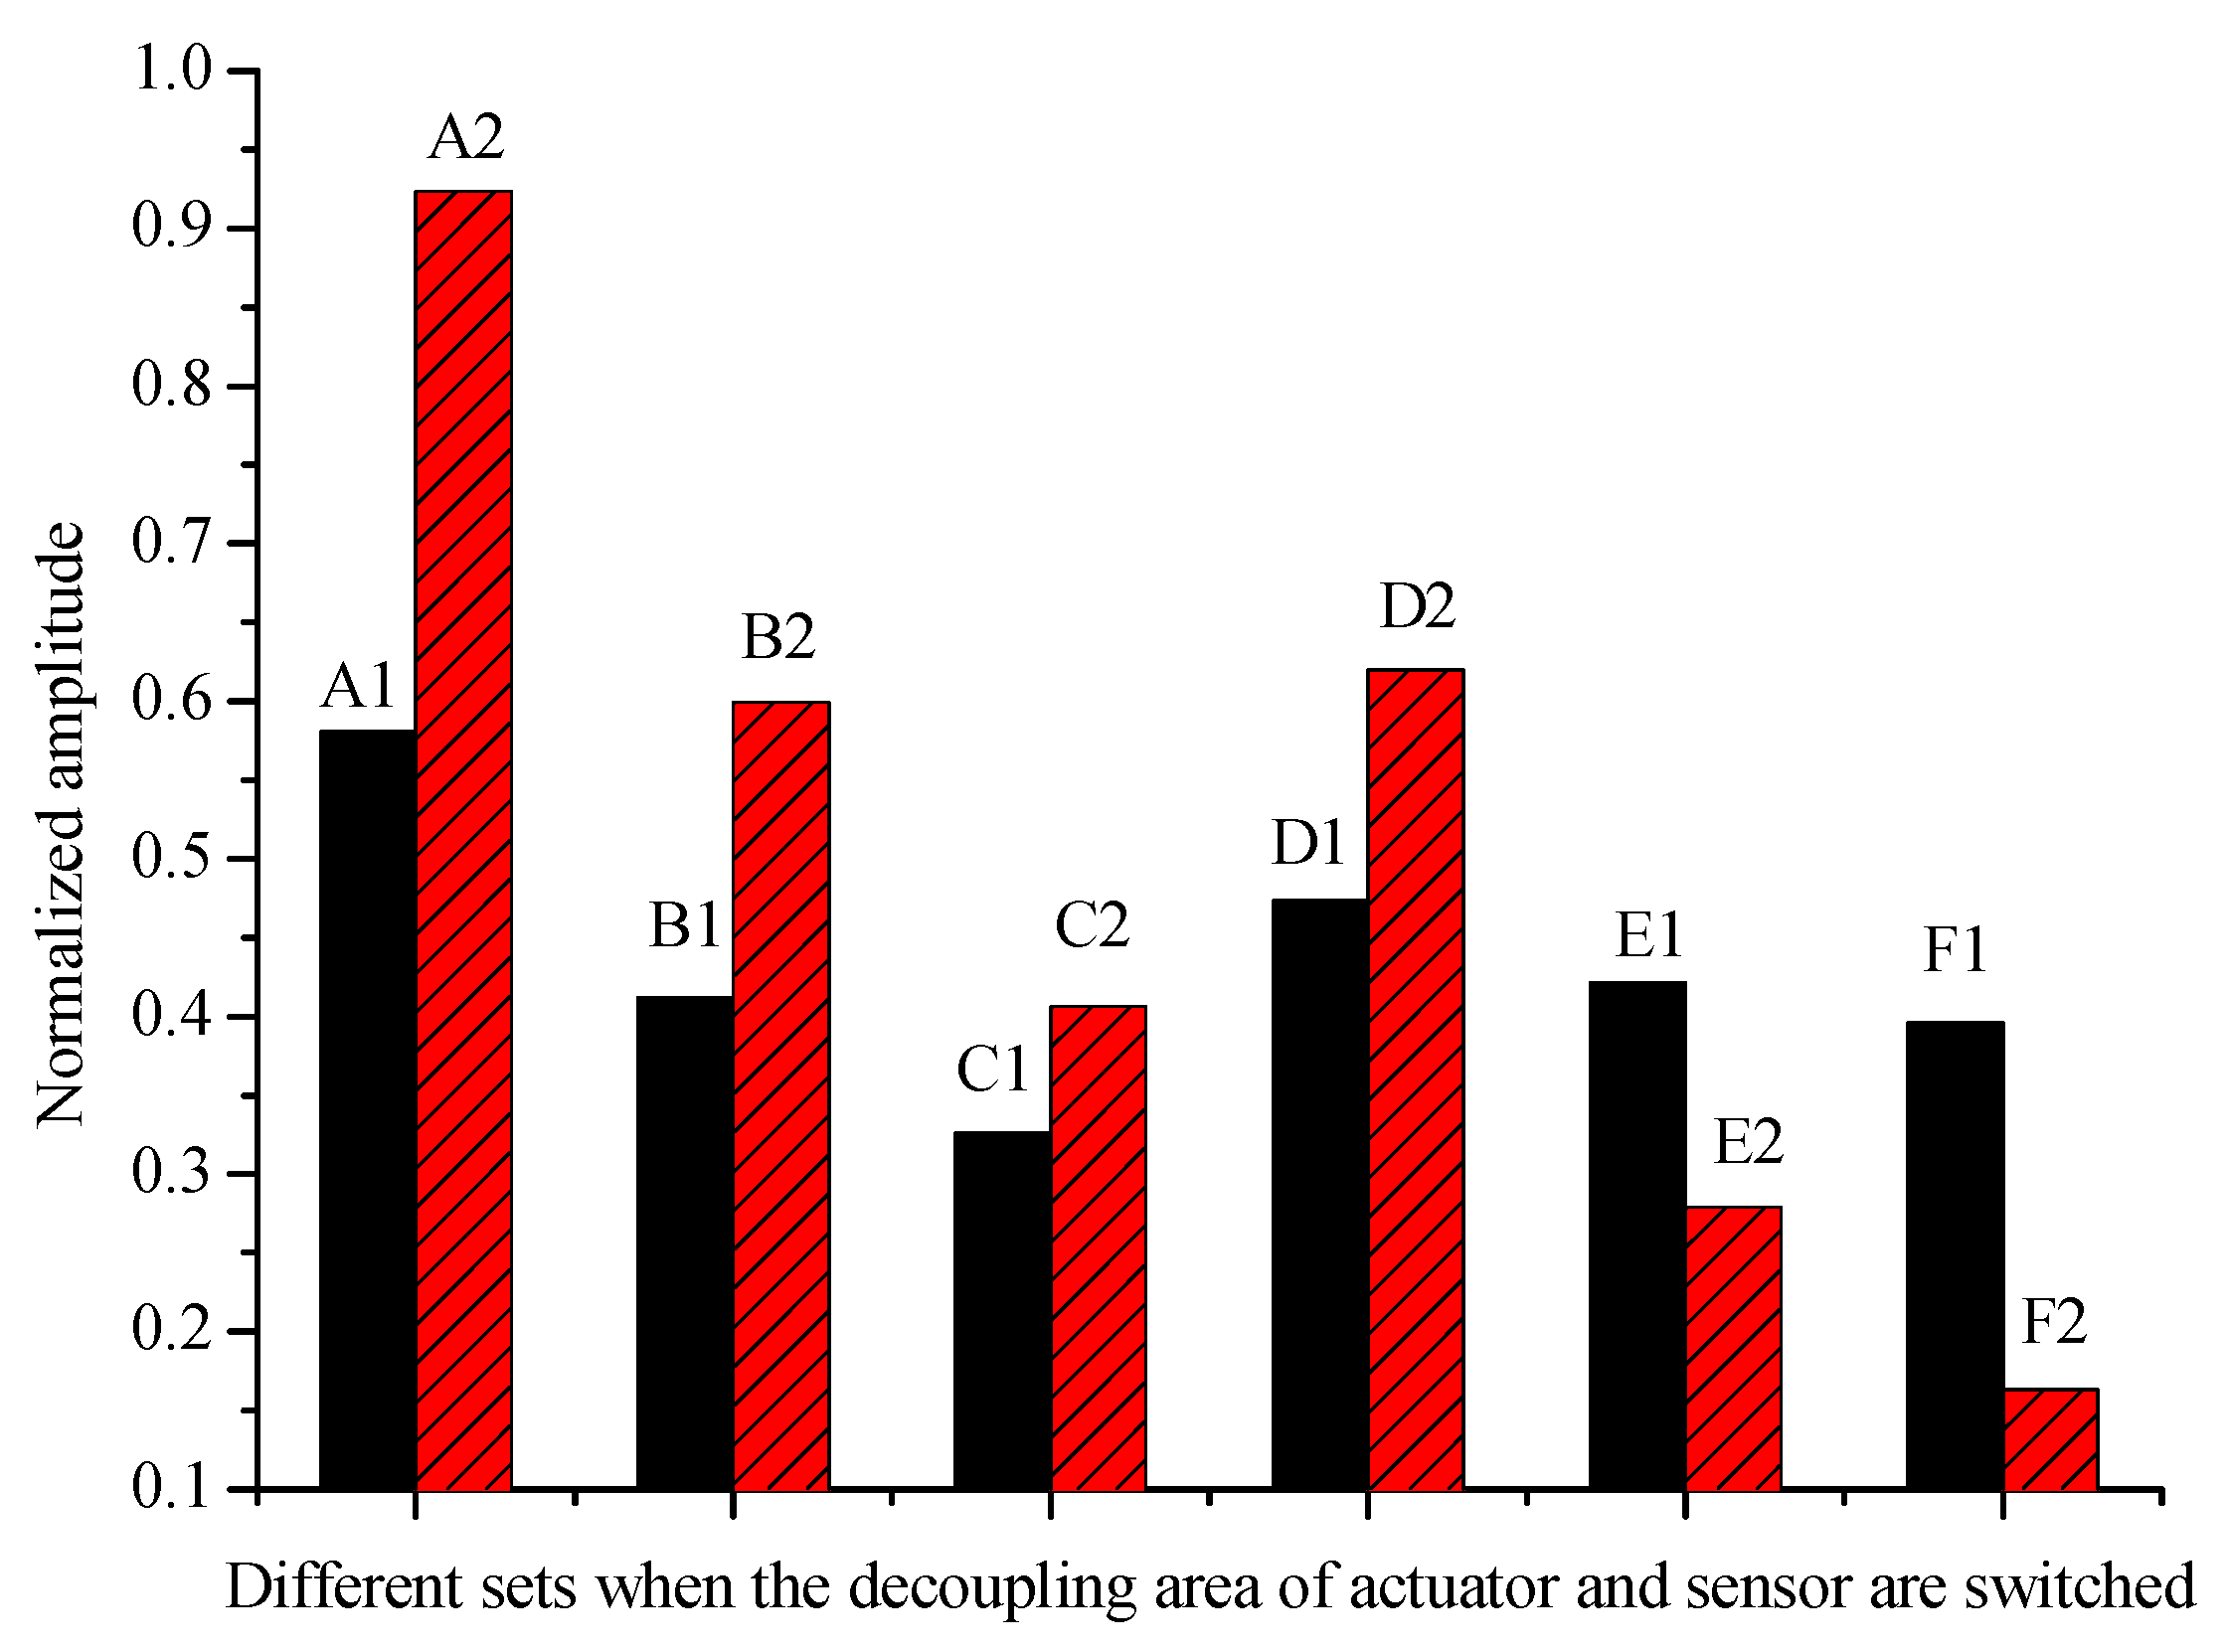
| Group | Debonding Area of Actuator/Debonding Area of Sensor |
|---|---|
| A1 | 20%/0% |
| A2 | 0%/20% |
| B1 | 40%/0% |
| B2 | 0%/40% |
| C1 | 40%/20% |
| C2 | 20%/40% |
| D1 | 60%/0% |
| D2 | 0%/60% |
| E1 | 60%/20% |
| E2 | 20%/60% |
| F1 | 60%/40% |
| F2 | 40%/60% |
| Freq. (kHz) | 50 | 60 | 70 | |
|---|---|---|---|---|
| Debonding Area (%) | ||||
| 0 | 1 | 1.0752 | 1.09156 | |
| 10 | 0.86187 | 0.77144 | 0.75658 | |
| 20 | 0.58094 | 0.76084 | 0.9537 | |
| 30 | 0.43975 | 0.33556 | 0.5114 | |
| 35 | 0.35679 | 0.47518 | 0.63314 | |
| 40 | 0.41201 | 0.52282 | 0.52868 | |
| 45 | 0.41481 | 0.54834 | 0.66513 | |
| 50 | 0.44436 | 0.59944 | 0.60057 | |
| 60 | 0.47364 | 0.6082 | 0.6754 | |
| 70 | 0.43308 | 0.62191 | 0.85644 | |
© 2019 by the authors. Licensee MDPI, Basel, Switzerland. This article is an open access article distributed under the terms and conditions of the Creative Commons Attribution (CC BY) license (http://creativecommons.org/licenses/by/4.0/).
Share and Cite
Liu, X.; Xu, Y.; Li, N.; Wang, X.; Zhang, W. Effect of Adhesive Debonding on the Performance of Piezoelectric Sensors in Structural Health Monitoring Systems. Sensors 2019, 19, 5070. https://doi.org/10.3390/s19235070
Liu X, Xu Y, Li N, Wang X, Zhang W. Effect of Adhesive Debonding on the Performance of Piezoelectric Sensors in Structural Health Monitoring Systems. Sensors. 2019; 19(23):5070. https://doi.org/10.3390/s19235070
Chicago/Turabian StyleLiu, Xuerong, Yuanming Xu, Ning Li, Xiangyu Wang, and Weifang Zhang. 2019. "Effect of Adhesive Debonding on the Performance of Piezoelectric Sensors in Structural Health Monitoring Systems" Sensors 19, no. 23: 5070. https://doi.org/10.3390/s19235070
APA StyleLiu, X., Xu, Y., Li, N., Wang, X., & Zhang, W. (2019). Effect of Adhesive Debonding on the Performance of Piezoelectric Sensors in Structural Health Monitoring Systems. Sensors, 19(23), 5070. https://doi.org/10.3390/s19235070