Combination of an Axicon Fiber Tip and a Camera Device into a Sensitive Refractive Index Sensor


Abstract
1. Introduction
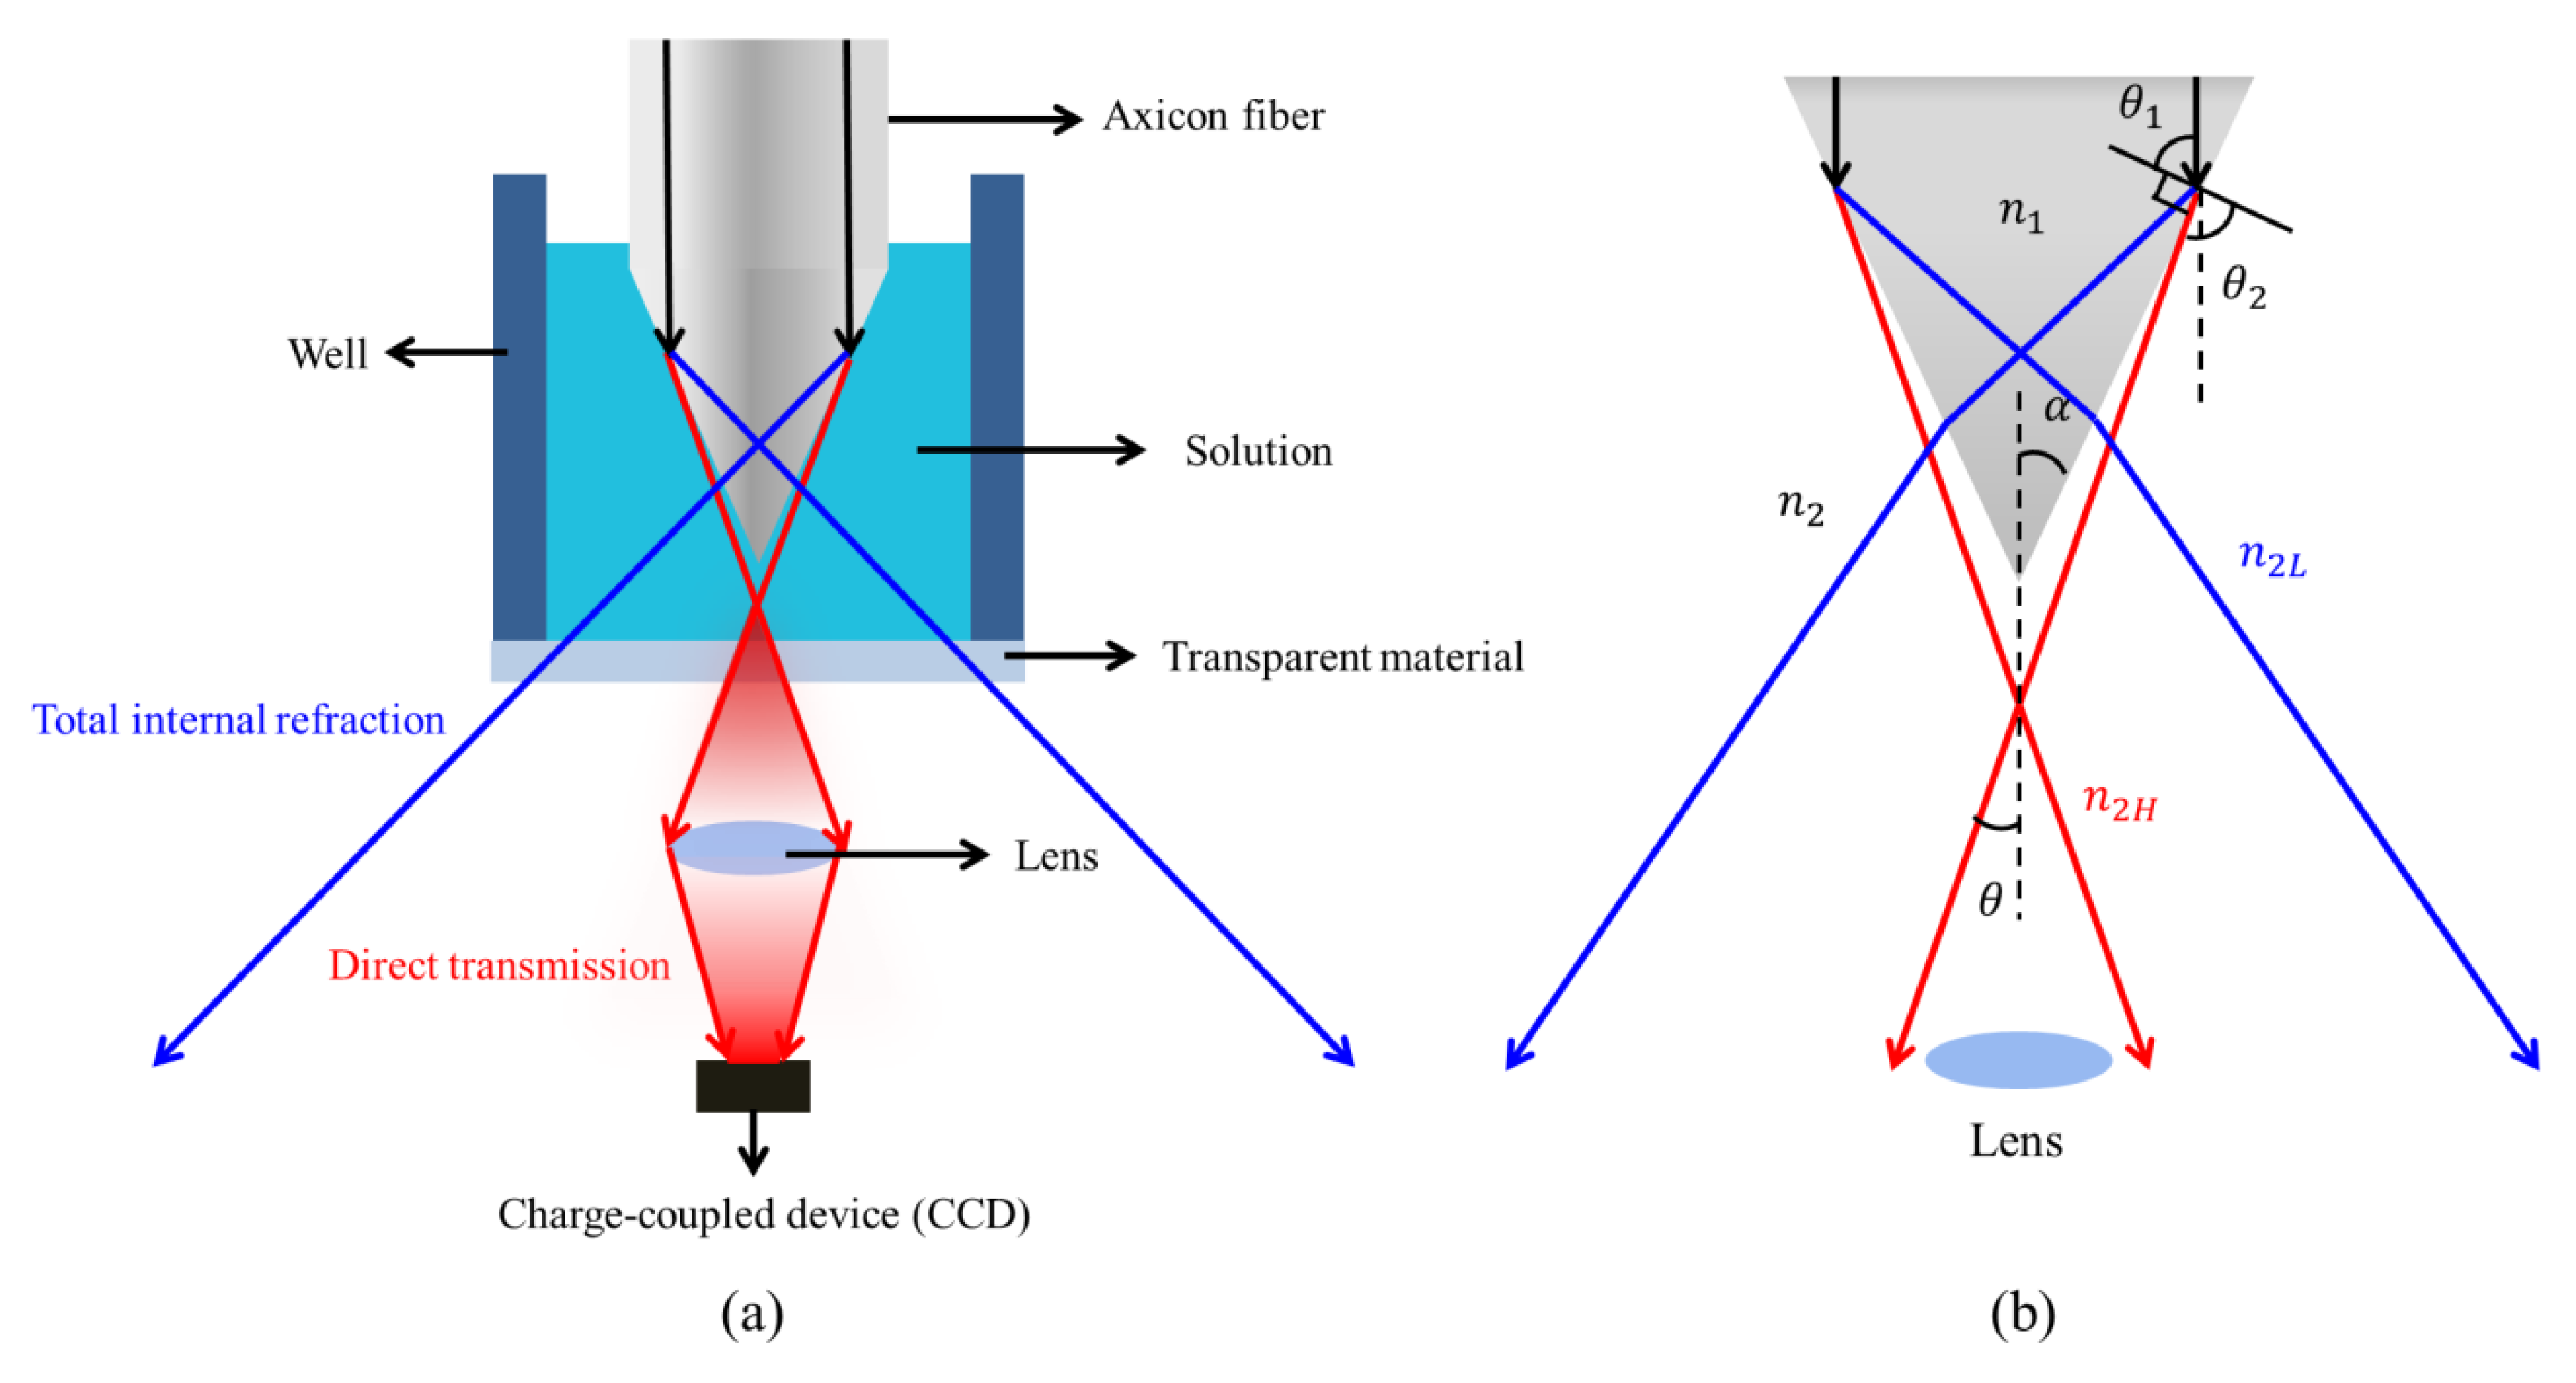
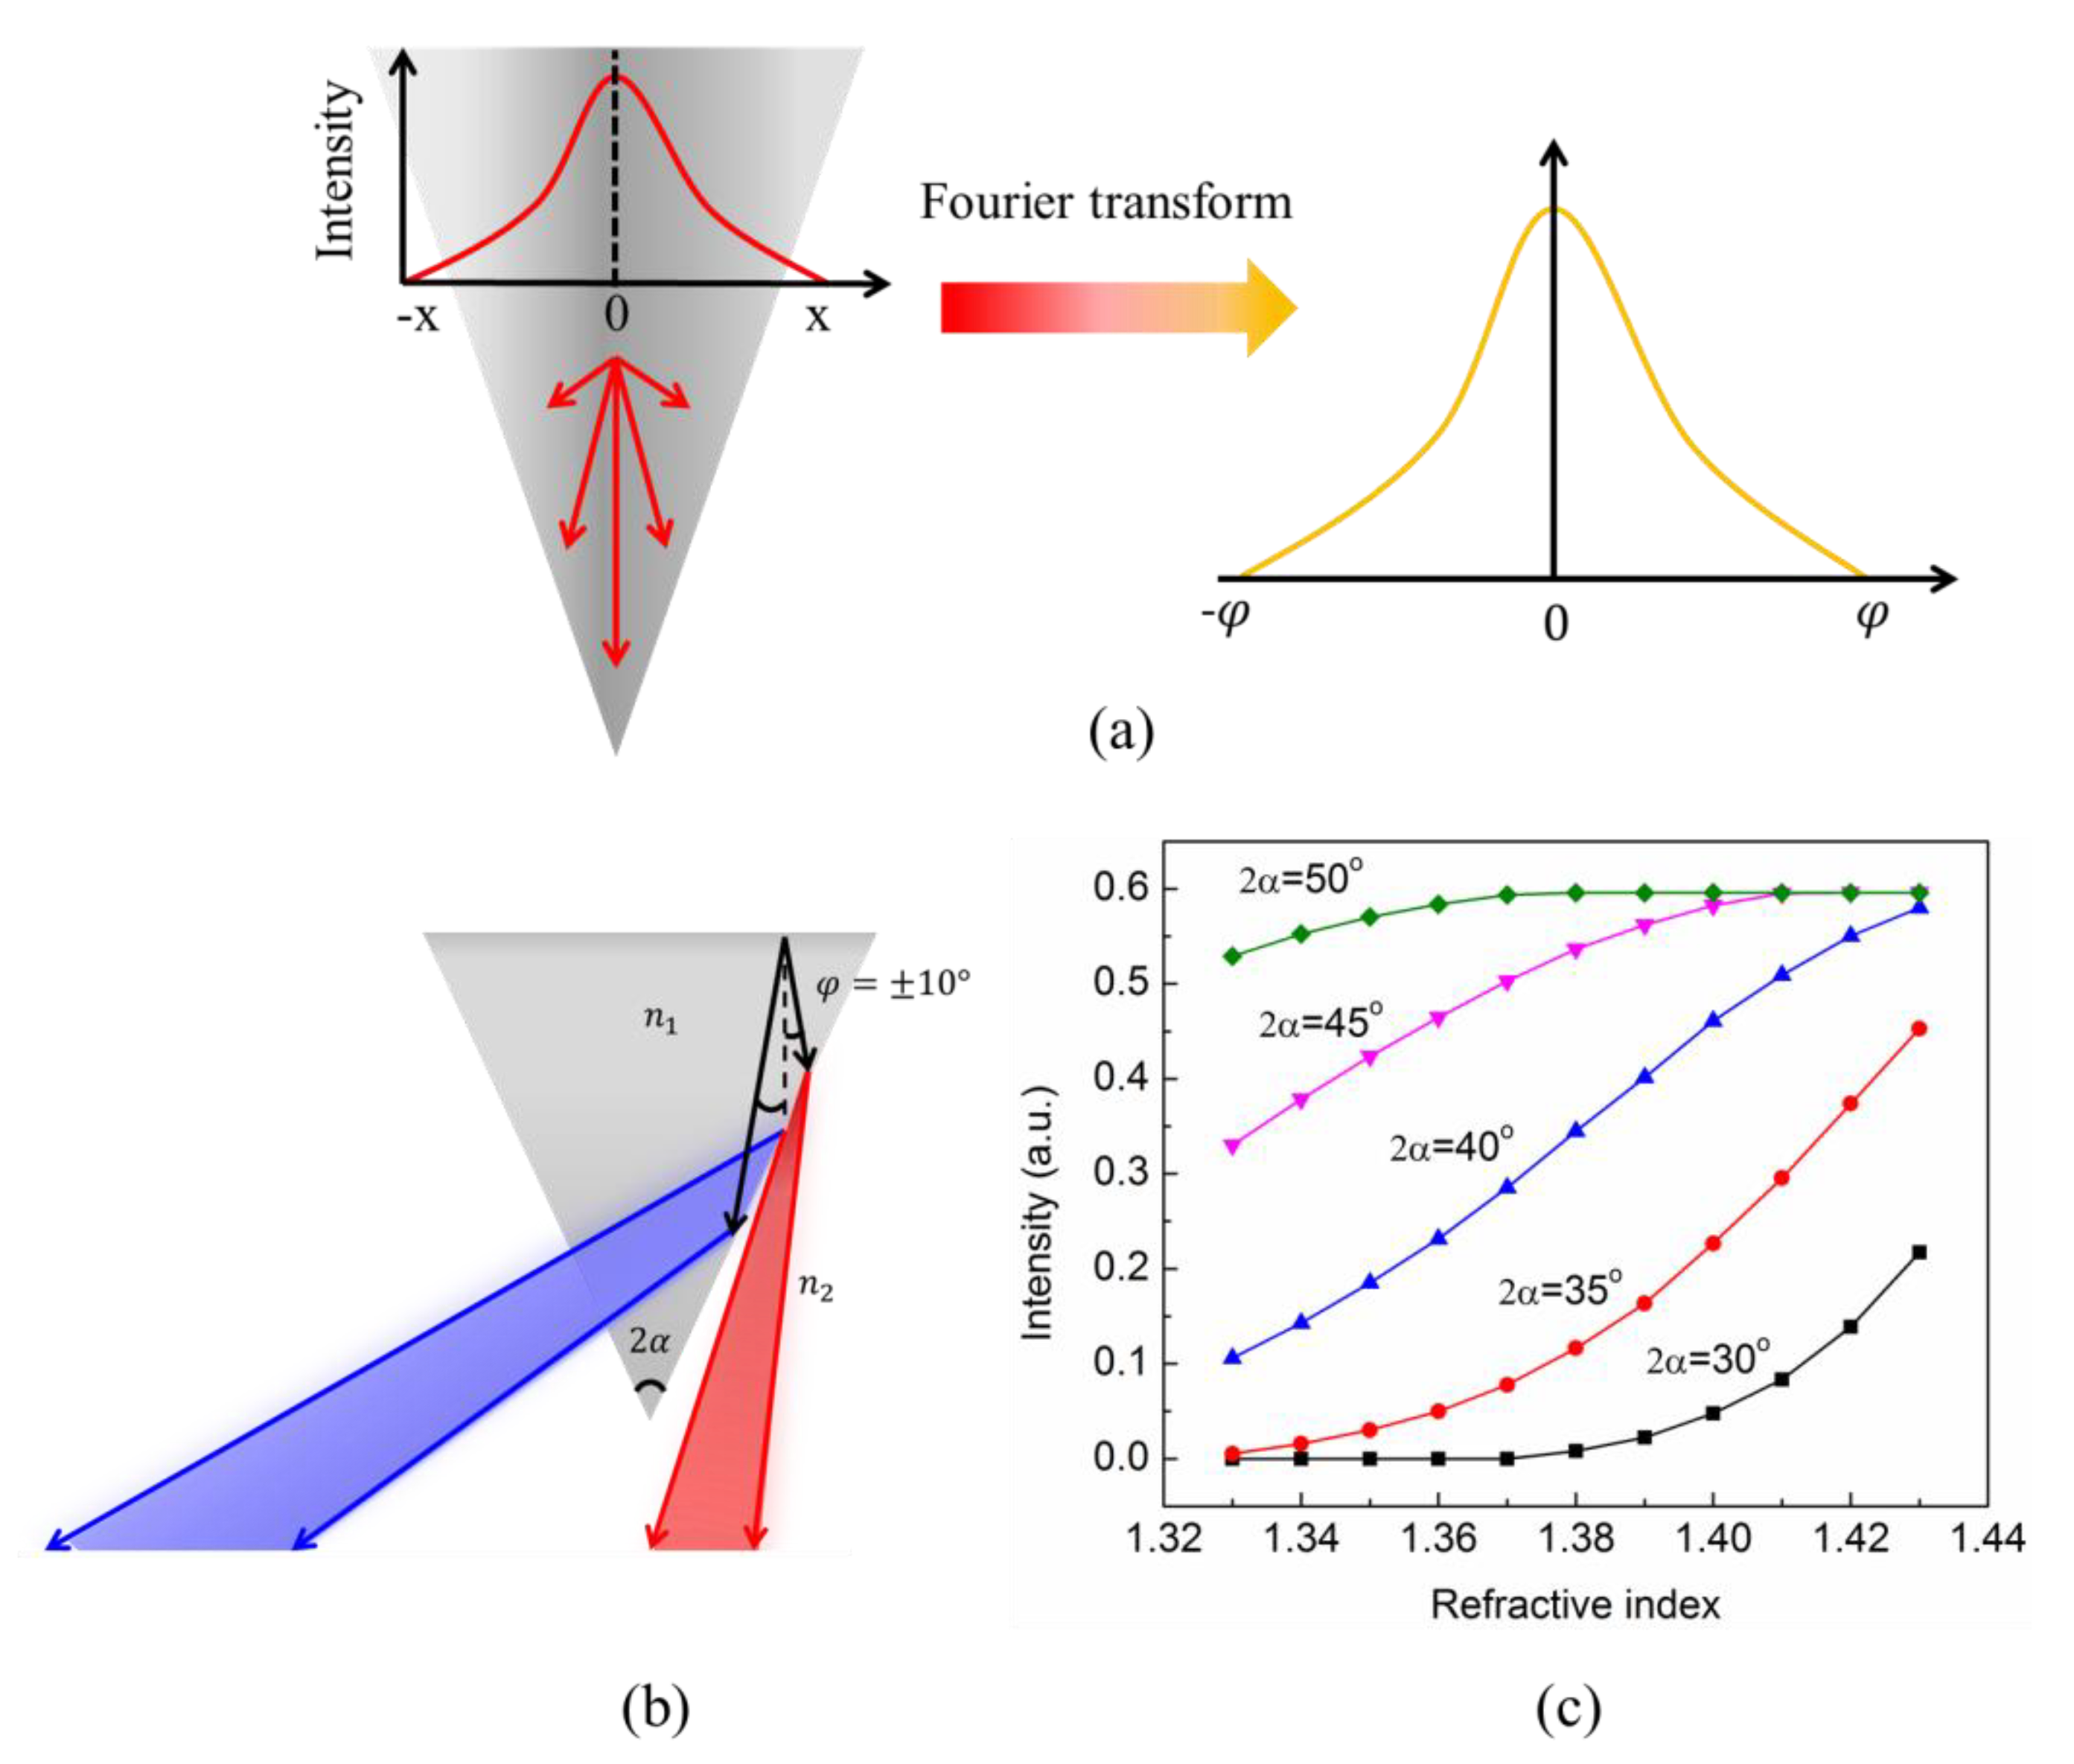
2. Theory
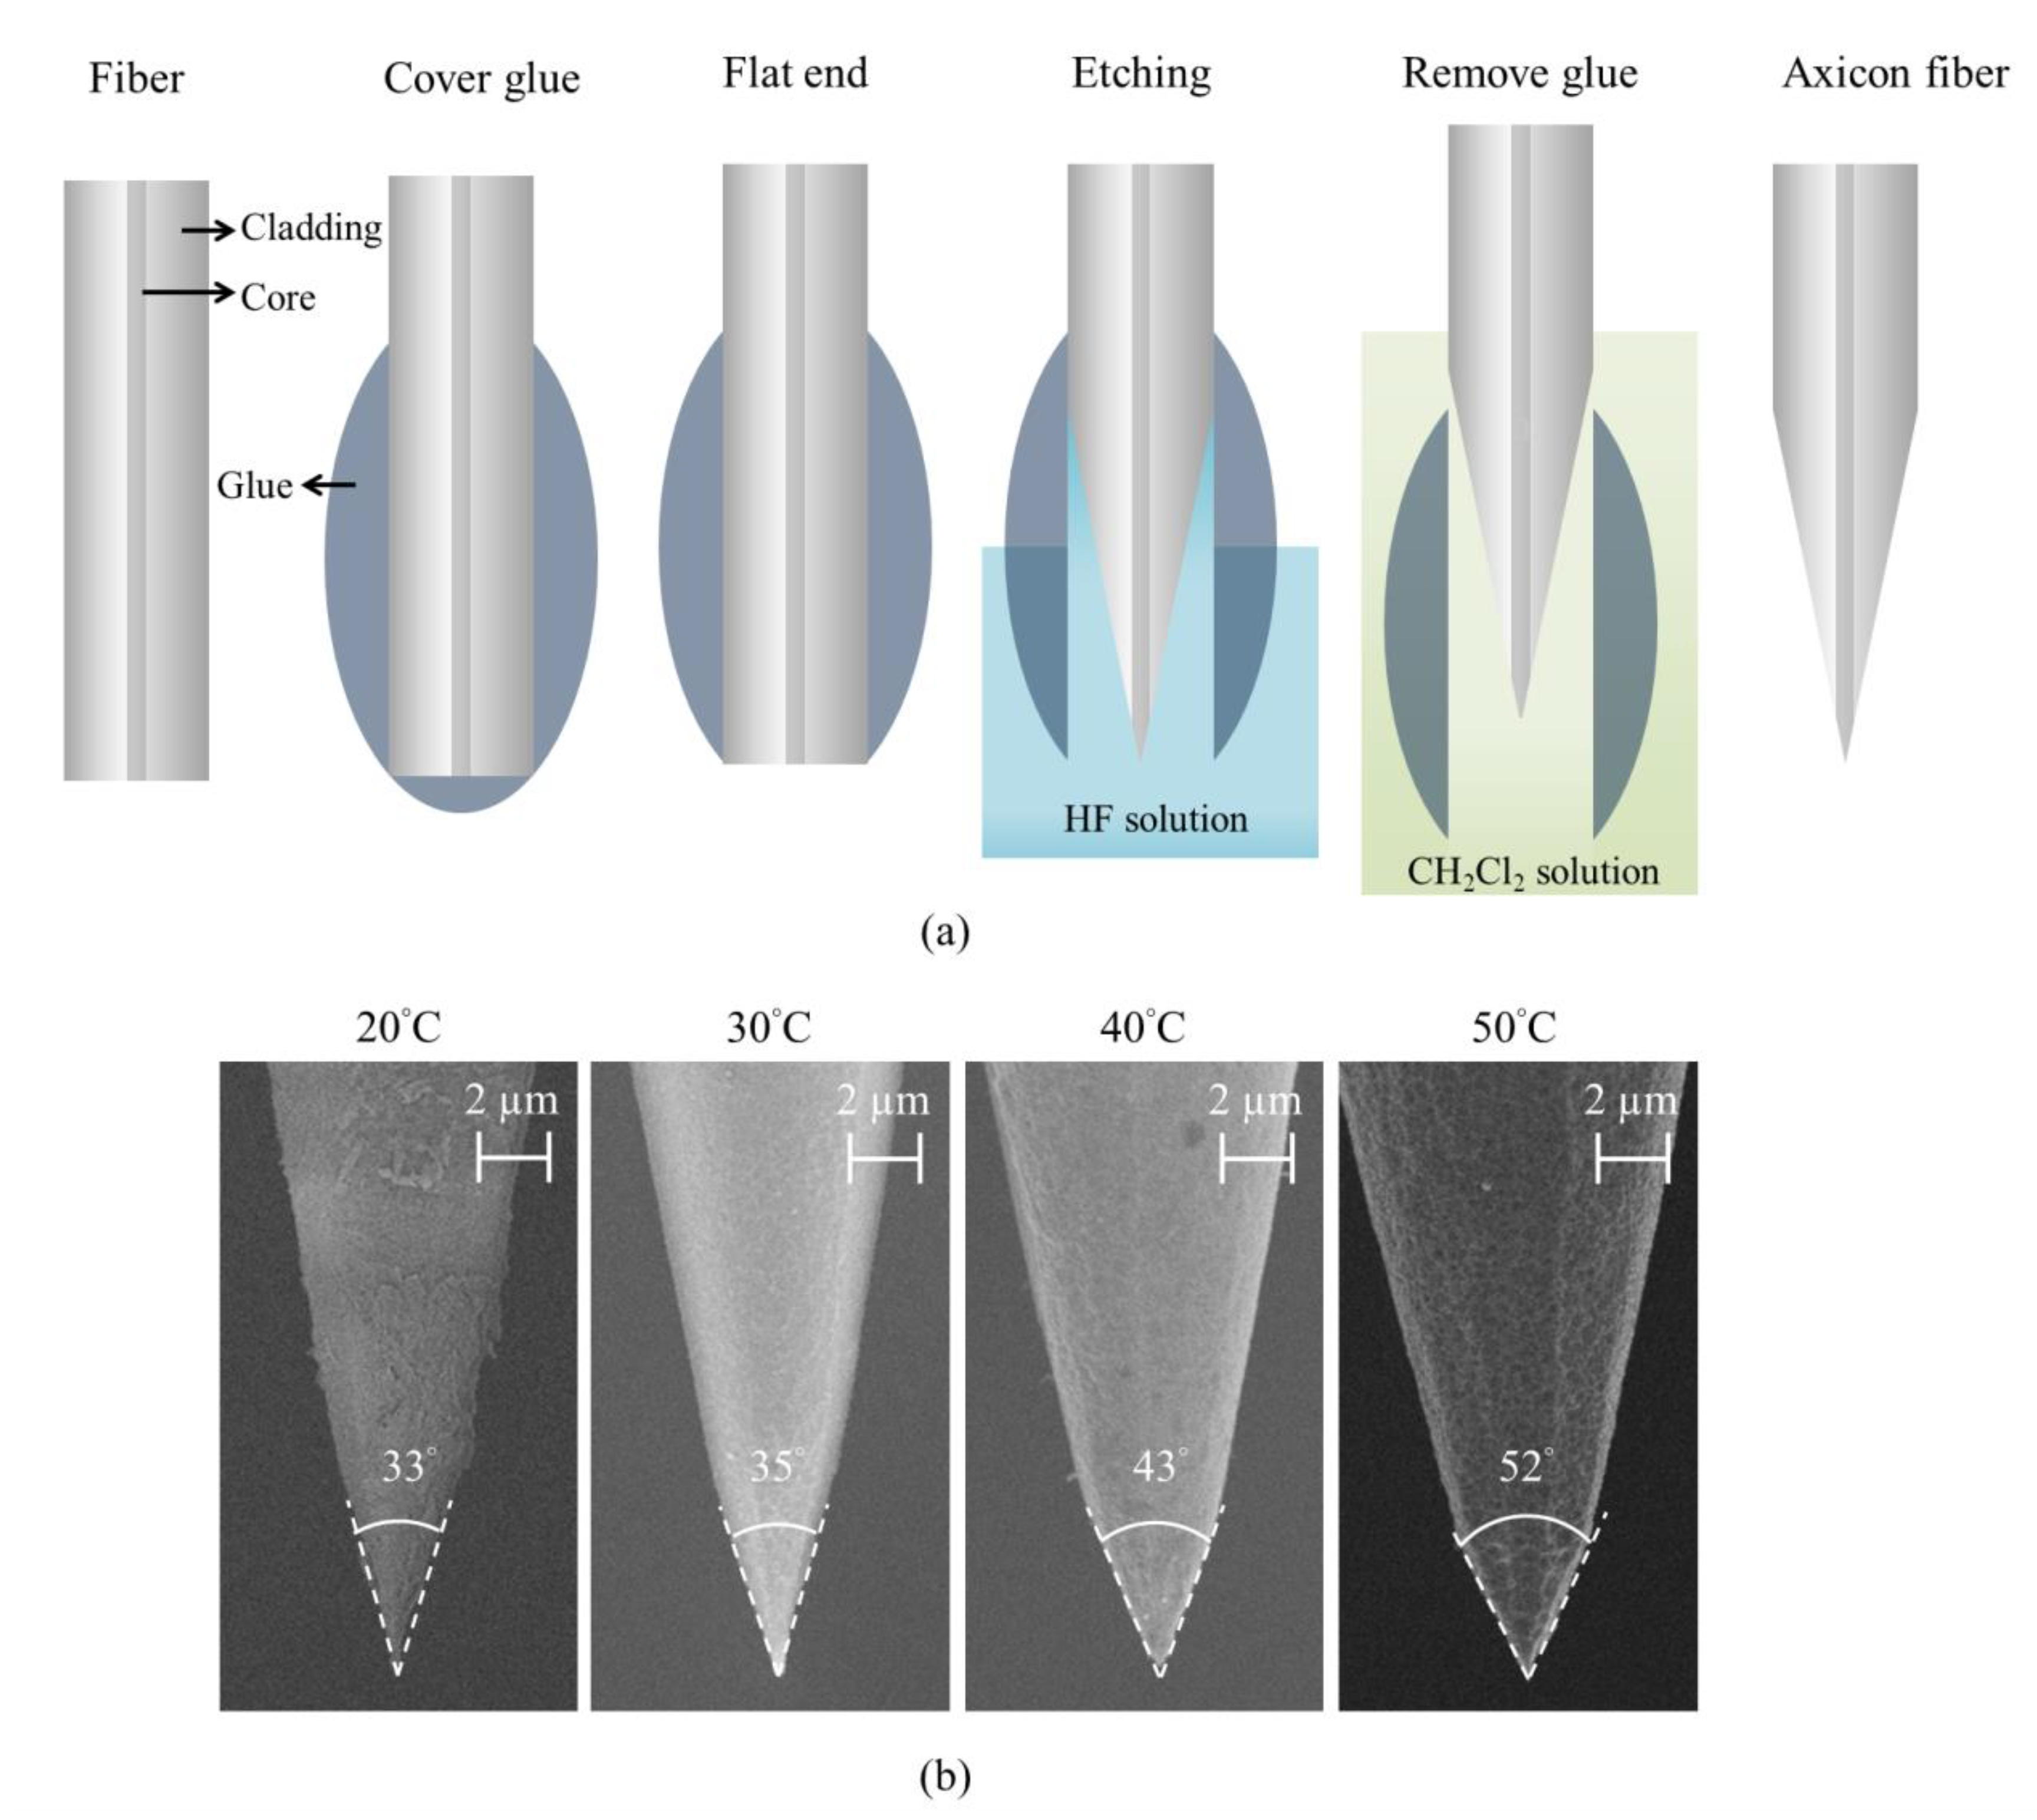
3. Fabrication
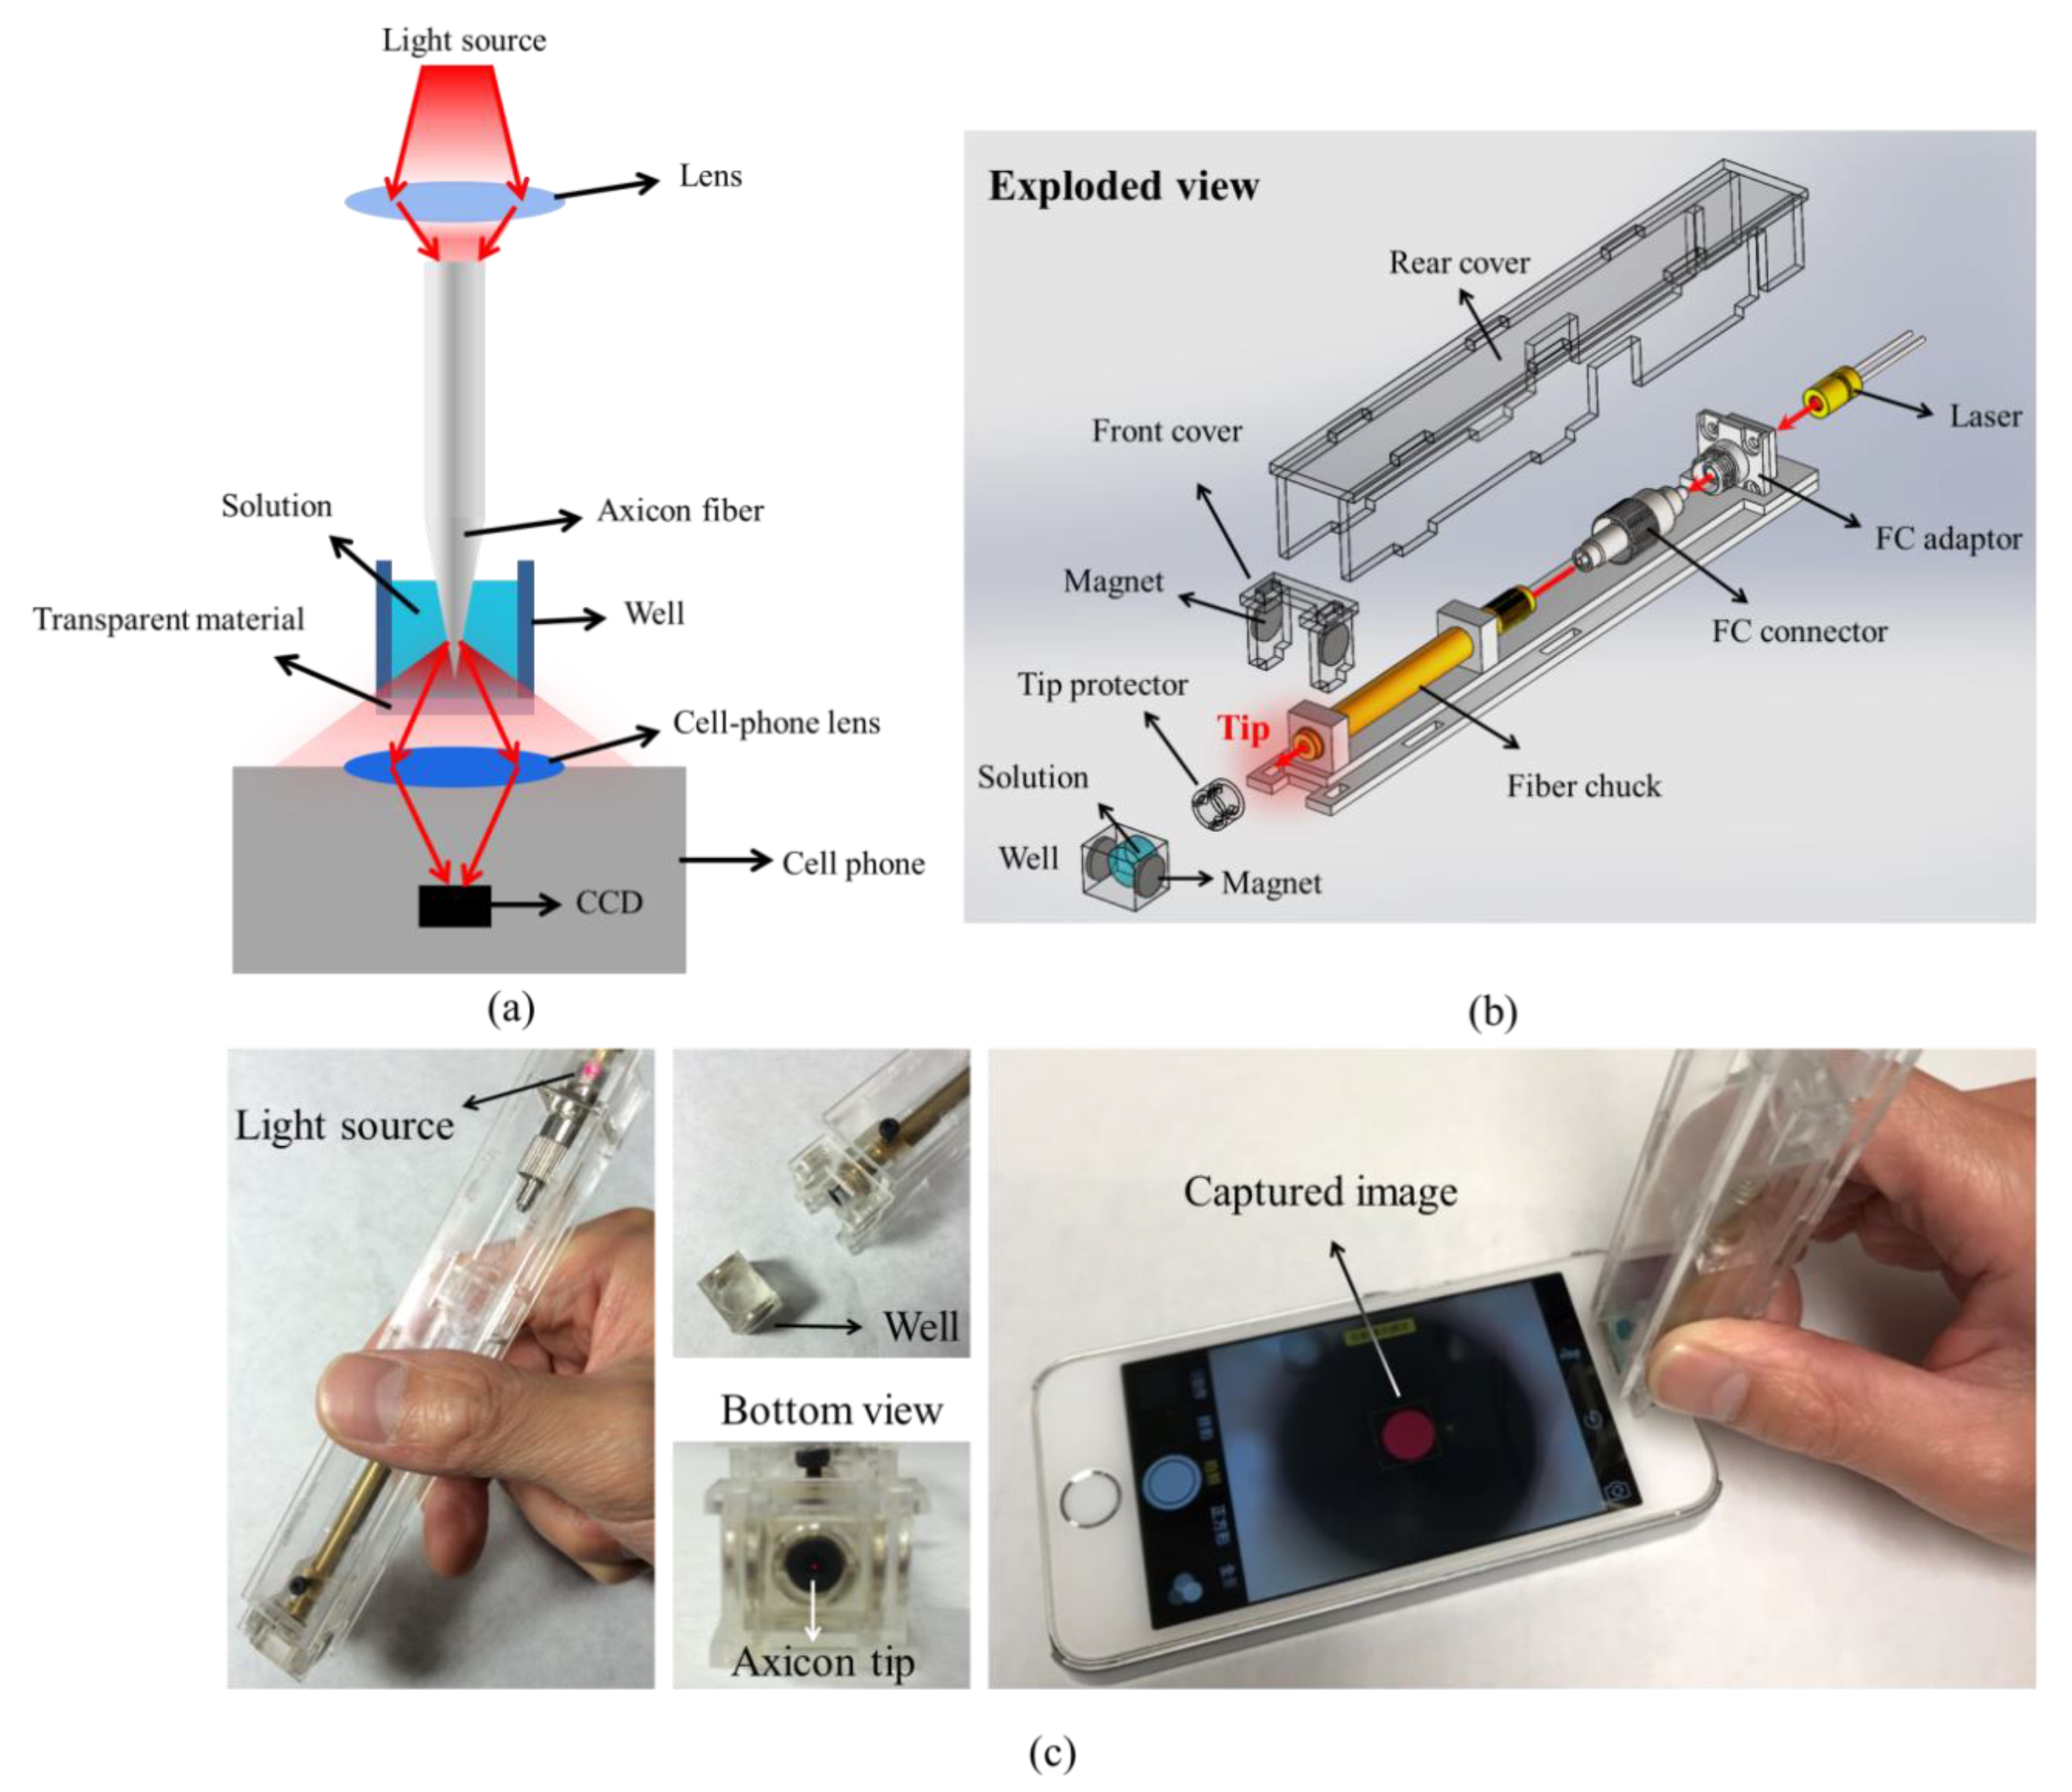
4. Setup
5. Results and Analysis
6. Conclusions
Author Contributions
Funding
Conflicts of Interest
References
- Dongare, M.L.; Buchade, P.B.; Shaligram, A.D. Refractive index based optical Brix measurement technique with equilateral angle prism for sugar and Allied Industries. Optik 2015, 126, 2383–2385. [Google Scholar] [CrossRef]
- Chadha, V.; Garg, U.; Alon, U.S. Measurement of urinary concentration: A critical appraisal of methodologies. Pediatr. Nephrol. 2001, 16, 374–382. [Google Scholar] [CrossRef] [PubMed]
- George, J.W. The usefulness and limitations of hand-held refractometers in veterinary laboratory medicine: An historical and technical review. Vet. Clin. Pathol. 2001, 30, 201–210. [Google Scholar] [CrossRef] [PubMed]
- Falciai, R.; Mignani, A.G.; Vannini, A. Long period gratings as solution concentration sensors. Sens. Actuat. B-Chem. 2001, 74, 74–77. [Google Scholar] [CrossRef]
- Rheims, J.; Koser, J.; Wriedt, T. Refractive-index measurements in the near-IR using an Abbe refractometer. Meas. Sci. Technol. 1997, 8, 601–605. [Google Scholar] [CrossRef]
- Wang, P.F.; Brambilla, G.; Ding, M.; Semenova, Y.; Wu, Q.; Farrell, G. Investigation of single-mode-multimode-single-mode and single-mode-tapered-multimode-single-mode fiber structures and their application for refractive index sensing. J. Opt. Soc. Am. B Opt. Phys. 2011, 28, 1180–1186. [Google Scholar] [CrossRef]
- Liu, D.J.; Mallik, A.K.; Yuan, J.H.; Yu, C.X.; Farrell, G.; Semenova, Y.; Wu, Q. High sensitivity refractive index sensor based on a tapered small core single-mode fiber structure. Opt. Lett. 2015, 40, 4166–4169. [Google Scholar] [CrossRef] [PubMed]
- Renoirt, J.M.; Debliquy, M.; Albert, J.; Ianoul, A.; Caucheteur, C. Surface plasmon resonances in oriented silver nanowire coatings on optical fibers. J. Phys. Chem. C 2014, 118, 11035–11042. [Google Scholar] [CrossRef]
- Zubiate, P.; Zamarreno, C.R.; del Villar, I.; Matias, I.R.; Arregui, F.J. High sensitive refractometers based on lossy mode resonances (LMRs) supported by ITO coated D-shaped optical fibers. Opt. Express 2015, 23, 8045–8050. [Google Scholar] [CrossRef] [PubMed]
- Schroeder, K.; Ecke, W.; Mueller, R.; Willsch, R.; Andreev, A. A fibre Bragg grating refractometer. Meas. Sci. Technol. 2001, 12, 757–764. [Google Scholar] [CrossRef]
- Jiang, B.Q.; Zhou, K.M.; Wang, C.L.; Zhao, Y.H.; Zhao, J.L.; Zhang, L. Temperature-calibrated high-precision refractometer using a tilted fiber Bragg grating. Opt. Express 2017, 25, 25910–25918. [Google Scholar] [CrossRef] [PubMed]
- Aldabaa, A.L.; Gonzalez-Vila, A.; Debliquy, M.; Lopez-Amo, M.; Caucheteur, C.; Lahem, D. Polyaniline-coated tilted fiber Bragg gratings for pH sensing. Sens. Actuators B Chem. 2018, 254, 1087–1093. [Google Scholar] [CrossRef]
- Zibaii, M.I.; Latifi, H.; Karami, M.; Gholami, M.; Hosseini, S.M.; Ghezelayagh, M.H. Non-adiabatic tapered optical fiber sensor for measuring the interaction between α-amino acids in aqueous carbohydrate solution. Meas. Sci. Technol. 2010, 21, 105801. [Google Scholar] [CrossRef]
- Korposh, S.; James, S.W.; Lee, S.W.; Tatam, R.P. Tapered optical fibre sensors: Current trends and future perspectives. Sensors 2019, 19, 2294. [Google Scholar] [CrossRef] [PubMed]
- Wei, P.K.; Chen, Y.C.; Kuo, H.L. Systematic variation of polymer jacketed fibres and the effects on tip etching dynamics. J. Microsc. Oxf. 2003, 210, 334–339. [Google Scholar] [CrossRef] [PubMed]
- Tai, Y.H.; Lee, C.W.; Chang, D.M.; Lai, Y.S.; Huang, D.W.; Wei, P.K. Escherichia coil fiber sensors using concentrated dielectrophoretic force with optical defocusing method. ACS Sens. 2018, 3, 1196–1202. [Google Scholar] [CrossRef] [PubMed]


© 2019 by the authors. Licensee MDPI, Basel, Switzerland. This article is an open access article distributed under the terms and conditions of the Creative Commons Attribution (CC BY) license (http://creativecommons.org/licenses/by/4.0/).
Share and Cite
Tai, Y.-H.; Tsai, P.-C.; Ho, Y.-L.; Delaunay, J.-J.; Wei, P.-K. Combination of an Axicon Fiber Tip and a Camera Device into a Sensitive Refractive Index Sensor. Sensors 2019, 19, 4911. https://doi.org/10.3390/s19224911
Tai Y-H, Tsai P-C, Ho Y-L, Delaunay J-J, Wei P-K. Combination of an Axicon Fiber Tip and a Camera Device into a Sensitive Refractive Index Sensor. Sensors. 2019; 19(22):4911. https://doi.org/10.3390/s19224911
Chicago/Turabian StyleTai, Yi-Hsin, Po-Cheng Tsai, Ya-Lun Ho, Jean-Jacques Delaunay, and Pei-Kuen Wei. 2019. "Combination of an Axicon Fiber Tip and a Camera Device into a Sensitive Refractive Index Sensor" Sensors 19, no. 22: 4911. https://doi.org/10.3390/s19224911
APA StyleTai, Y.-H., Tsai, P.-C., Ho, Y.-L., Delaunay, J.-J., & Wei, P.-K. (2019). Combination of an Axicon Fiber Tip and a Camera Device into a Sensitive Refractive Index Sensor. Sensors, 19(22), 4911. https://doi.org/10.3390/s19224911