An ISE-based On-Site Soil Nitrate Nitrogen Detection System

Abstract
:1. Introduction
2. Materials and Methods
2.1. Reagents and Apparatus
2.2. Sensor Fusion Model
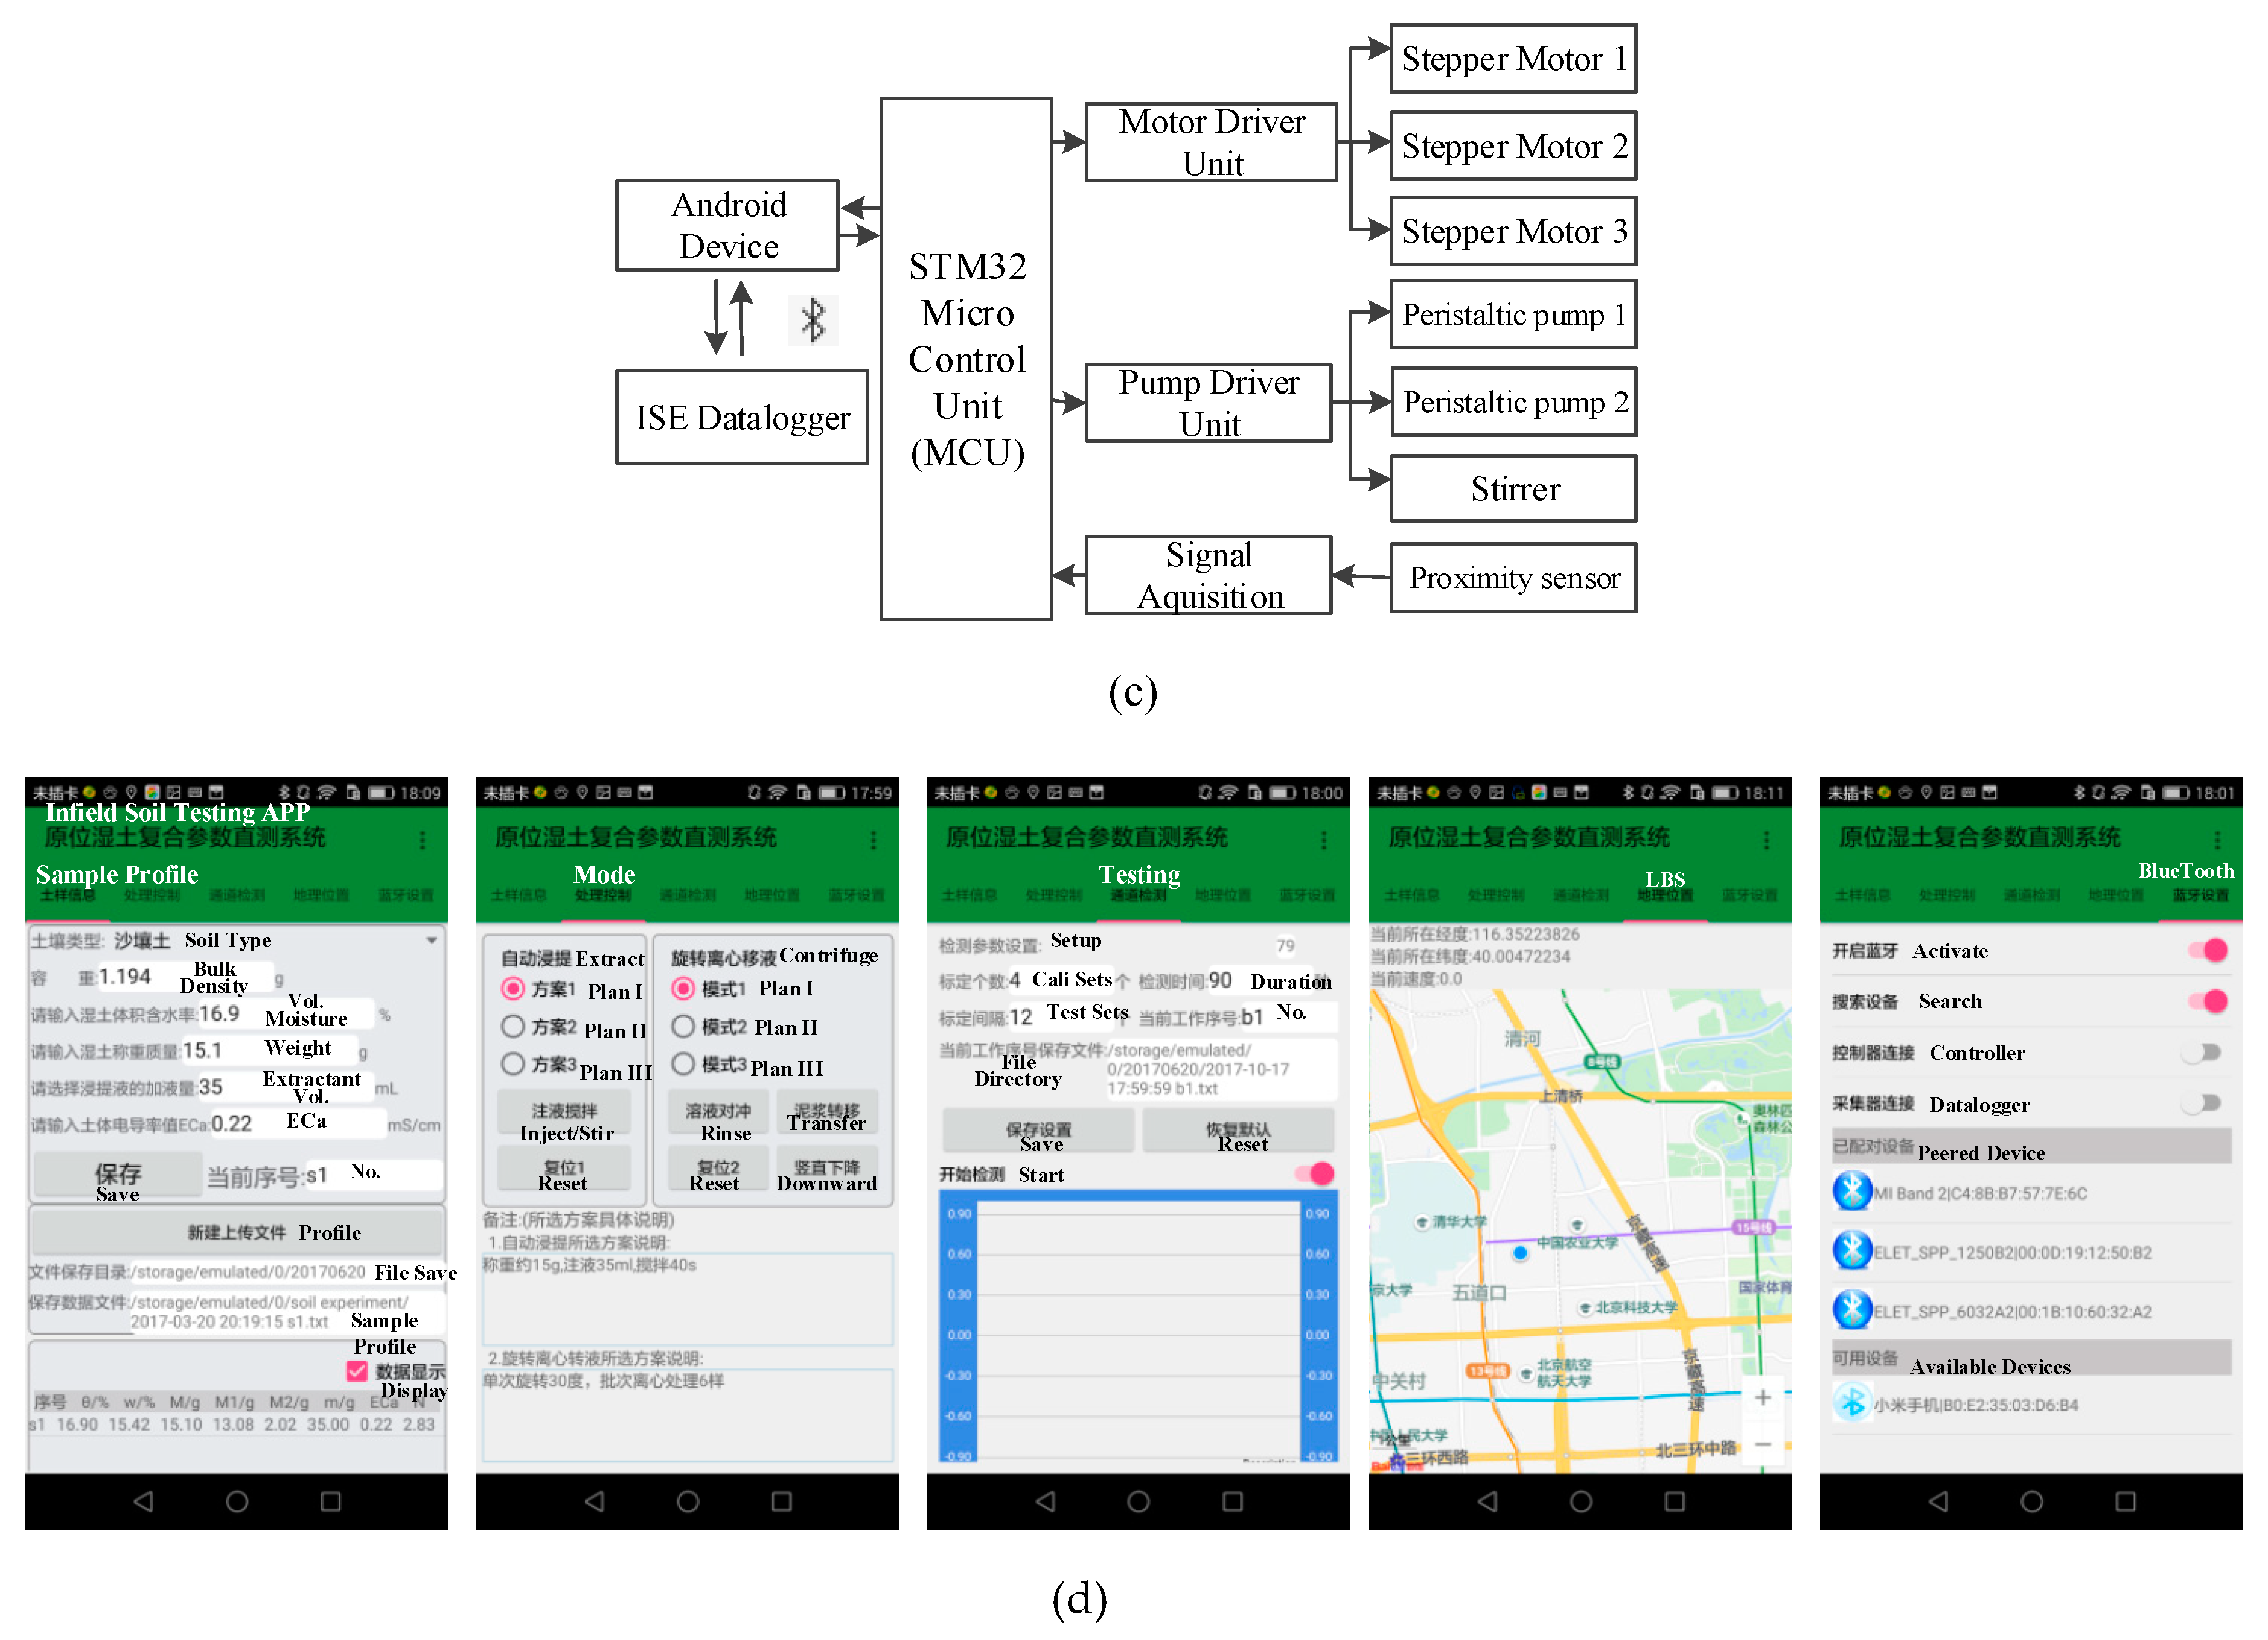
2.3. System Design
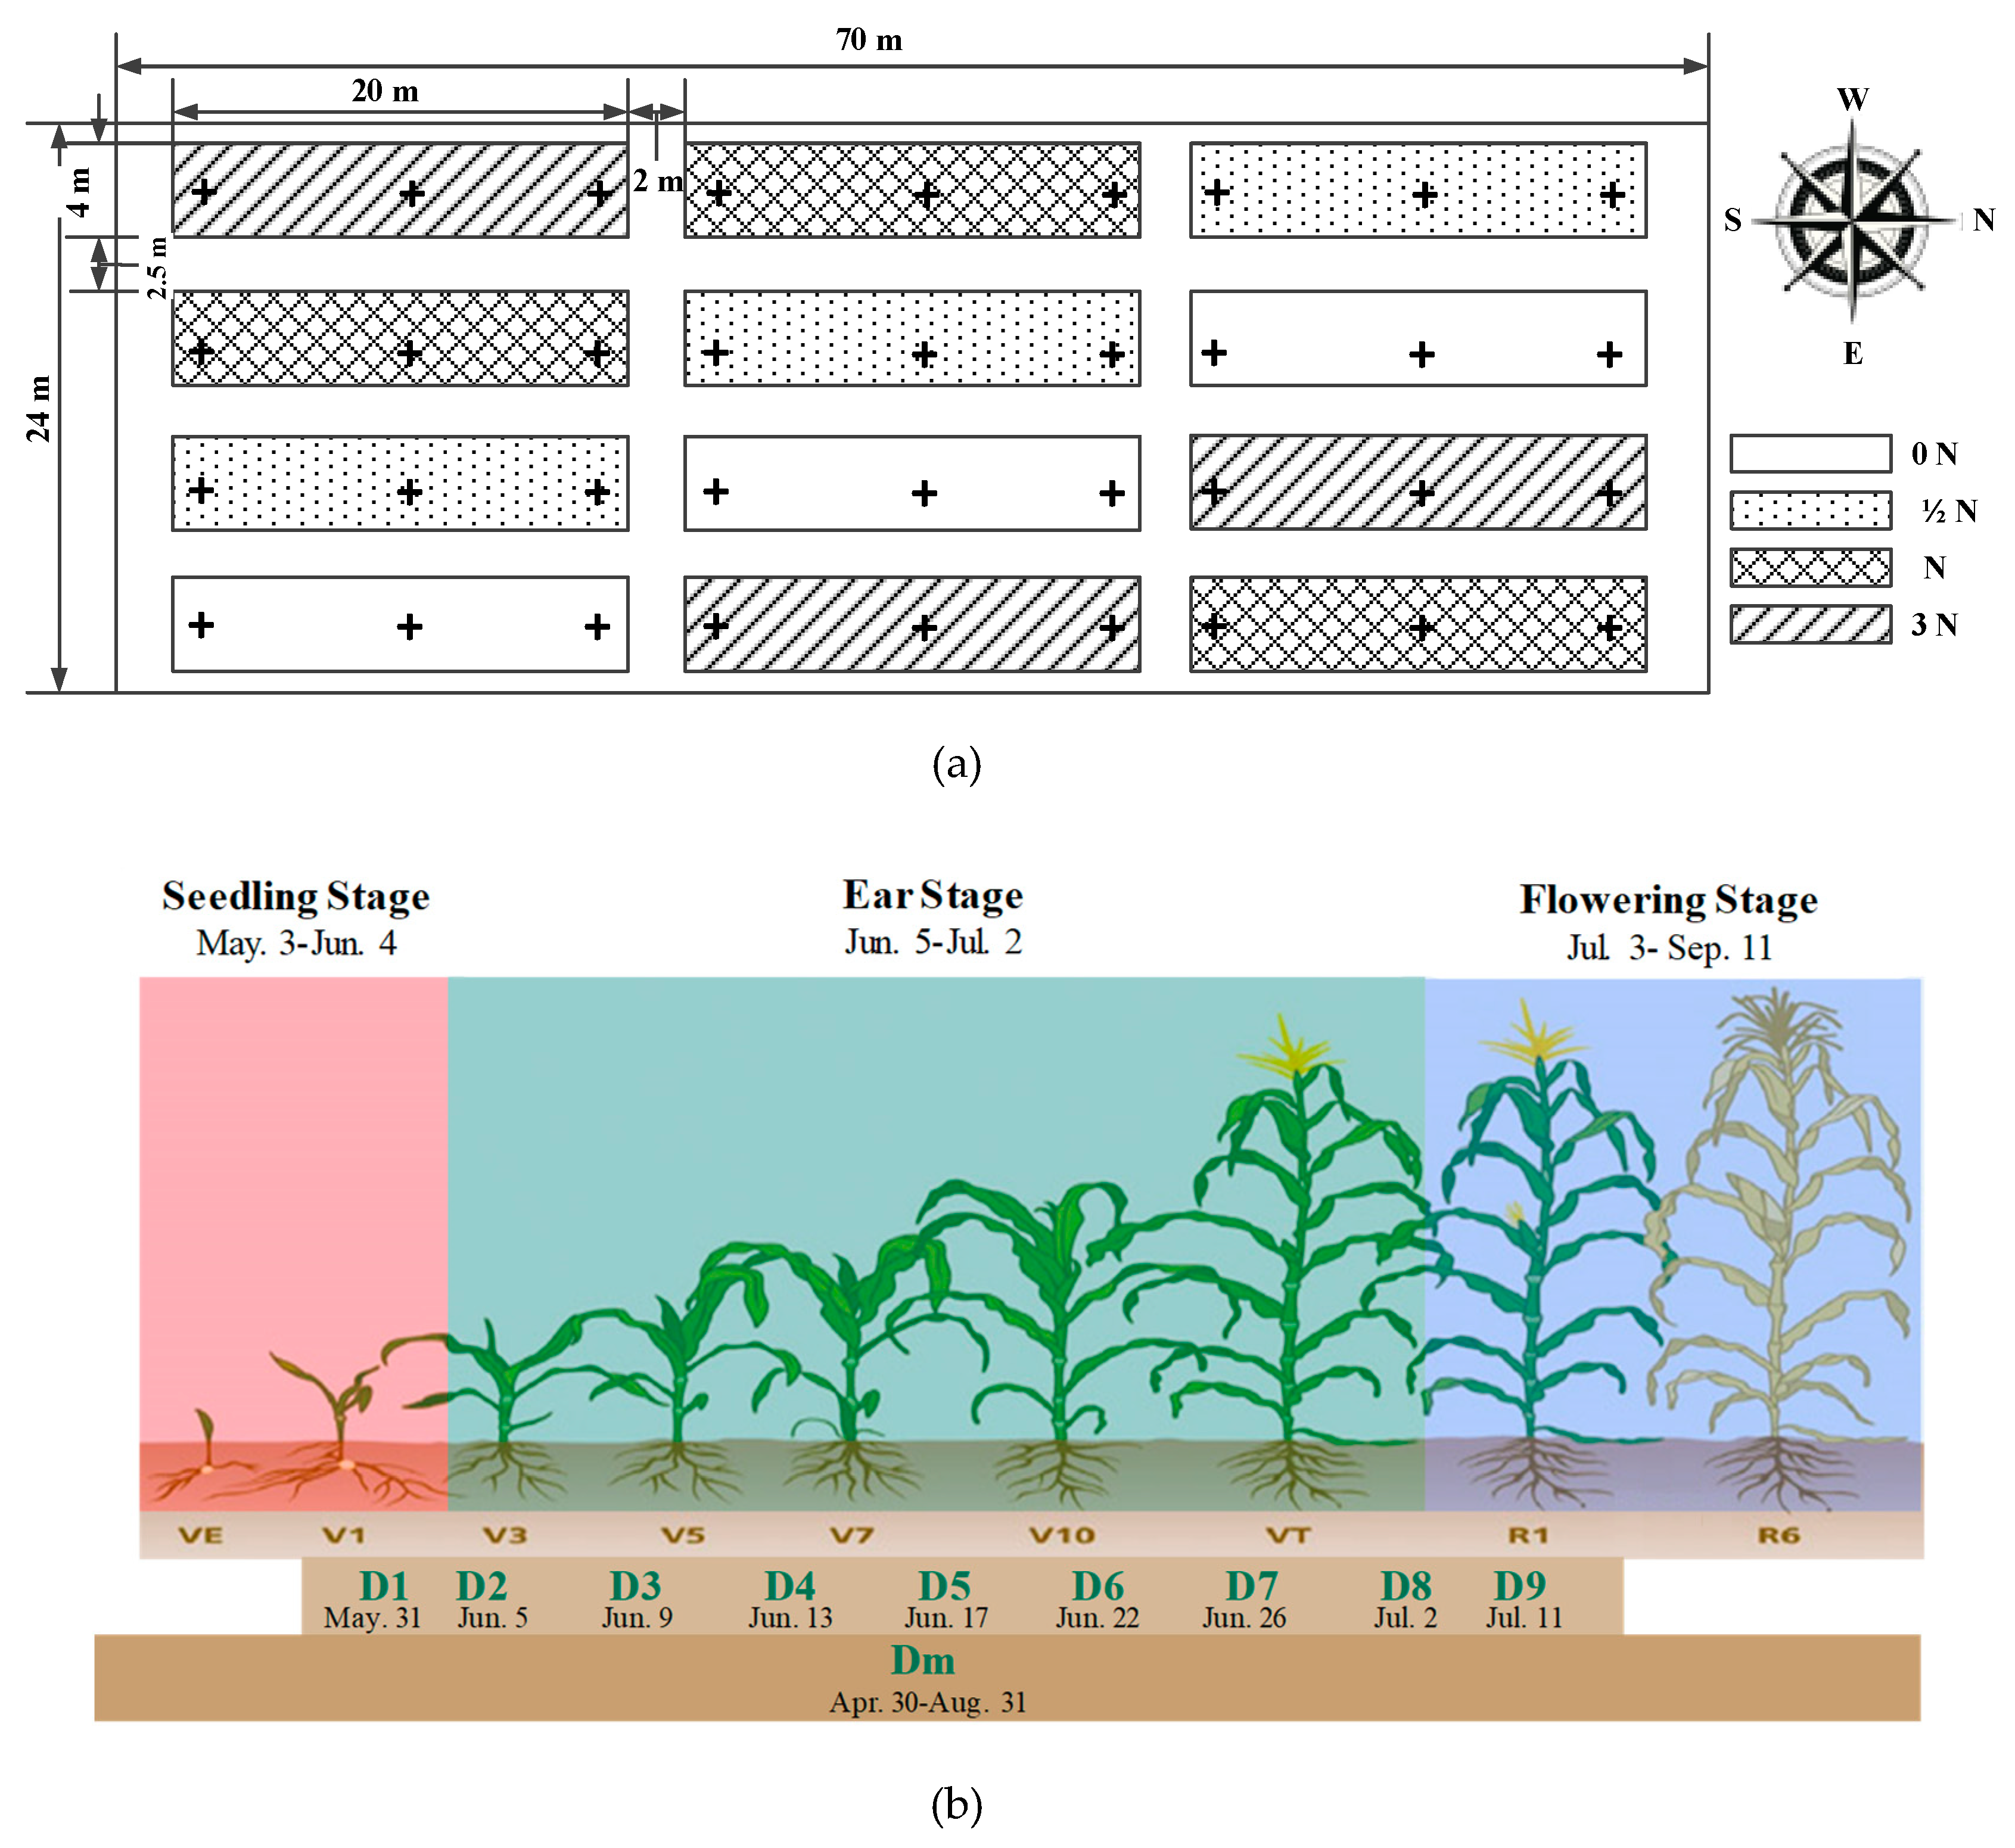
2.4. Field Test Design
3. Results and Discussion
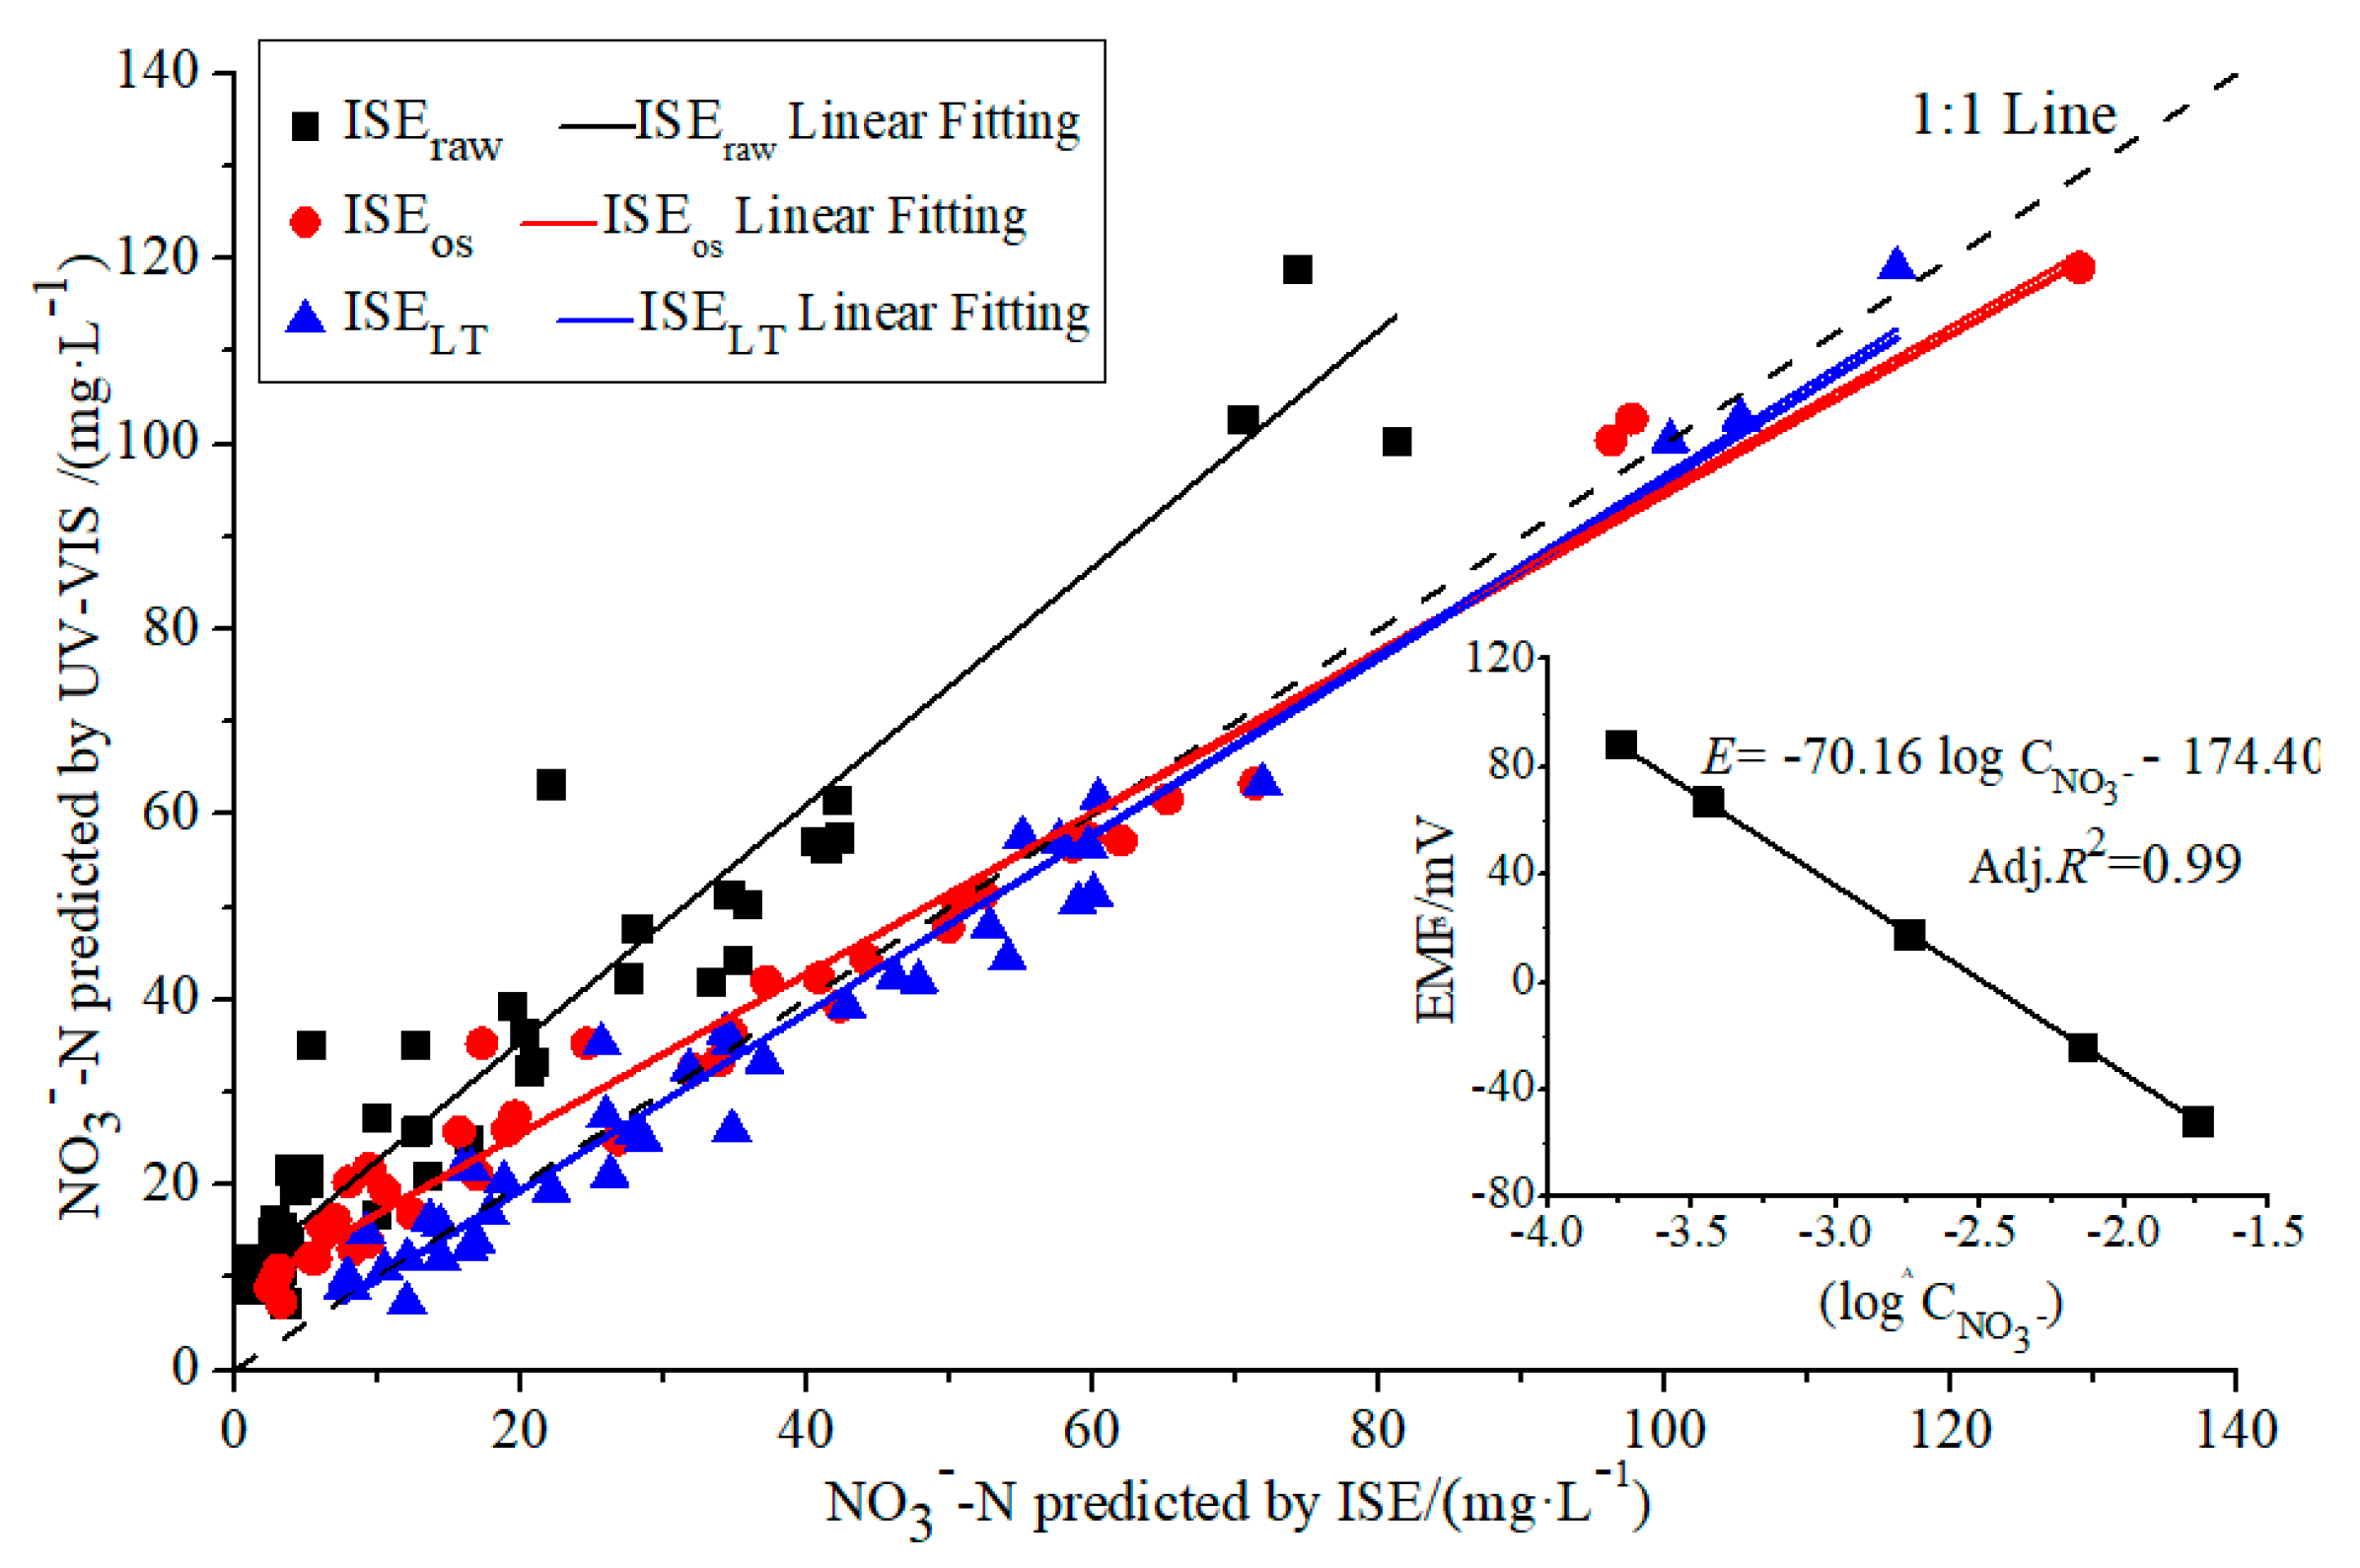
3.1. Validation of the Sensor Fusion Model
3.2. Evaluation of the On-Site Soil NO3−-N Detection
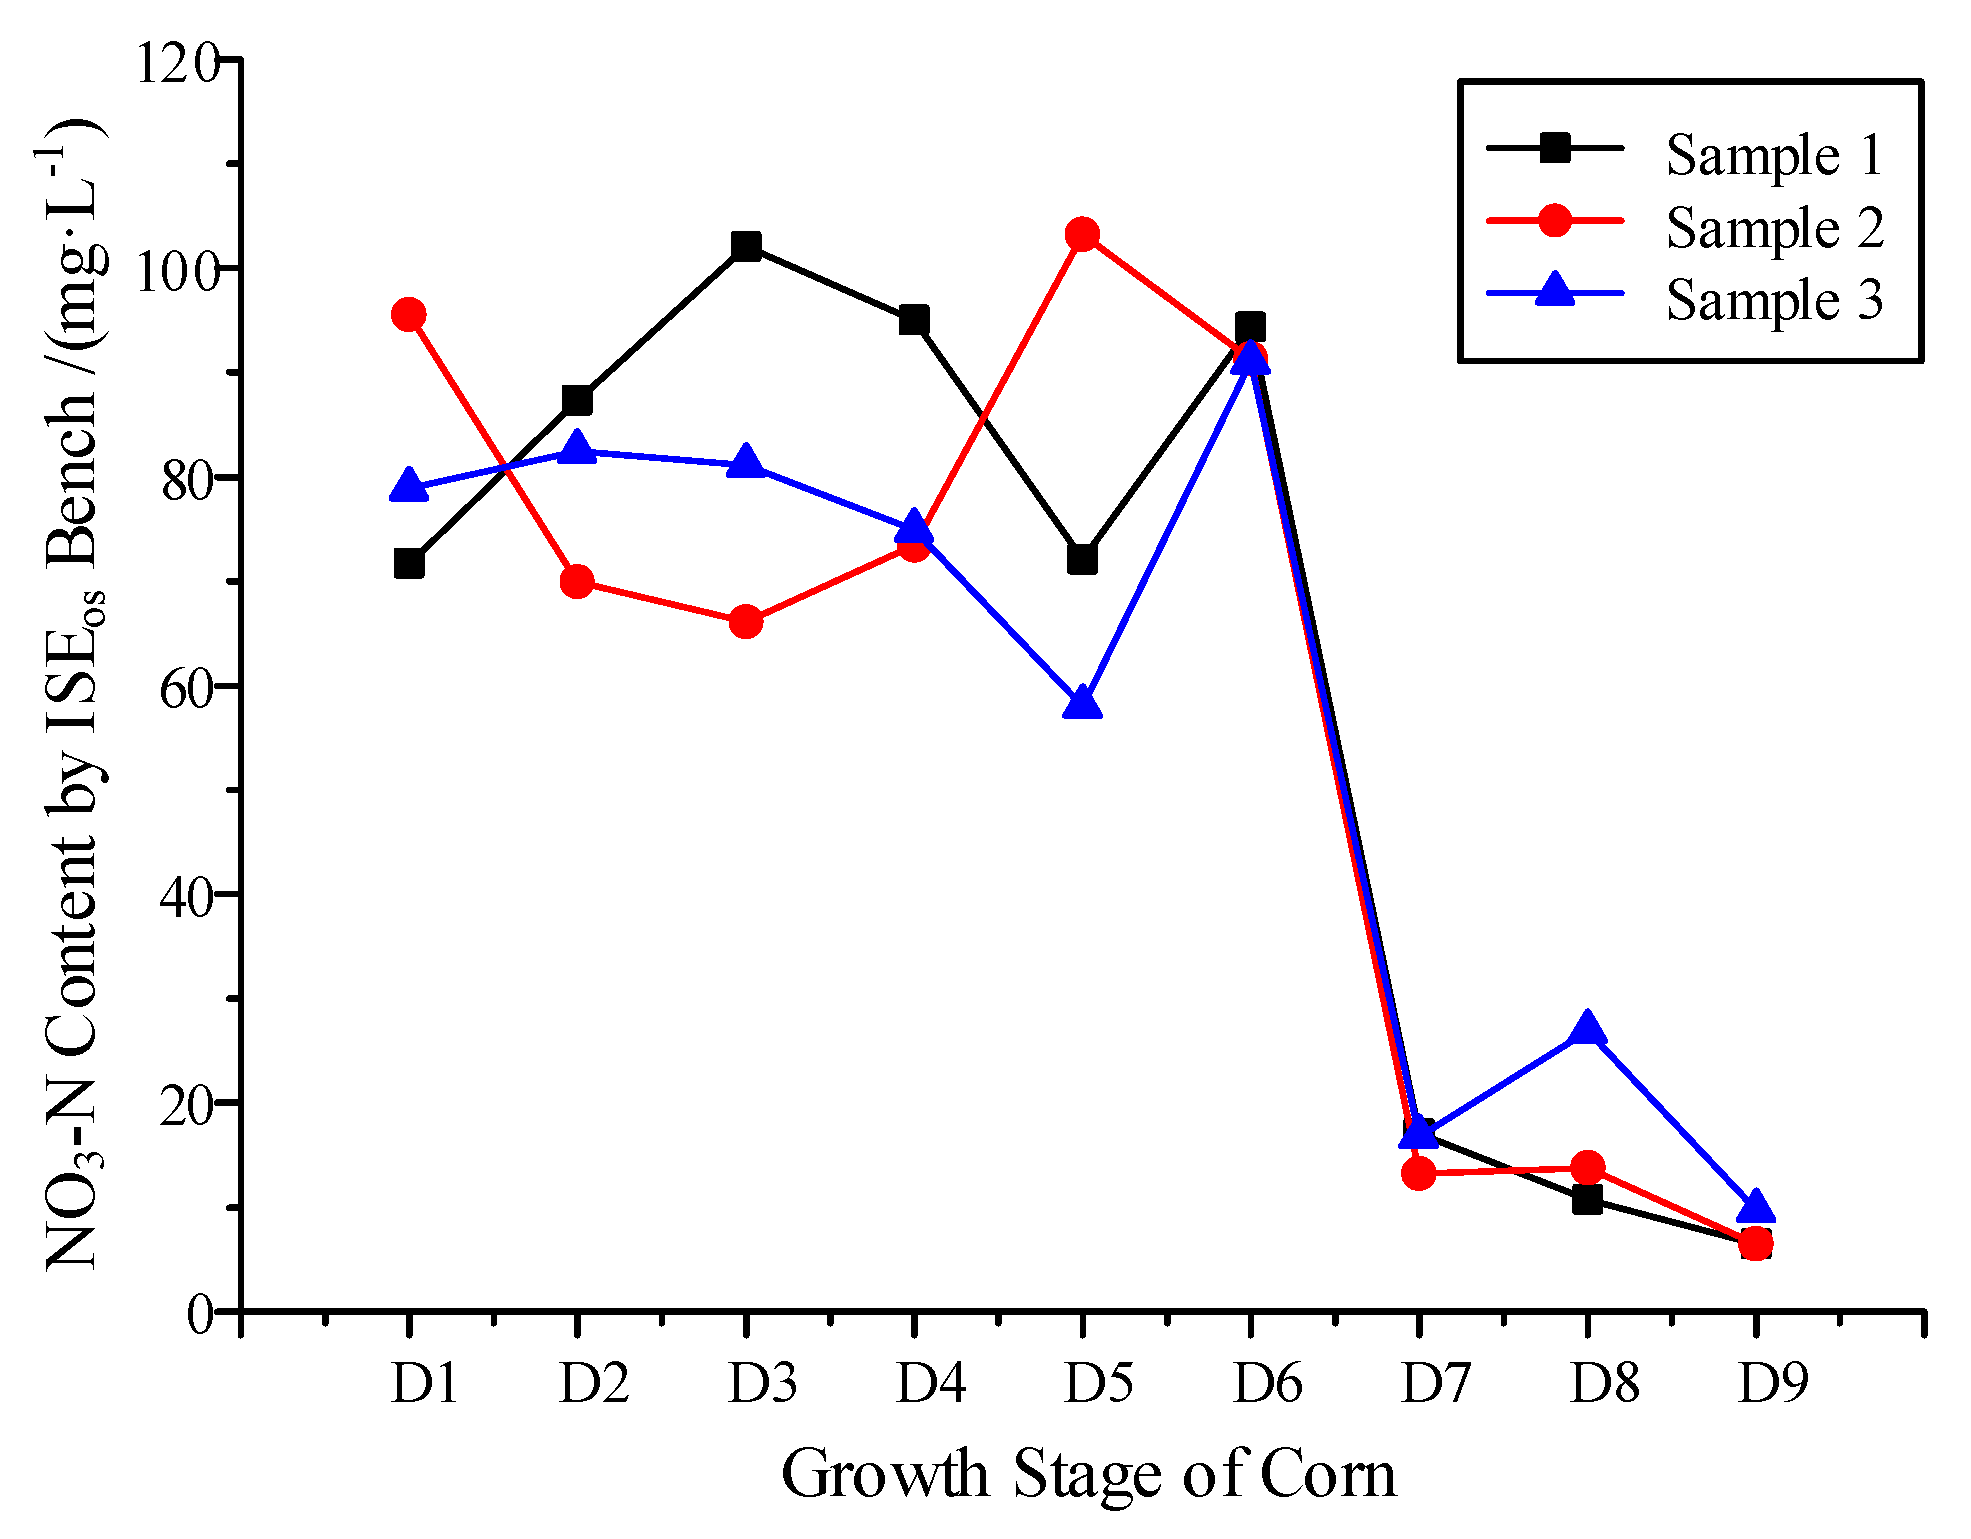
3.3. NO3−-N Variation Monitoring
4. Conclusions
Author Contributions
Funding
Conflicts of Interest
References
- Myers, R.J.K.; Paul, E.A. Nitrate ion electrode method for soil nitrate-nitrogen determination. Can. J. Soil Sci. 1968, 48, 369–371. [Google Scholar] [CrossRef]
- Thottan, J.; Adsett, J.F.; Sibley, K.J.; Macleod, C.M. Laboratory evaluation of the ion selective electrode for use in an automated soil nitrate monitoring system. Commun. Soil Sci. Plant Anal. 1994, 25, 3025–3034. [Google Scholar] [CrossRef]
- Sibley, K.J.; Adsett, J.F.; Struik, P.C. An on-the-go-soil sampler for an automated soil nitrate mapping system. Trans. ASABE 2008, 51, 1895–1904. [Google Scholar] [CrossRef]
- Sibley, K.J.; Astatkie, T.; Brewster, G.; Struik, P.C.; Adsett, J.F.; Pruski, K. Field-scale validation of an automated soil nitrate extraction and measurement system. Precis. Agric. 2009, 10, 162–174. [Google Scholar] [CrossRef]
- Davenport, J.R.; Jabro, J.D. Assessment of hand held ion selective electrode technology for direct measurement of soil chemical properties. Commun. Soil Sci. Plant Anal. 2001, 32, 3077–3085. [Google Scholar] [CrossRef]
- Kim, H.J.; Hummel, J.W.; Birrell, S.J. Evaluation of nitrate and potassium ion-selective membranes for soil macronutrient sensing. Trans. ASABE 2006, 49, 597–606. [Google Scholar] [CrossRef]
- Kim, H.J.; Hummel, J.W.; Sudduth, K.A.; Motavalli, P.P. Simultaneous Analysis of Soil Macronutrients Using Ion Selective Electrodes. Soil Sci. Soc. Am. J. 2006, 71, 1867–1877. [Google Scholar] [CrossRef]
- Adamchuk, V.I.; Lund, E.D.; Dobermann, A.; Morgan, M.T. On-the-go mapping of soil properties using ion-selective electrodes. In Precision Agriculture; John, V.S., Armin, W., Eds.; Wageningen Academic Publishers: Wagenin, The Netherlands, 2003; pp. 27–33. [Google Scholar]
- Adamchuk, V.I.; Lund, E.D.; Sethuramasamyraja, B.; Morgan, M.T. Direct measurement of soil chemical properties on-the-go using ion-selective electrodes. Comput. Electron. Agric. 2005, 48, 272–294. [Google Scholar] [CrossRef]
- Sethuramasamyraja, B.; Adamchuk, V.I.; Dobermann, A.; Marx, D.B.; Jones, D.D.; Meyer, G.E. Agitated soil measurement method for integrated on-the-go mapping of soil pH, potassium and nitrate contents. Comput. Electron. Agric. 2008, 60, 212–225. [Google Scholar] [CrossRef]
- Adamchuk, V.; Dhawale, N.; Renelaforest, F. Development of an on-the-spot analyzer for measuring soil chemical properties. In Proceedings of the International Conference on Precision Agriculture, Sacramento, CA, USA, 20–23 July 2014. [Google Scholar]
- Zhang, L.; Zhang, M.; Ren, H.; Pu, P.; Kong, P.; Zhao, H. Comparative Investigation on Soil Nitrate-nitrogen and Available Potassium Measurement Capability by Using Solid-State and PVC ISE. Comput. Electron. Agric. 2015, 112, 83–91. [Google Scholar] [CrossRef]
- Zhang, L. Study on Establishing the Electrochemical Methods for Fast Determination of Soil Available Macronutrients Based on Ion-Selective Electrodes. Ph.D. Thesis, China Agricultural University, Beijing, China, 2015. (In Chinese with English Abstract). [Google Scholar]
- Kong, P.; Zhang, M.; Ren, H.; Li, Y.; Pu, P. Rapid Pretreatment Method for Soil Nitrate Nitrogen Detection based on Ion-selective Electrode. Trans. Chin. Soc. Agric. Mach. 2015, 46, 102–107, (In Chinese with English Abstract). [Google Scholar]
- Li, Y.; Zhang, M.; Pan, L.; Zheng, J. ISE-base Sensor Fusion Method for Wet Soil Nitrate-nitrogen Detection. Trans. Chin. Soc. Agric. Mach. 2016, 47, 285–290, (In Chinese with English Abstract). [Google Scholar]
- Bai, Y.L.; Yang, L.P. Soil testing and fertilizer recommendation in Chinese agriculture. Soil Fertil. Sci. China 2006, 2, 3–7, (In Chinese with English Abstract). [Google Scholar]
- Cyberspace Administration of China. The 44th China Statistical Report on Internet Development. Available online: http://www.cac.gov.cn/2019-08/30/c_1124938750.htm (accessed on 30 August 2019).


| No. | Mass Moisture | Nitrate Nitrogen (mg·L−1) | Total -N 1 (g·kg−1) | Available-P 1 (mg·L−1) | Organic Matter 1 (g·kg−1) | Available-K 1 (mg·L−1) | |
|---|---|---|---|---|---|---|---|
| Dm | 42 | 2.5%–30.2% | 11.2–87.7 | 0.3–10.5 | 9.8–32.5 | 3.2–9.0 | 8.3–121.3 |
| D1 | 12 | 12.5%–16.3% | 33.1–159.8 | 0.3–9.9 | 2.4–43.3 | 1.3–11.2 | 10.3–98.8 |
| D2 | 12 | 13.3%–16.9% | 31.6–345.0 | - | - | - | - |
| D3 | 12 | 13.2%–17.6% | 27.5–272.0 | - | - | - | - |
| D4 | 12 | 11.4%–15.4% | 16.2–189.7 | - | - | - | - |
| D5 | 12 | 10.6%–13.7% | 19.3–260.5 | - | - | - | - |
| D6 | 12 | 9.2%–15.1% | 19.3–256.9 | - | - | - | - |
| D7 | 12 | 23.8%–26.4% | 12.9–72.3 | - | - | - | - |
| D8 | 12 | 14.3%–17.3% | 9.5–32.6 | - | - | - | - |
| D9 | 12 | 14.8%–18.1% | 5.2–16.7 | - | - | - | - |
| Detection Range (mg·L−1) | Linear Fitting Model | Adj. R2 | F-Value | P-Value | Sig. | AE (mg·L−1) | MRE (%) | RMSE (mg·L−1) | |
|---|---|---|---|---|---|---|---|---|---|
| ISEOS | 5.0–156.3 | y = 1.02x − 0.57 | 0.98 | 6055.8 | 0.0 | * | 0.1–19.9 | 13.9 | 6.1 |
| ISELT | 5.9–150.5 | Y = 0.98x − 0.71 | 0.98 | 5488.9 | 0.0 | * | 0.0–18.4 | 13.7 | 5.5 |
| Measurement 1 | StandSpec | ISELT | ISEOS | ||||
|---|---|---|---|---|---|---|---|
| Testing Duration (min) 2 | OPERATIONS | Quantitative Weighing | 12 | Quantitative Weighing | 12 | Sample Weighing | 2 |
| Extractant adding | 12 | Extractant adding | 12 | Extractant Injection | 16 | ||
| Shaking | 20 | Shaking | 20 | ||||
| Stabilization | 20 | Stabilization | 20 | Centrifuge Filtration | 3 | ||
| Filtration | 4 | ||||||
| Titration | 24 | Filtration | 4 | ||||
| Detection | 15 | Detection | 24 | Detection | 24 | ||
| Total | 107 | 92 | 45 | ||||
| Labor force Intensity | Intensive physical work. Participation in the overall process | Intensive physical work. Participation in the overall process | Light physical work. Participation in sample pickup and weighting. | ||||
© 2019 by the authors. Licensee MDPI, Basel, Switzerland. This article is an open access article distributed under the terms and conditions of the Creative Commons Attribution (CC BY) license (http://creativecommons.org/licenses/by/4.0/).
Share and Cite
Li, Y.; Yang, Q.; Chen, M.; Wang, M.; Zhang, M. An ISE-based On-Site Soil Nitrate Nitrogen Detection System. Sensors 2019, 19, 4669. https://doi.org/10.3390/s19214669
Li Y, Yang Q, Chen M, Wang M, Zhang M. An ISE-based On-Site Soil Nitrate Nitrogen Detection System. Sensors. 2019; 19(21):4669. https://doi.org/10.3390/s19214669
Chicago/Turabian StyleLi, Yanhua, Qingliang Yang, Ming Chen, Maohua Wang, and Miao Zhang. 2019. "An ISE-based On-Site Soil Nitrate Nitrogen Detection System" Sensors 19, no. 21: 4669. https://doi.org/10.3390/s19214669
APA StyleLi, Y., Yang, Q., Chen, M., Wang, M., & Zhang, M. (2019). An ISE-based On-Site Soil Nitrate Nitrogen Detection System. Sensors, 19(21), 4669. https://doi.org/10.3390/s19214669