Performance and Long Distance Data Acquisition via LoRa Technology of a Tubular Plant Microbial Fuel Cell Located in a Paddy Field in West Kalimantan, Indonesia
Abstract
1. Introduction
2. Materials and Methods
2.1. Paddy Field
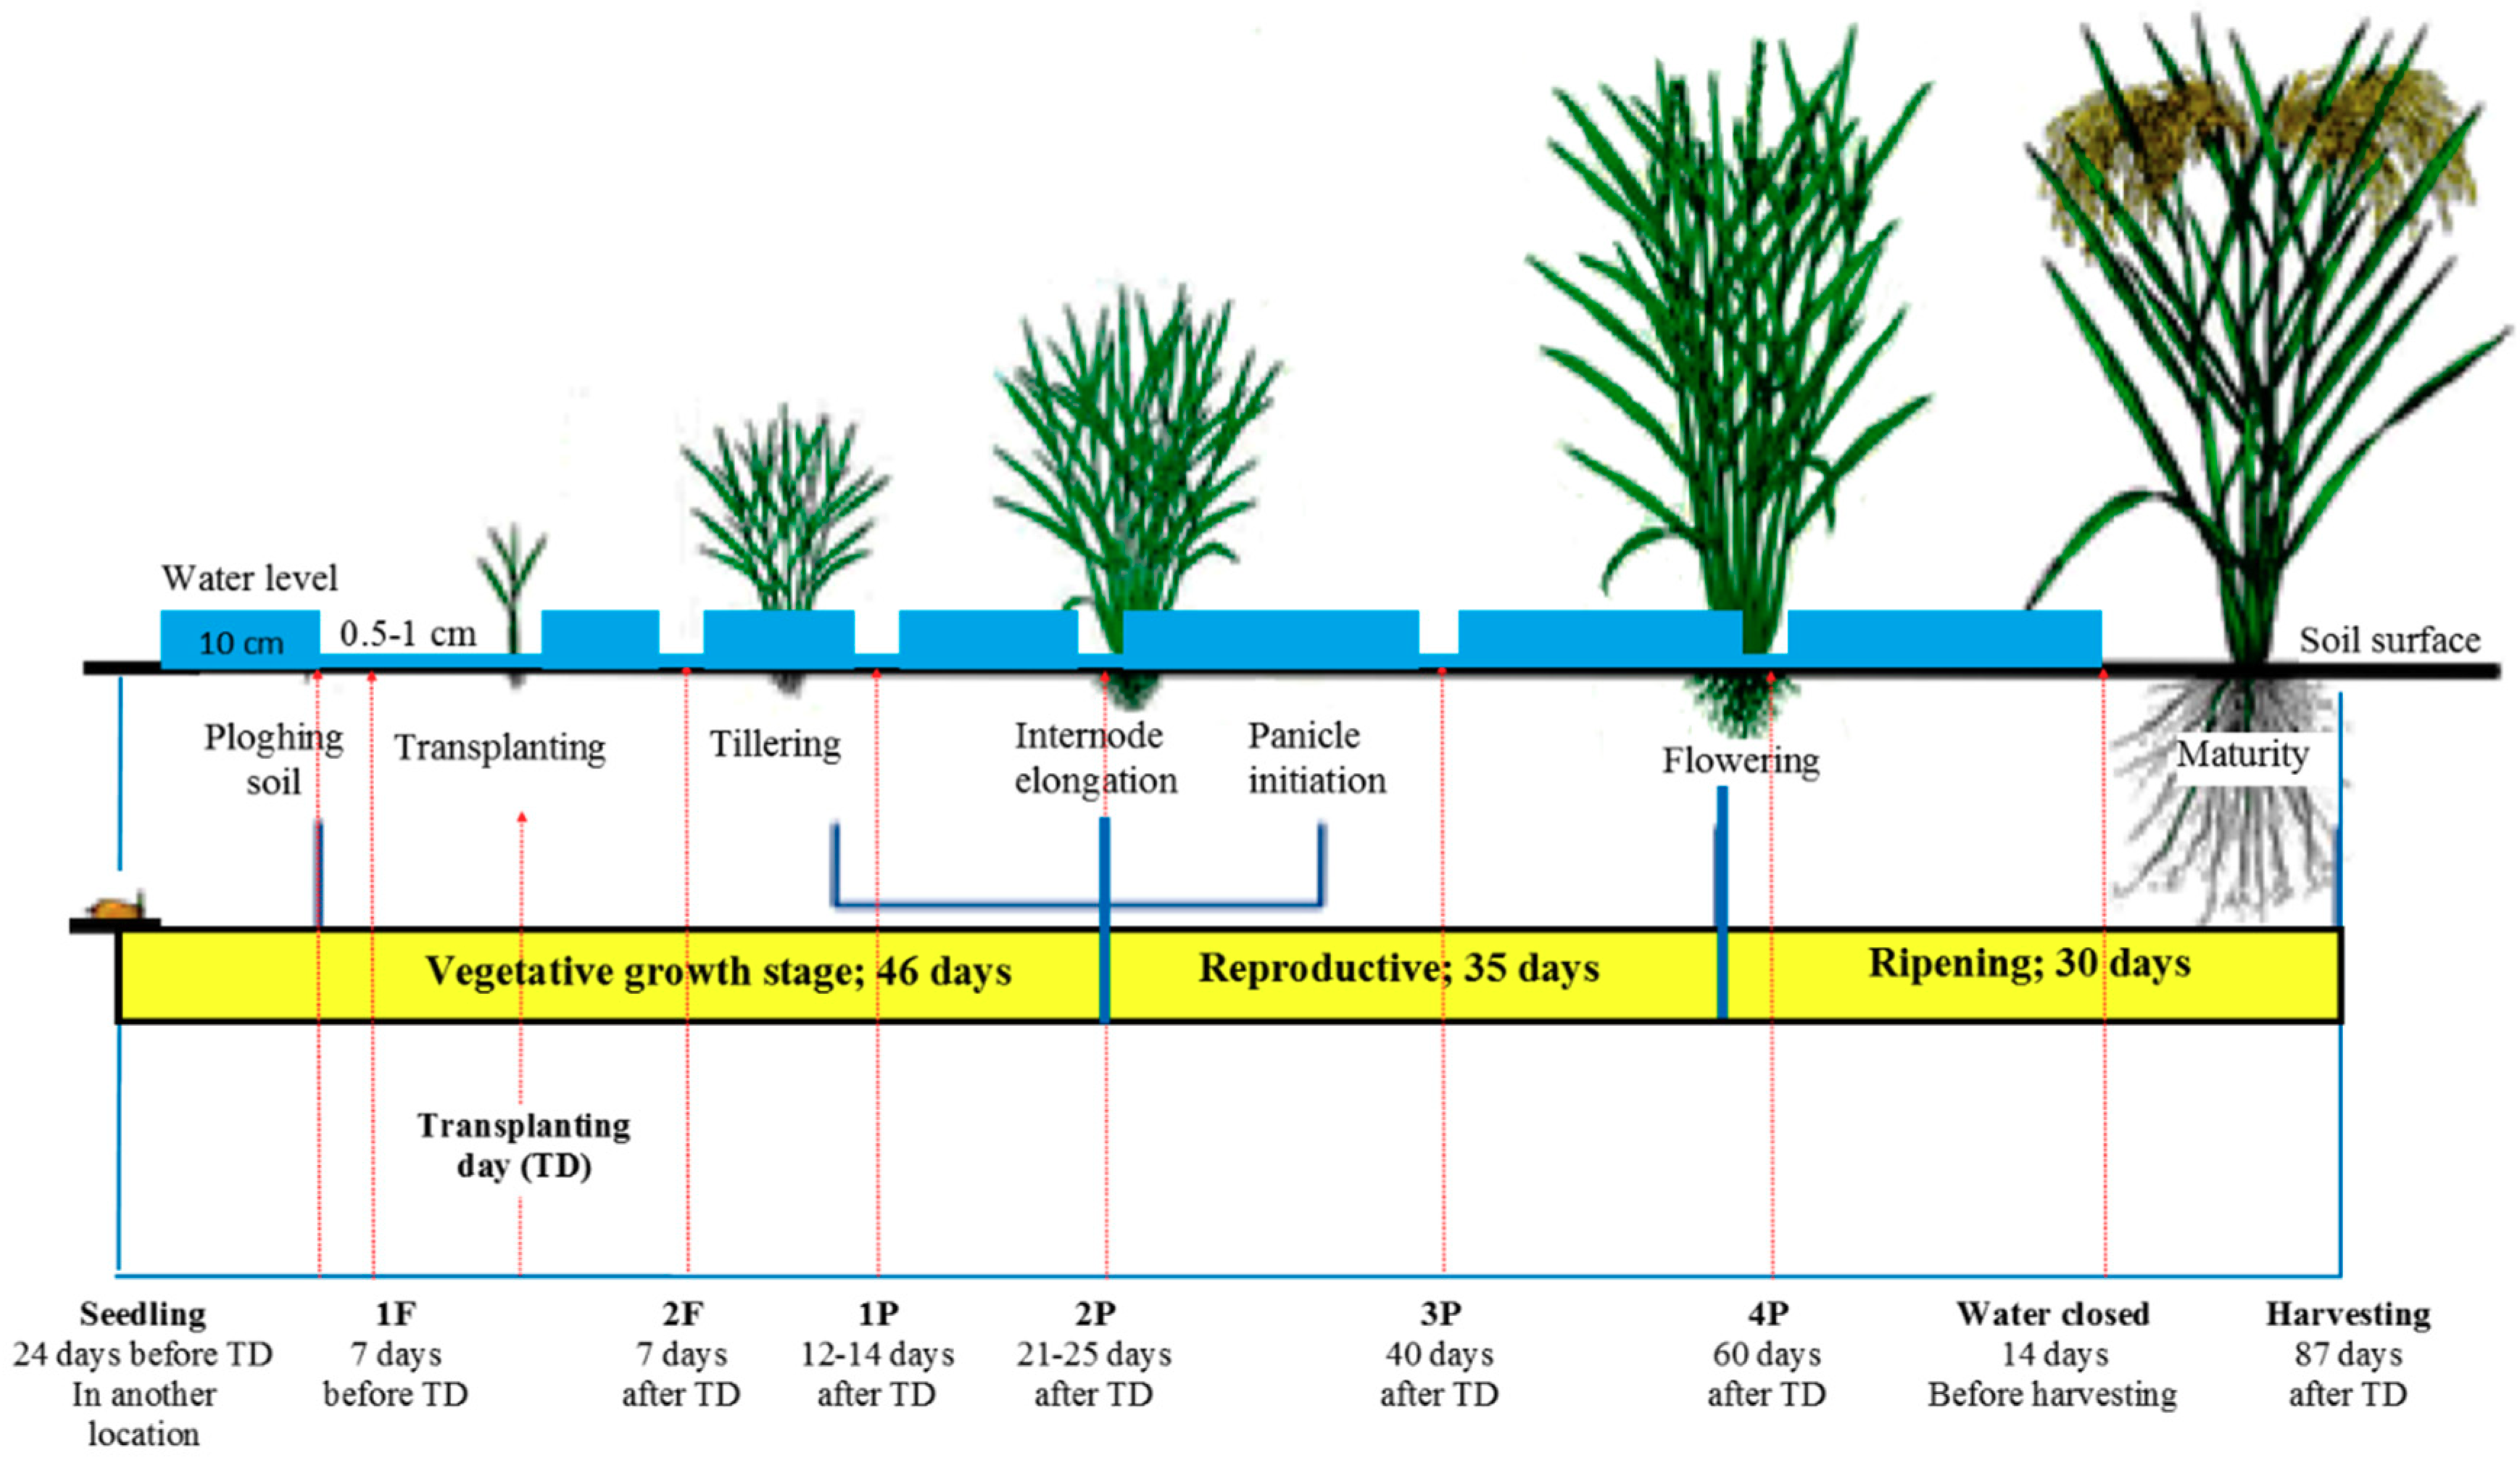
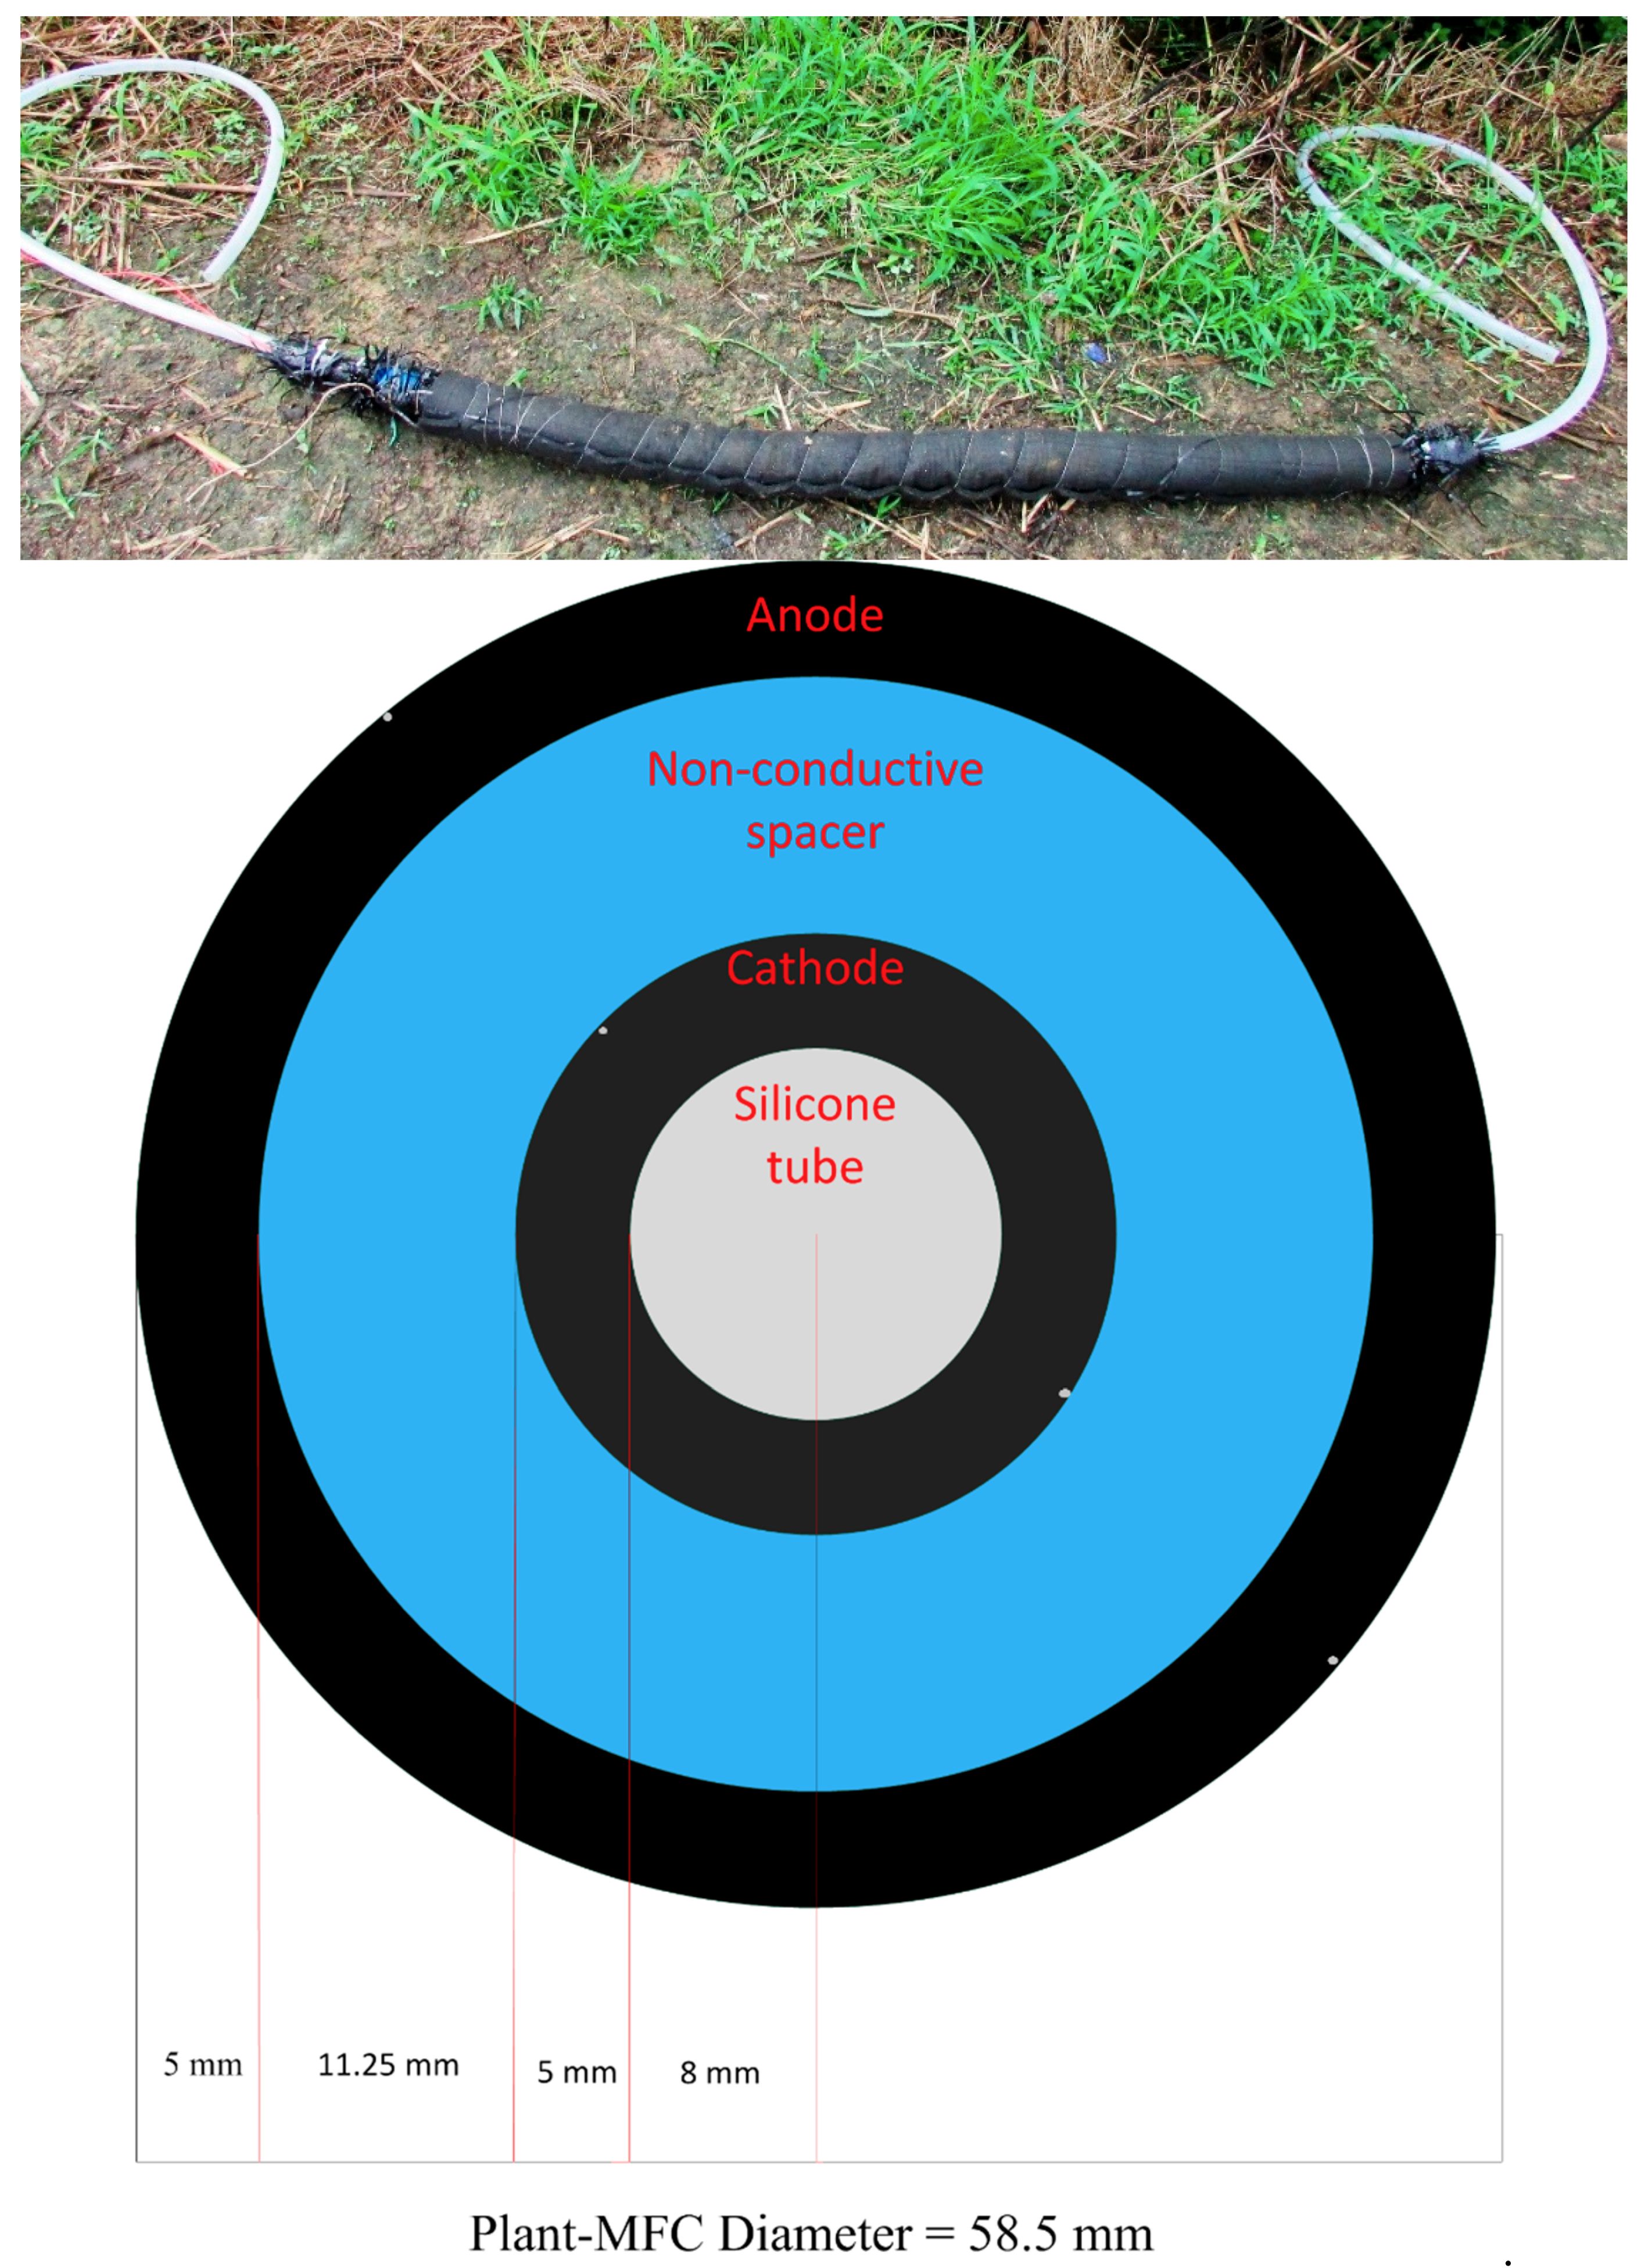
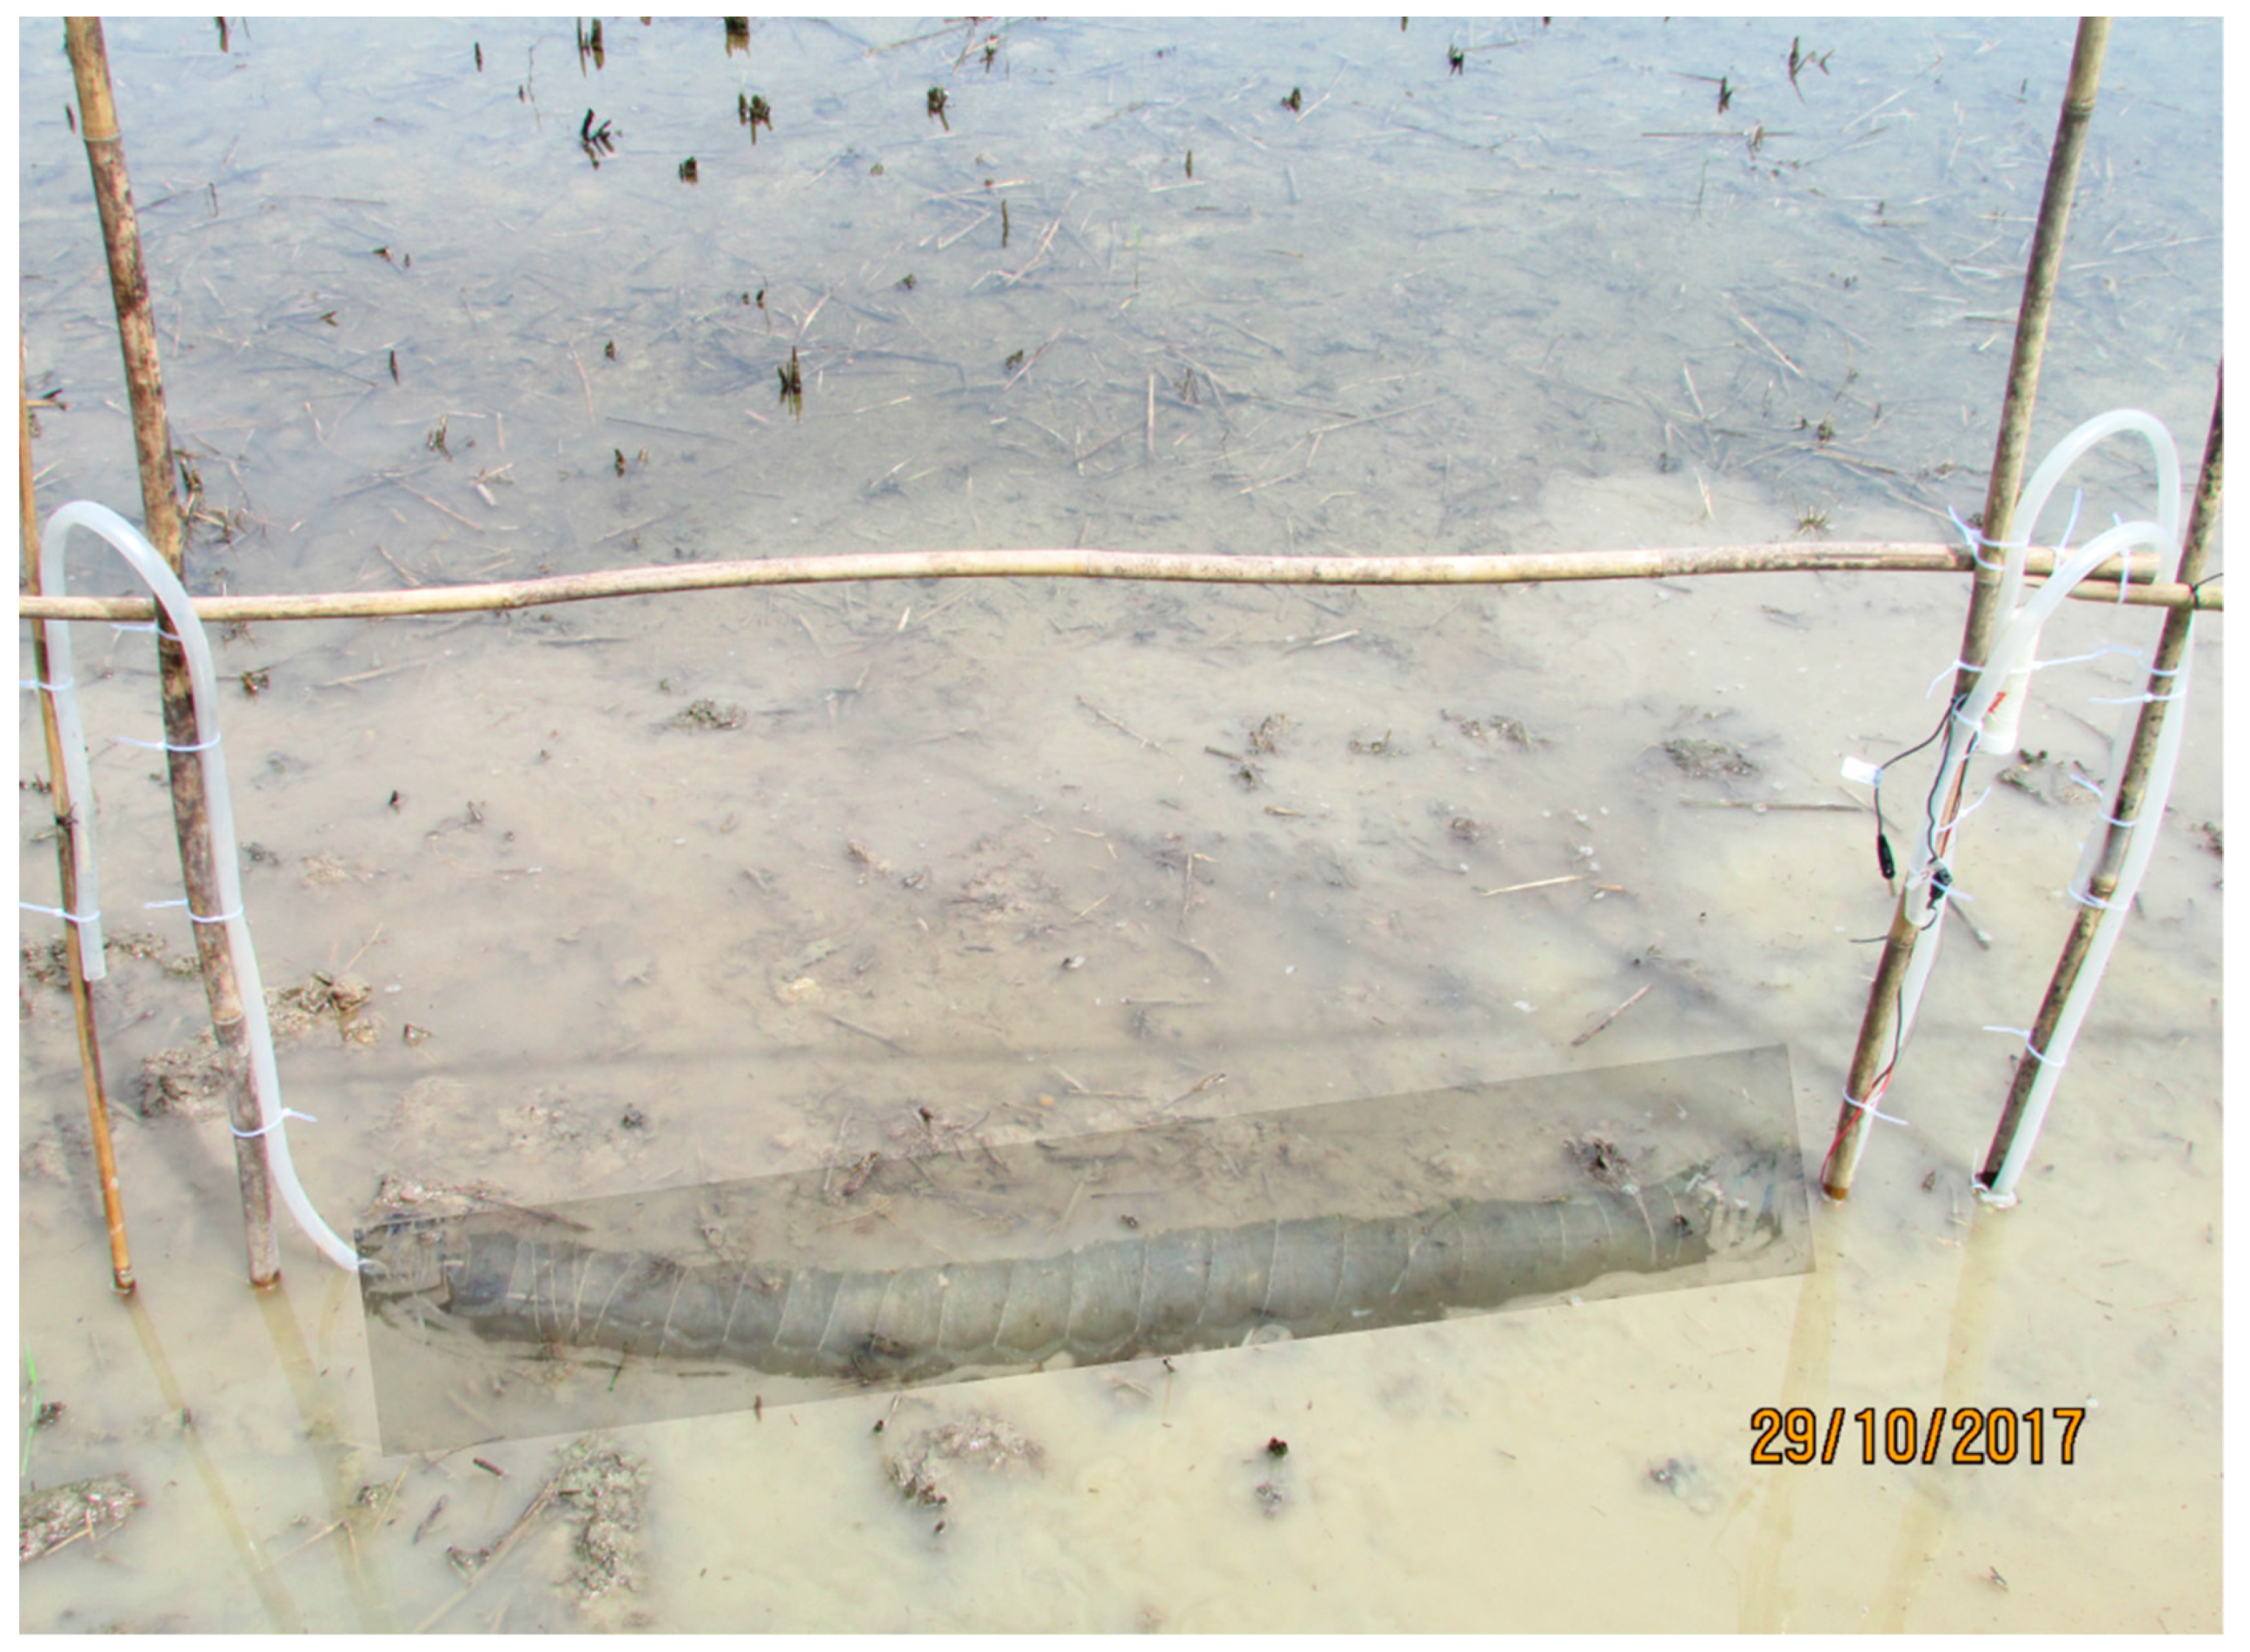
2.2. Electricity Generation
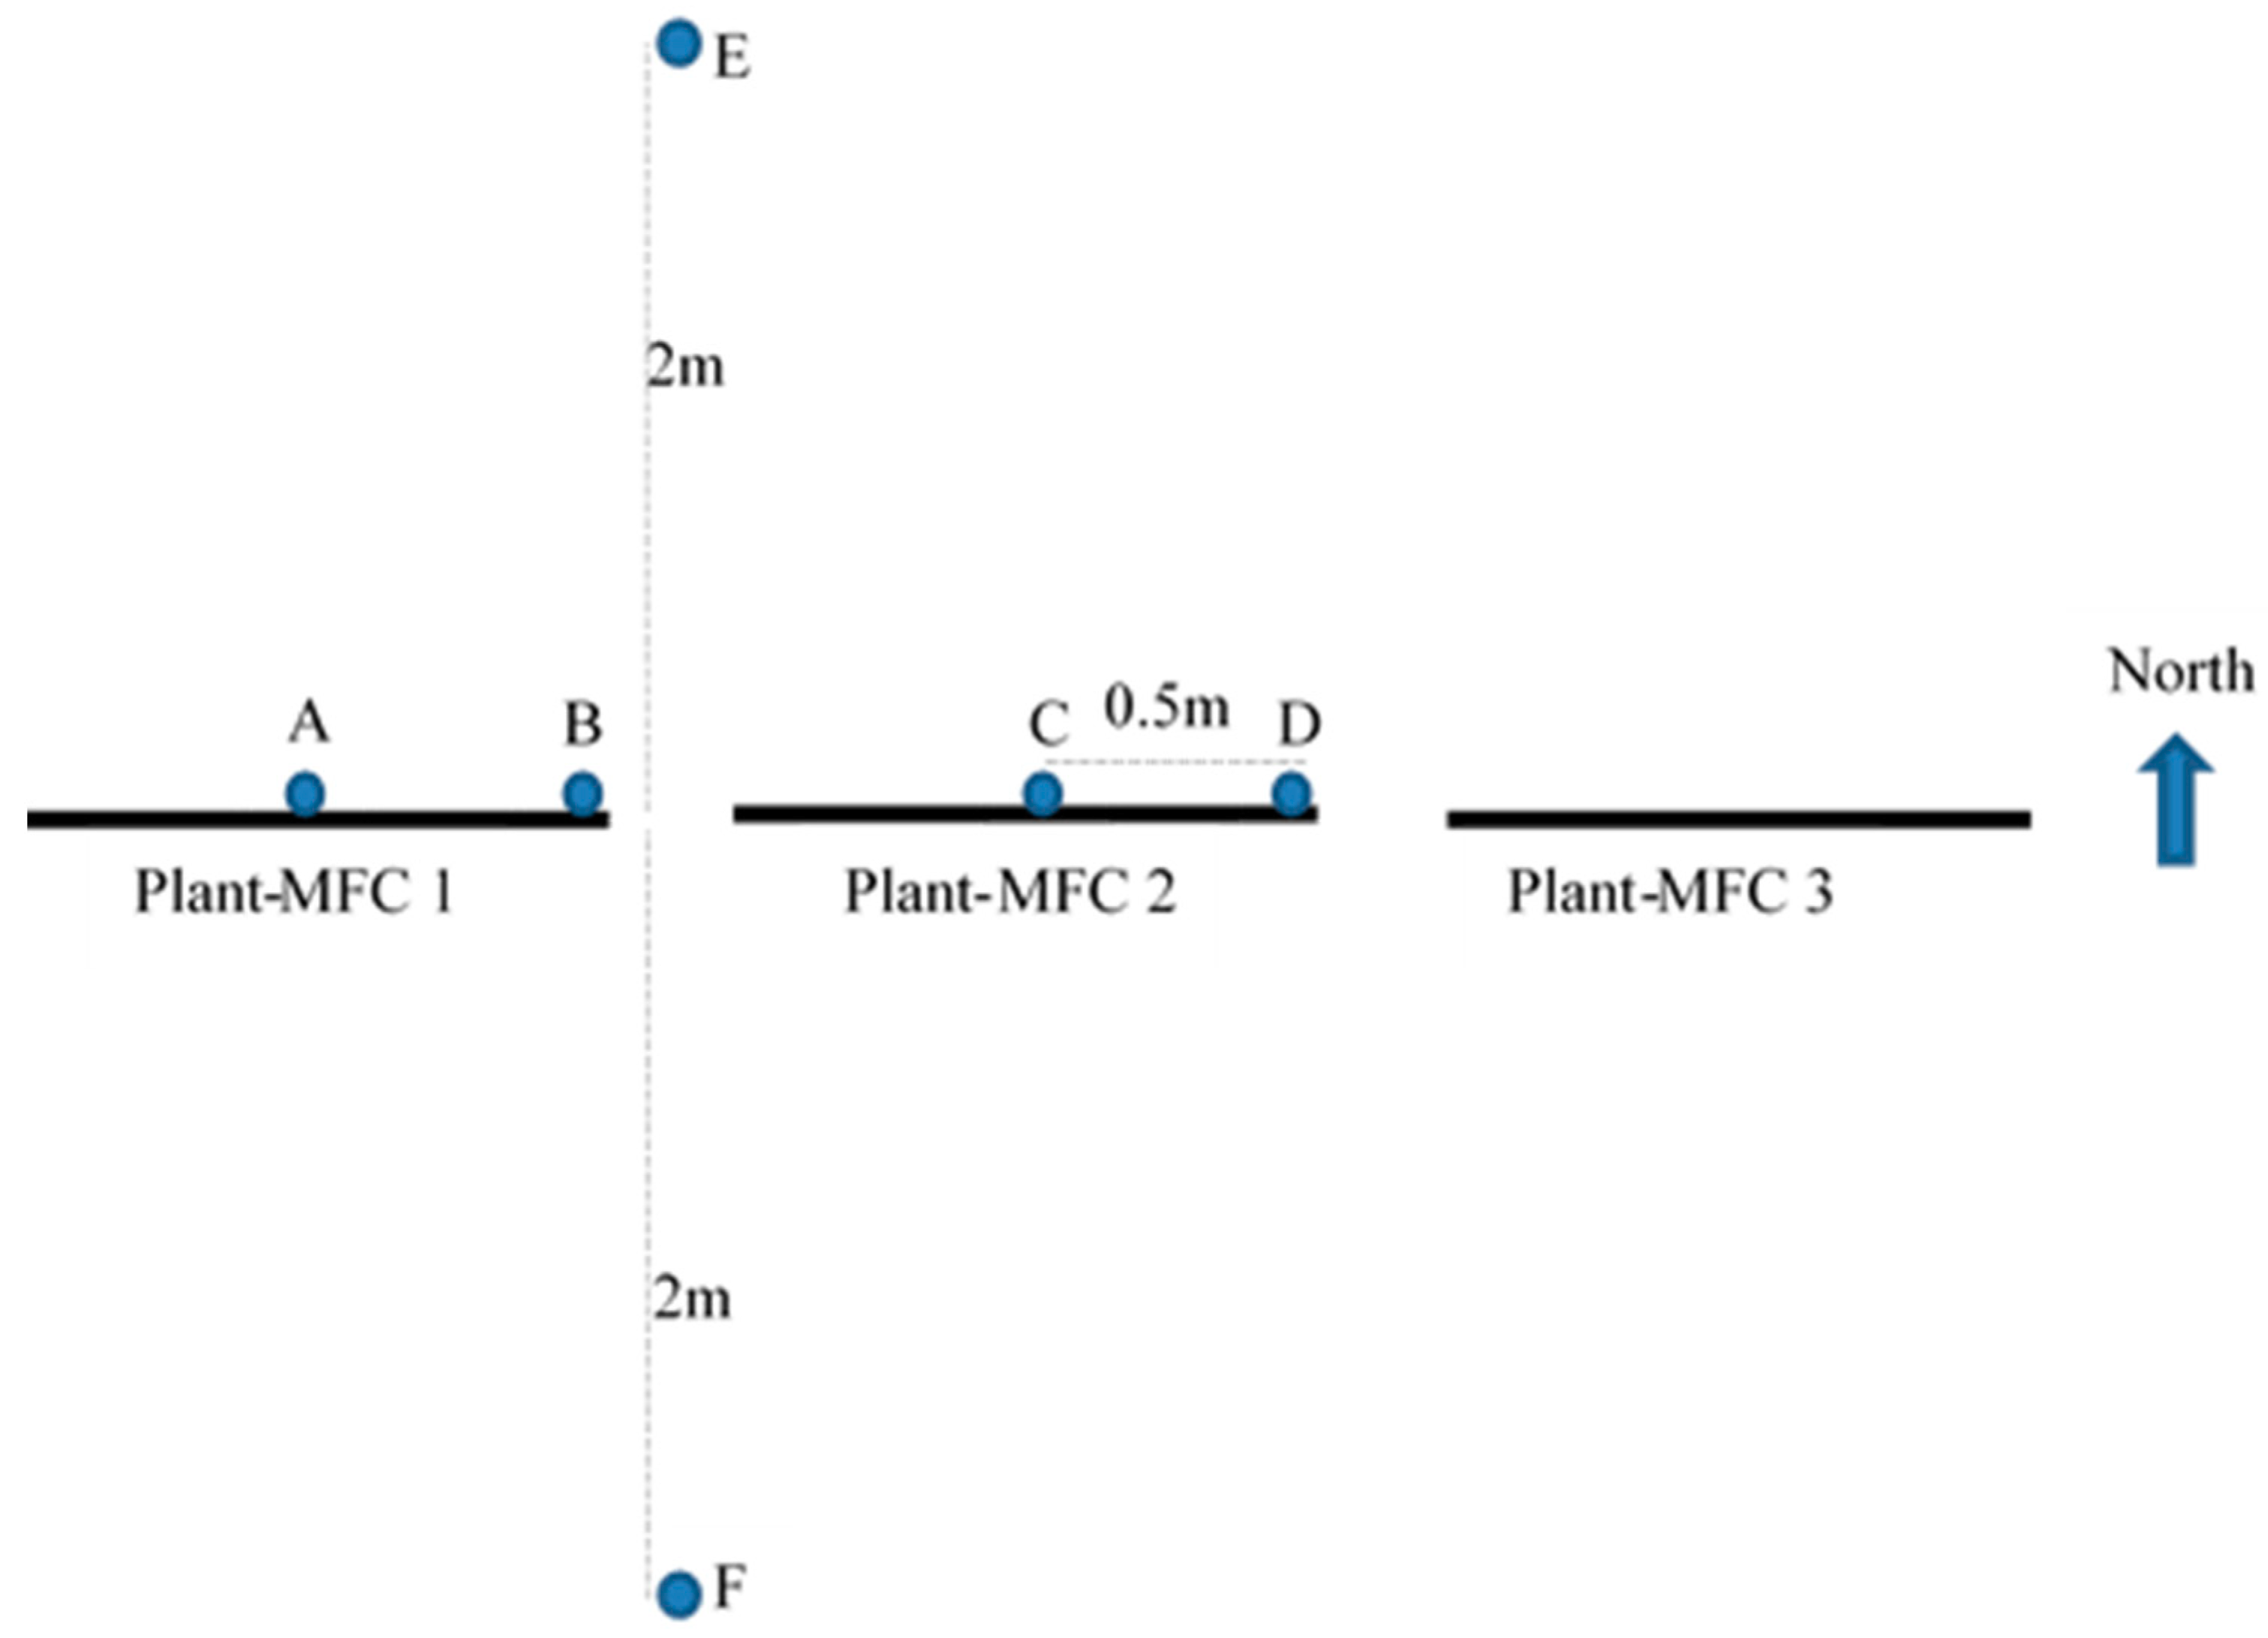
2.3. Measurements and Analysis
2.4. Long Distance Data Acquisition
2.5. Calculation
3. Results
3.1. Rice Paddy Maintenance, Growth and Production above Plant-MFC Application
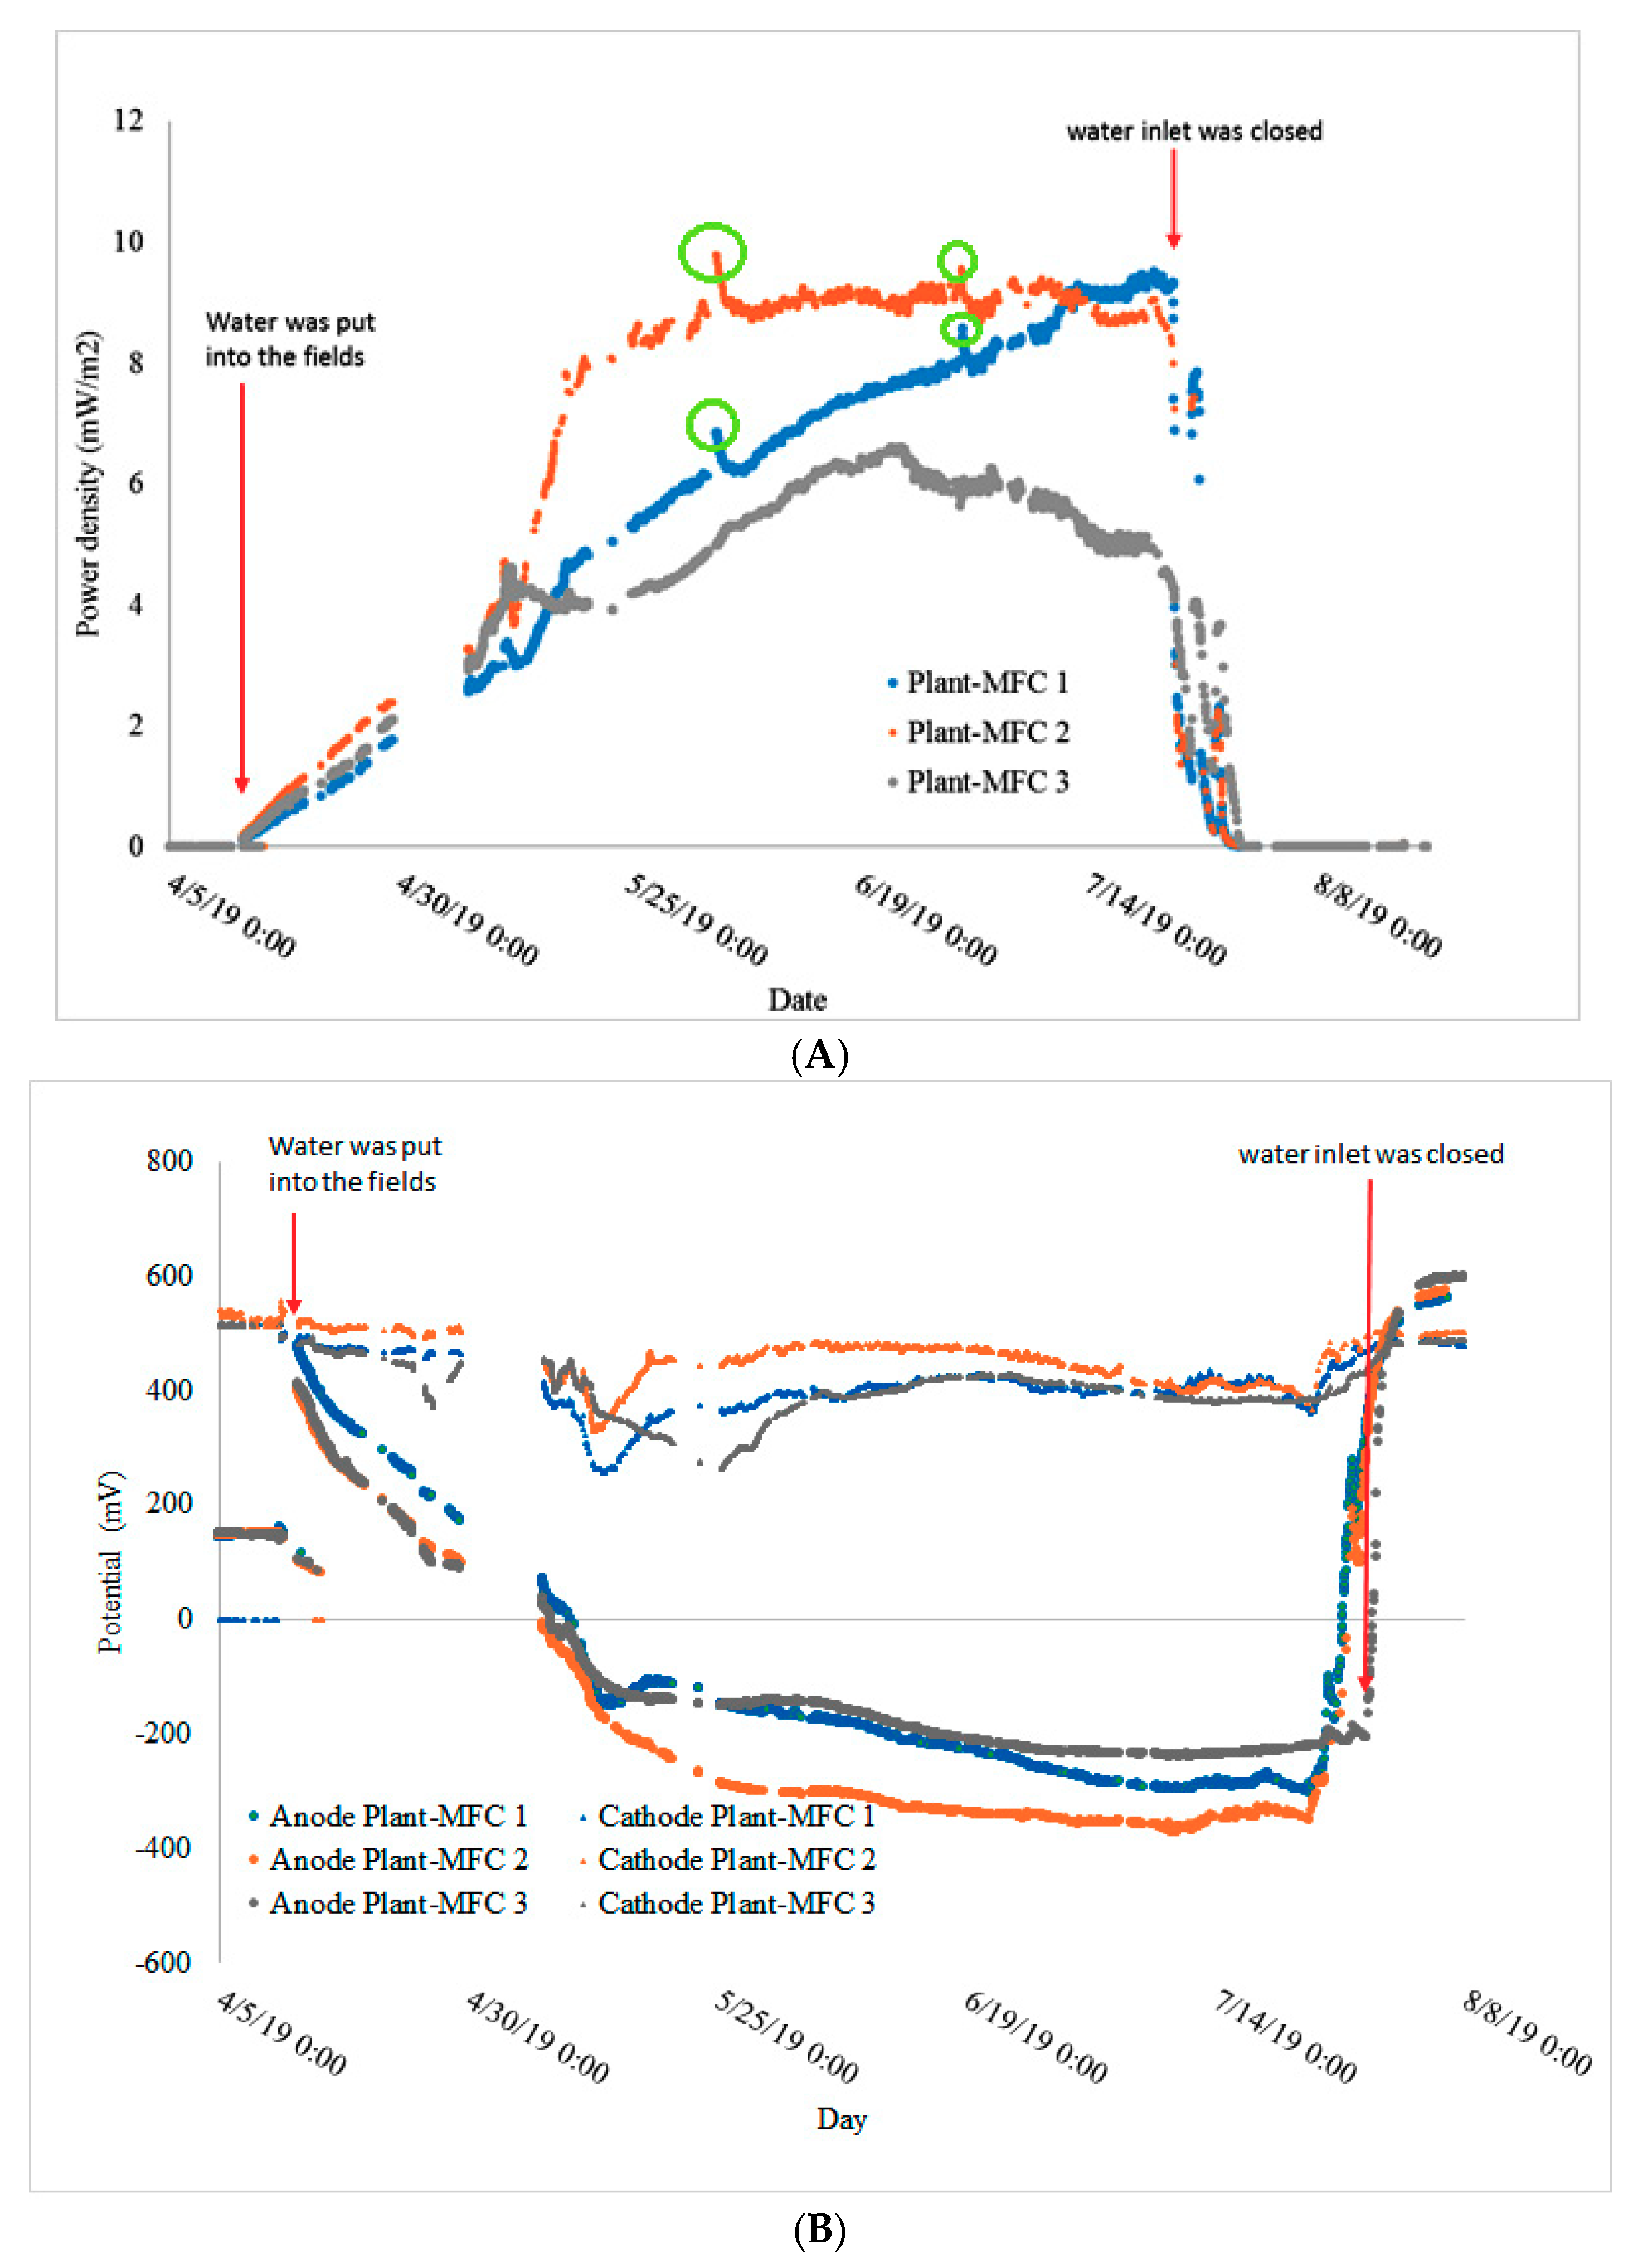
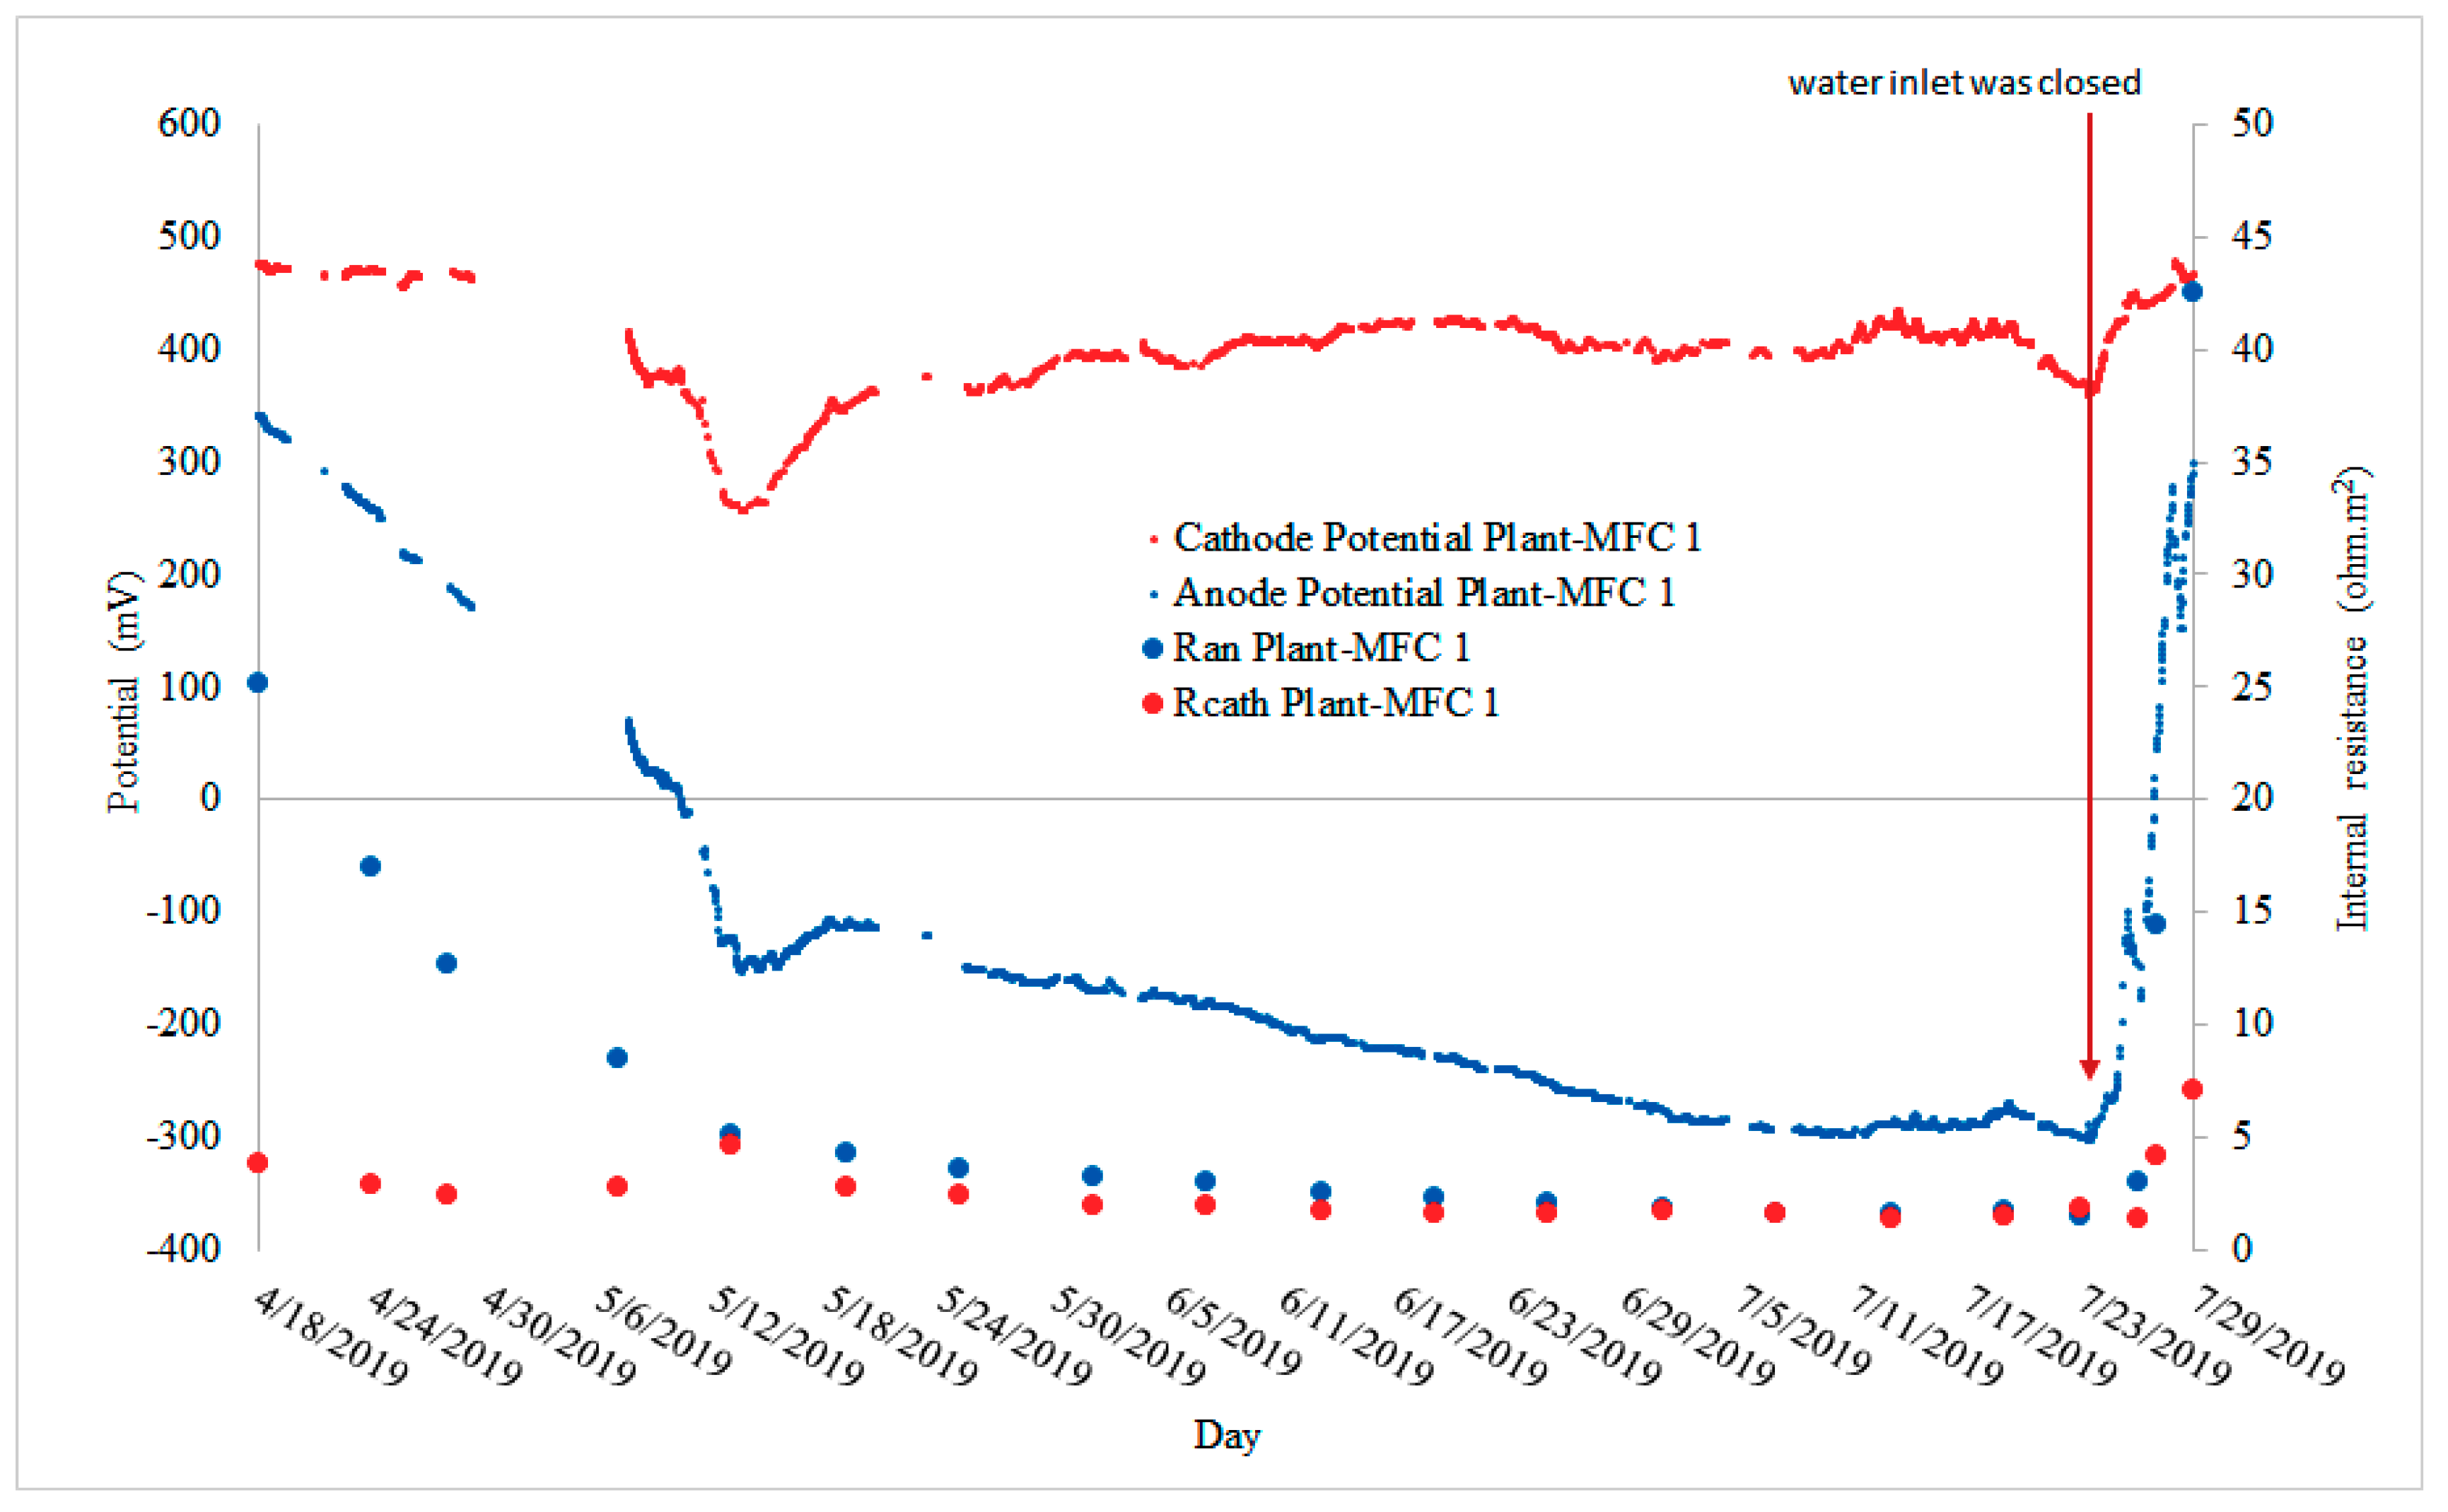
3.2. Continuous Power Production during the Rice Growing Season
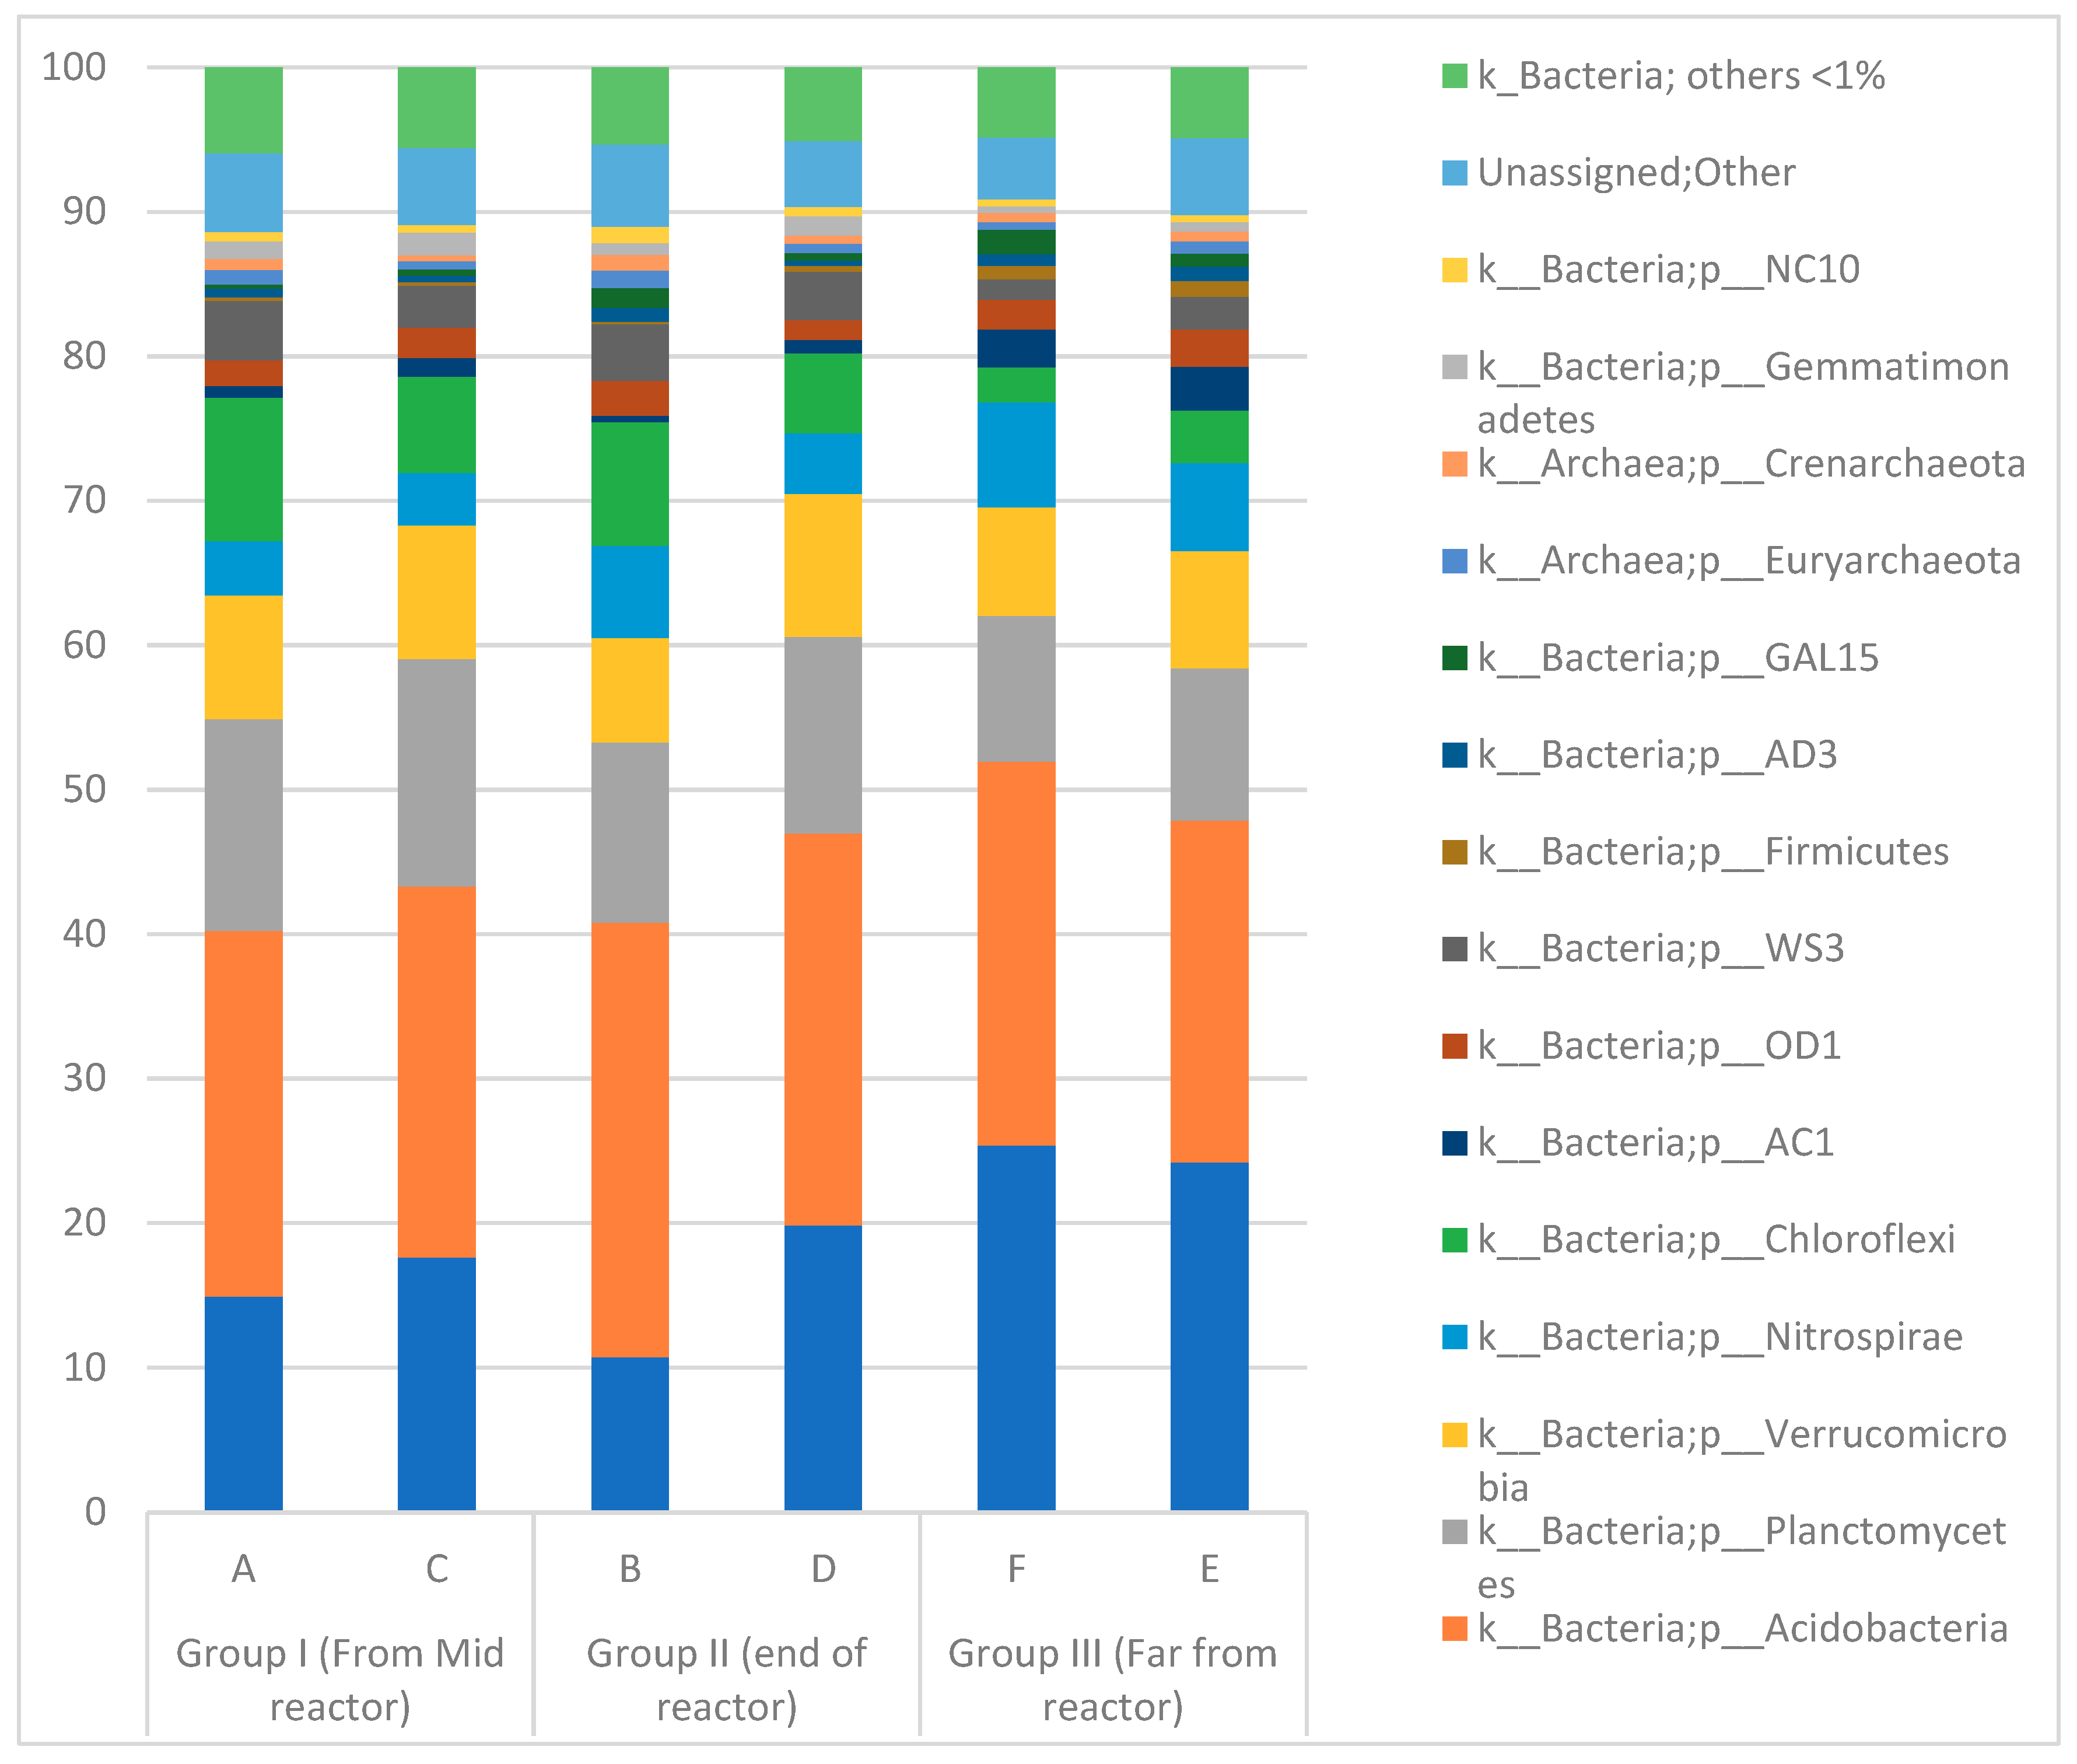
3.3. Microbial Community in the Paddy Field
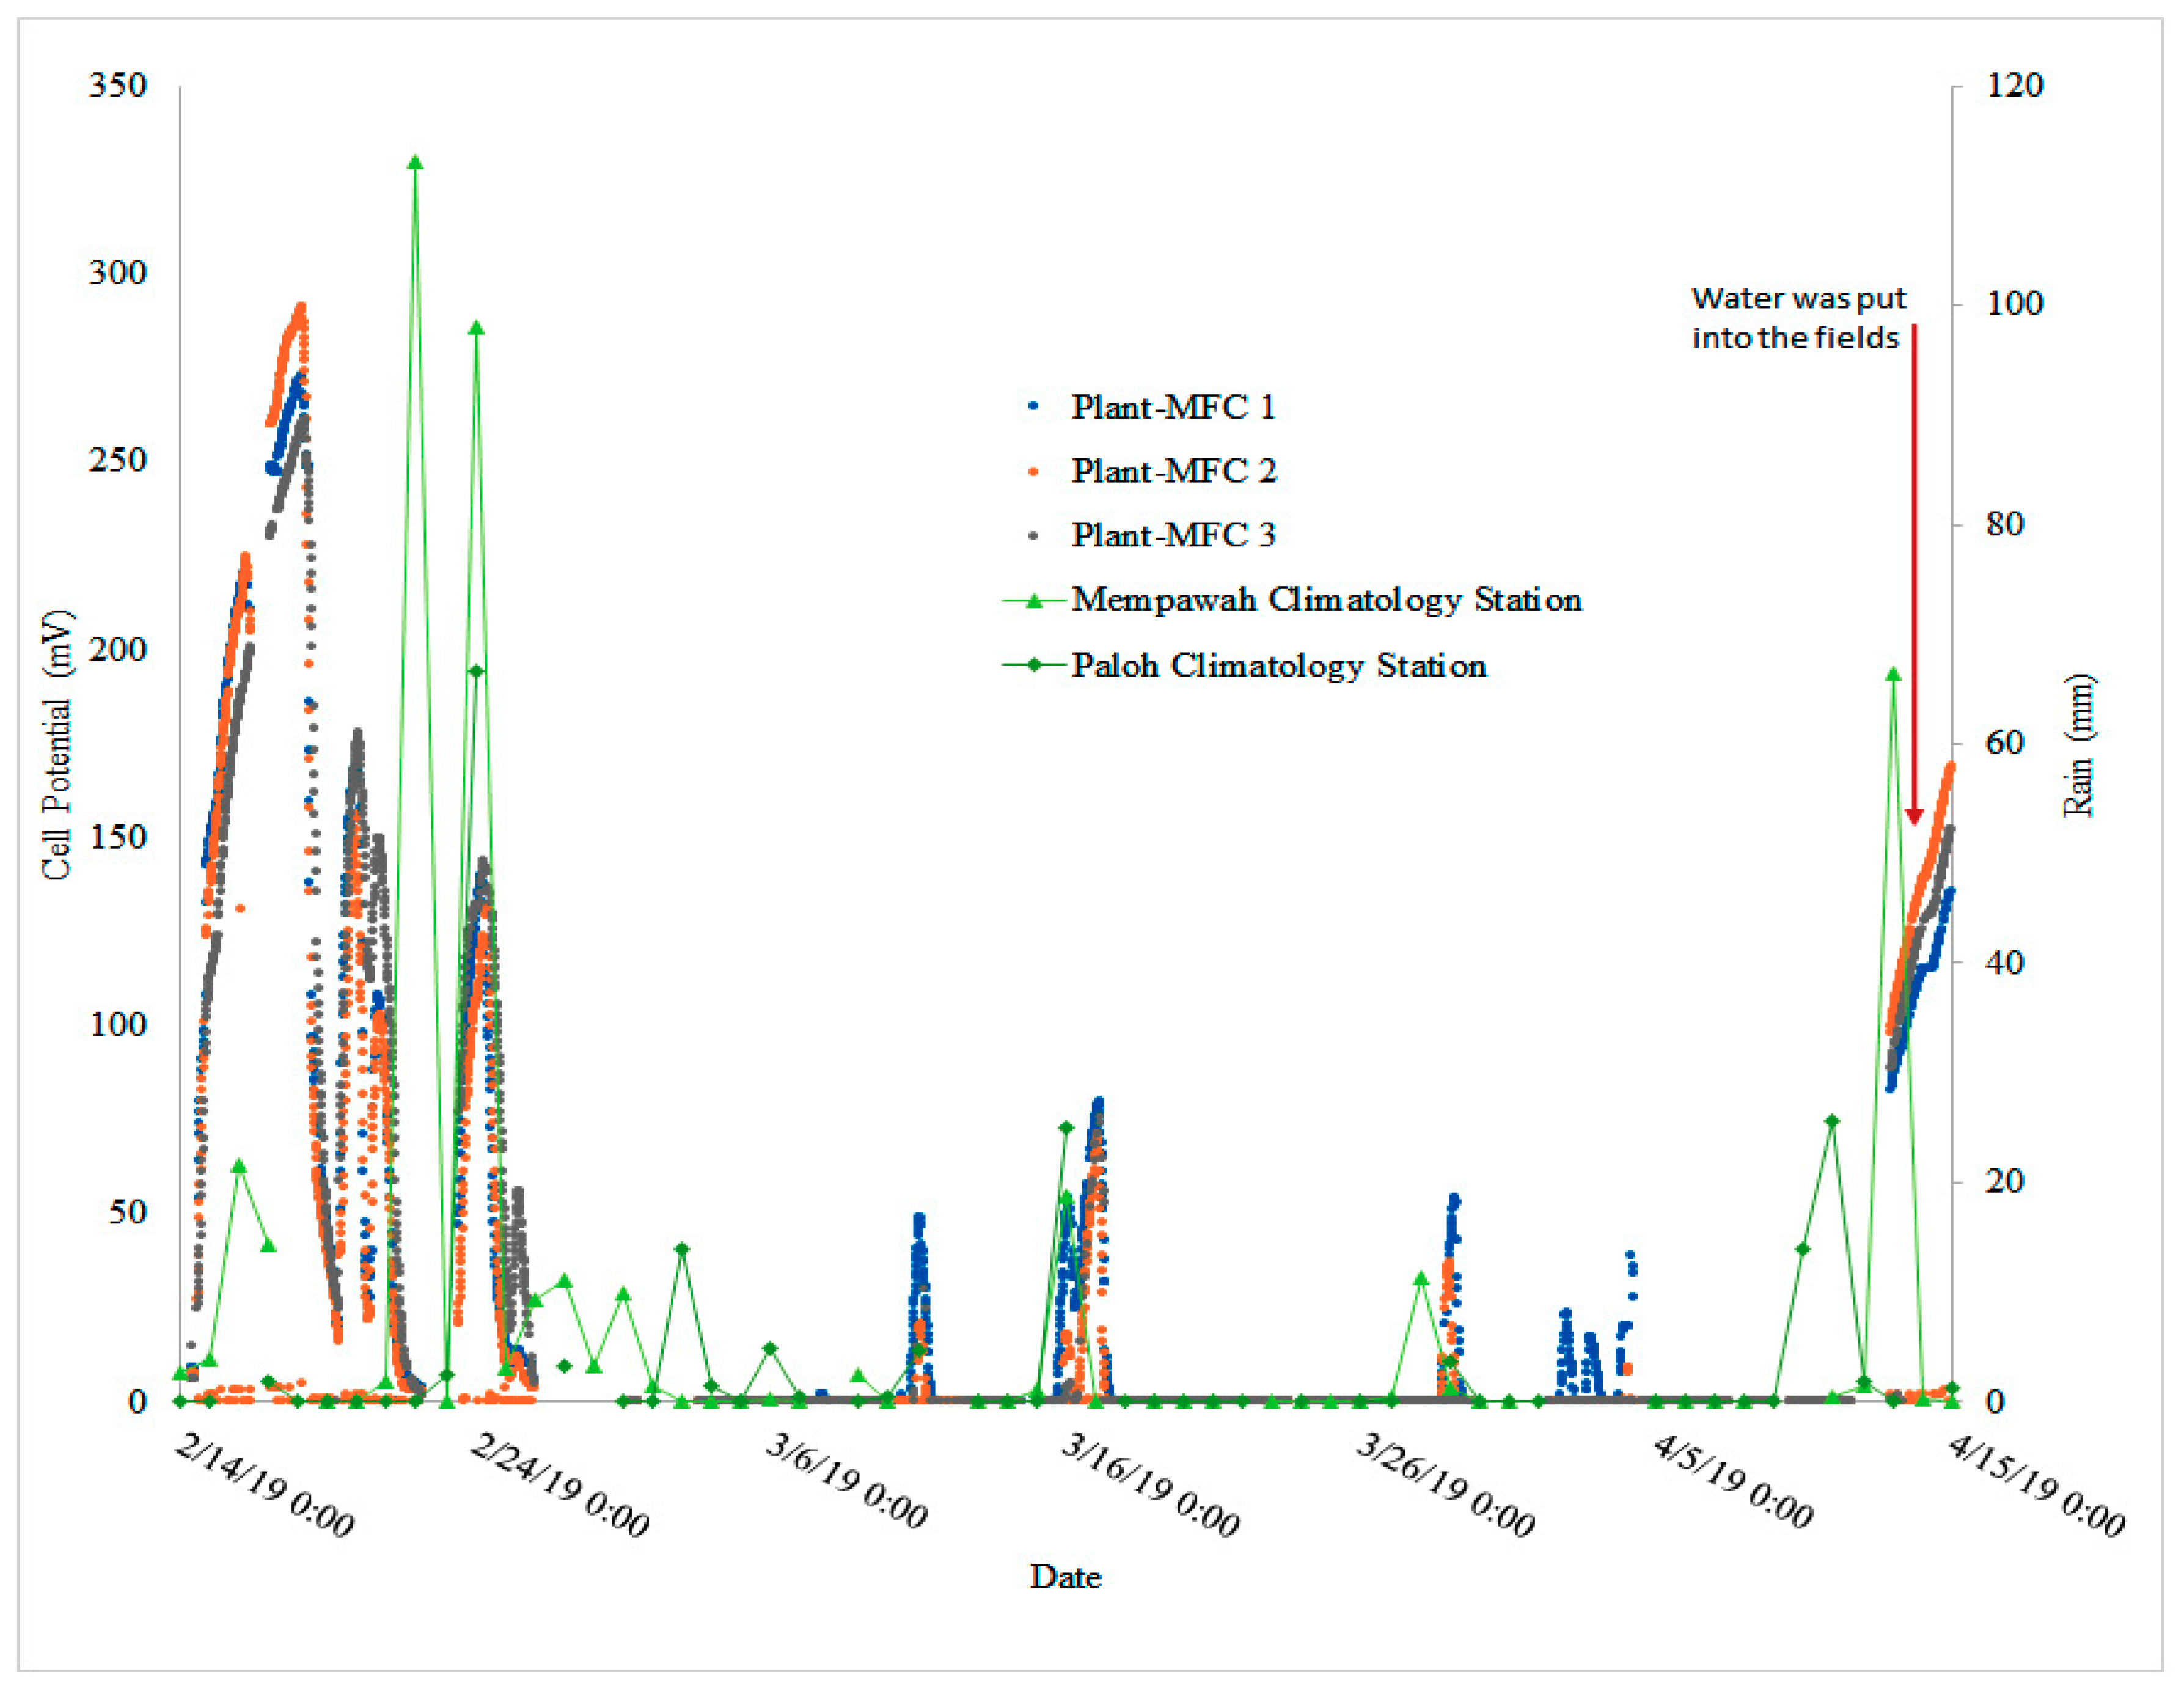
3.4. Plant-MFC Can Indicate a Rain Event as Biosensor
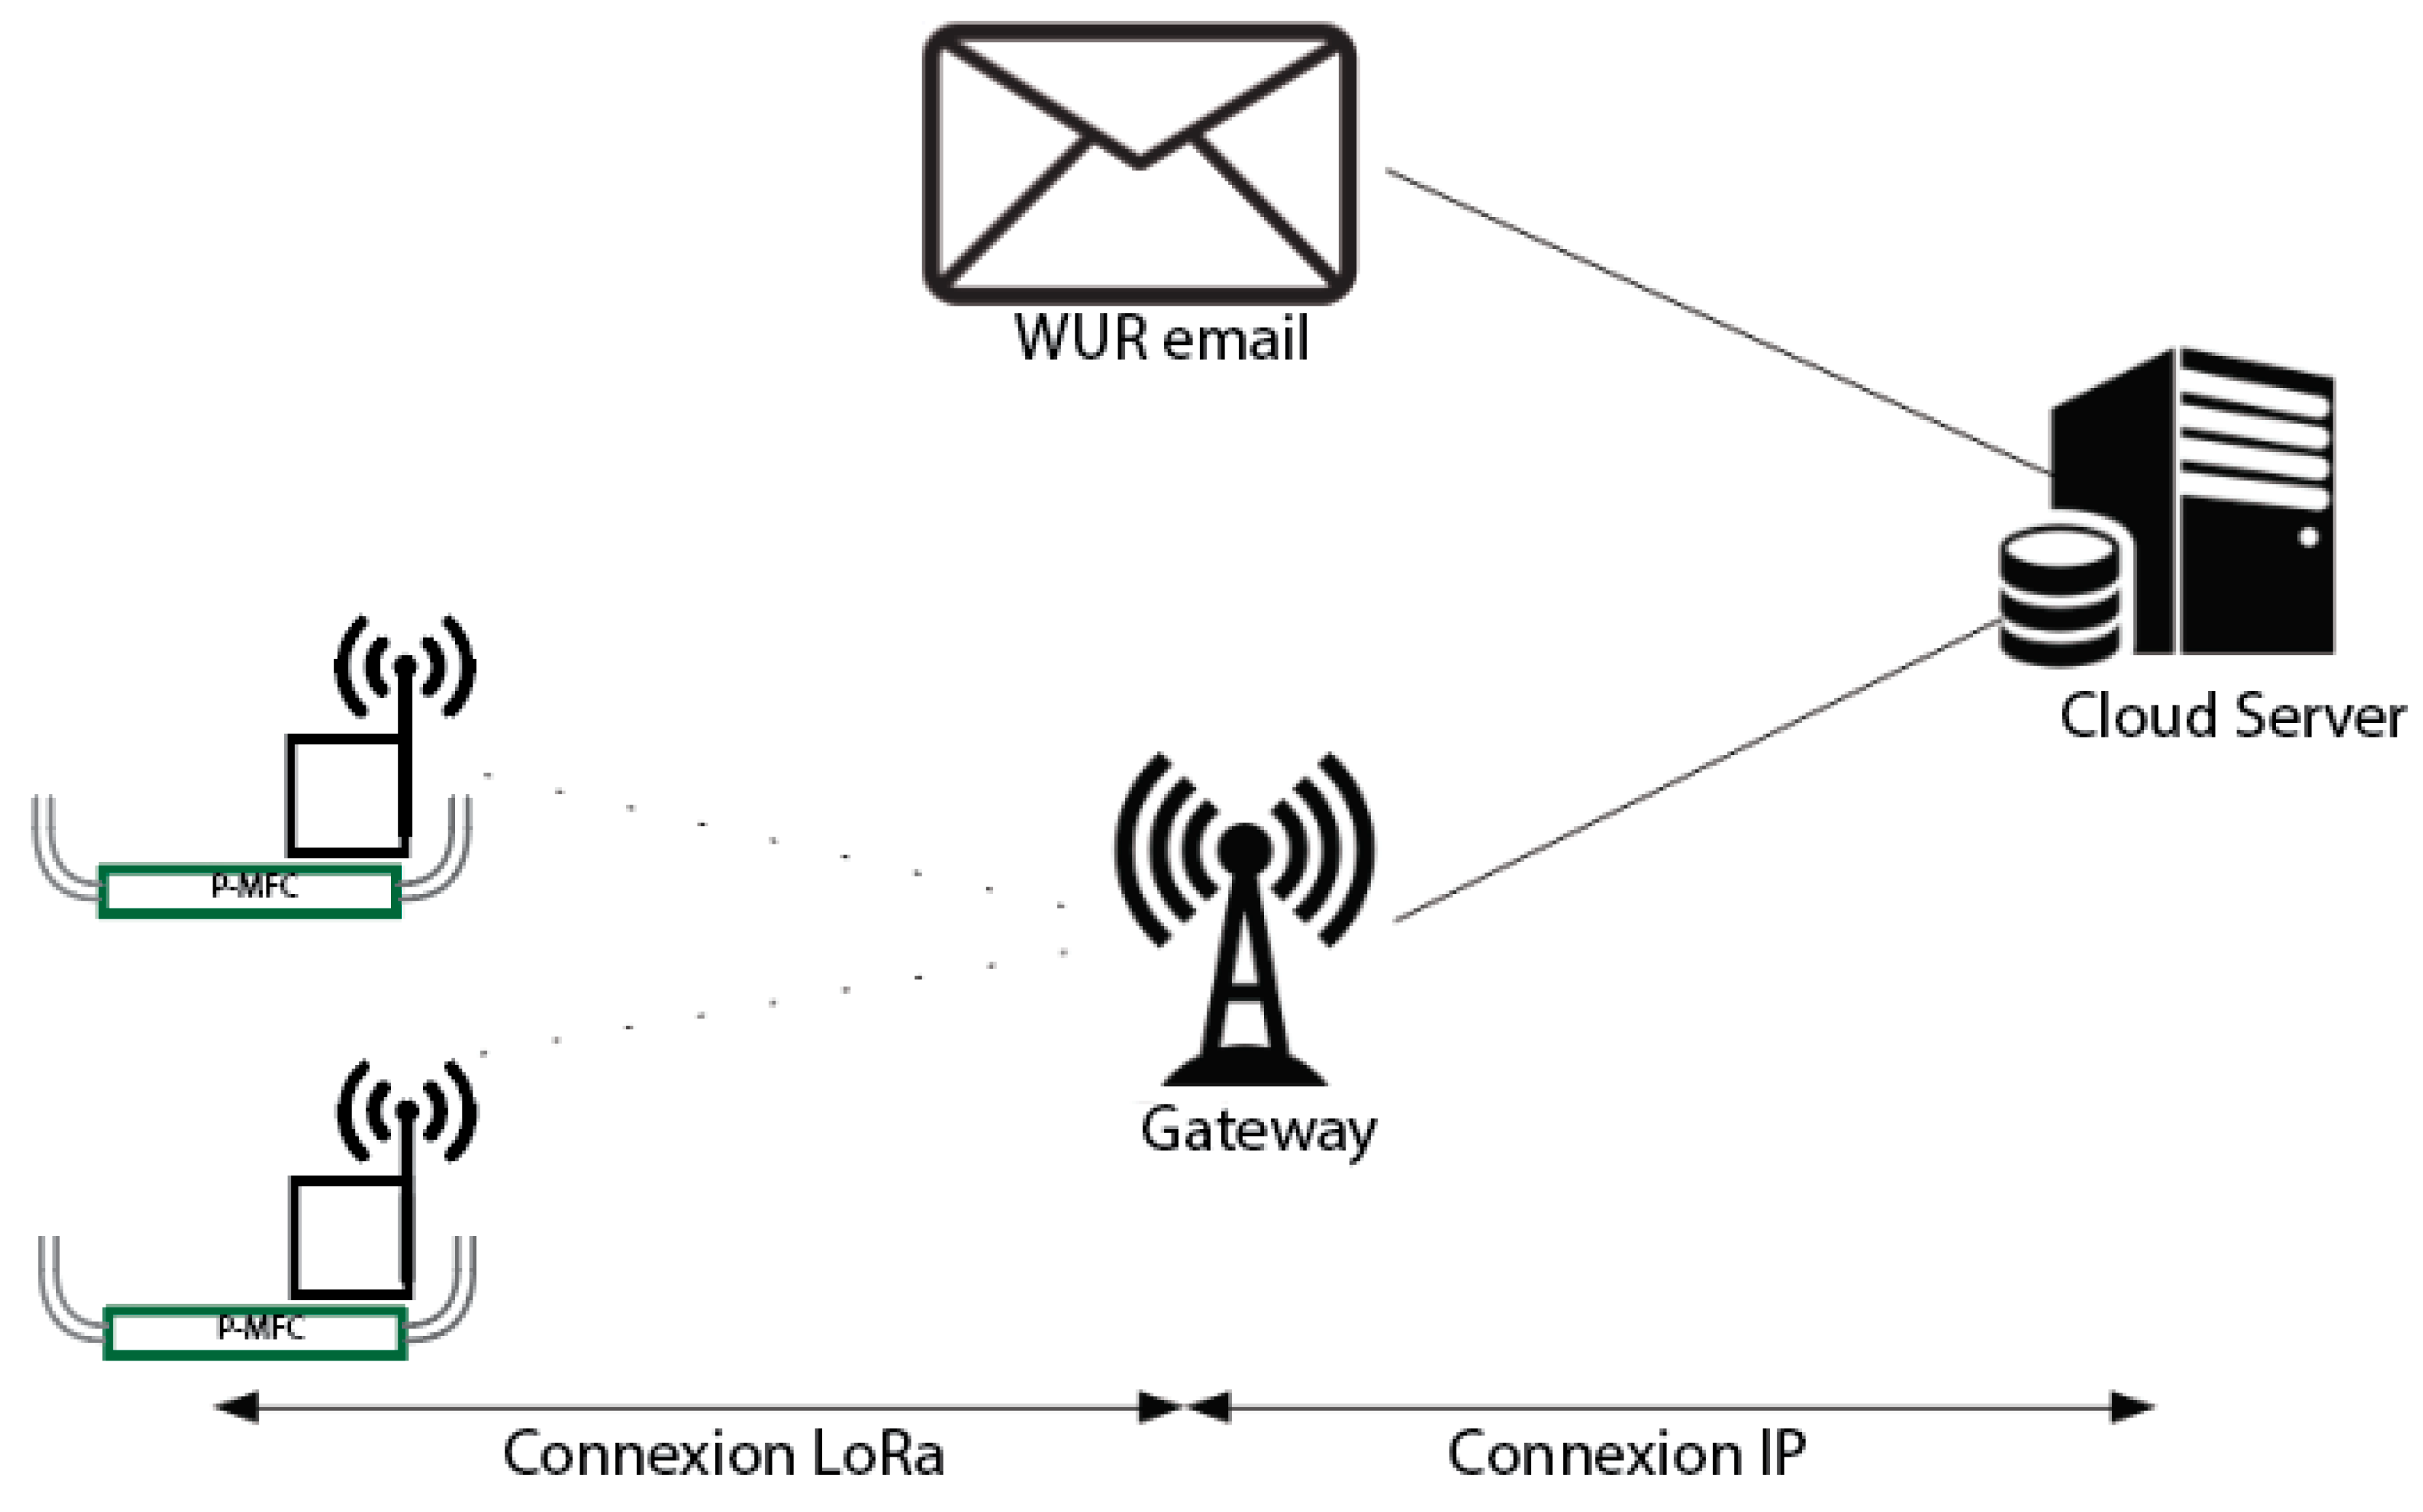
3.5. Data Acquisition via Low Range Network Integrated with 3G Network Enable Long Distance Auto Data Collection
4. Conclusions
5. Associated Content
Supplementary Materials
Author Contributions
Funding
Acknowledgments
Conflicts of Interest
References
- Strik, D.P.B.T.B.; Hamelers, H.V.M.; Snel, J.F.H.; Buisman, C.J.N. Green electricity production with living plants and bacteria in a fuel cell. Int. J. Energy Res. 2008, 32, 870–876. [Google Scholar] [CrossRef]
- Logan, B.E.; Hamelers, B.; Rozendal, R.; Schröder, U.; Keller, J.; Freguia, S.; Aelterman, P.; Verstraete, W.; Rabaey, K. Microbial Fuel Cells: Methodology and Technology. Environ. Sci. Technol. 2006, 40, 5181–5192. [Google Scholar] [CrossRef] [PubMed]
- Hamelers, H.V.M.; Ter Heijne, A.; Sleutels, T.H.J.A.; Jeremiasse, A.W.; Strik, D.P.B.T.B.; Buisman, C.J.N. New applications and performance of bioelectrochemical systems. Appl. Microbiol. Biotechnol. 2010, 85, 1673–1685. [Google Scholar] [CrossRef] [PubMed]
- Timmers, R.A.; Strik, D.P.B.T.B.; Hamelers, H.V.M.; Buisman, C.J.N. Characterization of the internal resistance of a plant microbial fuel cell. Electrochim. Acta 2012, 72, 165–171. [Google Scholar] [CrossRef]
- Ahn, J.-H.; Jeong, W.-S.; Choi, M.-Y.; Kim, B.-Y.; Song, J.; Weon, H.-Y. Phylogenetic Diversity of Dominant Bacterial and Archaeal Communities in Plant-Microbial Fuel Cells Using Rice Plants. J. Microbiol. Biotechnol. 2014, 24, 1707–1718. [Google Scholar] [CrossRef]
- Arends, J.B.A.; Speeckaert, J.; Blondeel, E.; De Vrieze, J.; Boeckx, P.; Verstraete, W.; Rabaey, K.; Boon, N. Greenhouse gas emissions from rice microcosms amended with a plant microbial fuel cell. Appl. Microbiol. Biotechnol. 2014, 98, 3205–3217. [Google Scholar] [CrossRef]
- Bombelli, P.; Iyer, D.M.R.; Covshoff, S.; McCormick, A.J.; Yunus, K.; Hibberd, J.M.; Fisher, A.C.; Howe, C.J. Comparison of power output by rice (Oryza sativa) and an associated weed (Echinochloa glabrescens) in vascular plant bio-photovoltaic (VP-BPV) systems. Appl. Microbiol. Biotechnol. 2013, 97, 429–438. [Google Scholar] [CrossRef]
- Chen, Z.; Huang, Y.; Liang, J.; Zhao, F.; Zhu, Y. A novel sediment microbial fuel cell with a biocathode in the rice rhizosphere. Bioresour. Technol. 2012, 108, 55–59. [Google Scholar] [CrossRef]
- Costanzo, E. The influence of an electric field on the growth of soy seedlings. J. Electrost. 2008, 66, 417–420. [Google Scholar] [CrossRef]
- De Schamphelaire, L.; Cabezas, A.; Marzorati, M.; Friedrich, M.W.; Boon, N.; Verstraete, W. Microbial Community Analysis of Anodes from Sediment Microbial Fuel Cells Powered by Rhizodeposits of Living Rice Plants. Appl. Environ. Microbiol. 2010, 76, 2002–2008. [Google Scholar] [CrossRef]
- Helder, M.; Strik, D.P.B.T.B.; Hamelers, H.V.M.; Kuhn, A.J.; Blok, C.; Buisman, C.J.N. Concurrent bio-electricity and biomass production in three Plant-Microbial Fuel Cells using Spartina anglica, Arundinella anomala and Arundo donax. Bioresour. Technol. 2010, 101, 3541–3547. [Google Scholar] [CrossRef] [PubMed]
- Schamphelaire, L.D.; Bossche, L.V.D.; Dang, H.S.; Höfte, M.; Boon, N.; Rabaey, K.; Verstraete, W. Microbial Fuel Cells Generating Electricity from Rhizodeposits of Rice Plants. Environ. Sci. Technol. 2008, 42, 3053–3058. [Google Scholar] [CrossRef] [PubMed]
- Sudirjo, E.; Buisman, C.J.N.; Strik, D.P.B.T.B. Activated Carbon Mixed with Marine Sediment is Suitable as Bioanode Material for Spartina anglica Sediment/Plant Microbial Fuel Cell: Plant Growth, Electricity Generation, and Spatial Microbial Community Diversity. Water 2019, 11, 1810. [Google Scholar] [CrossRef]
- Timmers, R.A.; Strik, D.P.B.T.B.; Hamelers, H.V.M.; Buisman, C.J.N. Long-term performance of a plant microbial fuel cell with Spartina anglica. Appl. Microbiol. Biotechnol. 2010, 86, 973–981. [Google Scholar] [CrossRef] [PubMed]
- Wetser, K.; Sudirjo, E.; Buisman, C.J.N.; Strik, D.P.B.T.B. Electricity generation by a plant microbial fuel cell with an integrated oxygen reducing biocathode. Appl. Energy 2015, 137, 151–157. [Google Scholar] [CrossRef]
- Wetser, K.; Liu, J.; Buisman, C.; Strik, D. Plant microbial fuel cell applied in wetlands: Spatial, temporal and potential electricity generation of Spartina anglica salt marshes and Phragmites australis peat soils. Biomass Bioenergy 2015, 83, 543–550. [Google Scholar] [CrossRef]
- Wetser, K.; Dieleman, K.; Buisman, C.; Strik, D. Electricity from wetlands: Tubular plant microbial fuels with silicone gas-diffusion biocathodes. Appl. Energy 2017, 185, 642–649. [Google Scholar] [CrossRef]
- Kaku, N.; Yonezawa, N.; Kodama, Y.; Watanabe, K. Plant/microbe cooperation for electricity generation in a rice paddy field. Appl. Microbiol. Biotechnol. 2008, 79, 43–49. [Google Scholar] [CrossRef]
- Kouzuma, A.; Kasai, T.; Nakagawa, G.; Yamamuro, A.; Abe, T.; Watanabe, K. Comparative Metagenomics of Anode-Associated Microbiomes Developed in Rice Paddy-Field Microbial Fuel Cells. PLoS ONE 2013, 8, e77443. [Google Scholar] [CrossRef]
- Kouzuma, A.; Kaku, N.; Watanabe, K. Microbial electricity generation in rice paddy fields: Recent advances and perspectives in rhizosphere microbial fuel cells. Appl. Microbiol. Biotechnol. 2014, 98, 9521–9526. [Google Scholar] [CrossRef]
- Schievano, A.; Colombo, A.; Grattieri, M.; Trasatti, S.P.; Liberale, A.; Tremolada, P.; Pino, C.; Cristiani, P. Floating microbial fuel cells as energy harvesters for signal transmission from natural water bodies. J. Power Sources 2017, 340, 80–88. [Google Scholar] [CrossRef]
- Takanezawa, K.; Nishio, K.; Kato, S.; Hashimoto, K.; Watanabe, K. Factors Affecting Electric Output from Rice-Paddy Microbial Fuel Cells. Biosci. Biotechnol. Biochem. 2010, 74, 1271–1273. [Google Scholar] [CrossRef] [PubMed]
- Ueoka, N.; Sese, N.; Sue, M.; Kouzuma, A.; Watanabe, K. Sizes of Anode and Cathode Affect Electricity Generation in Rice Paddy-Field Microbial Fuel Cells. J. Sustain. Bioenergy Syst. 2016, 6, 10–15. [Google Scholar] [CrossRef]
- Timmers, R.A.; Strik, D.P.B.T.B.; Hamelers, H.V.M.; Buisman, C.J.N. Electricity generation by a novel design tubular plant microbial fuel cell. Biomass Bioenergy 2013, 51, 60–67. [Google Scholar] [CrossRef]
- Wetser, K. Electricity from Wetlands: Technology Assessment of the Tubular Plant Microbial Fuel Cell with an Integrated Biocathode. Ph.D. Thesis, Wageningen University & Research, Wageningen, The Netherlands, 2016. [Google Scholar]
- FAO of the U.N. FAOSTAT. 2019. Available online: http://www.fao.org/faostat/en/#data/QC/visualize (accessed on 14 August 2019).
- Md Khudzari, J.; Gariépy, Y.; Kurian, J.; Tartakovsky, B.; Raghavan, G.S.V. Effects of biochar anodes in rice plant microbial fuel cells on the production of bioelectricity, biomass, and methane. Biochem. Eng. J. 2019, 141, 190–199. [Google Scholar] [CrossRef]
- Augustin, A.; Yi, J.; Clausen, T.; Townsley, M.W. A Study of LoRa: Long Range & Low Power Networks for the Internet of Things. Sensors 2016, 16, 1466. [Google Scholar]
- Petäjäjärvi, J.; Mikhaylov, K.; Pettissalo, M.; Janhunen, J.; Iinatti, J. Performance of a low-power wide-area network based on LoRa technology: Doppler robustness, scalability, and coverage. Int. J. Distrib. Sens. Netw. 2017, 13, 1550147717699412. [Google Scholar] [CrossRef]
- Sanchez-Iborra, R.; Sanchez-Gomez, J.; Ballesta-Viñas, J.; Cano, M.-D.; Skarmeta, F.A. Performance Evaluation of LoRa Considering Scenario Conditions. Sensors 2018, 18, 772. [Google Scholar] [CrossRef]
- IRRI. Steps to Successful Rice Production; International Rice Research Institute: Los Baños, Philippines, 2015; ISBN 978-971-22-0313-8. [Google Scholar]
- IRRI. Growing Rice, Cultivating Partnerships: 40 Years of Indonesia-IRRI Collaboration; International Rice Research Institute: Los Baños, Philippines, 2015. [Google Scholar]
- BBPADI. Inpari 30 Ciherang Sub 1. Available online: http://bbpadi.litbang.pertanian.go.id/index.php/varietas-padi/inbrida-padi-sawah-inpari/inpari-30-ciherang-sub-1 (accessed on 19 August 2019).
- 1st BASE. Next Generation Sequencing (NGS) Project Report for NGS Order ID 10419; Axil Scientific Pte Ltd.: Singapore, 2018; p. 7. [Google Scholar]
- Mano, M. Precise and continuous measurement of plant heights in an agricultural field using a time-lapse camera. J. Agric. Meteorol. 2017, 73, 100–108. [Google Scholar] [CrossRef]
- Roger, P. The impact of pesticides on wetland rice field microflora: A review. In Impact of Pesticides on Farmer Health and the Rice Environment; International Rice Research Institute: Los Baños, Philippines; Kluwer Academic Publishers: Norwell, MA, USA, 1995; pp. 271–308. ISBN 0-7923-9522-0. [Google Scholar]
- Cao, X.; Song, H.; Yu, C.; Li, X. Simultaneous degradation of toxic refractory organic pesticide and bioelectricity generation using a soil microbial fuel cell. Bioresour. Technol. 2015, 189, 87–93. [Google Scholar] [CrossRef]
- Moqsud, M.A.; Yoshitake, J.; Bushra, Q.S.; Hyodo, M.; Omine, K.; Strik, D. Compost in plant microbial fuel cell for bioelectricity generation. Waste Manag. 2015, 36, 63–69. [Google Scholar] [CrossRef] [PubMed]
- Wang, L.; Xie, B.; Gao, N.; Min, B.; Liu, H. Urea removal coupled with enhanced electricity generation in single-chambered microbial fuel cells. Environ. Sci. Pollut. Res. 2017, 24, 20401–20408. [Google Scholar] [CrossRef] [PubMed]
- Kuntke, P.; Śmiech, K.M.; Bruning, H.; Zeeman, G.; Saakes, M.; Sleutels, T.H.J.A.; Hamelers, H.V.M.; Buisman, C.J.N. Ammonium recovery and energy production from urine by a microbial fuel cell. Water Res. 2012, 46, 2627–2636. [Google Scholar] [CrossRef] [PubMed]
- Lin, B.; Lu, Y. Bacterial and archaeal guilds associated with electrogenesis and methanogenesis in paddy field soil. Geoderma 2015, 259–260, 362–369. [Google Scholar] [CrossRef]
- Roe, G.H. OROGRAPHIC PRECIPITATION. Annu. Rev. Earth Planet. Sci. 2004, 33, 645–671. [Google Scholar] [CrossRef]
- Strik, D.P.B.T.B.; Picot, M.; Buisman, C.J.N.; Barriere, F. pH and Temperature Determine Performance of Oxygen Reducing Biocathodes. Electroanalysis 2013, 25, 652–655. [Google Scholar] [CrossRef]
| Crop Season | Transplantation (Date) | Harvesting (Date) | Applied Load Plant-MFC (ohm) | Electricity Measurement |
|---|---|---|---|---|
| I | 6 November 2017 | 10 February 2018 | 470 | Multimeter |
| II | 16 May 2018 | 6 August 2018 | 470 | Multimeter |
| II | 8 November 2018 | 13 February 2019 | 470 | Multimeter |
| IV | 13 May 2019 | 7 August 2019 | 1000 | LORA |
| Location | 3rd Crop Season | 4th Crop Season |
|---|---|---|
| Above Plant-MFC | 3 ± 0.5 | 4.6 ± 0.7 |
| One meter from Plant-MFC | 2.3 ± 0.5 | 3.4 ± 0.8 |
| Plant-MFC Types, Anode and Cathode Materials | Plant Species | Maximum Power Density (mW/m2 PGA) | Reference |
|---|---|---|---|
| Paddy field Anode: Graphite felt below the soil surface Graphite felt above the soil surface, air cathode | Rice (Oryza sativa) | 6 | [18] |
| Lab, Container Plant-MFC Anode: graphite mat and graphite rod Cathode: graphite granule, graphite rod, 100 mM K3Fe(CN)6 | Rice (Oryza sativa) | 30 | [12] |
| Paddy field Anode: Graphite felt Cathode: Graphite felt modified with platinum catalyst, air cathode | Rice (Oryza sativa) | 14 | [22] |
| Paddy field Anode: graphite felt Cathode: graphite felt modified with platinum catalyst, air cathode | Rice (Oryza sativa) | 19 | [19] |
| Paddy field Anode: Graphite felt Cathode: Graphite felt with platinum catalyst modified with polystyrene-foam bars to maintain buoyancy | Rice (Oryza sativa) | 80 | [20] |
| Lab-Perspex tubes Anode: graphite granule, vermiculite, carbon rod. Cathode: graphite felt interwoven carbon felt, air cathode | Rice (Oryza sativa) | 72 | [6] |
| Rice paddy-field MFC Anode: Circular graphite felt Cathode: Graphite felt with platinum catalyst, air cathode | Rice (Oryza sativa) | 140 | [23] |
| PVC Pot Plant-MFC Anode: graphite felt interwoven with copper wire, soil from paddy field Cathode: graphite felt interwoven with copper wire, air cathode | Rice (Oryza sativa) | 4.5 | [41] |
| Lab-tubular Plant-MFC from PVC with membrane Anode: graphite felt, graphite granule, golden wire Cathode: thick graphite felt, golden wire current collector, 5 mol.m−3 K3Fe(CN)6 | Reed mannagrass (Glyceria maxima) | 18 12 * | [24] |
| Tubular Plant-MFC with membrane and silicone gas diffusion layer in a lab constructed wetland. Anode: graphite felt and graphite stick Cathode: graphite felt with golden wire current collector, air cathode | Phragmites australis Spartine anglica | 22 a 82 a | [17] |
| Tubular Plant-MFC without membrane with silicone tube air way in paddy field. Anode: graphite felt and titanium wire current collector Cathode: graphite felt and titanium wire current collector, air cathode | Rice (Oryza sativa) | 44 9.6 a 8.5 b | This study |
© 2019 by the authors. Licensee MDPI, Basel, Switzerland. This article is an open access article distributed under the terms and conditions of the Creative Commons Attribution (CC BY) license (http://creativecommons.org/licenses/by/4.0/).
Share and Cite
Sudirjo, E.; de Jager, P.; Buisman, C.J.N.; Strik, D.P.B.T.B. Performance and Long Distance Data Acquisition via LoRa Technology of a Tubular Plant Microbial Fuel Cell Located in a Paddy Field in West Kalimantan, Indonesia. Sensors 2019, 19, 4647. https://doi.org/10.3390/s19214647
Sudirjo E, de Jager P, Buisman CJN, Strik DPBTB. Performance and Long Distance Data Acquisition via LoRa Technology of a Tubular Plant Microbial Fuel Cell Located in a Paddy Field in West Kalimantan, Indonesia. Sensors. 2019; 19(21):4647. https://doi.org/10.3390/s19214647
Chicago/Turabian StyleSudirjo, Emilius, Pim de Jager, Cees J.N. Buisman, and David P.B.T.B. Strik. 2019. "Performance and Long Distance Data Acquisition via LoRa Technology of a Tubular Plant Microbial Fuel Cell Located in a Paddy Field in West Kalimantan, Indonesia" Sensors 19, no. 21: 4647. https://doi.org/10.3390/s19214647
APA StyleSudirjo, E., de Jager, P., Buisman, C. J. N., & Strik, D. P. B. T. B. (2019). Performance and Long Distance Data Acquisition via LoRa Technology of a Tubular Plant Microbial Fuel Cell Located in a Paddy Field in West Kalimantan, Indonesia. Sensors, 19(21), 4647. https://doi.org/10.3390/s19214647


