A Critical Step to Using a Parametric Array Loudspeaker in Mobile Devices


Abstract
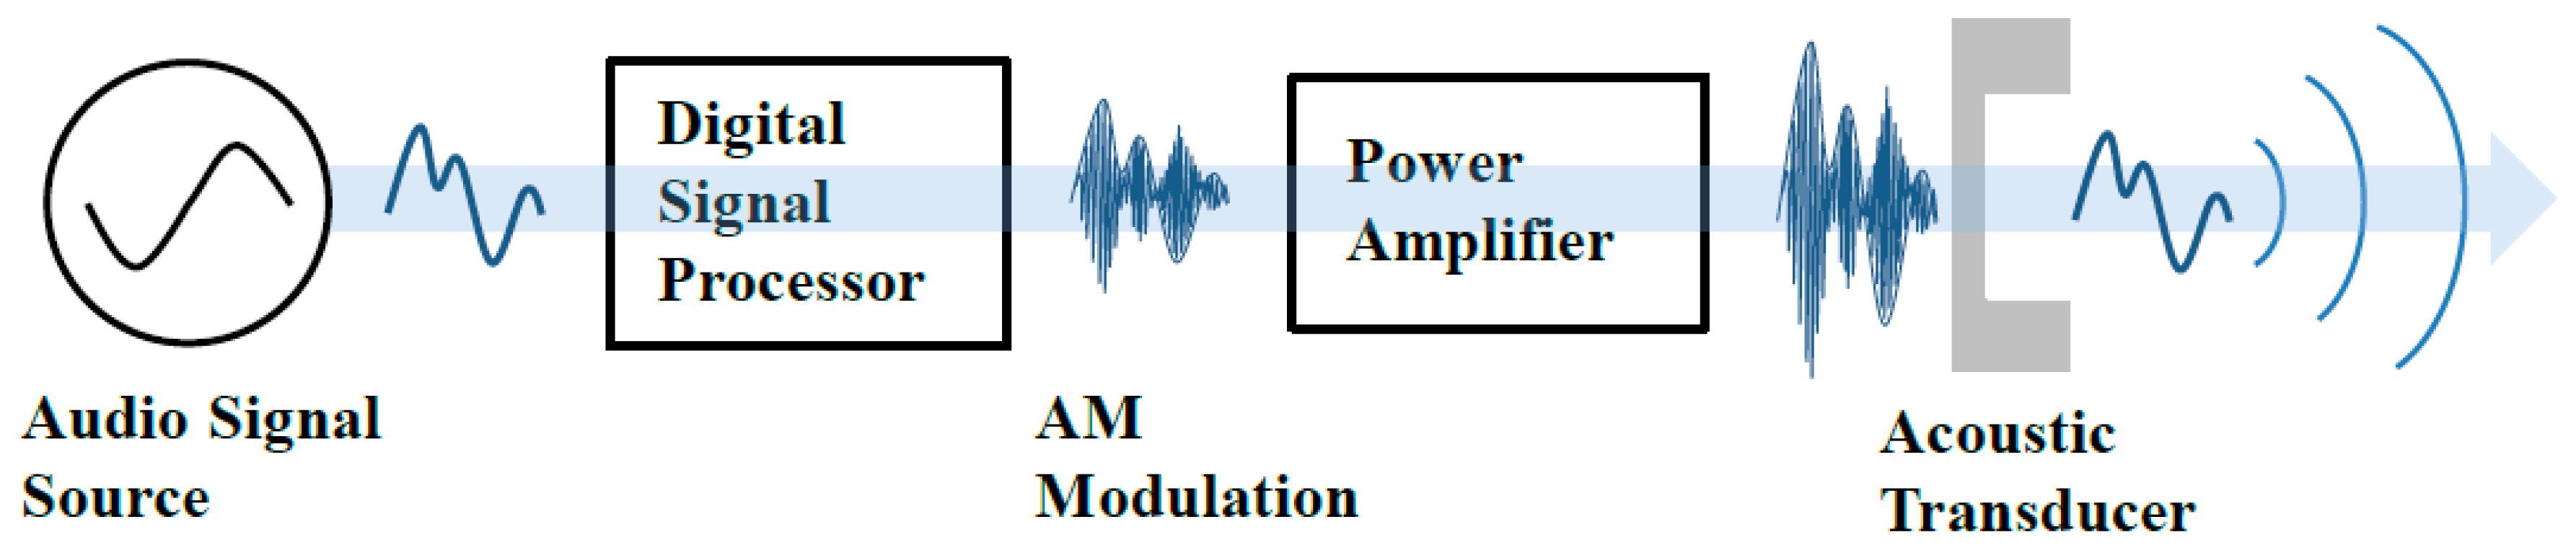
:1. Introduction
2. Requirements of the Parametric Array Loudspeaker
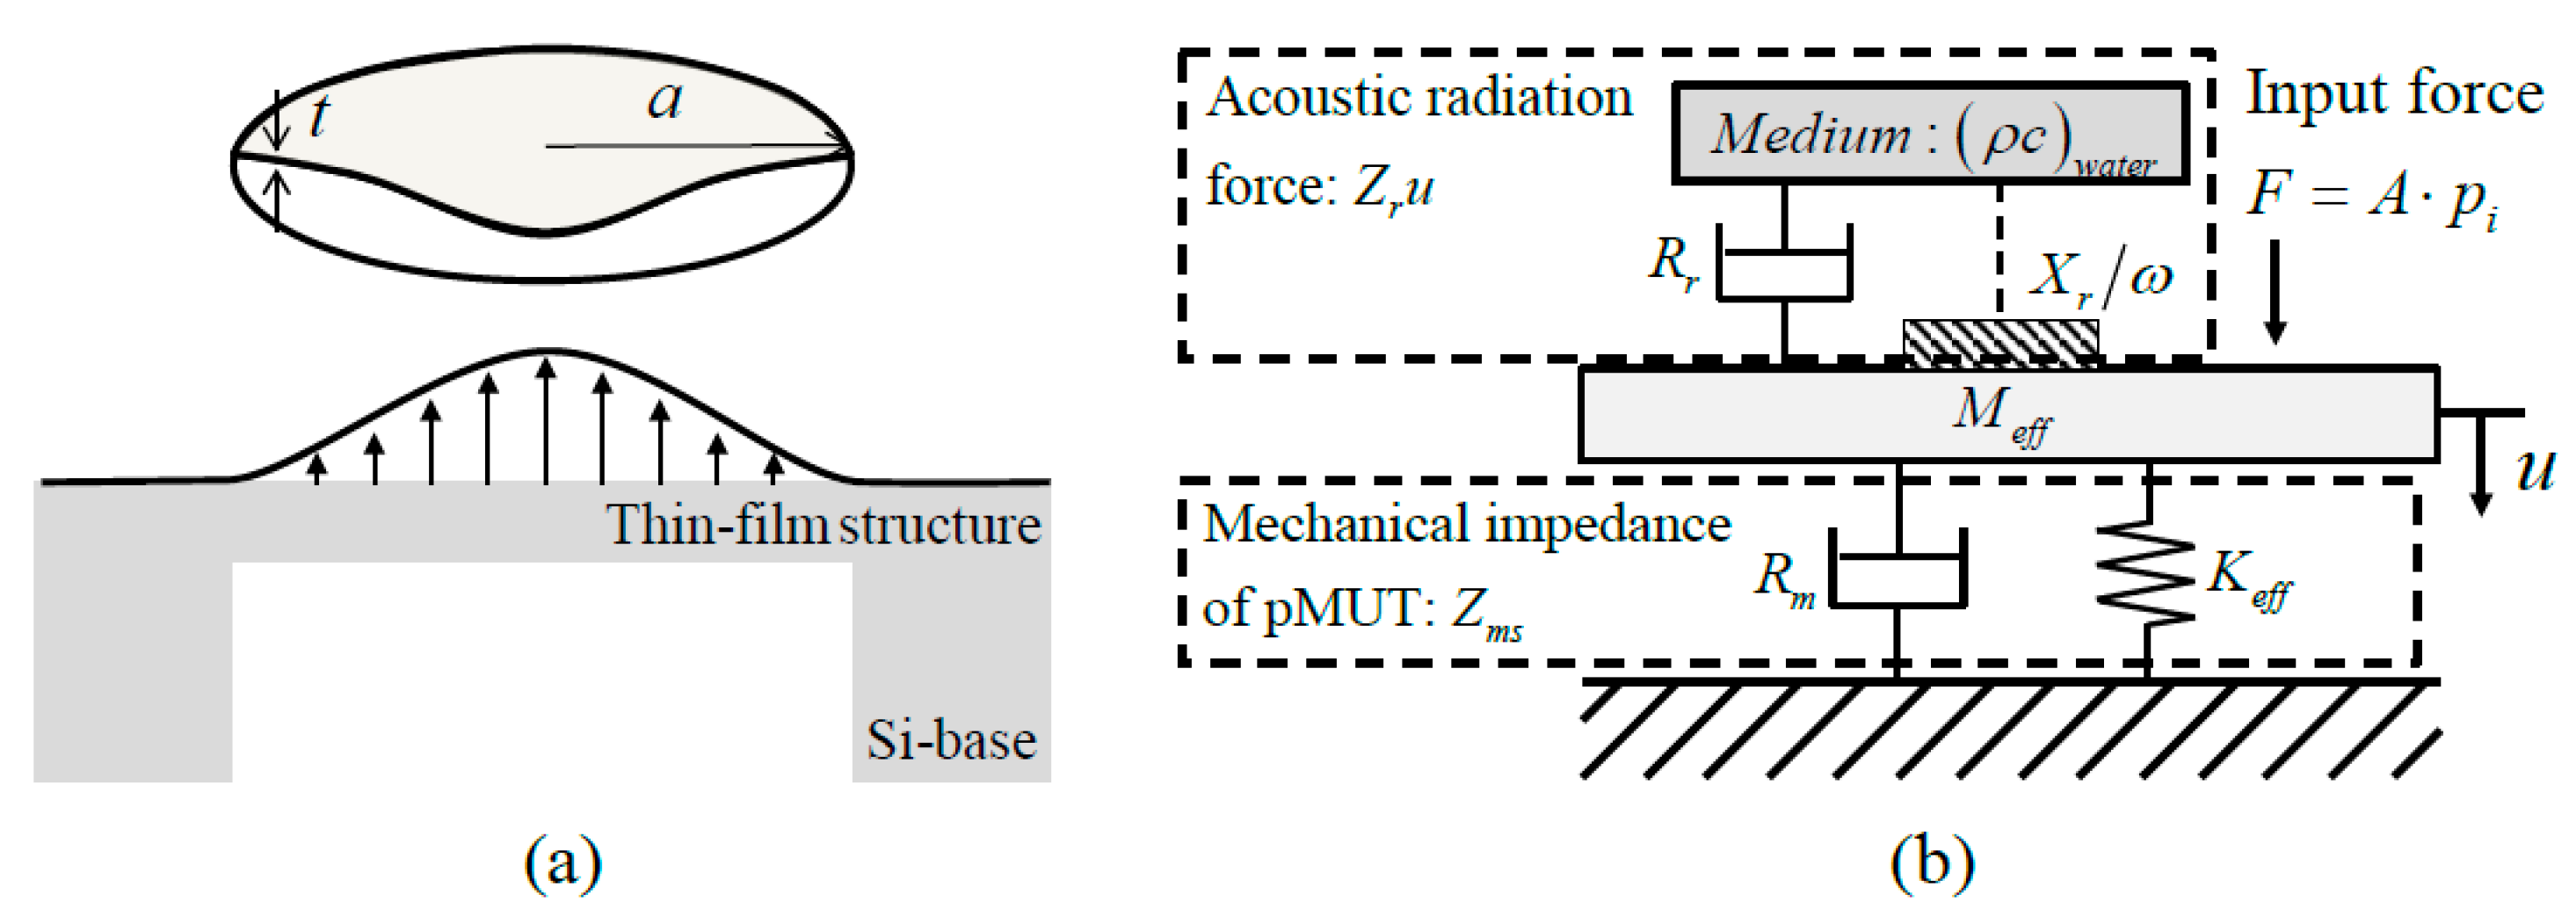
2.1. Piezoelectric Micromachined Ultrasonic Transducer
2.1.1. Design Requirements
2.1.2. pMUT Design
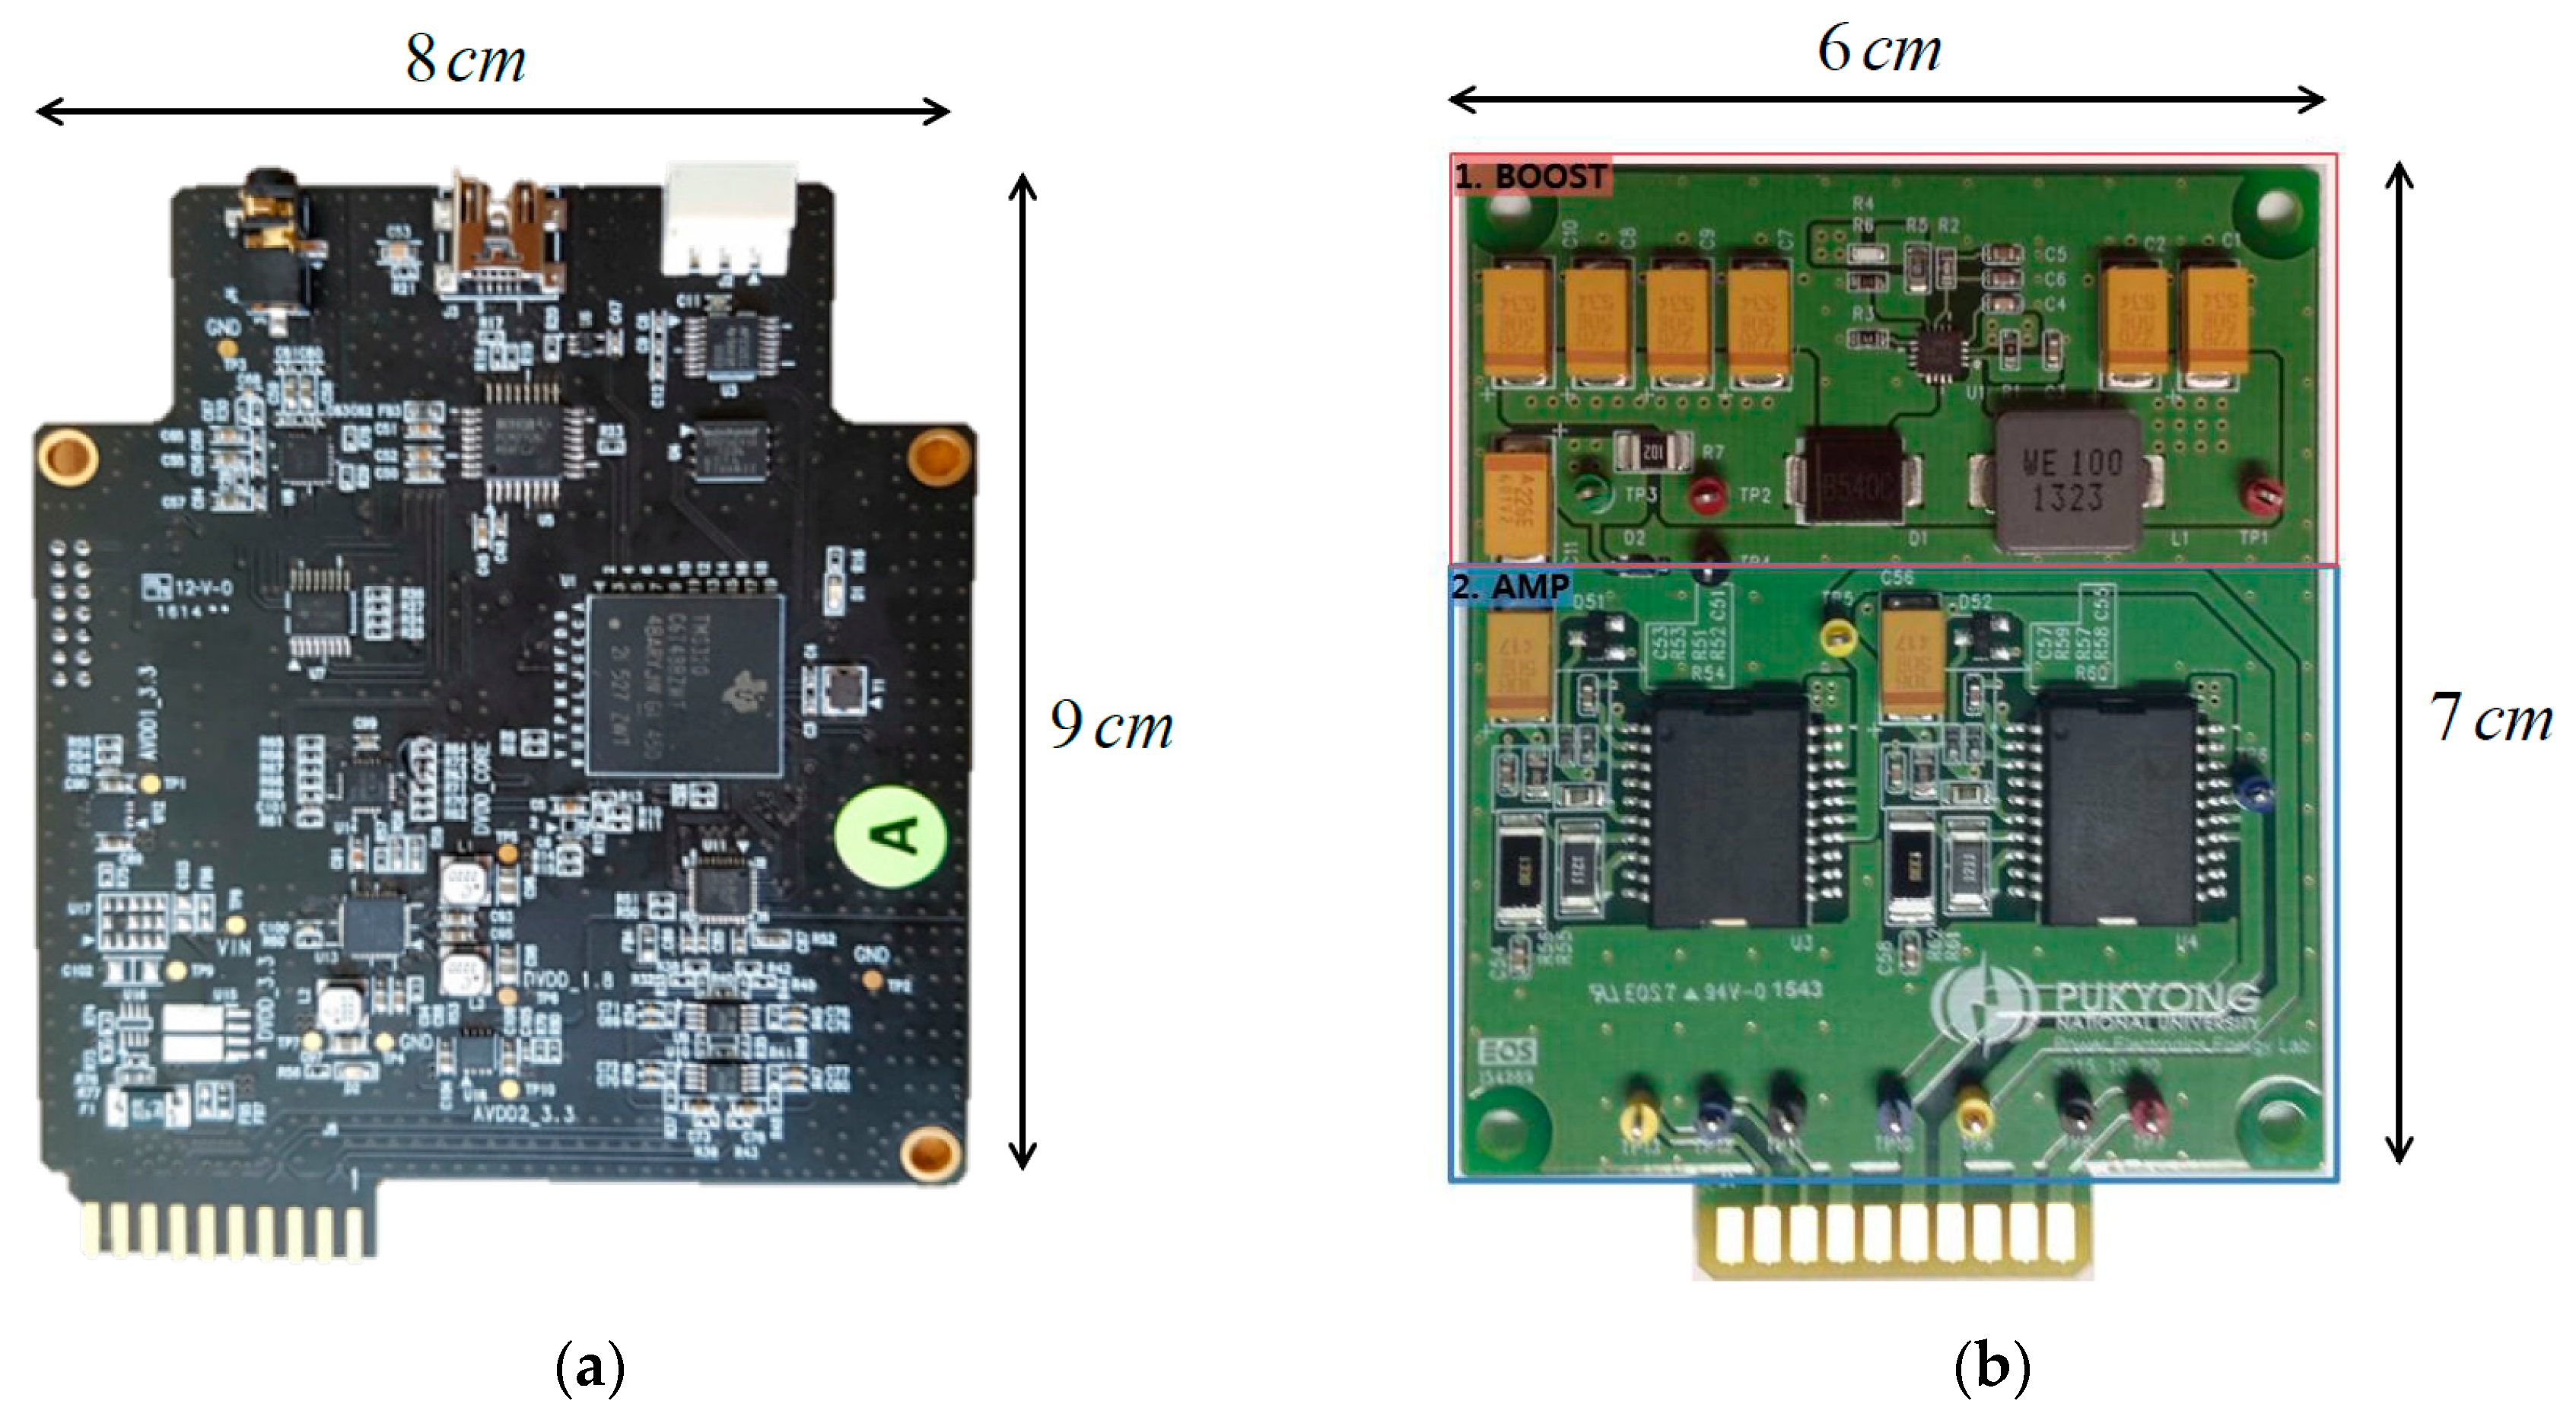
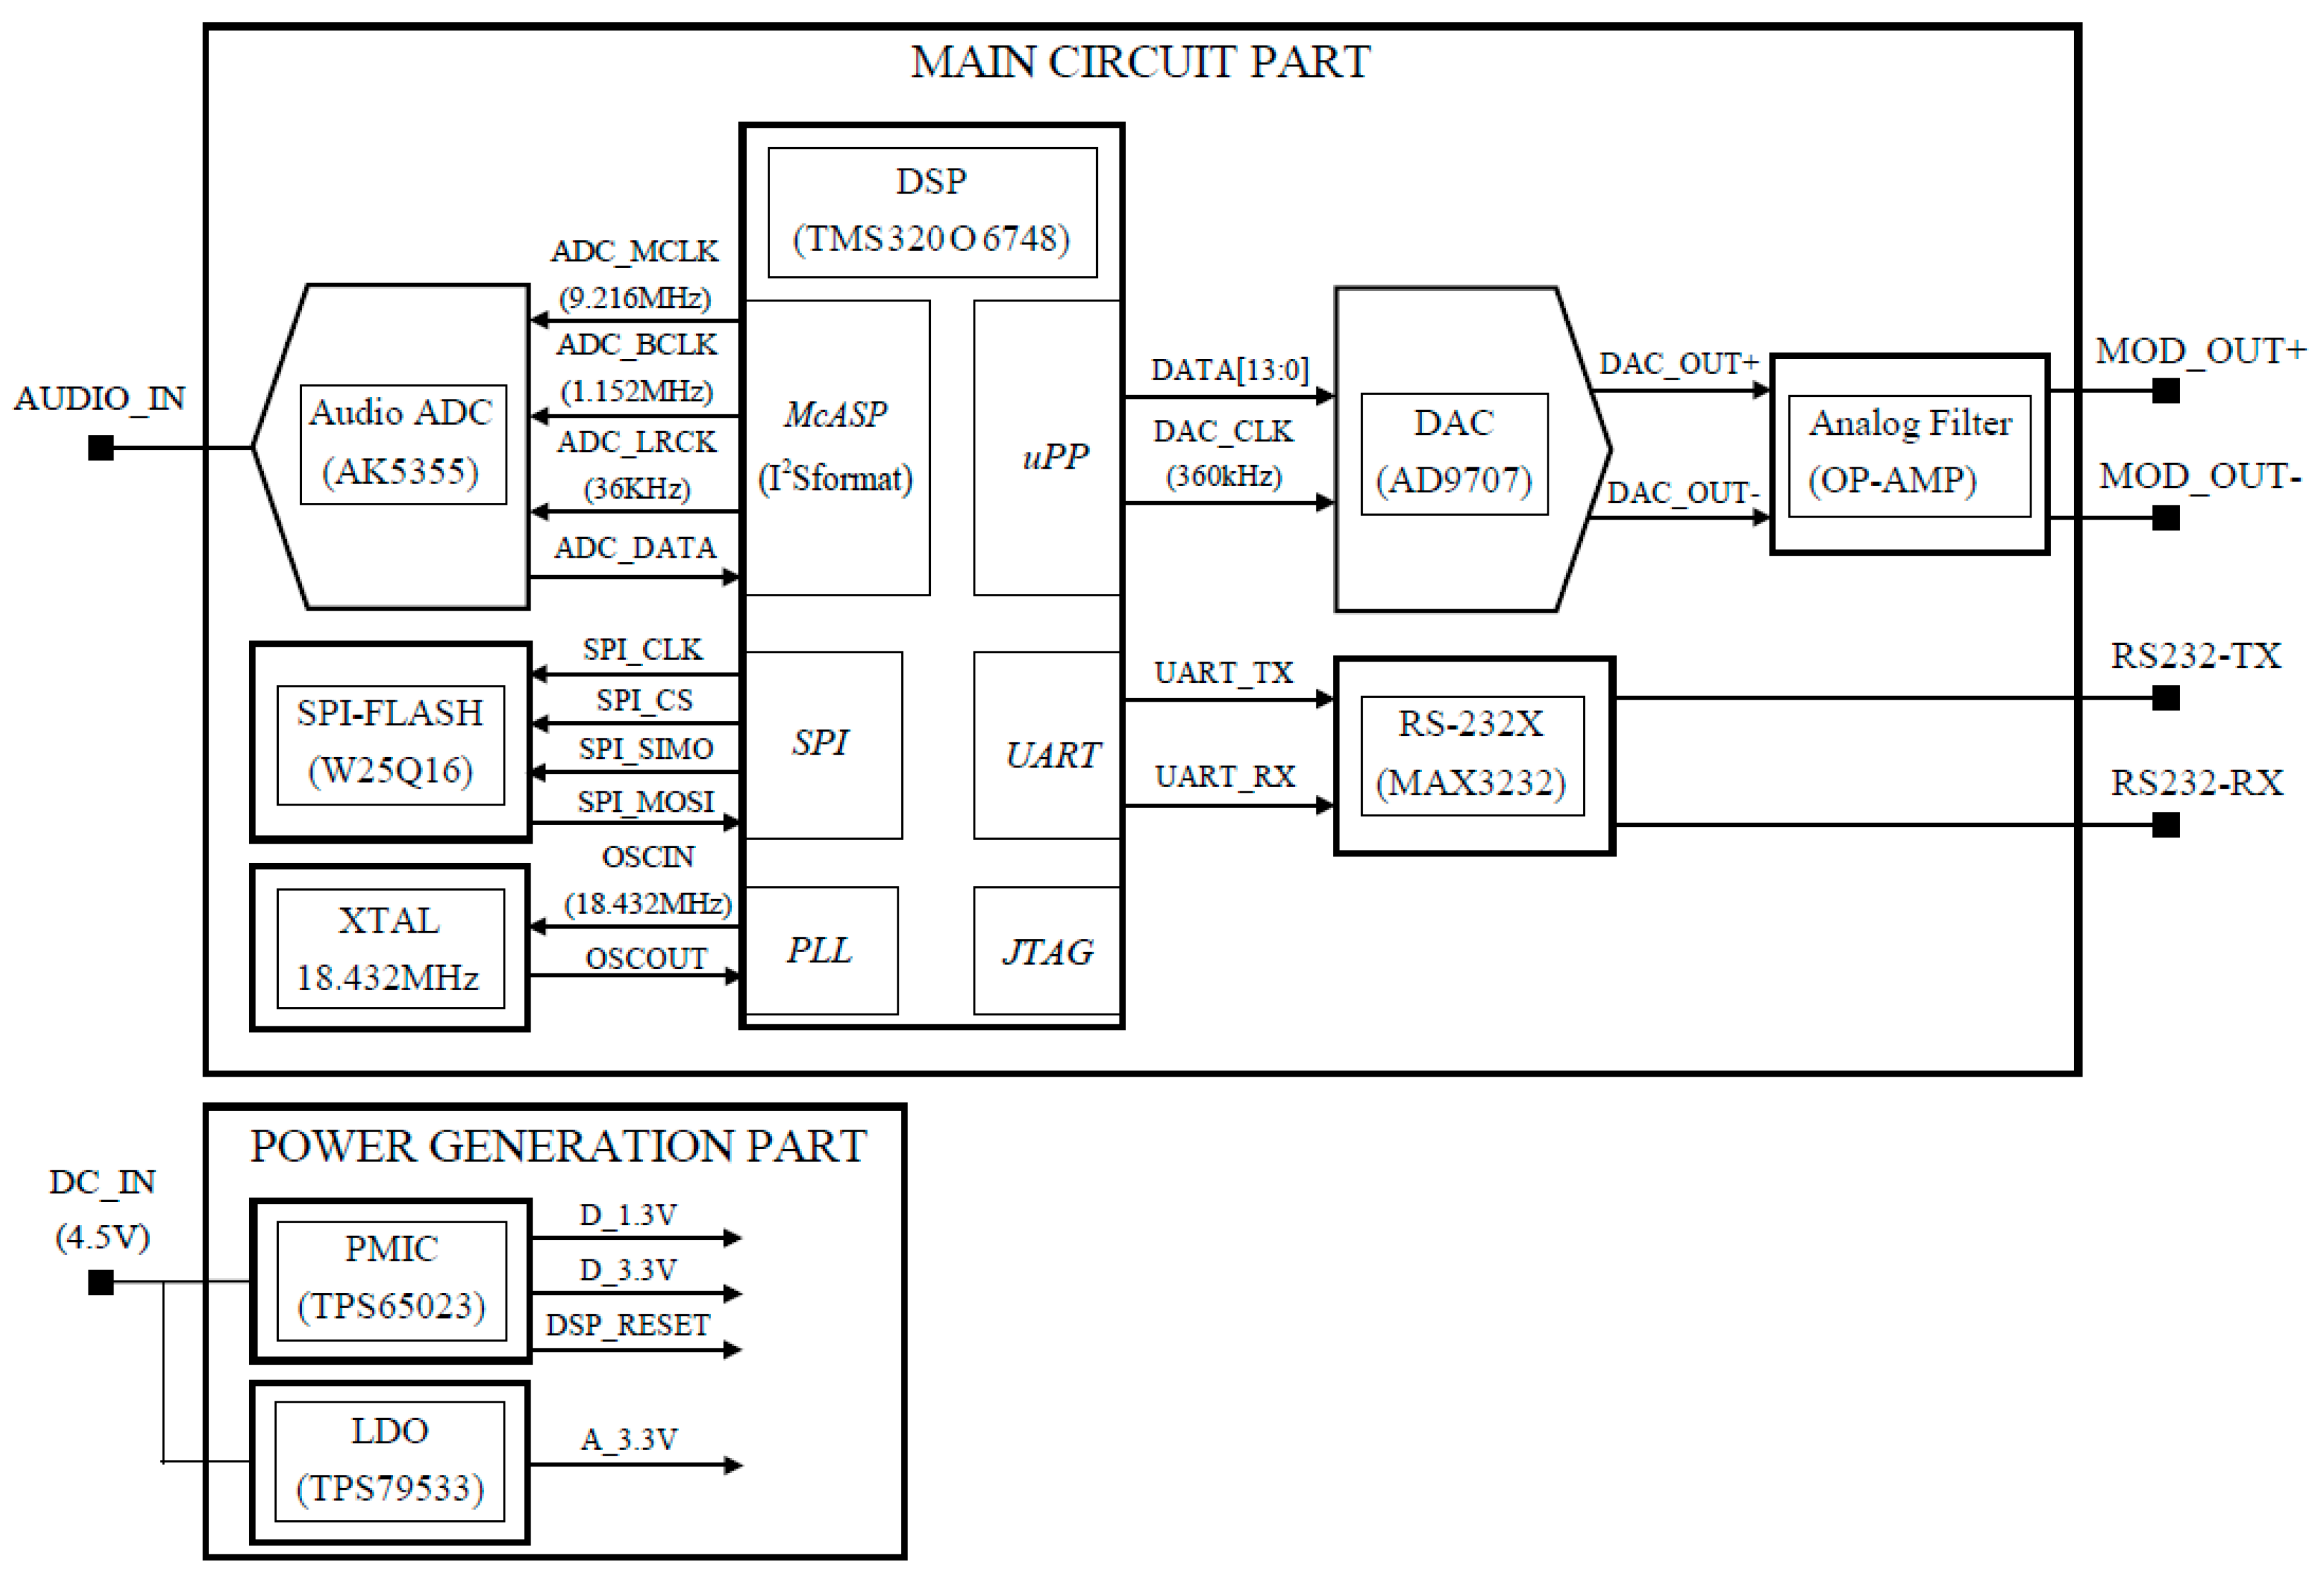
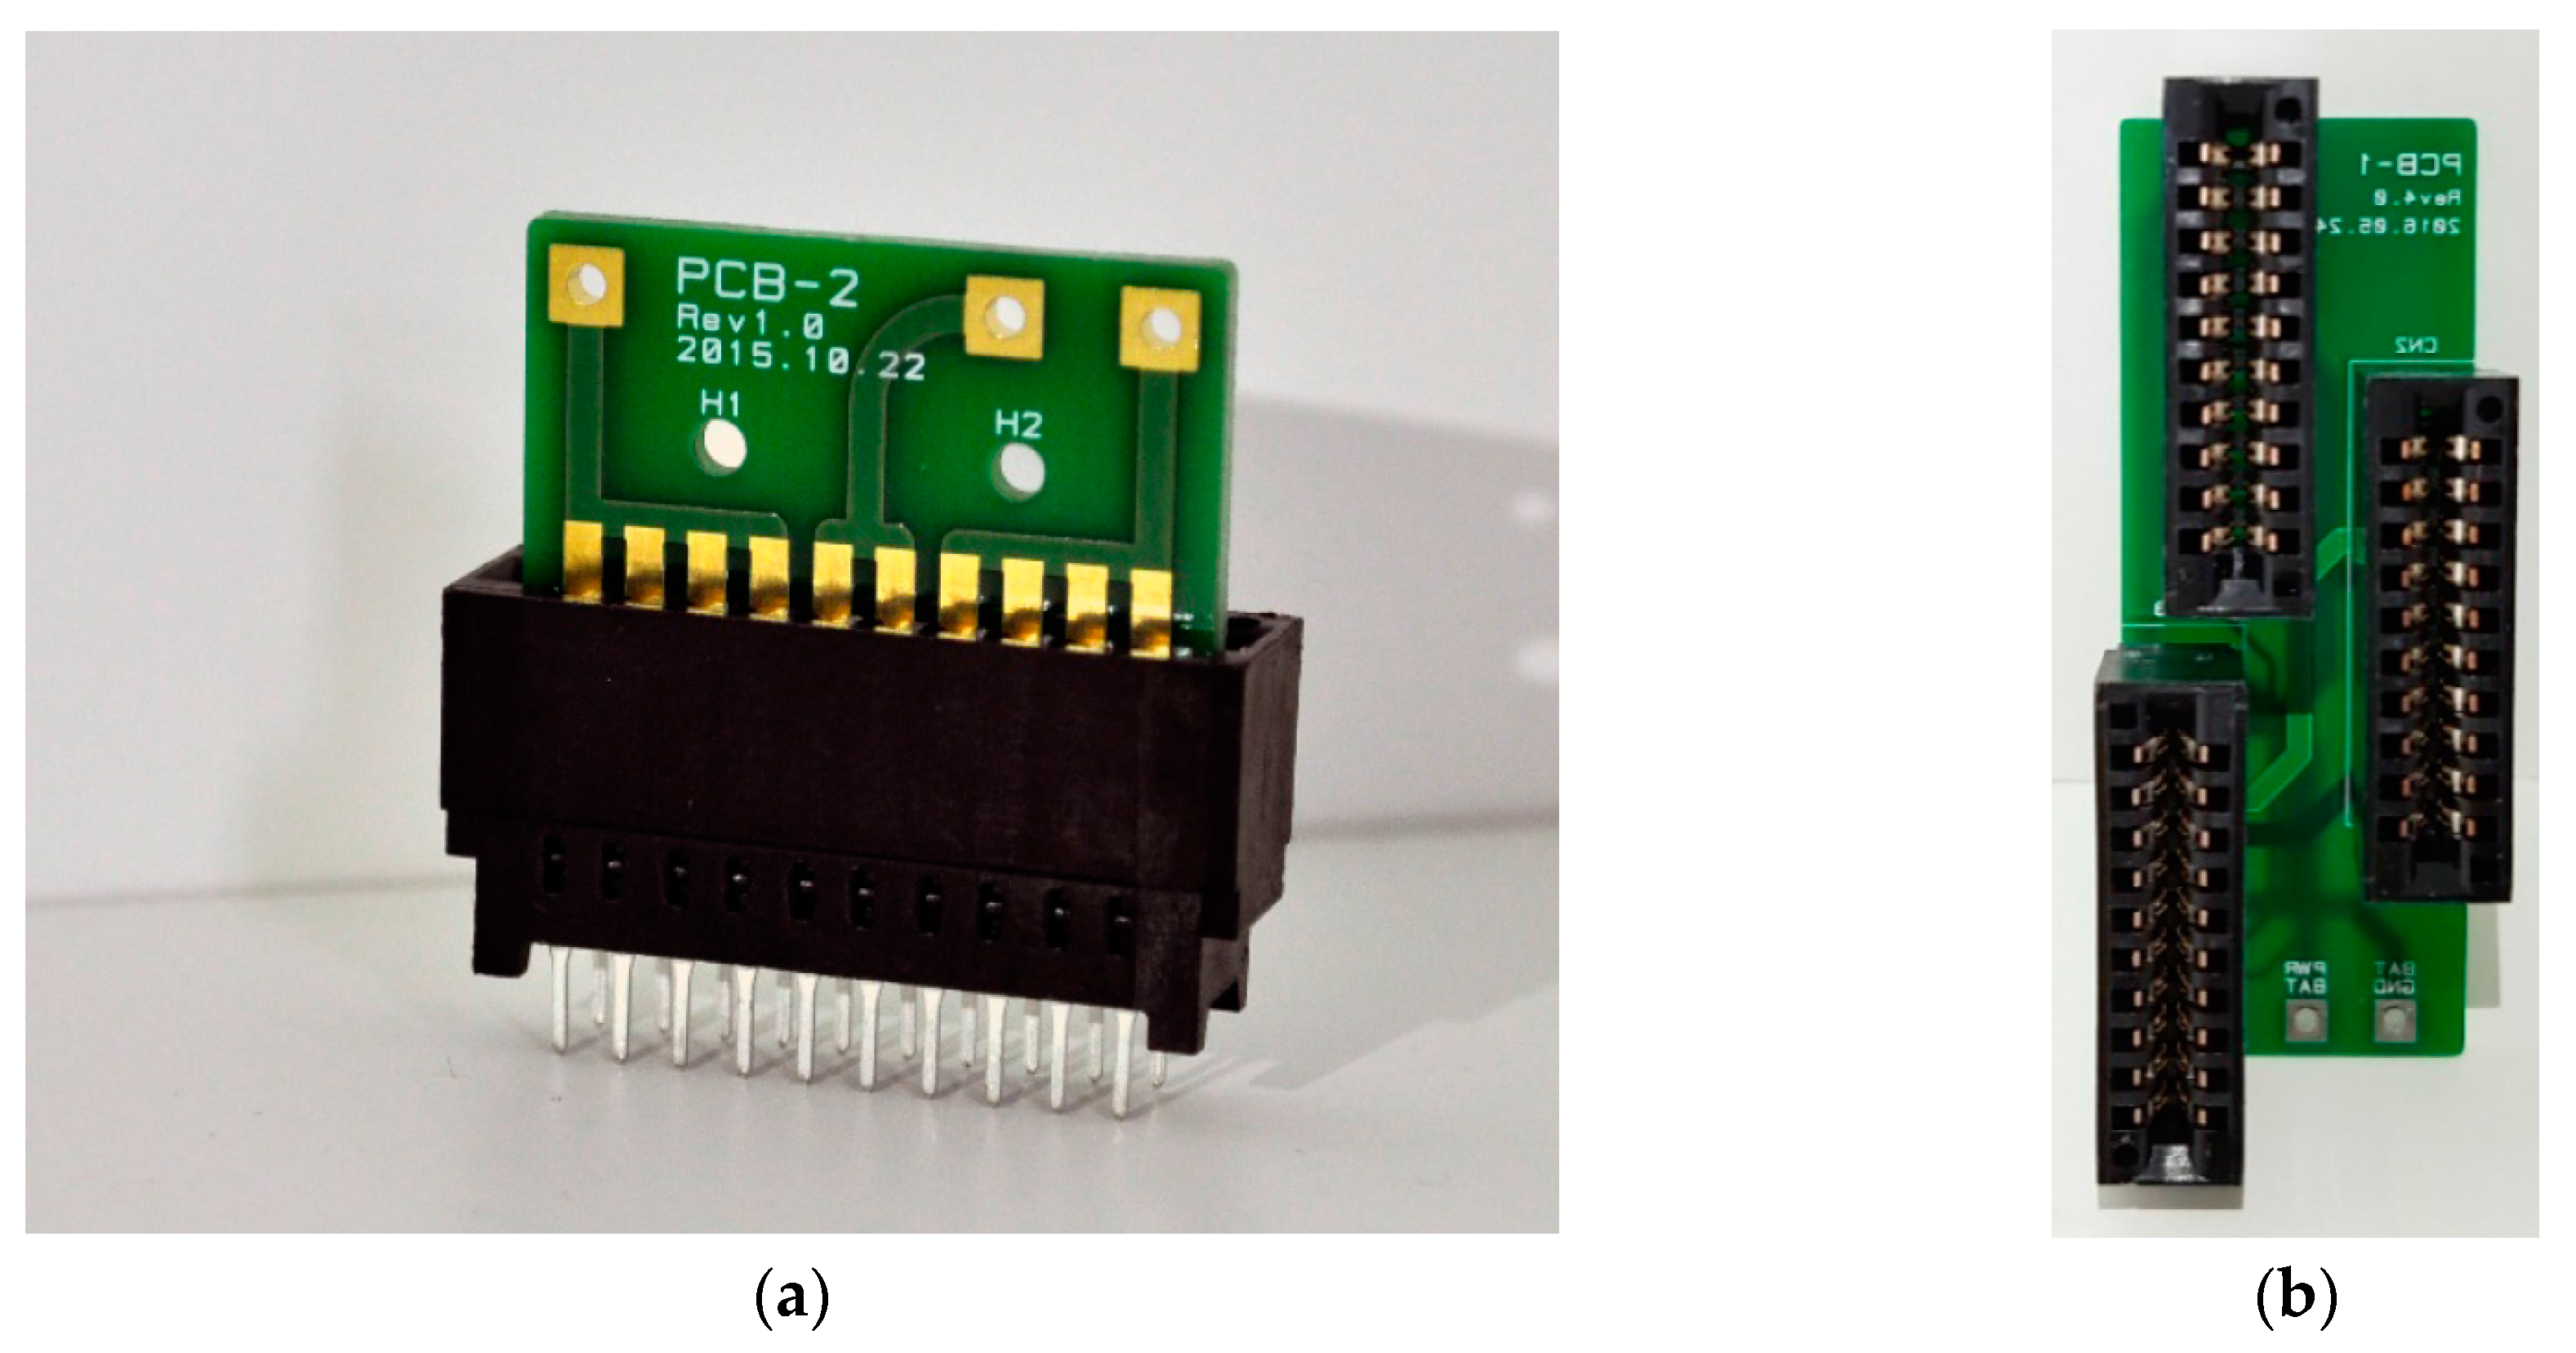
2.2. Signal Processing Board
2.2.1. Signal Processing Board Requirements
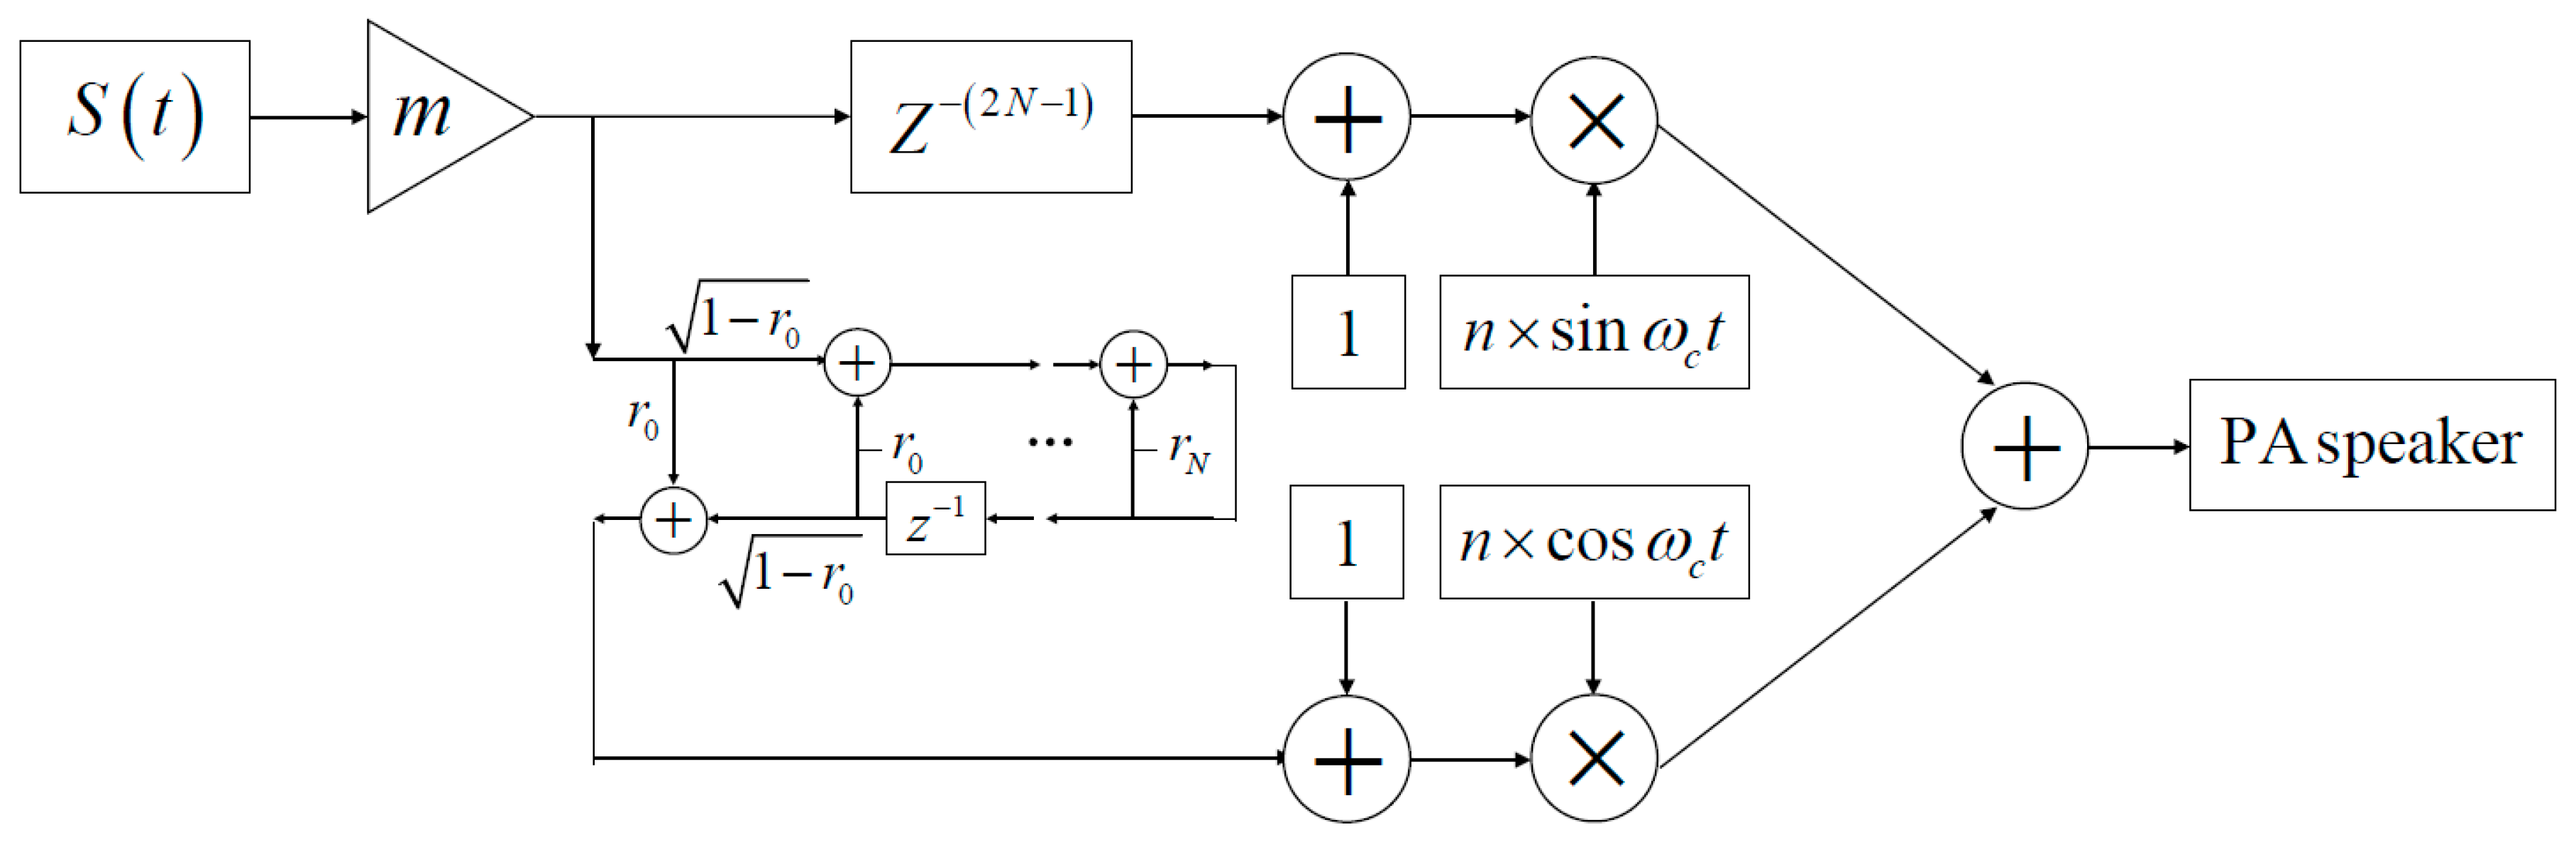
2.2.2. Single Sideband Modulator Design for the PA Speaker
| Algorithm 1 The optimum IIR filter algorithm |
| Choose the initial extreme frequencies For
|
2.3. Power Amplifier
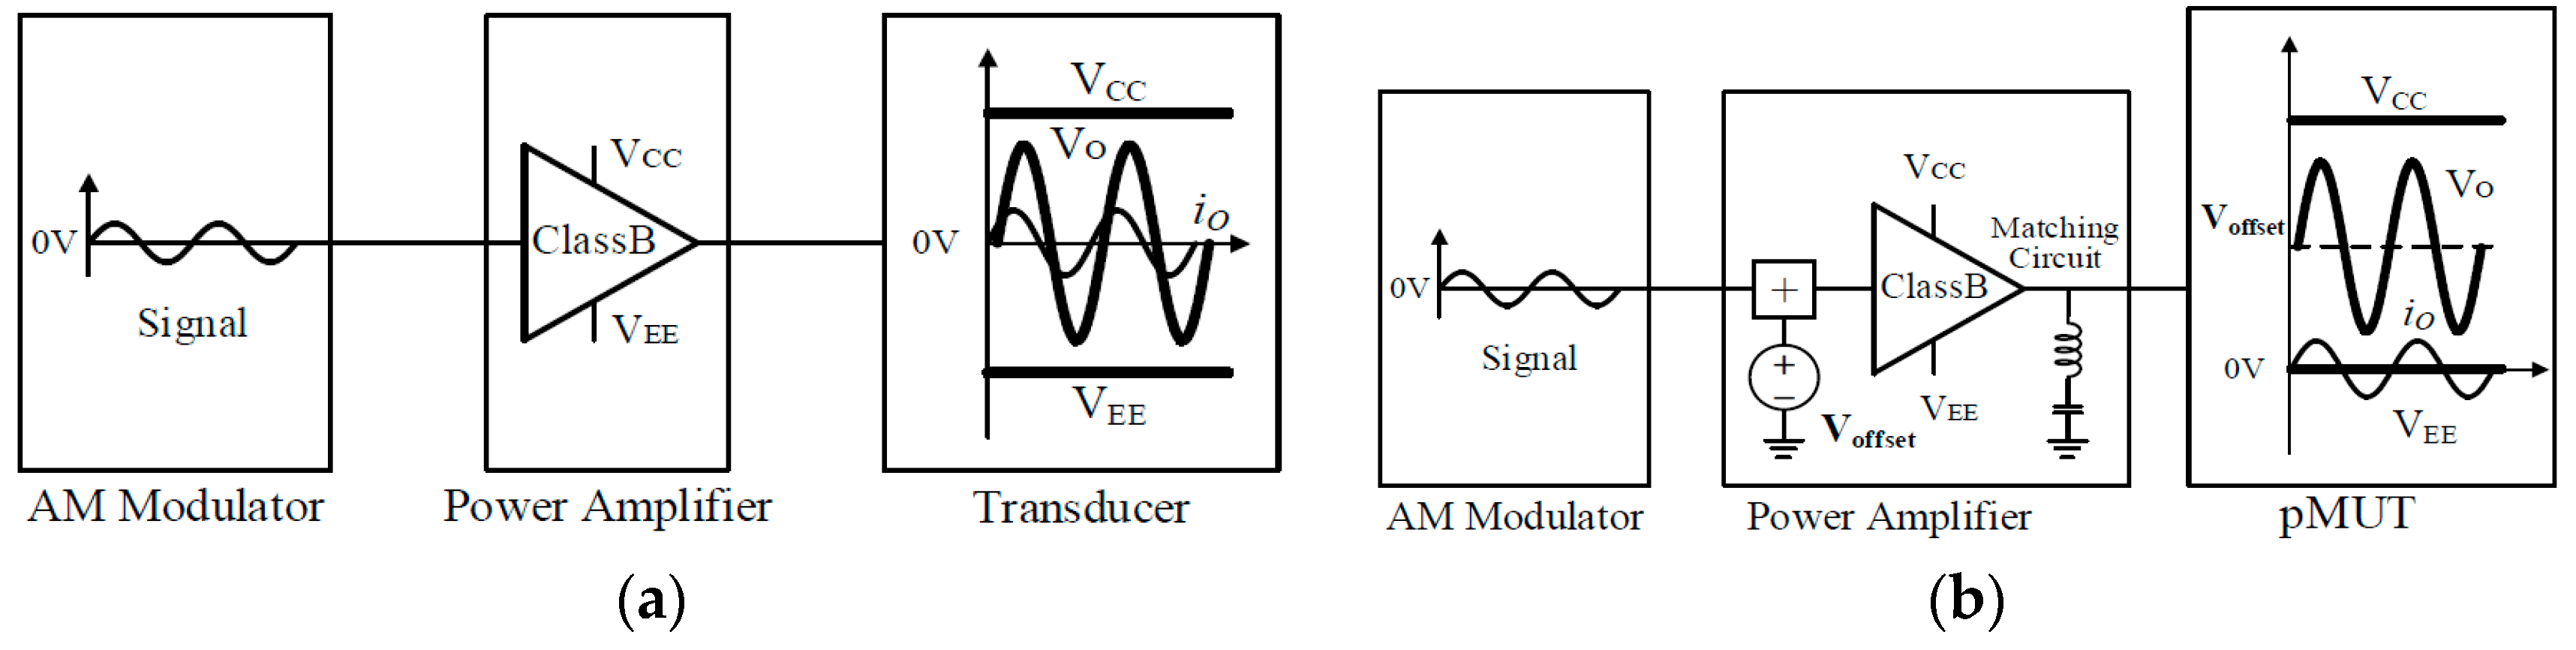
2.3.1. Power Amplifier Requirements
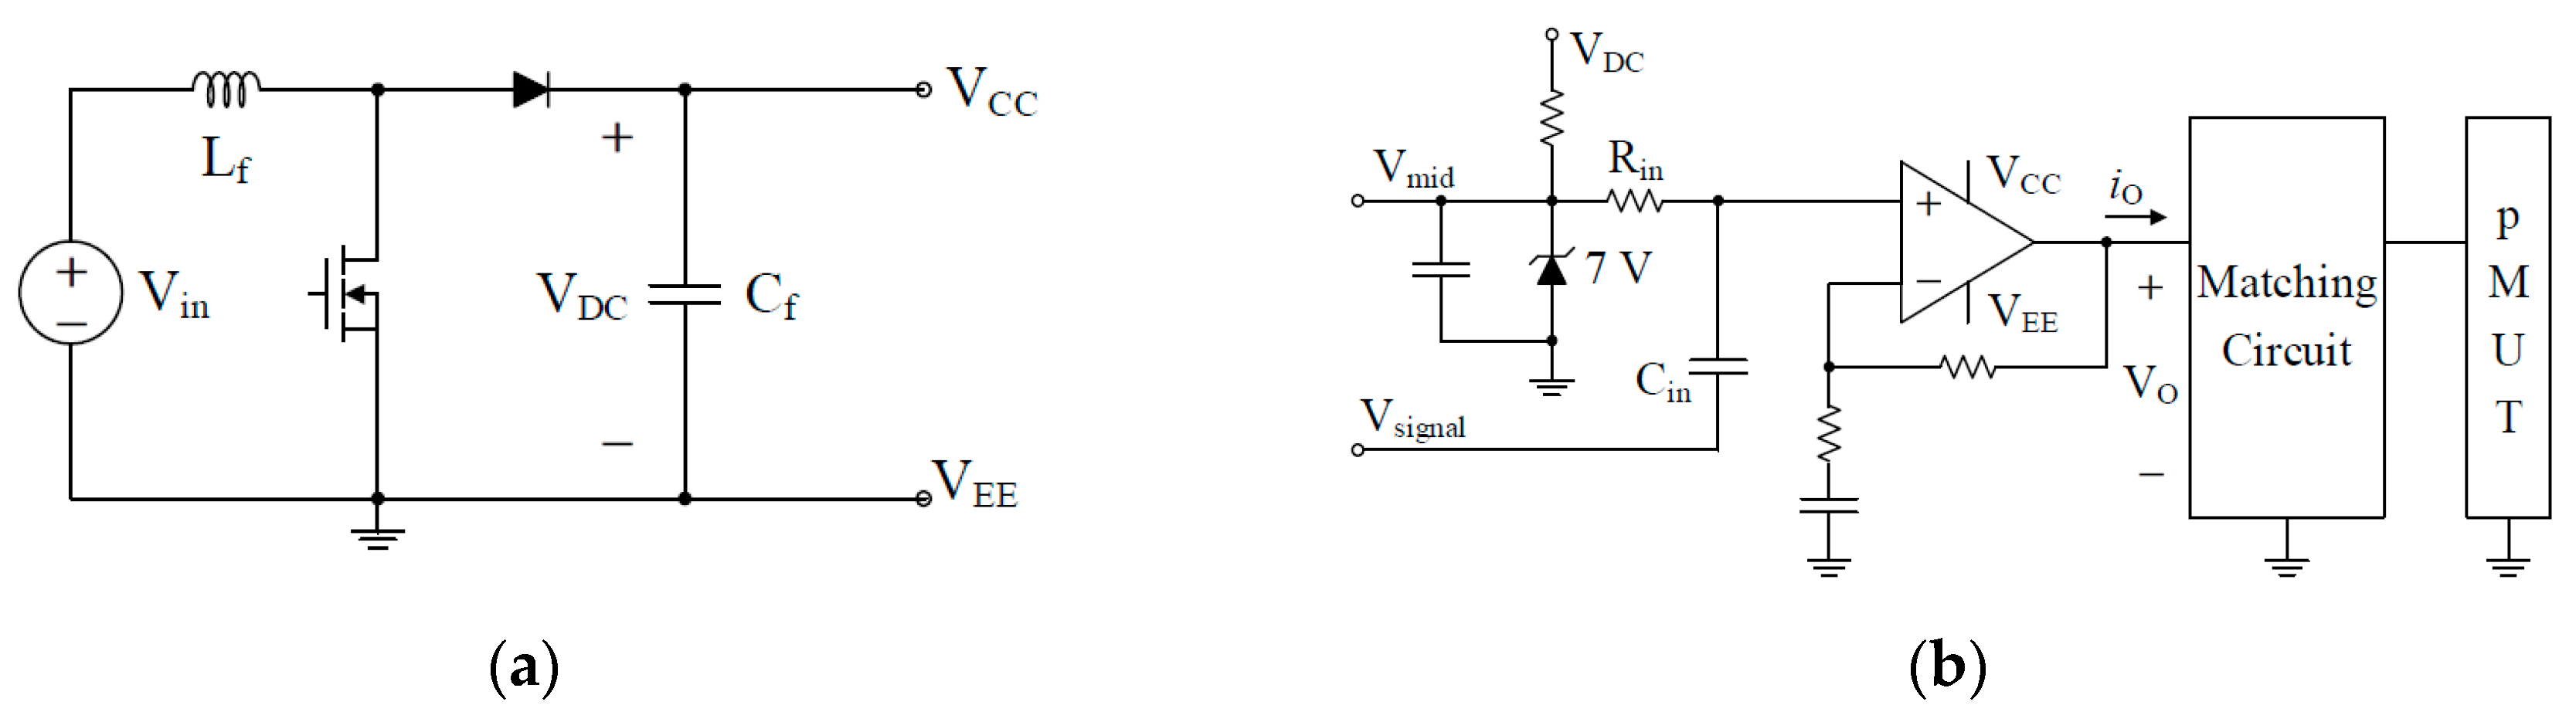
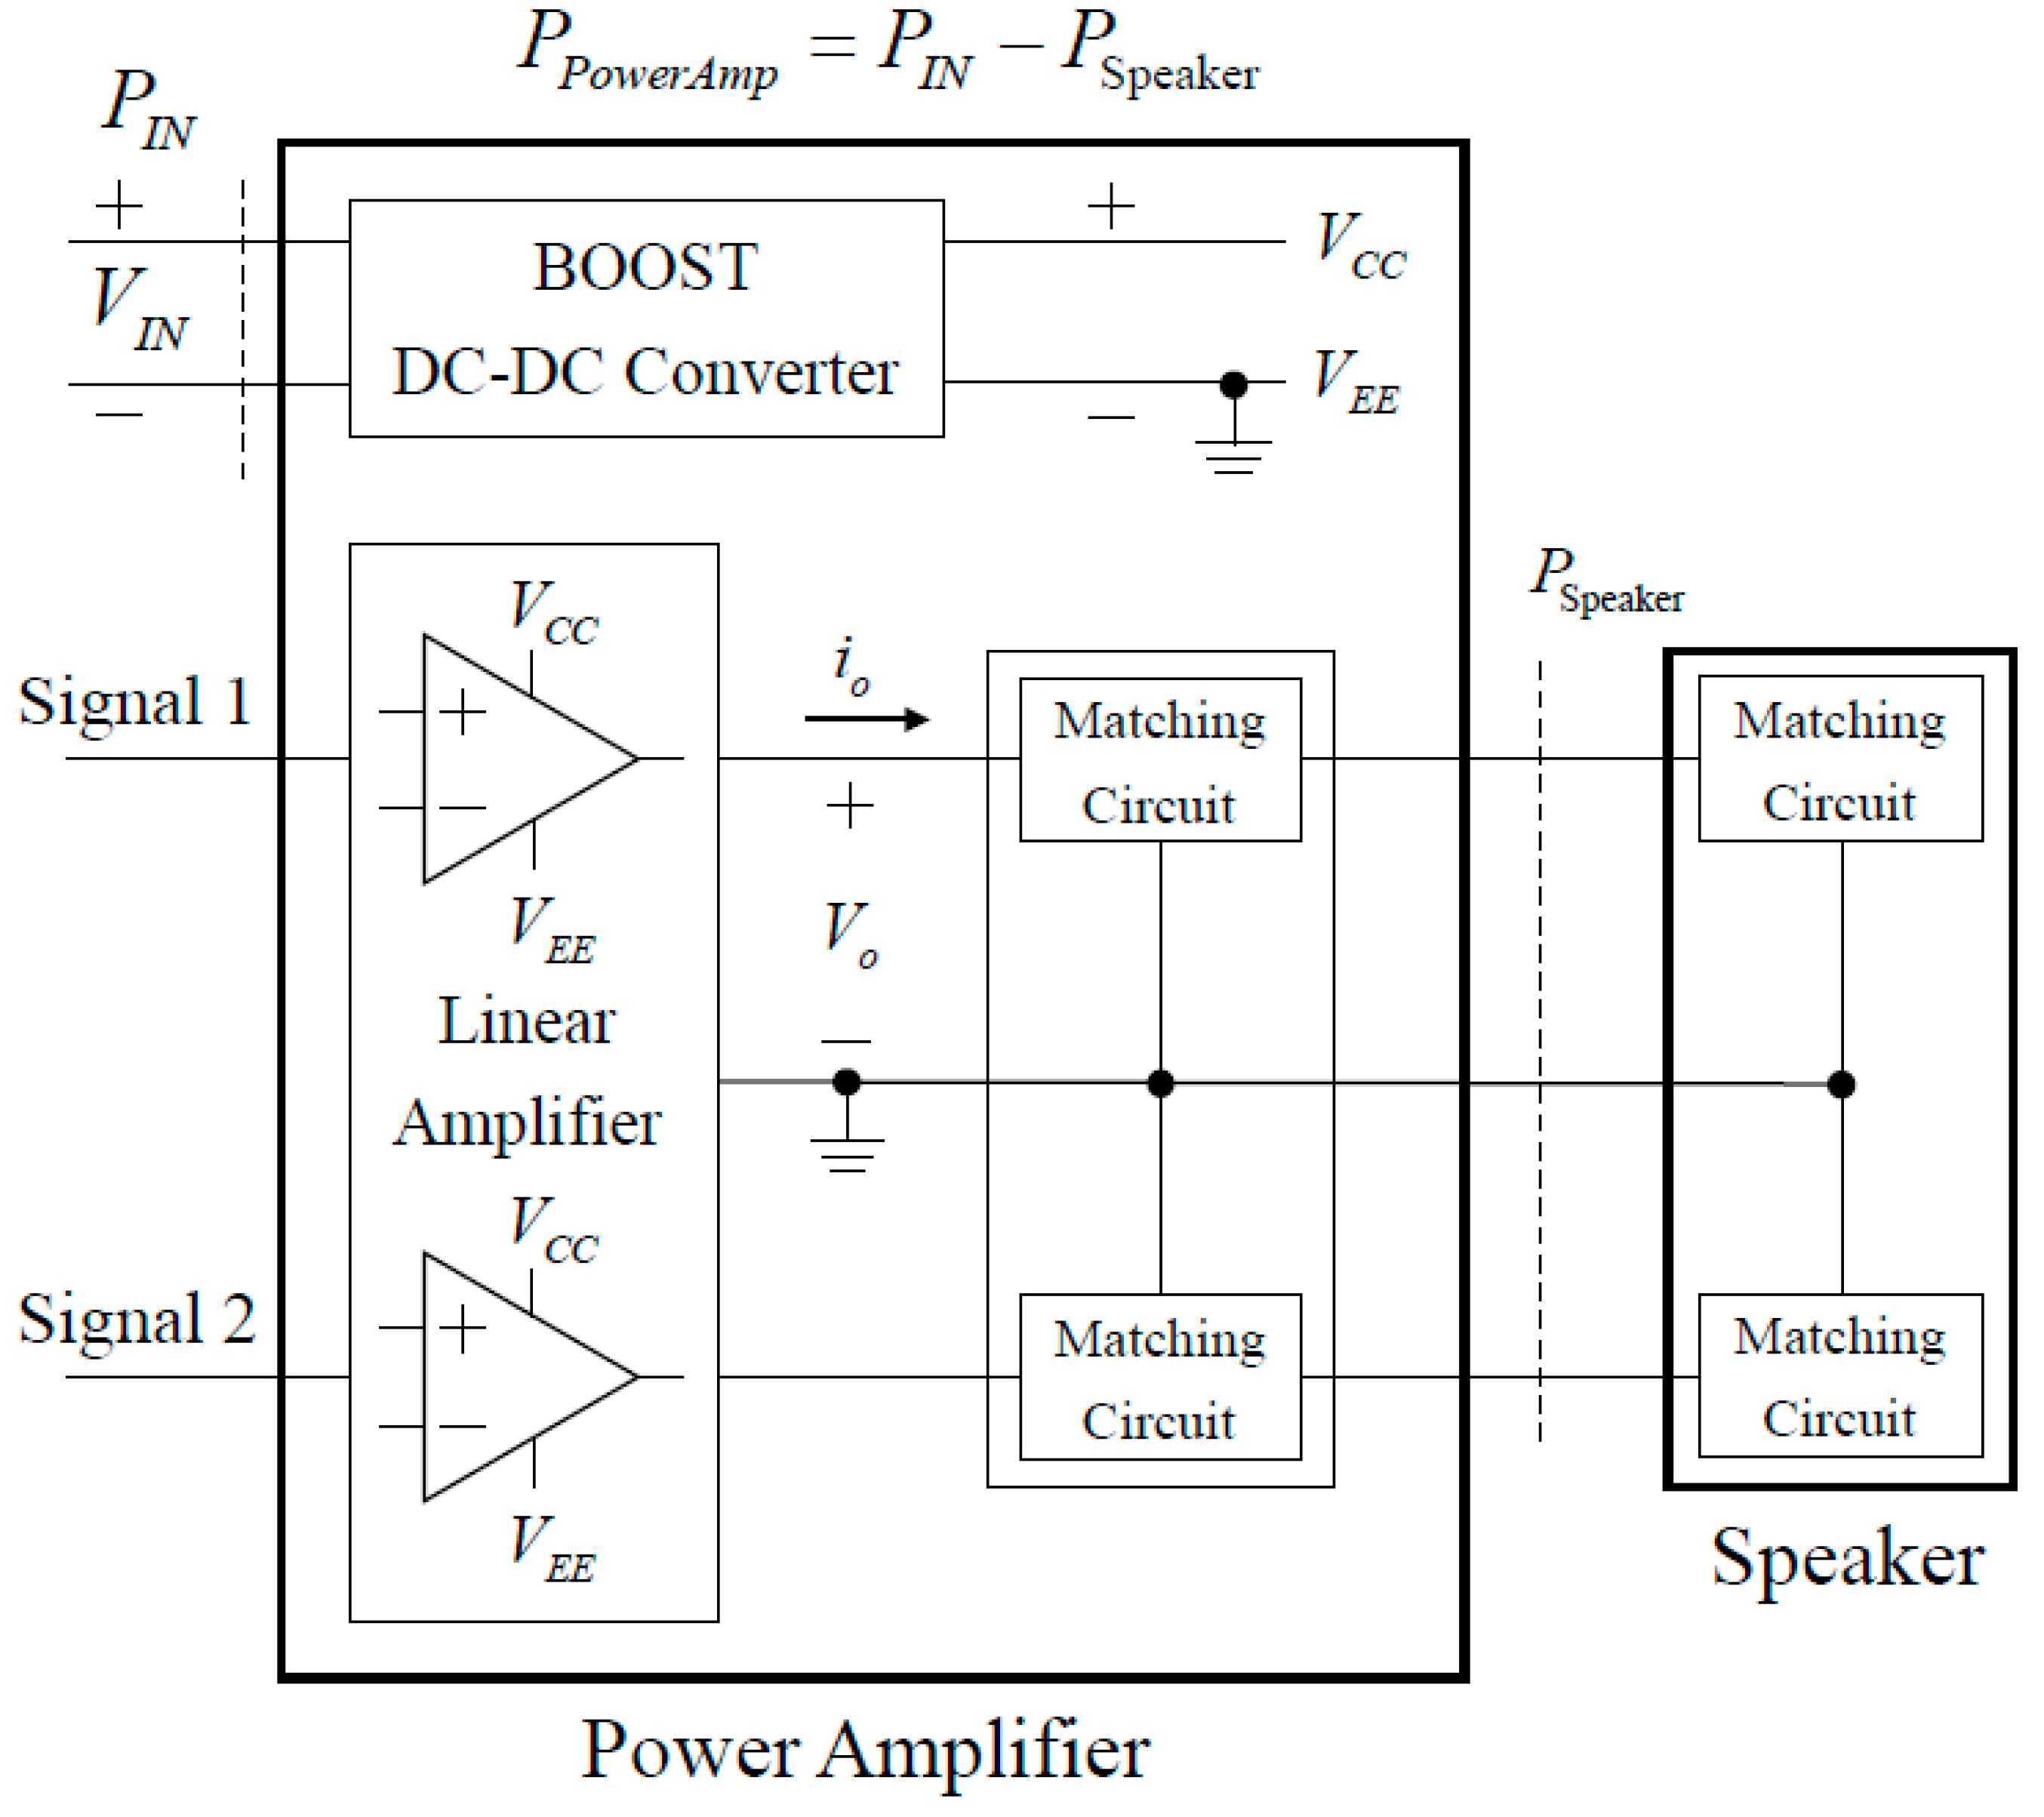
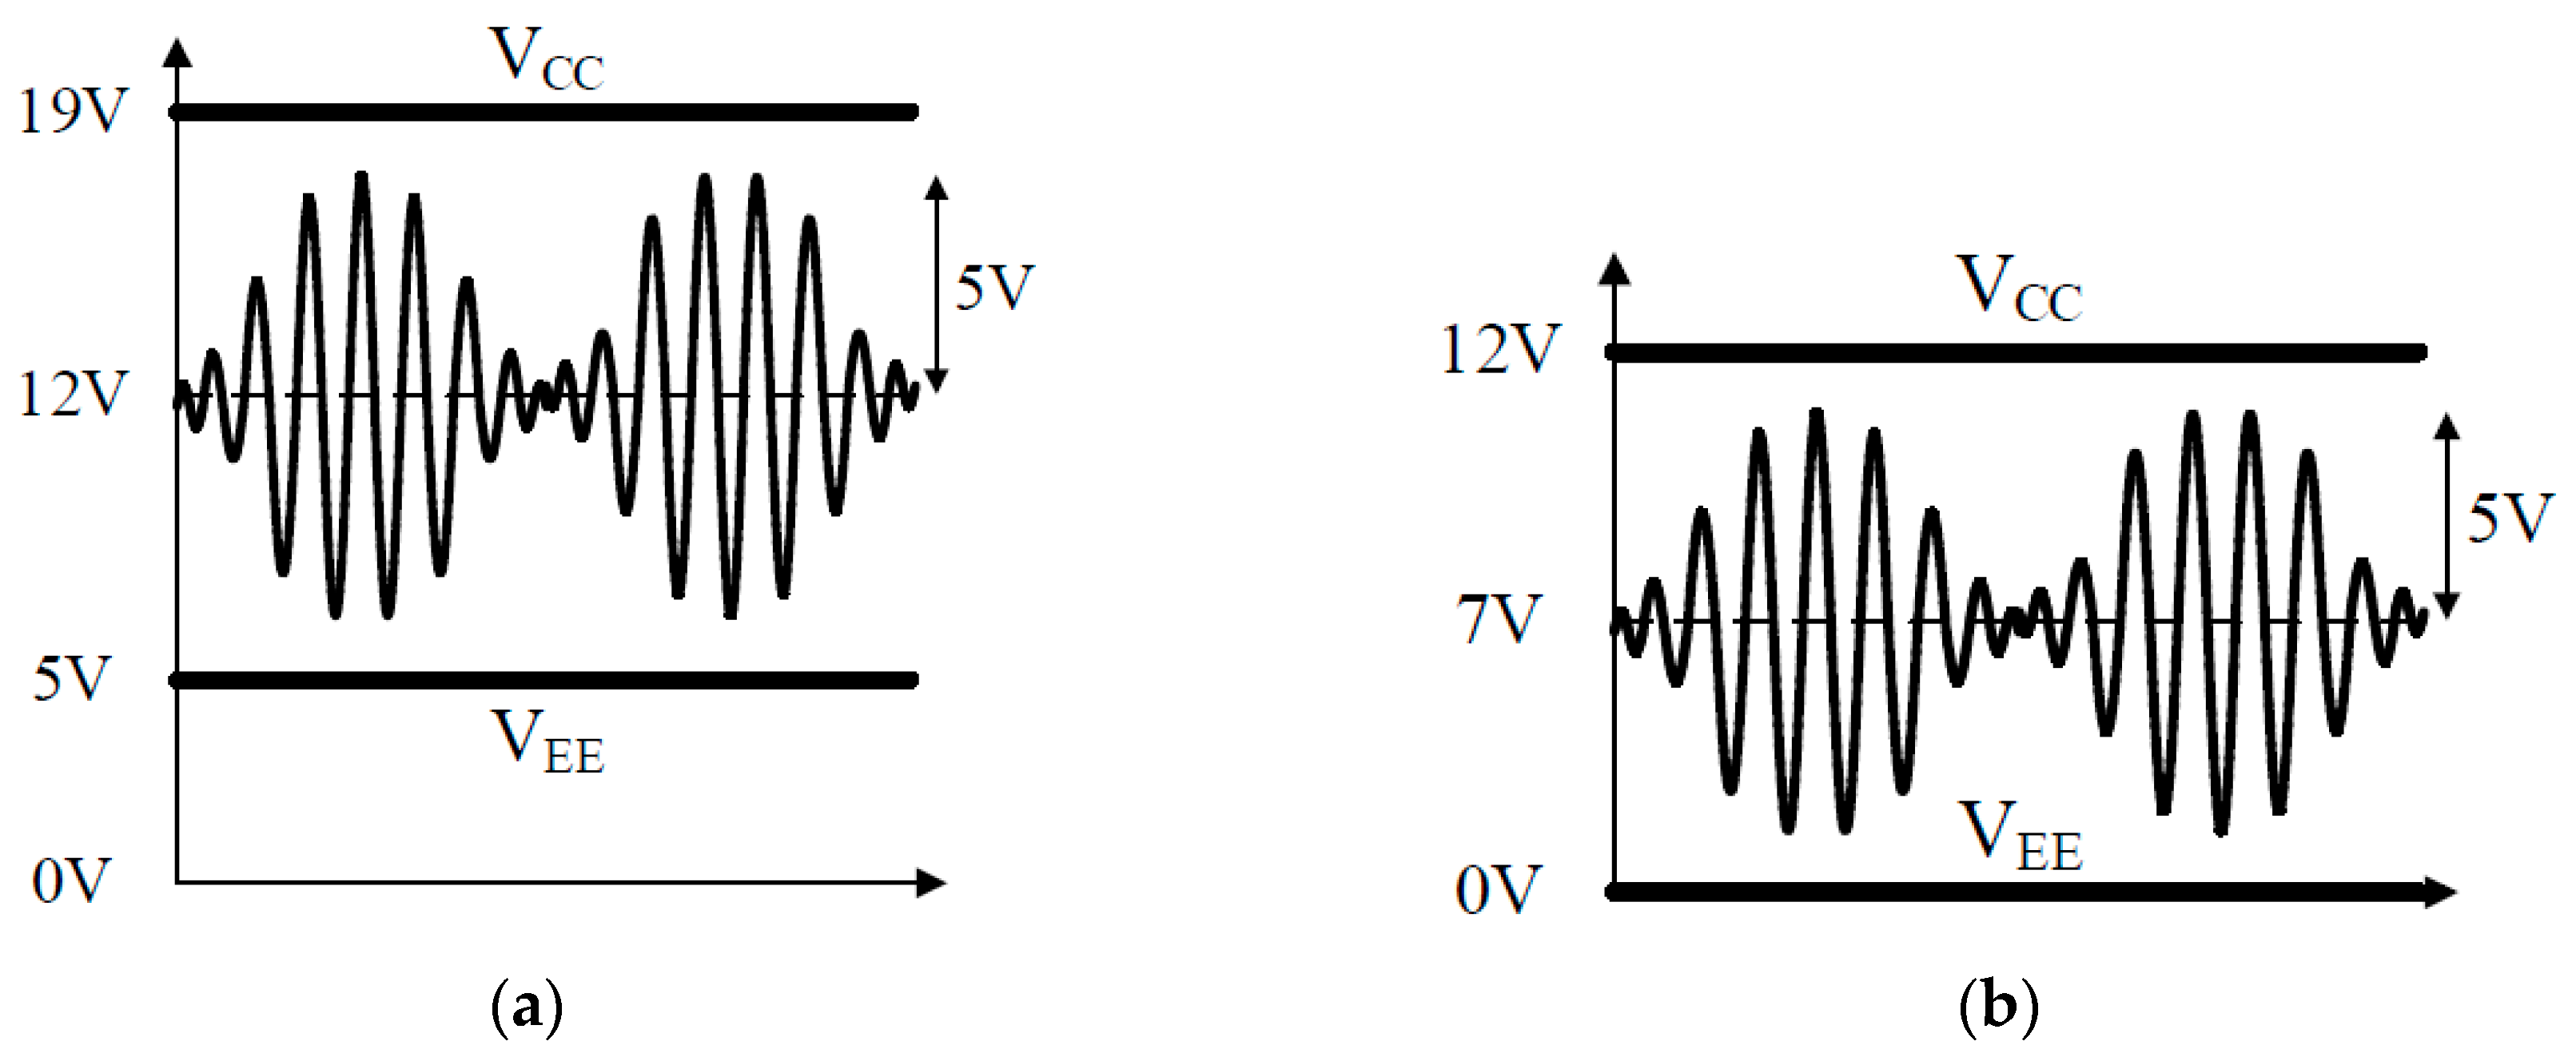
2.3.2. Power Amplifier Design
Detailed Power Circuit of Proposed Amplifier
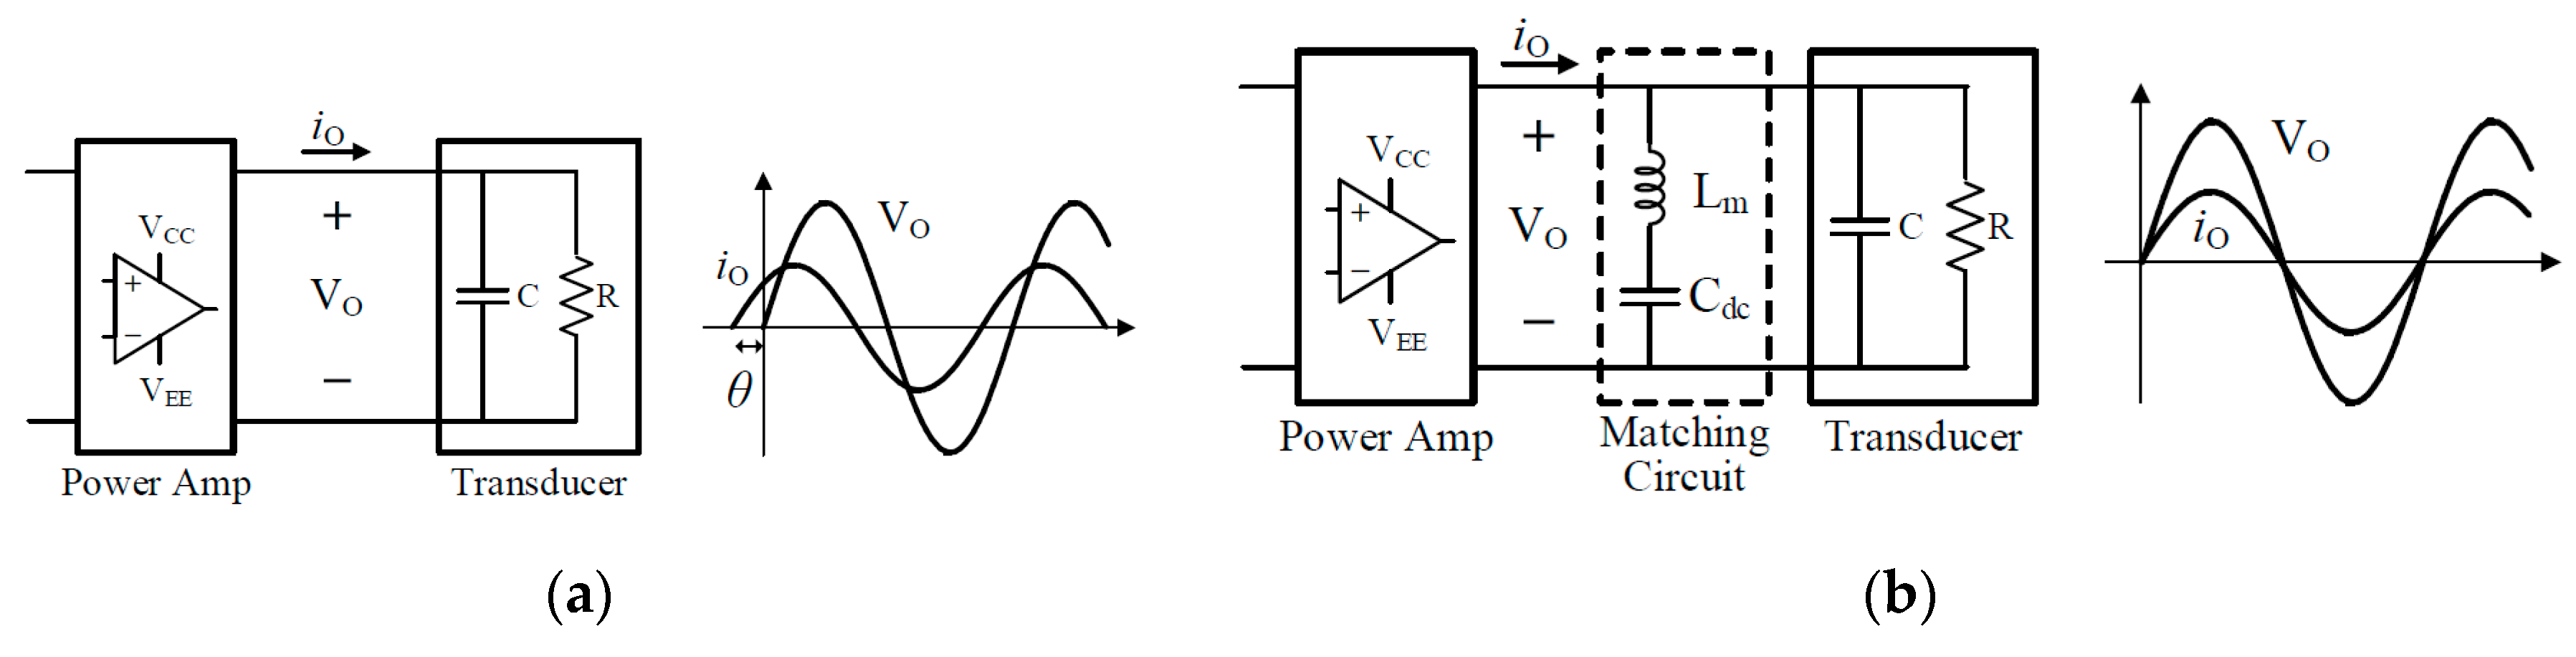
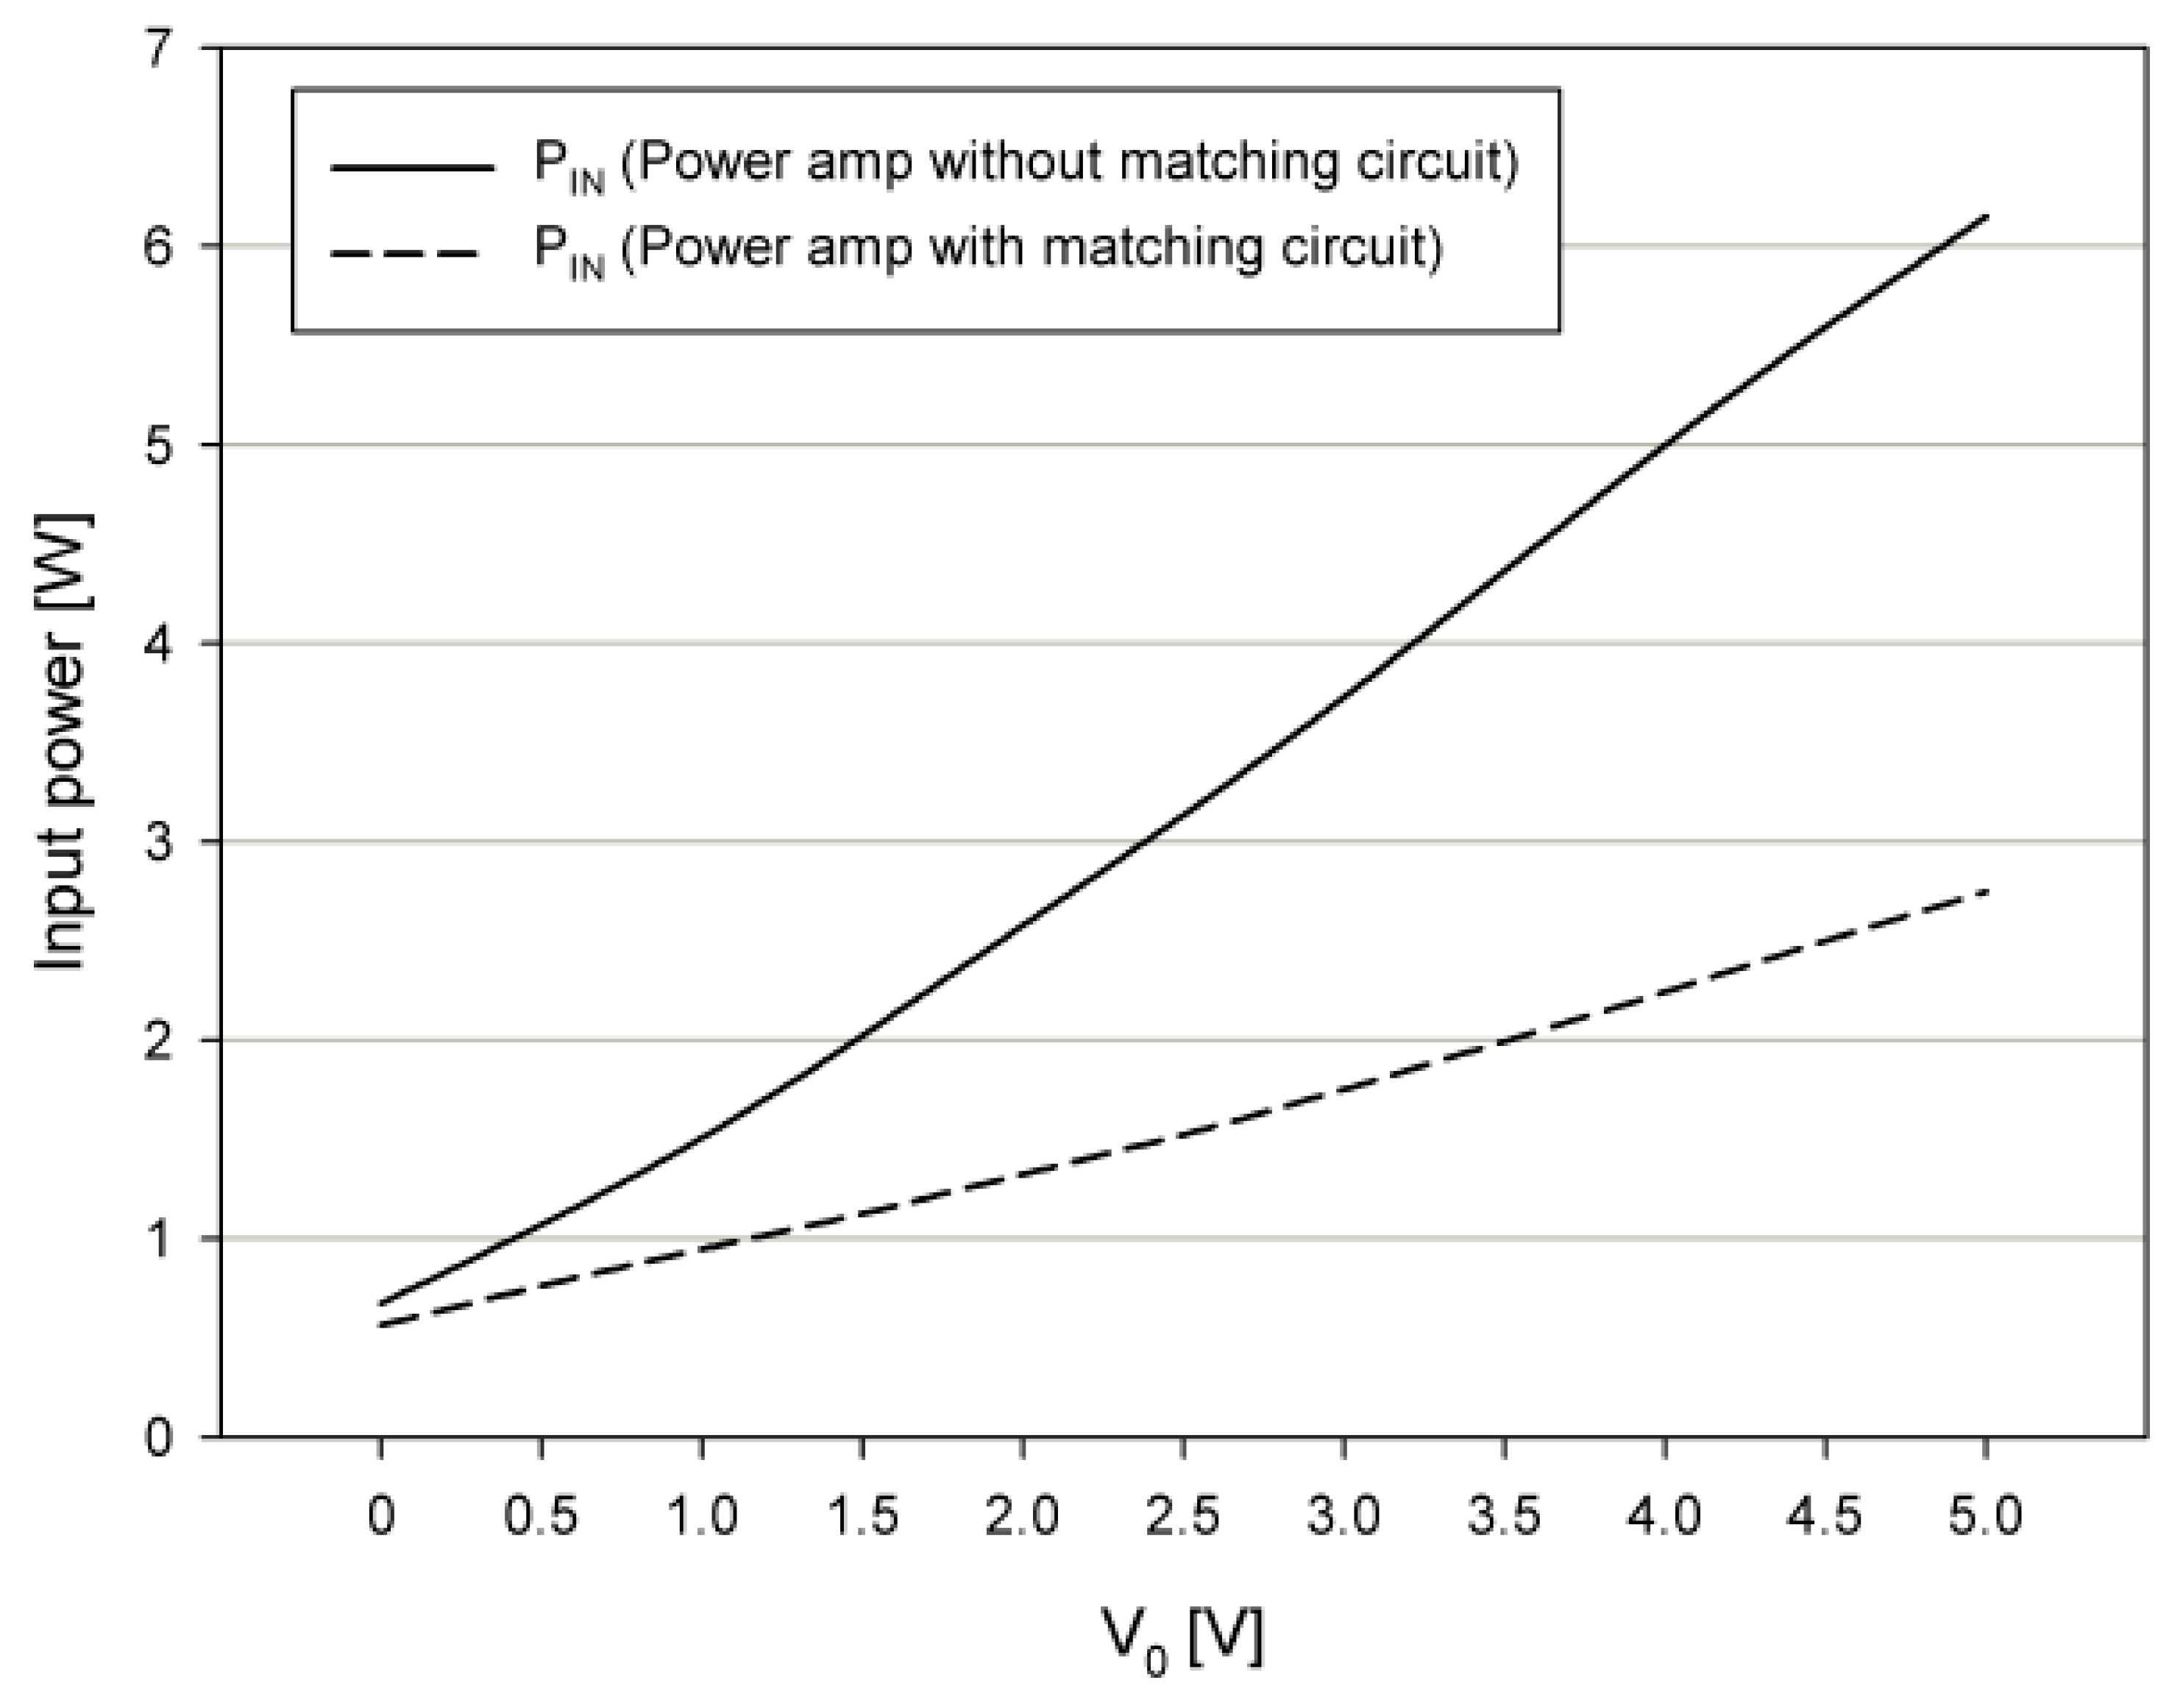
Matching Circuit Design
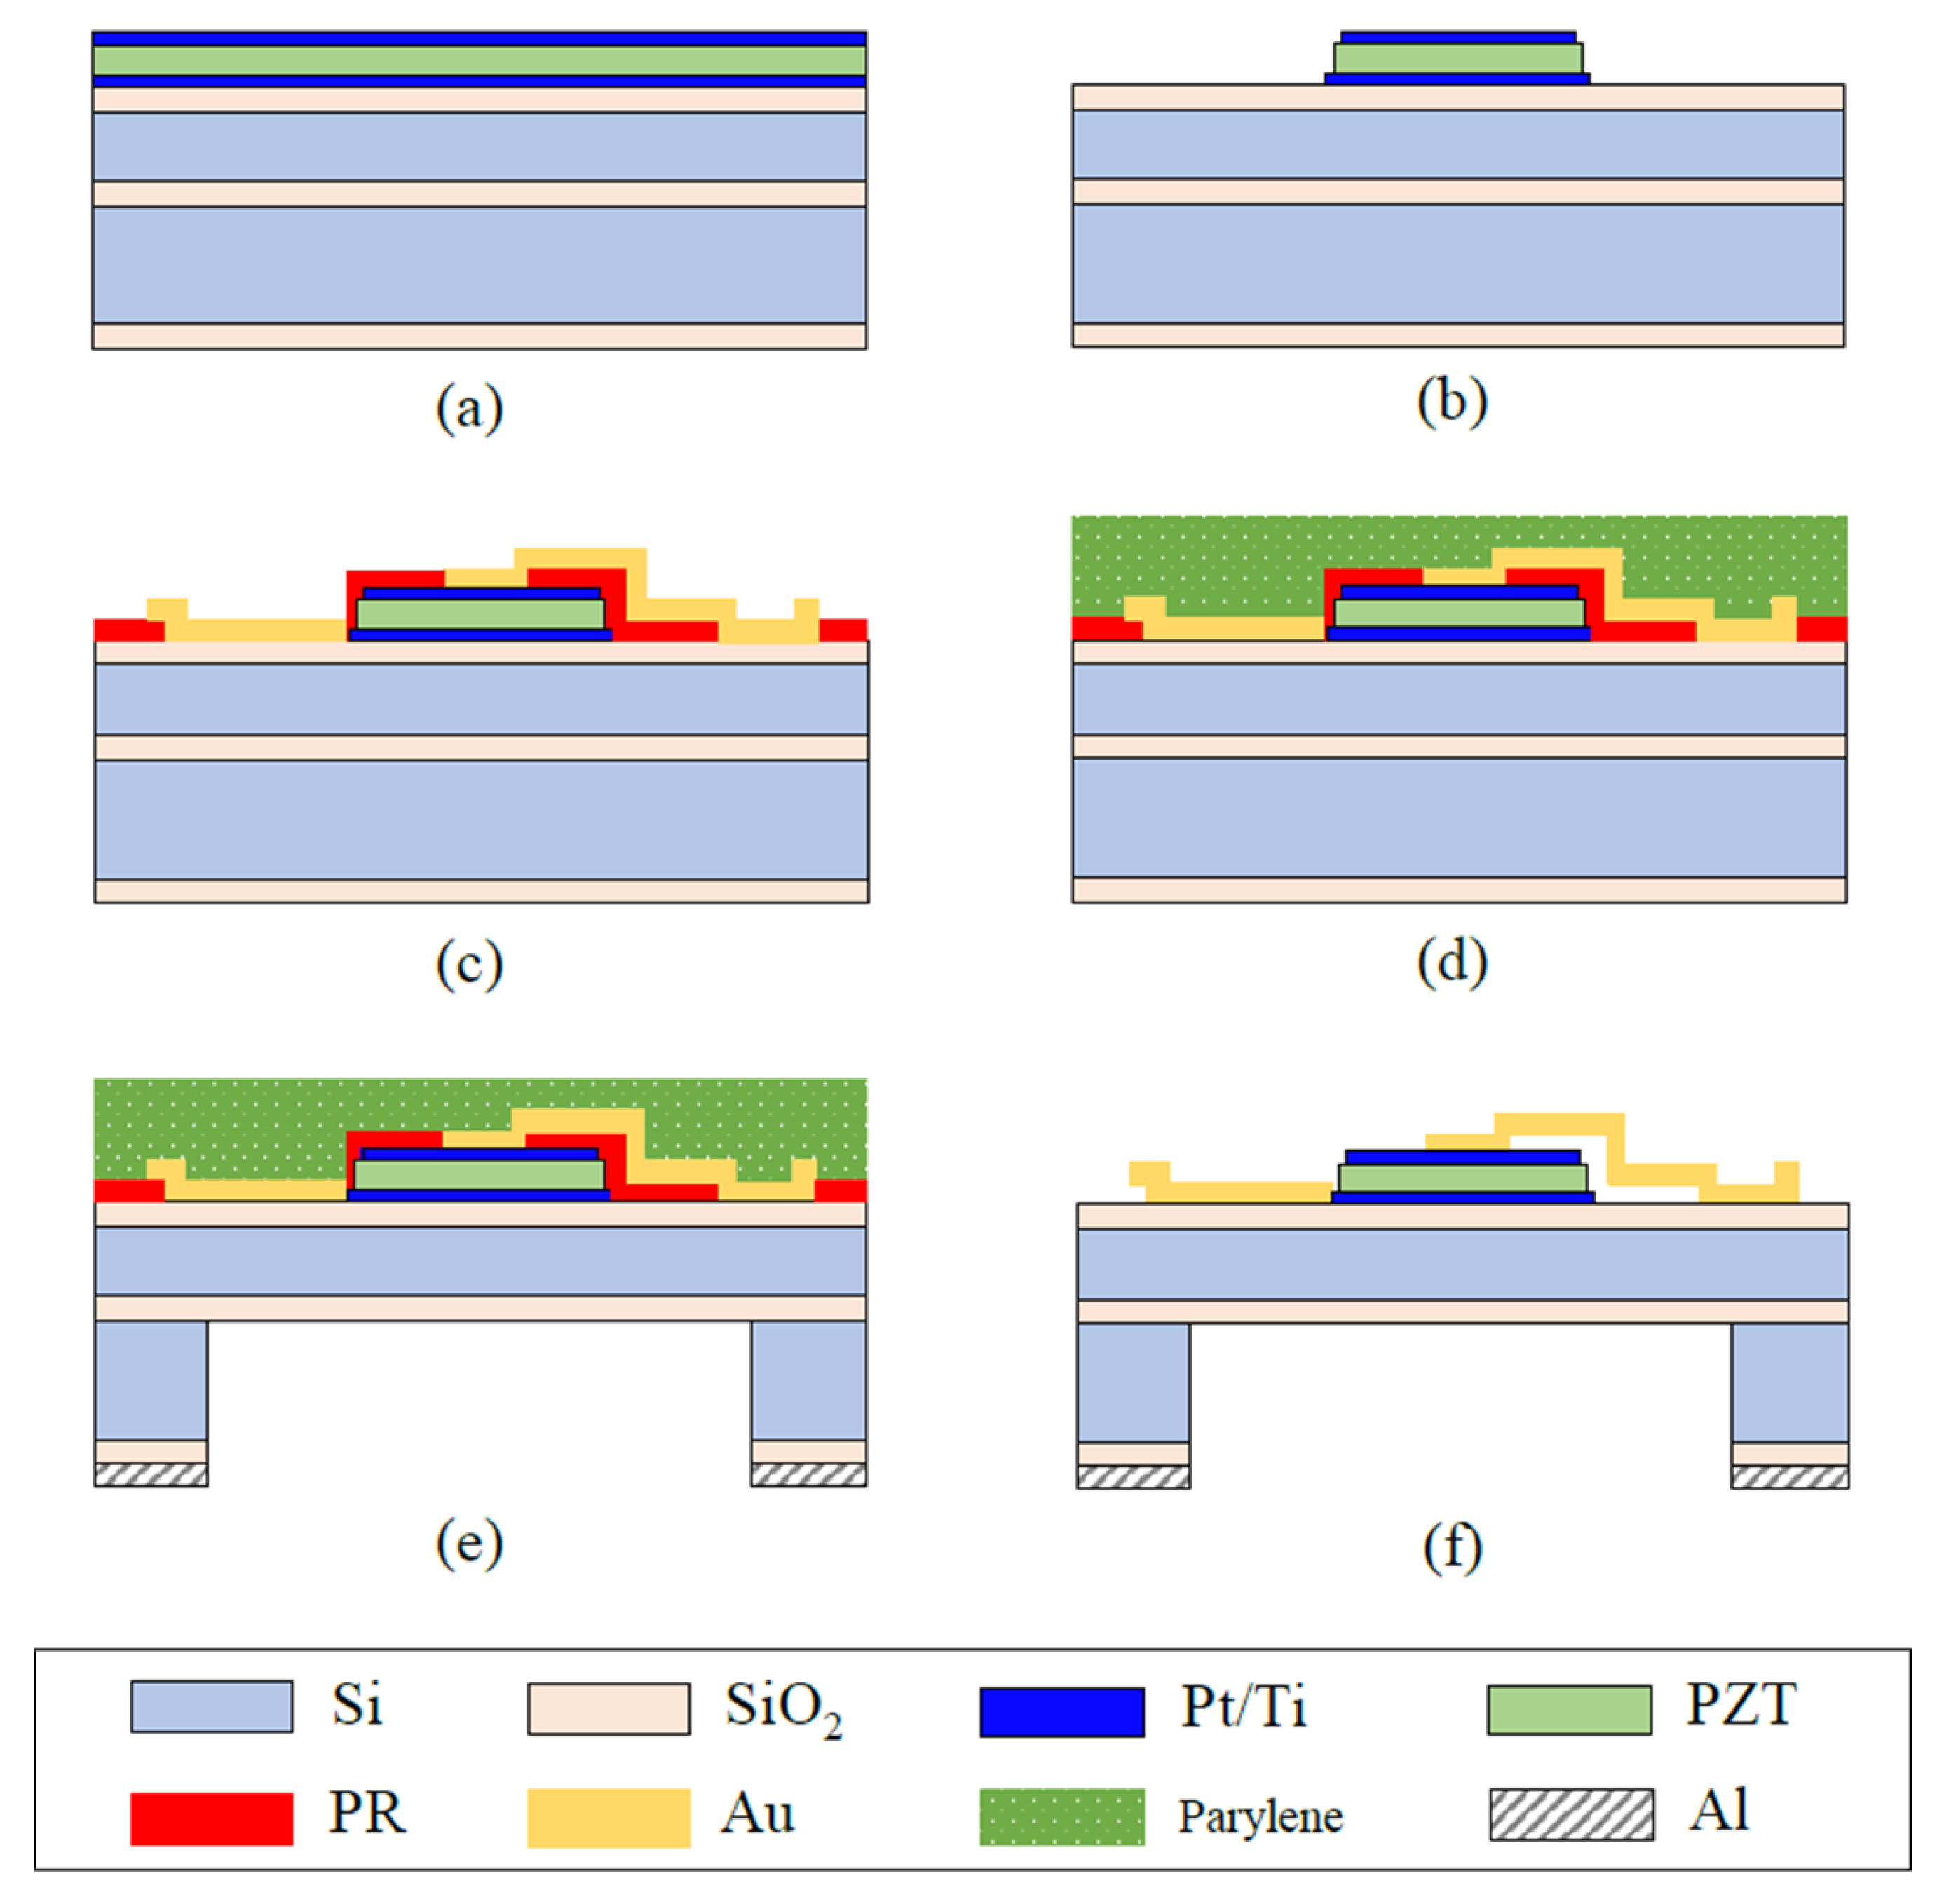
3. Fabrication and Packaging
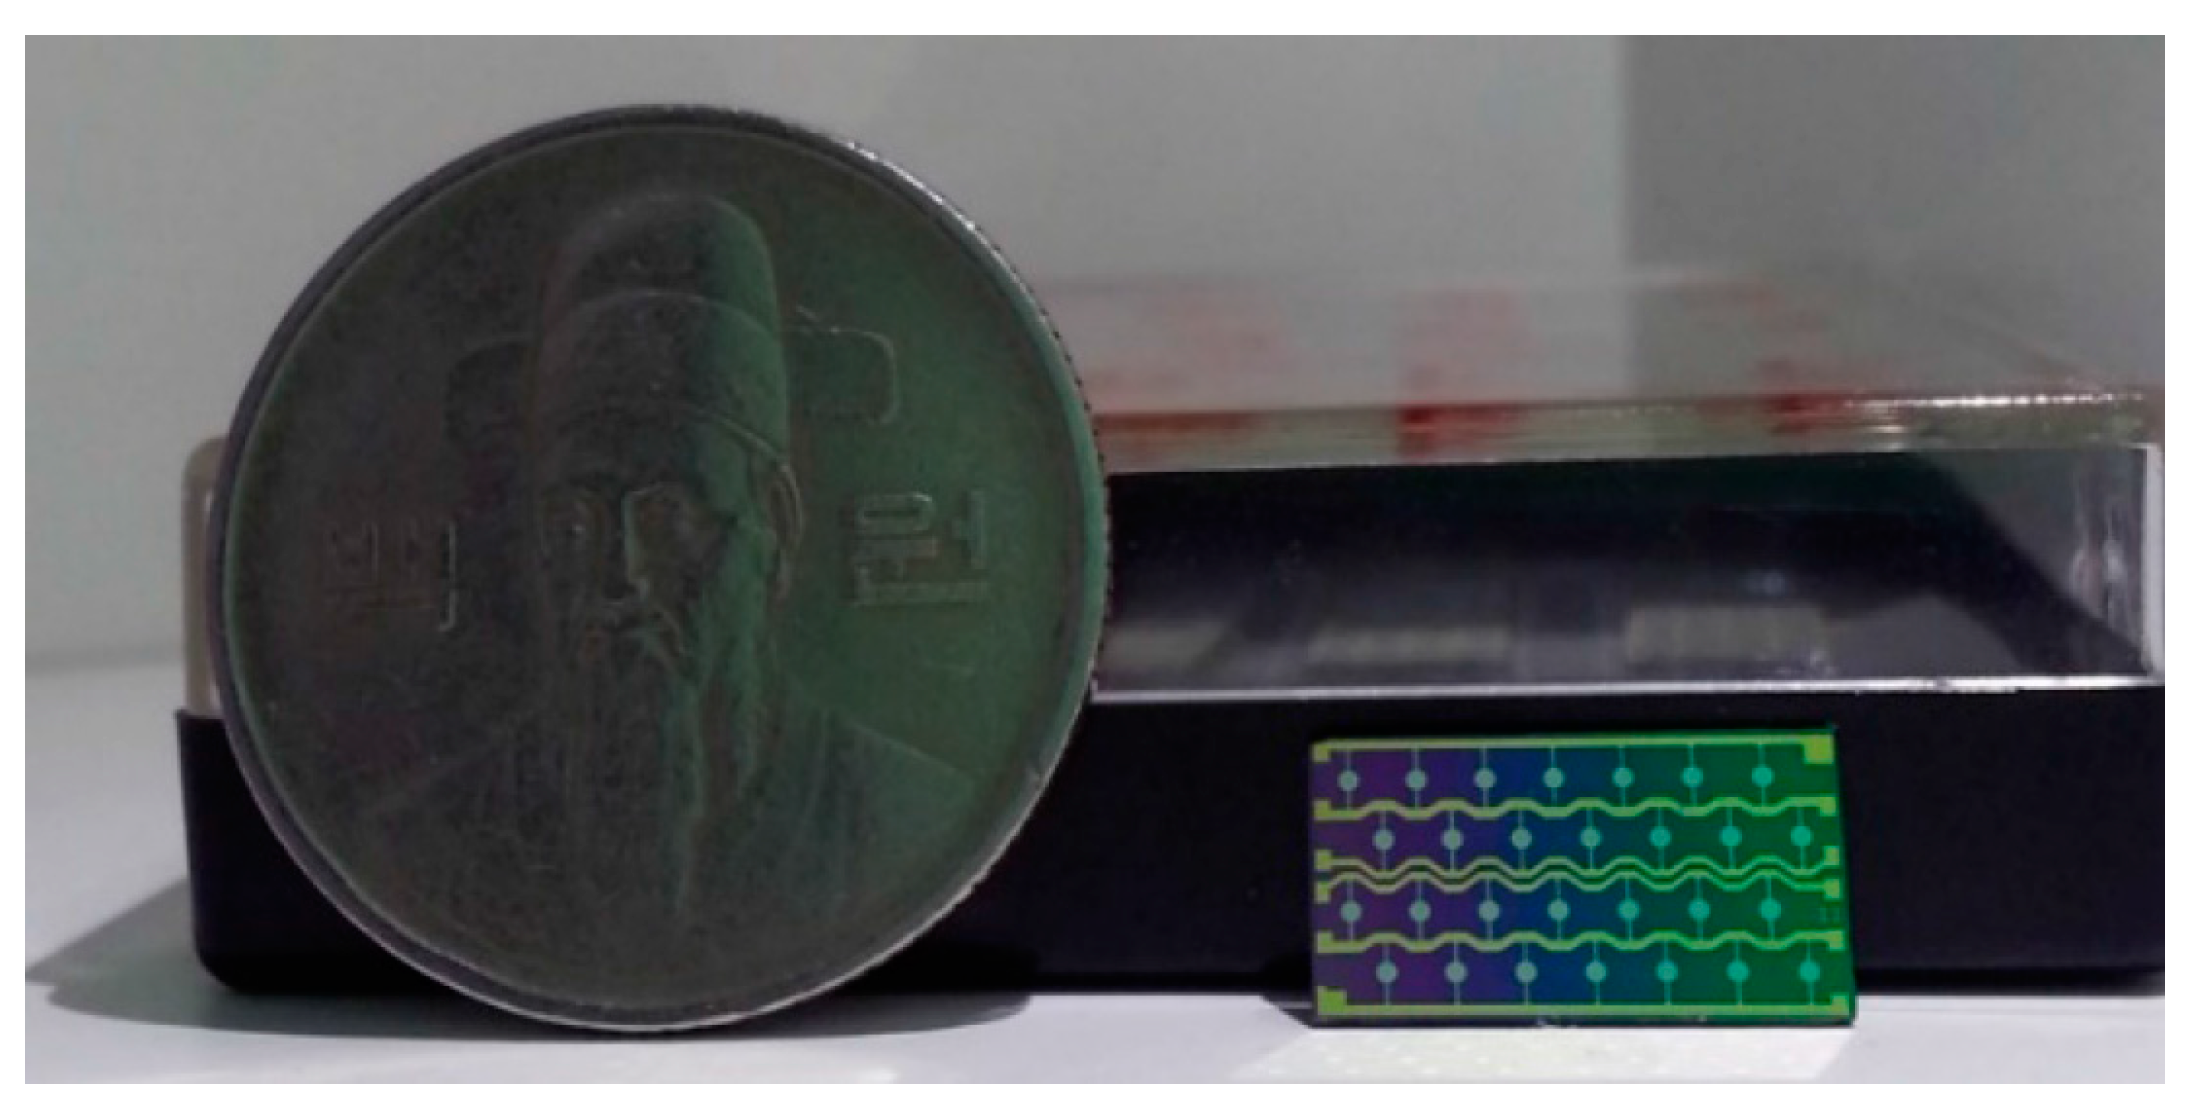
3.1. pMUT Fabrication
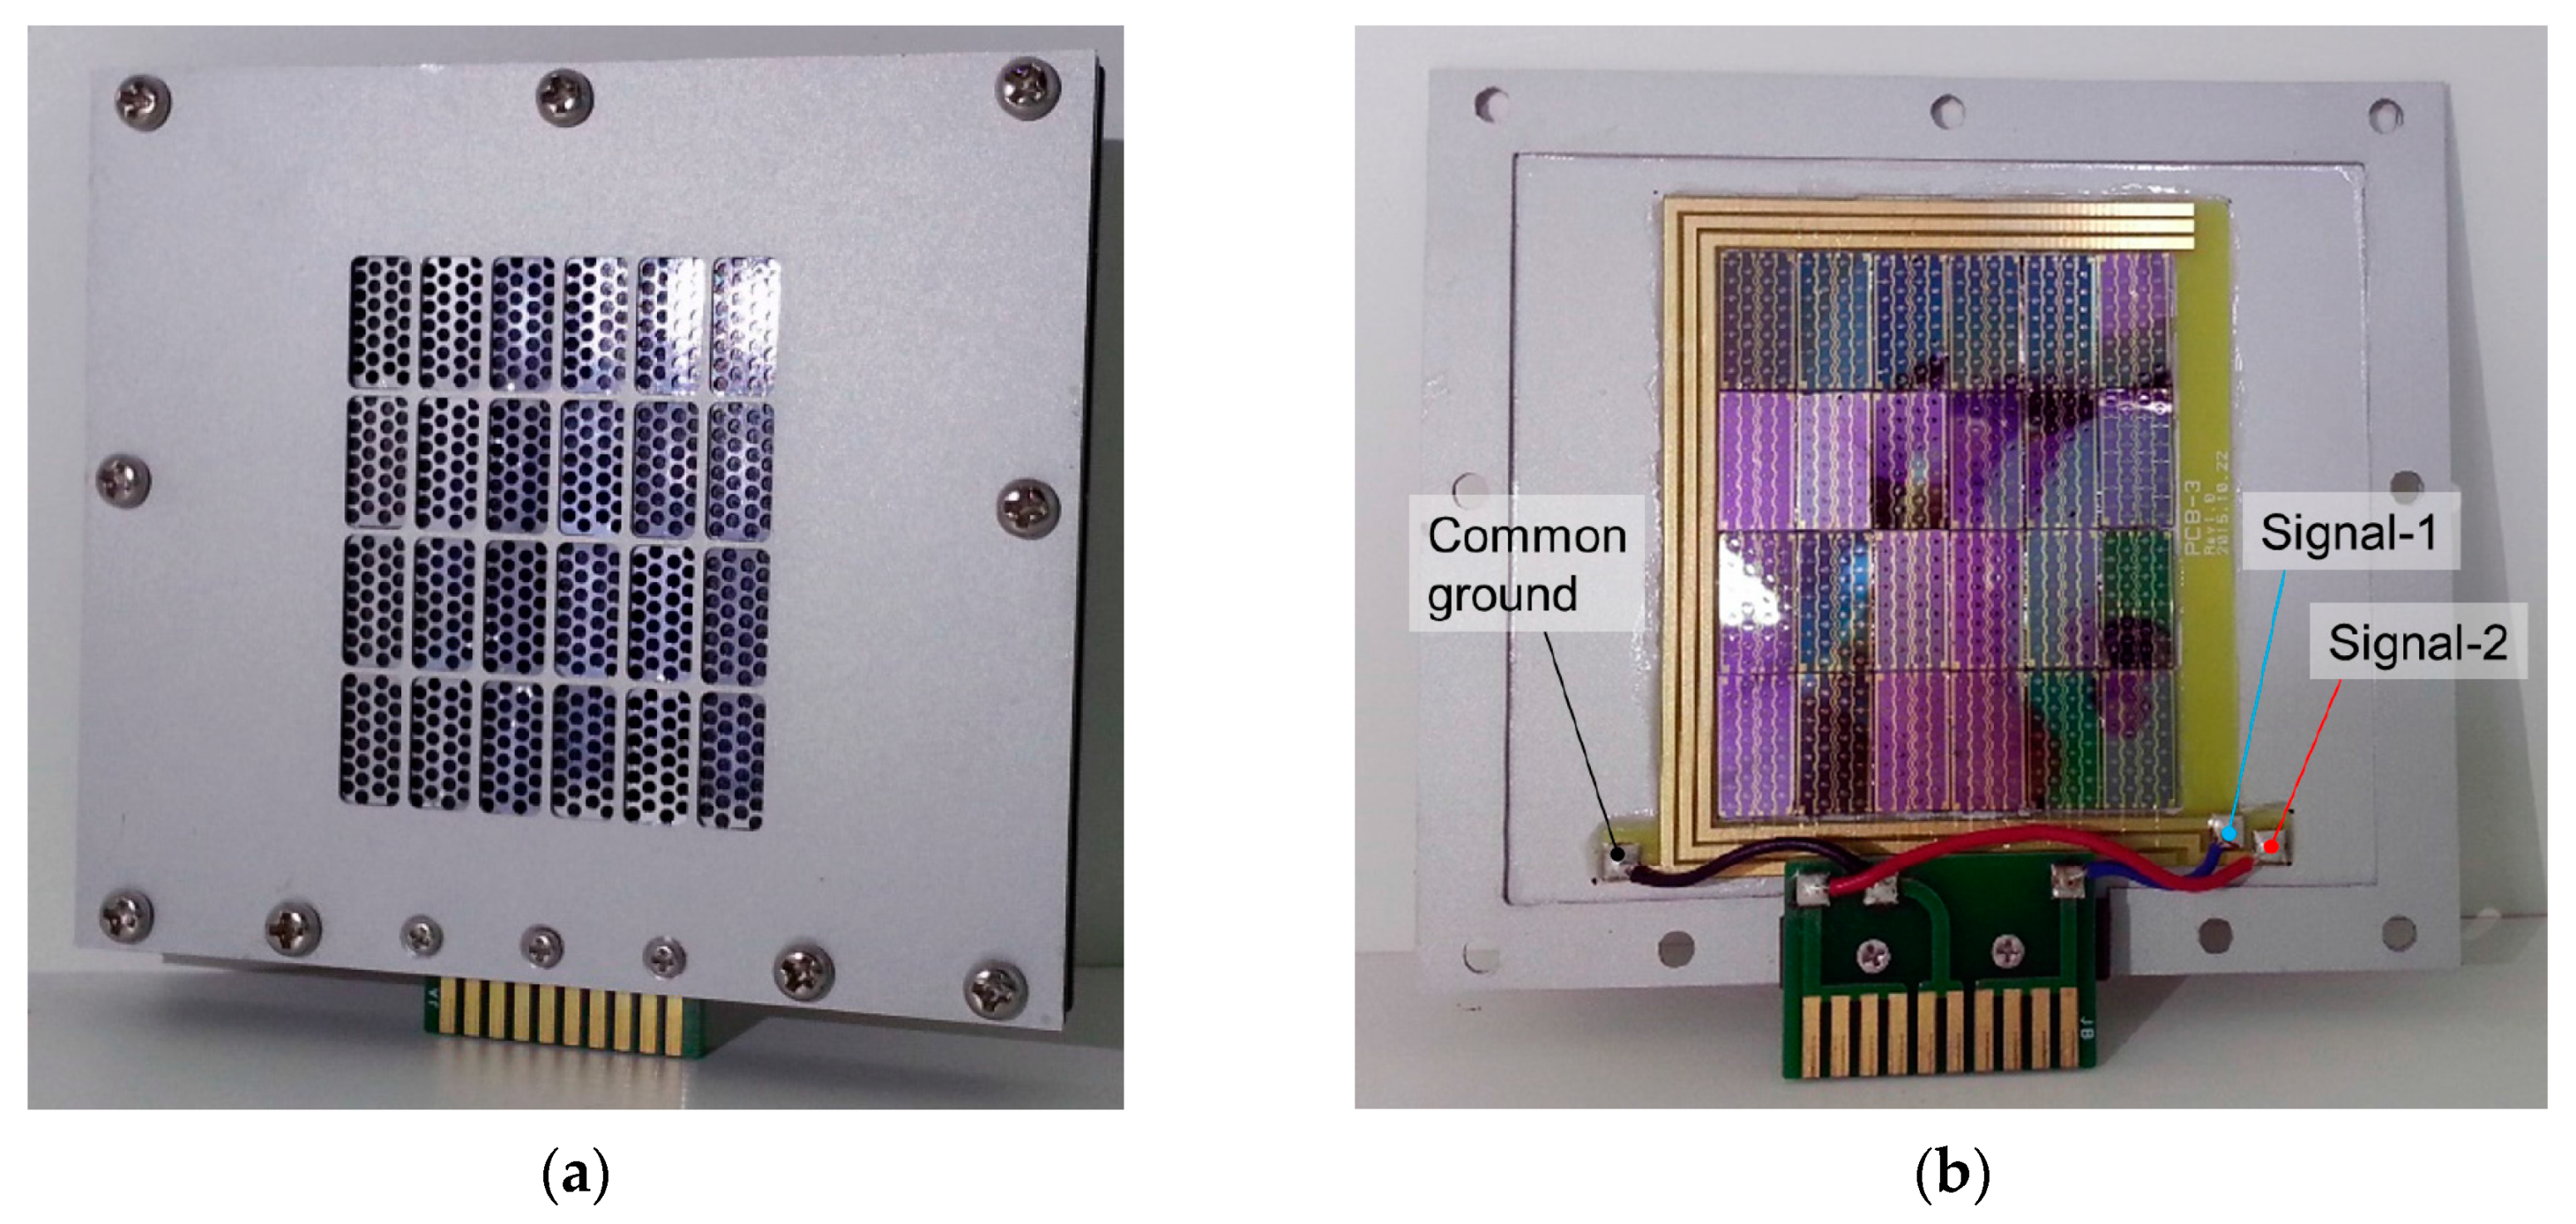
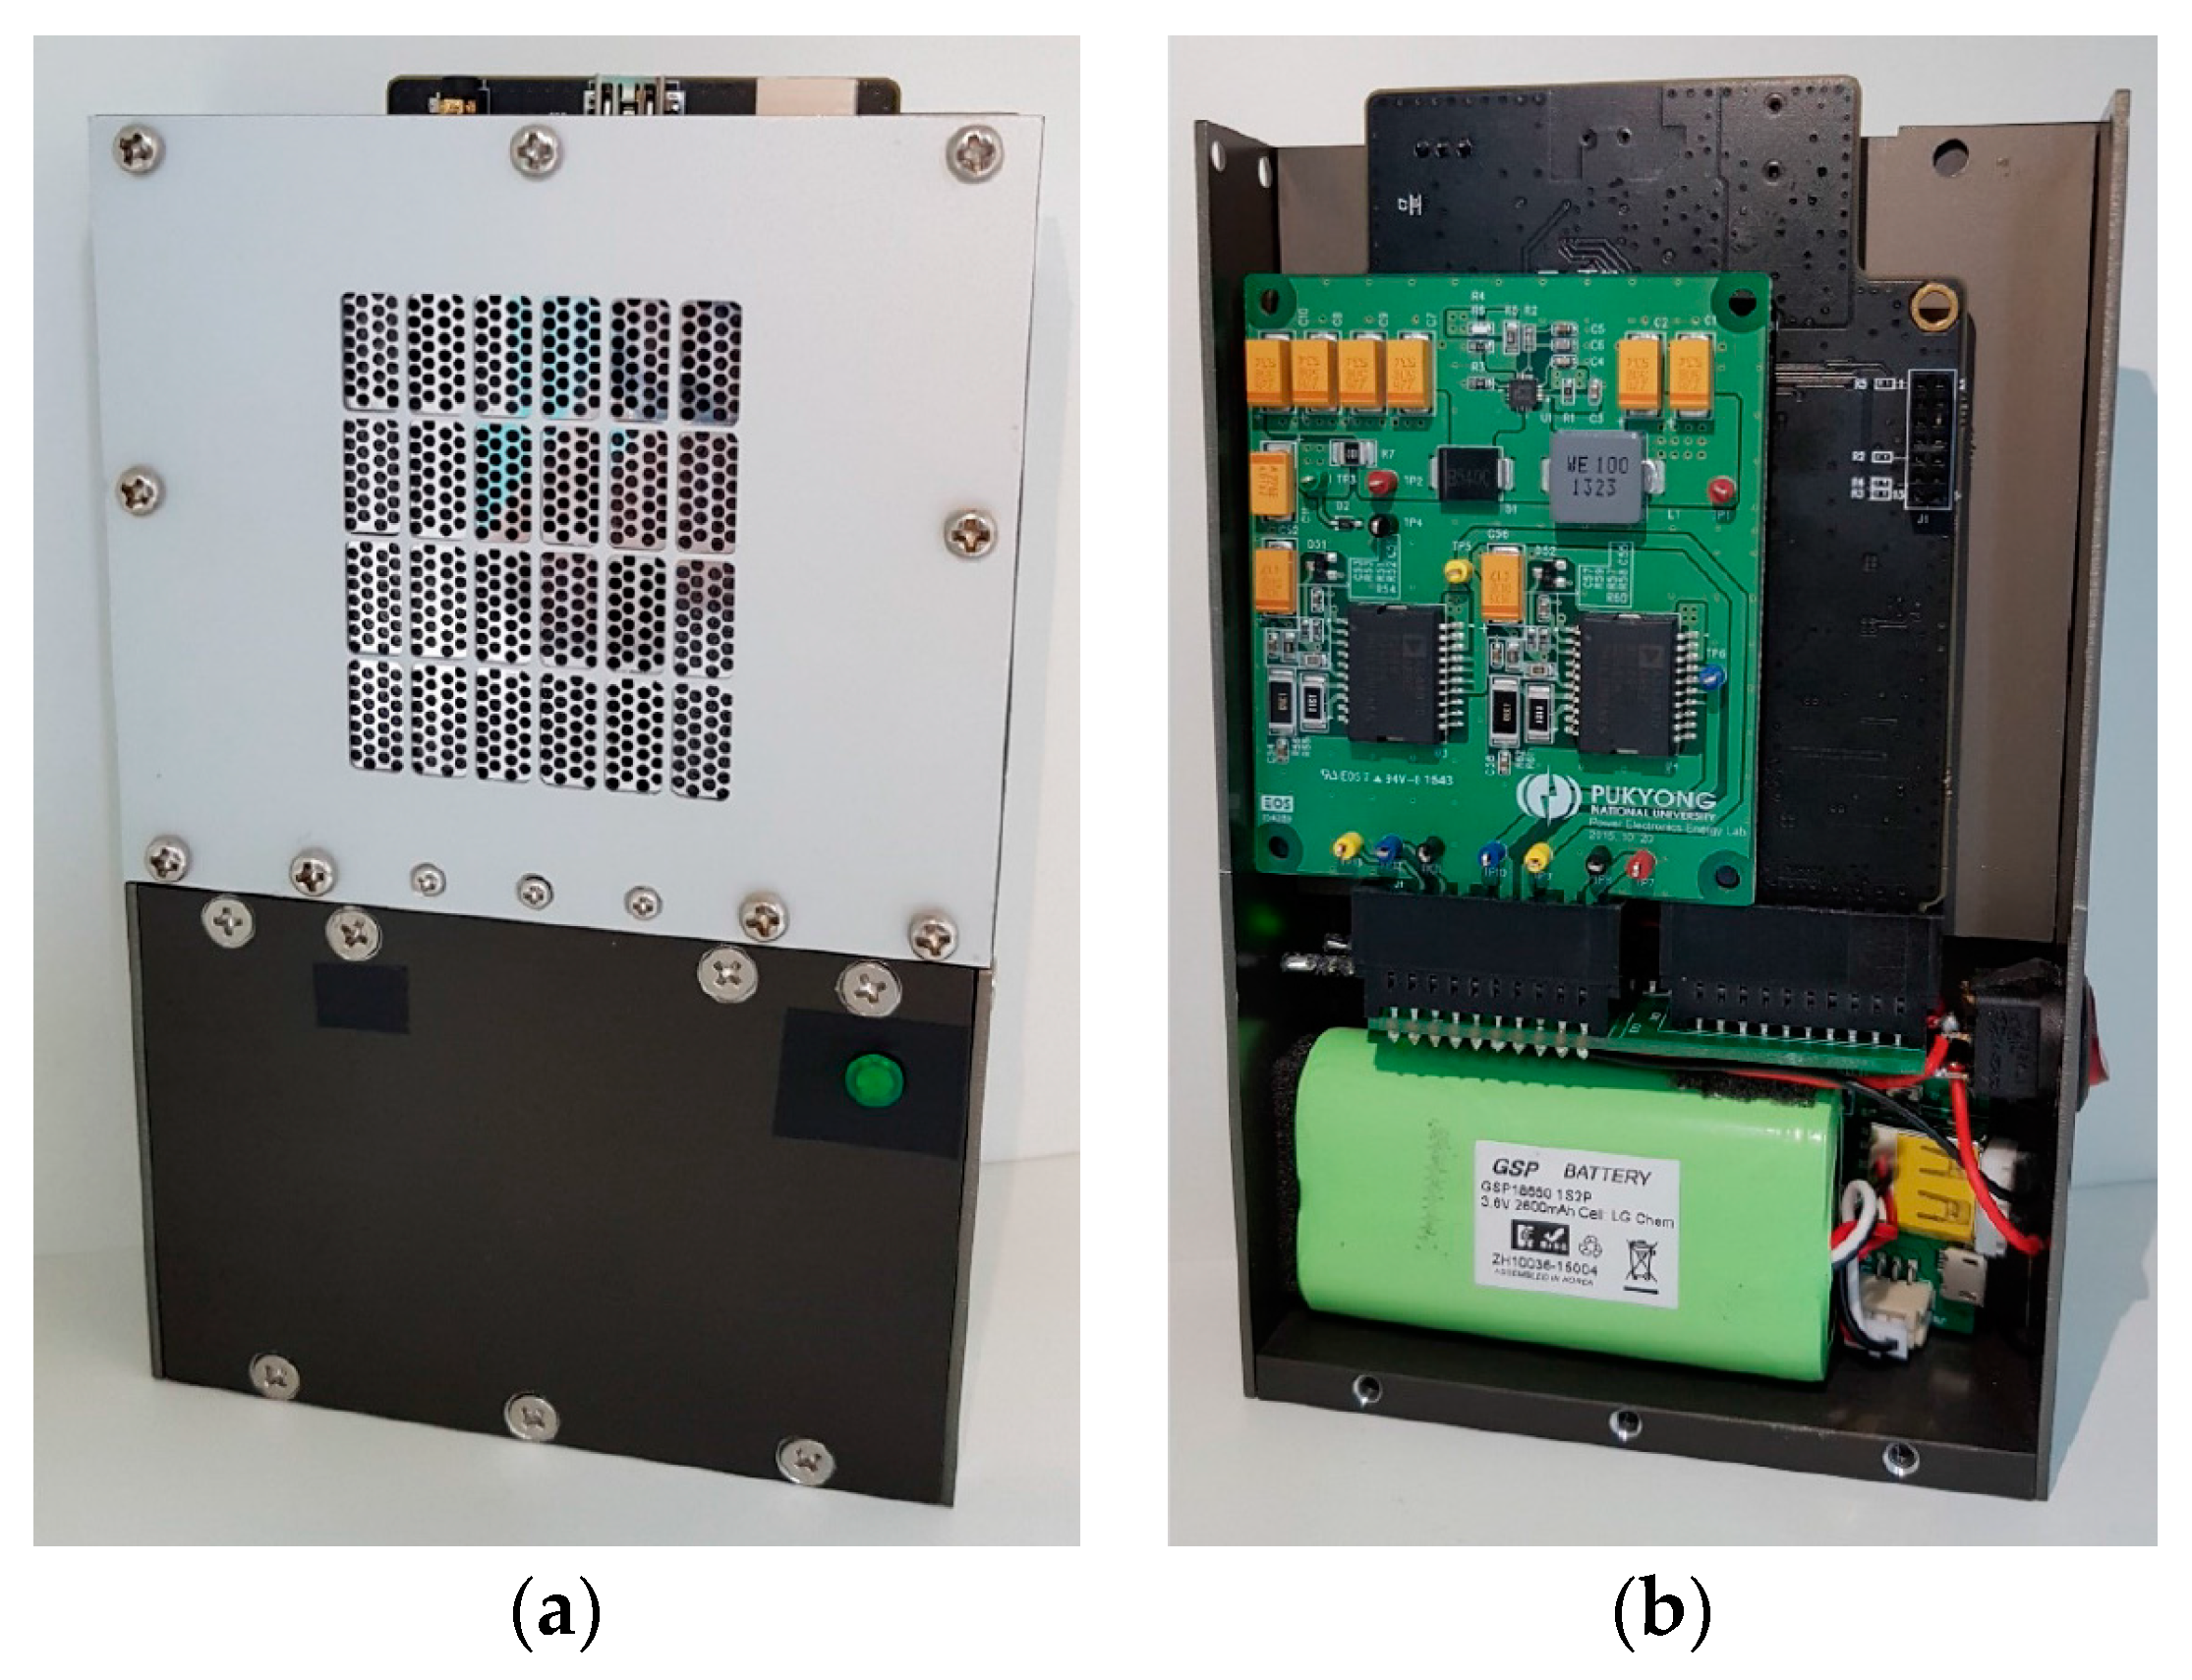
3.2. Packaged Compact Parametric Array Loudspeaker
4. Results and Discussion
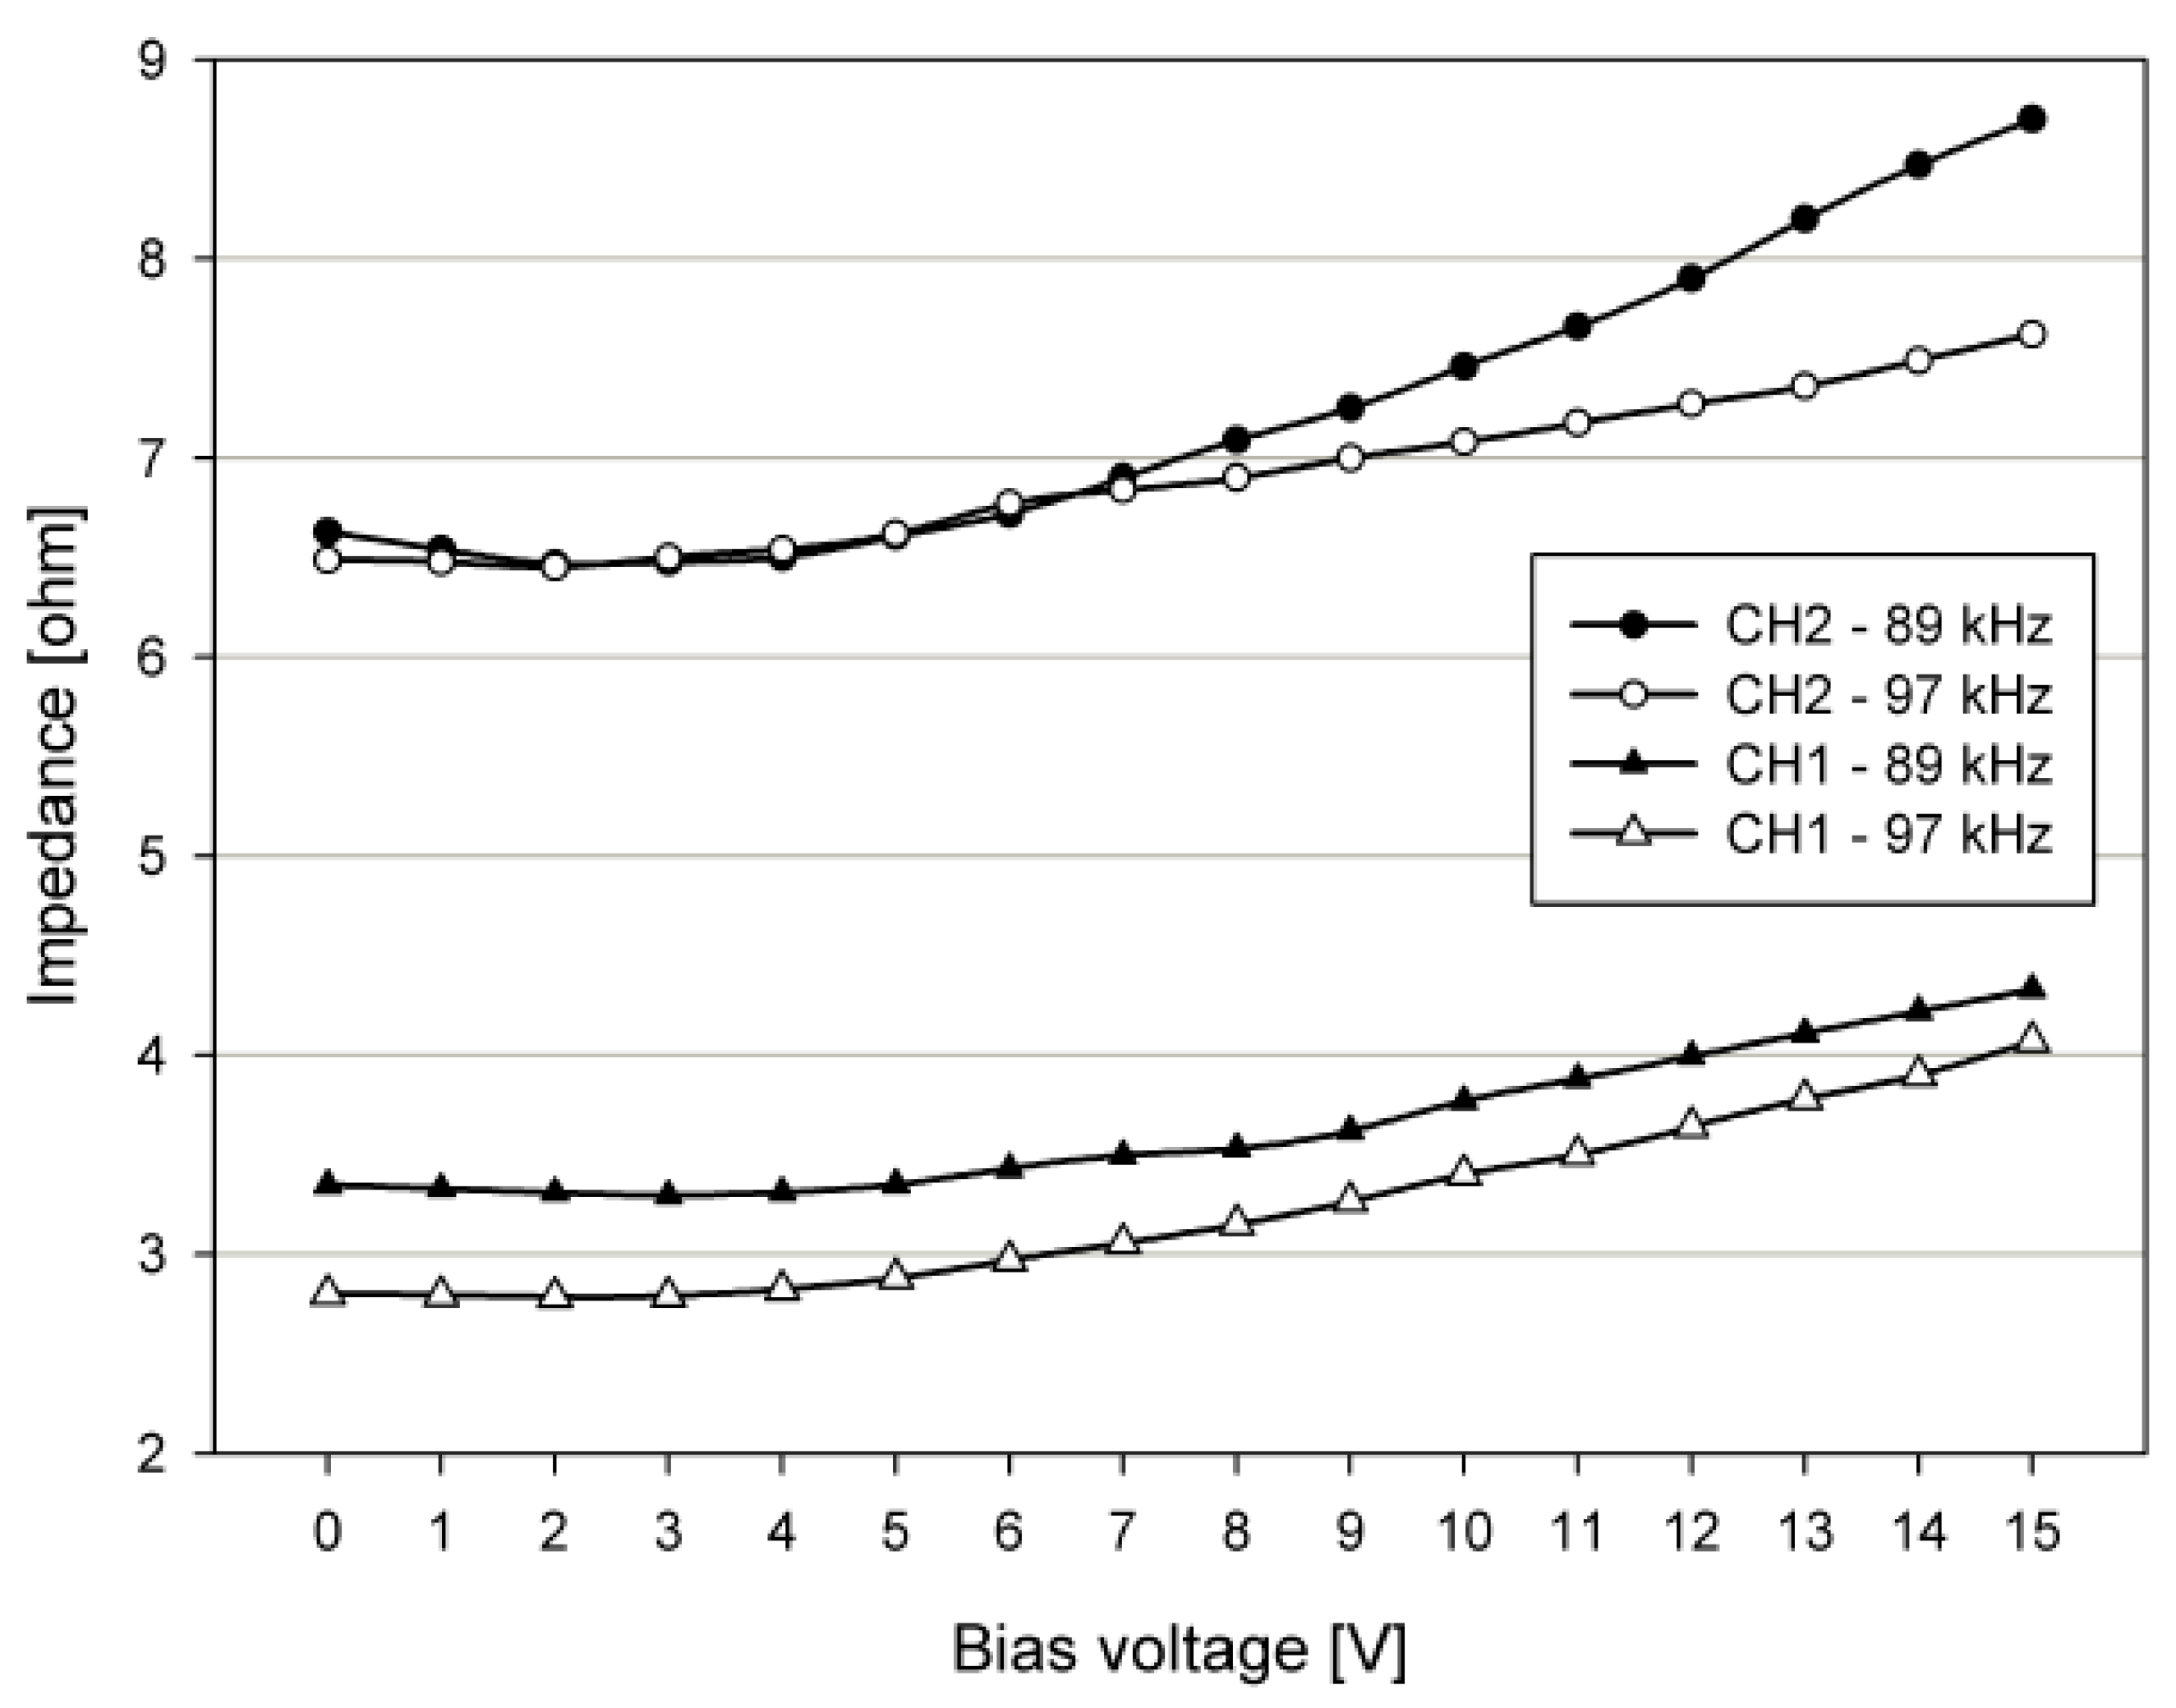
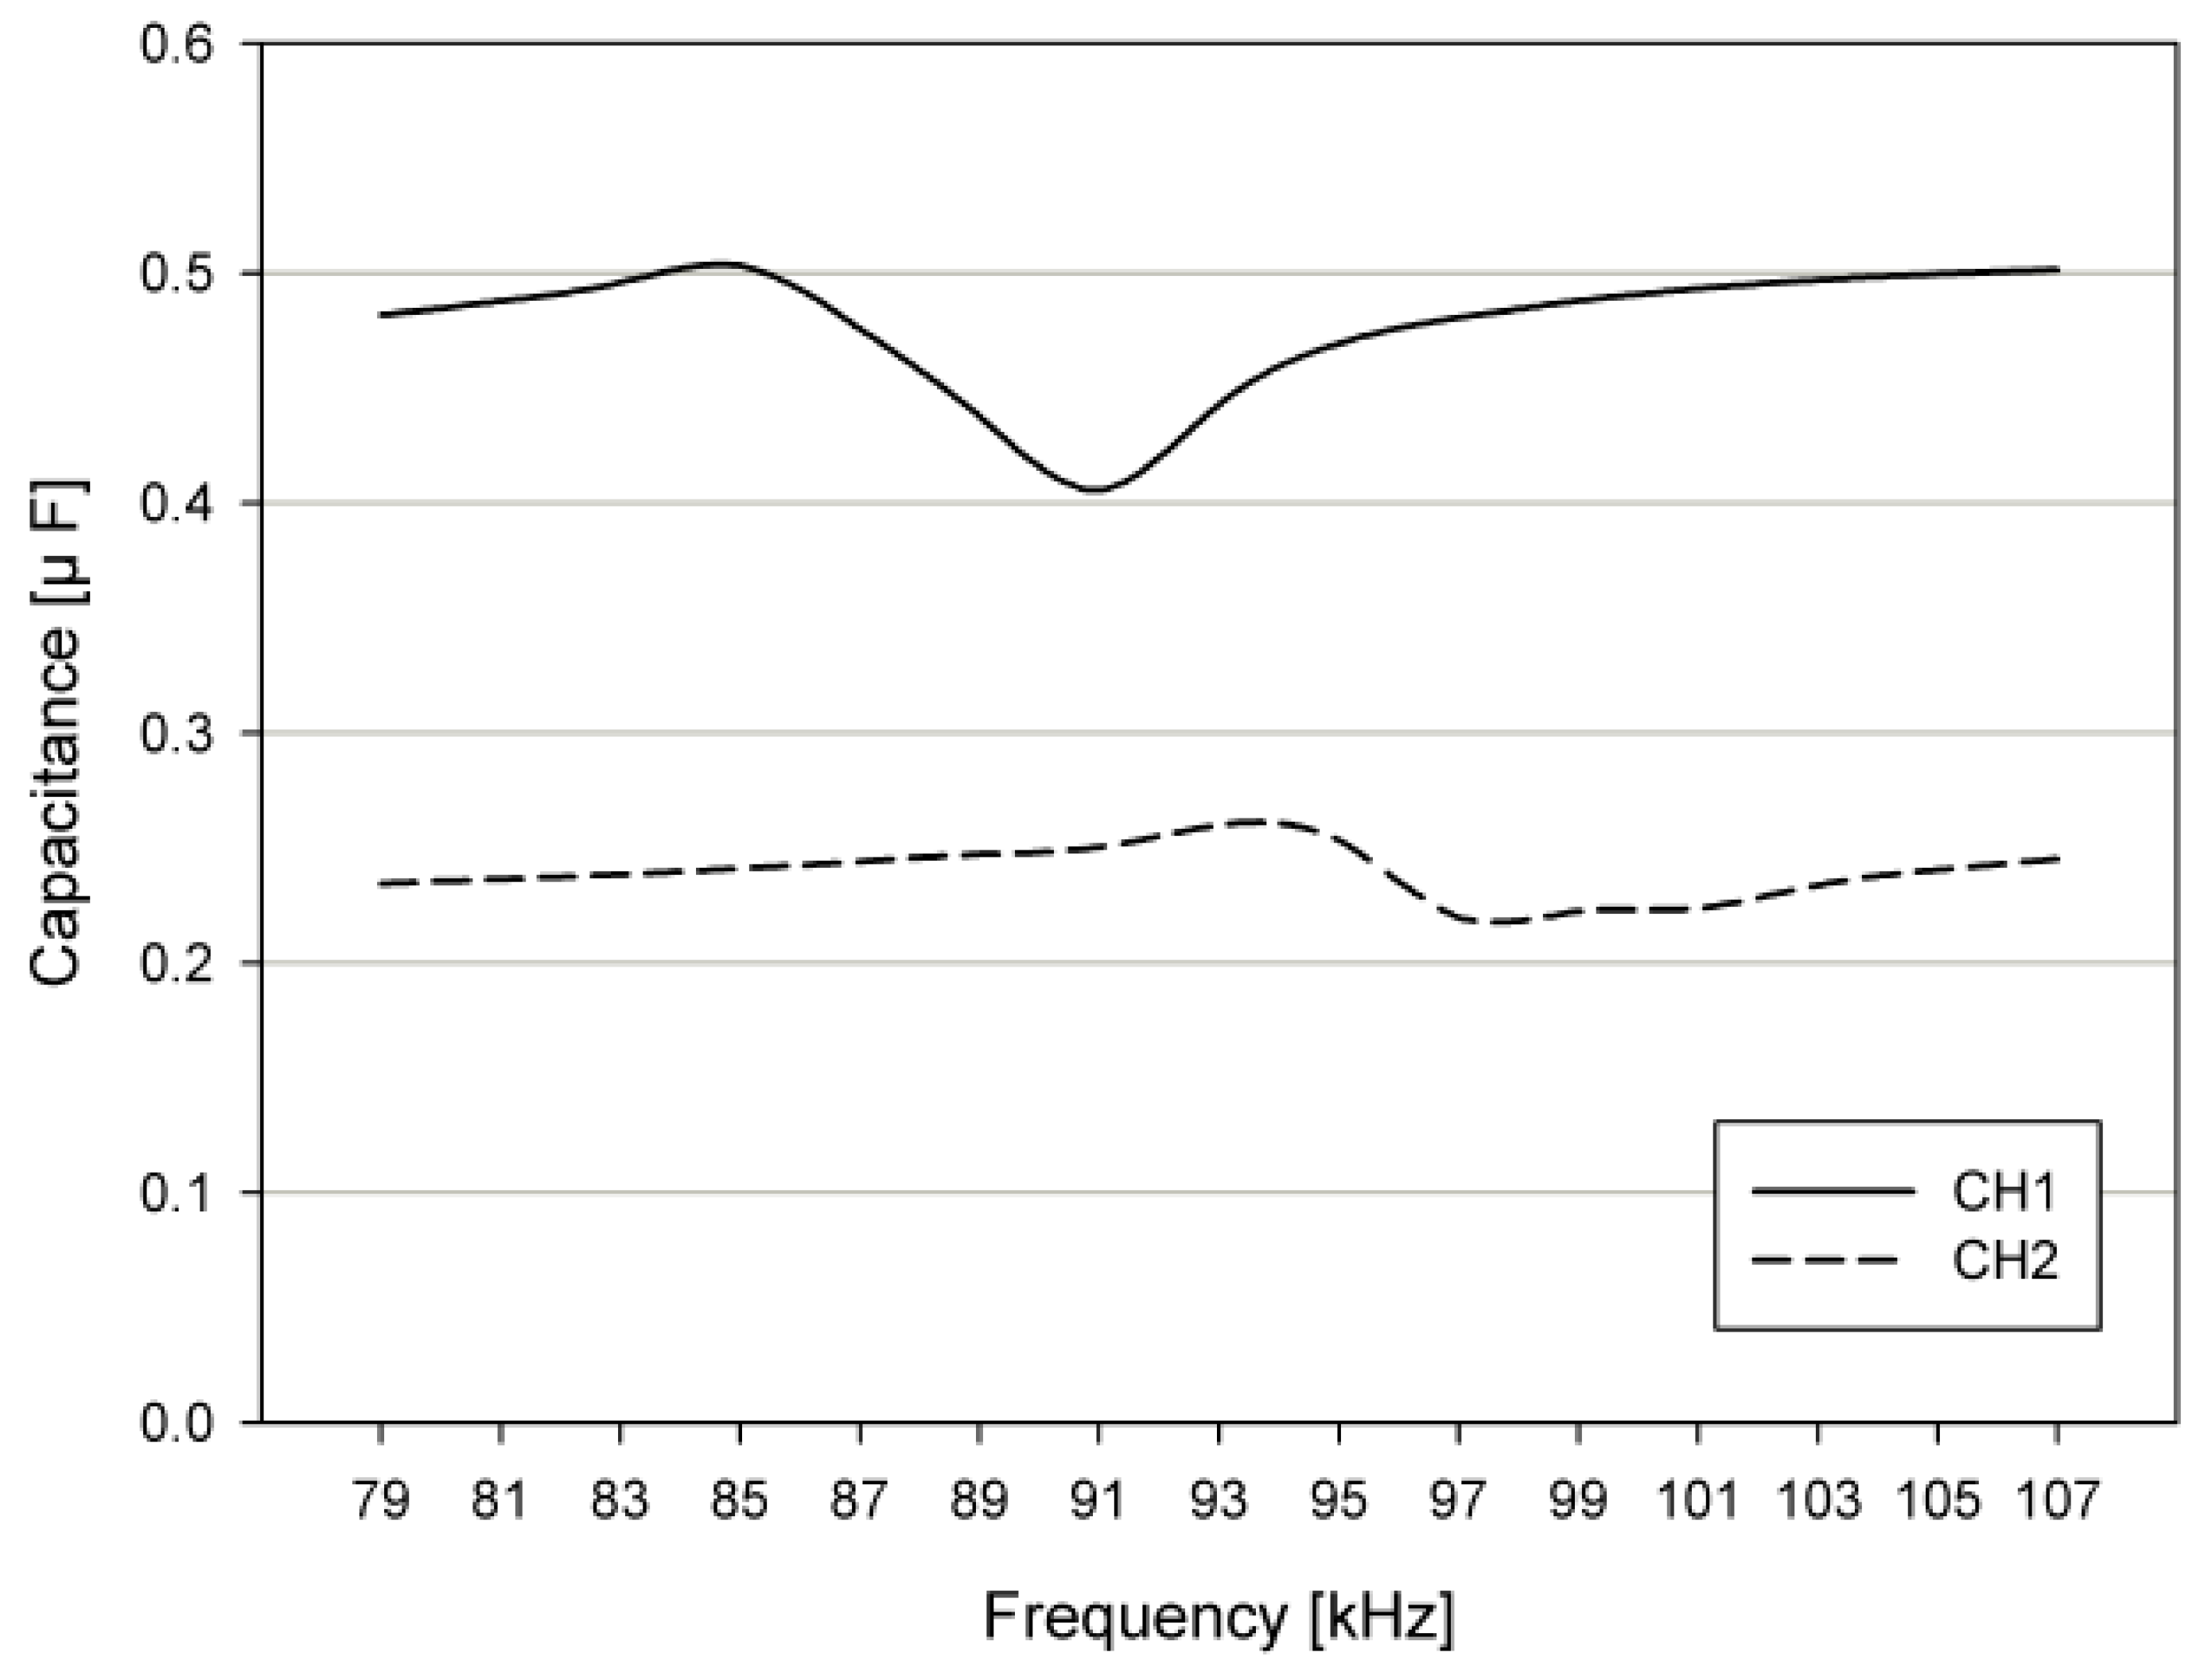
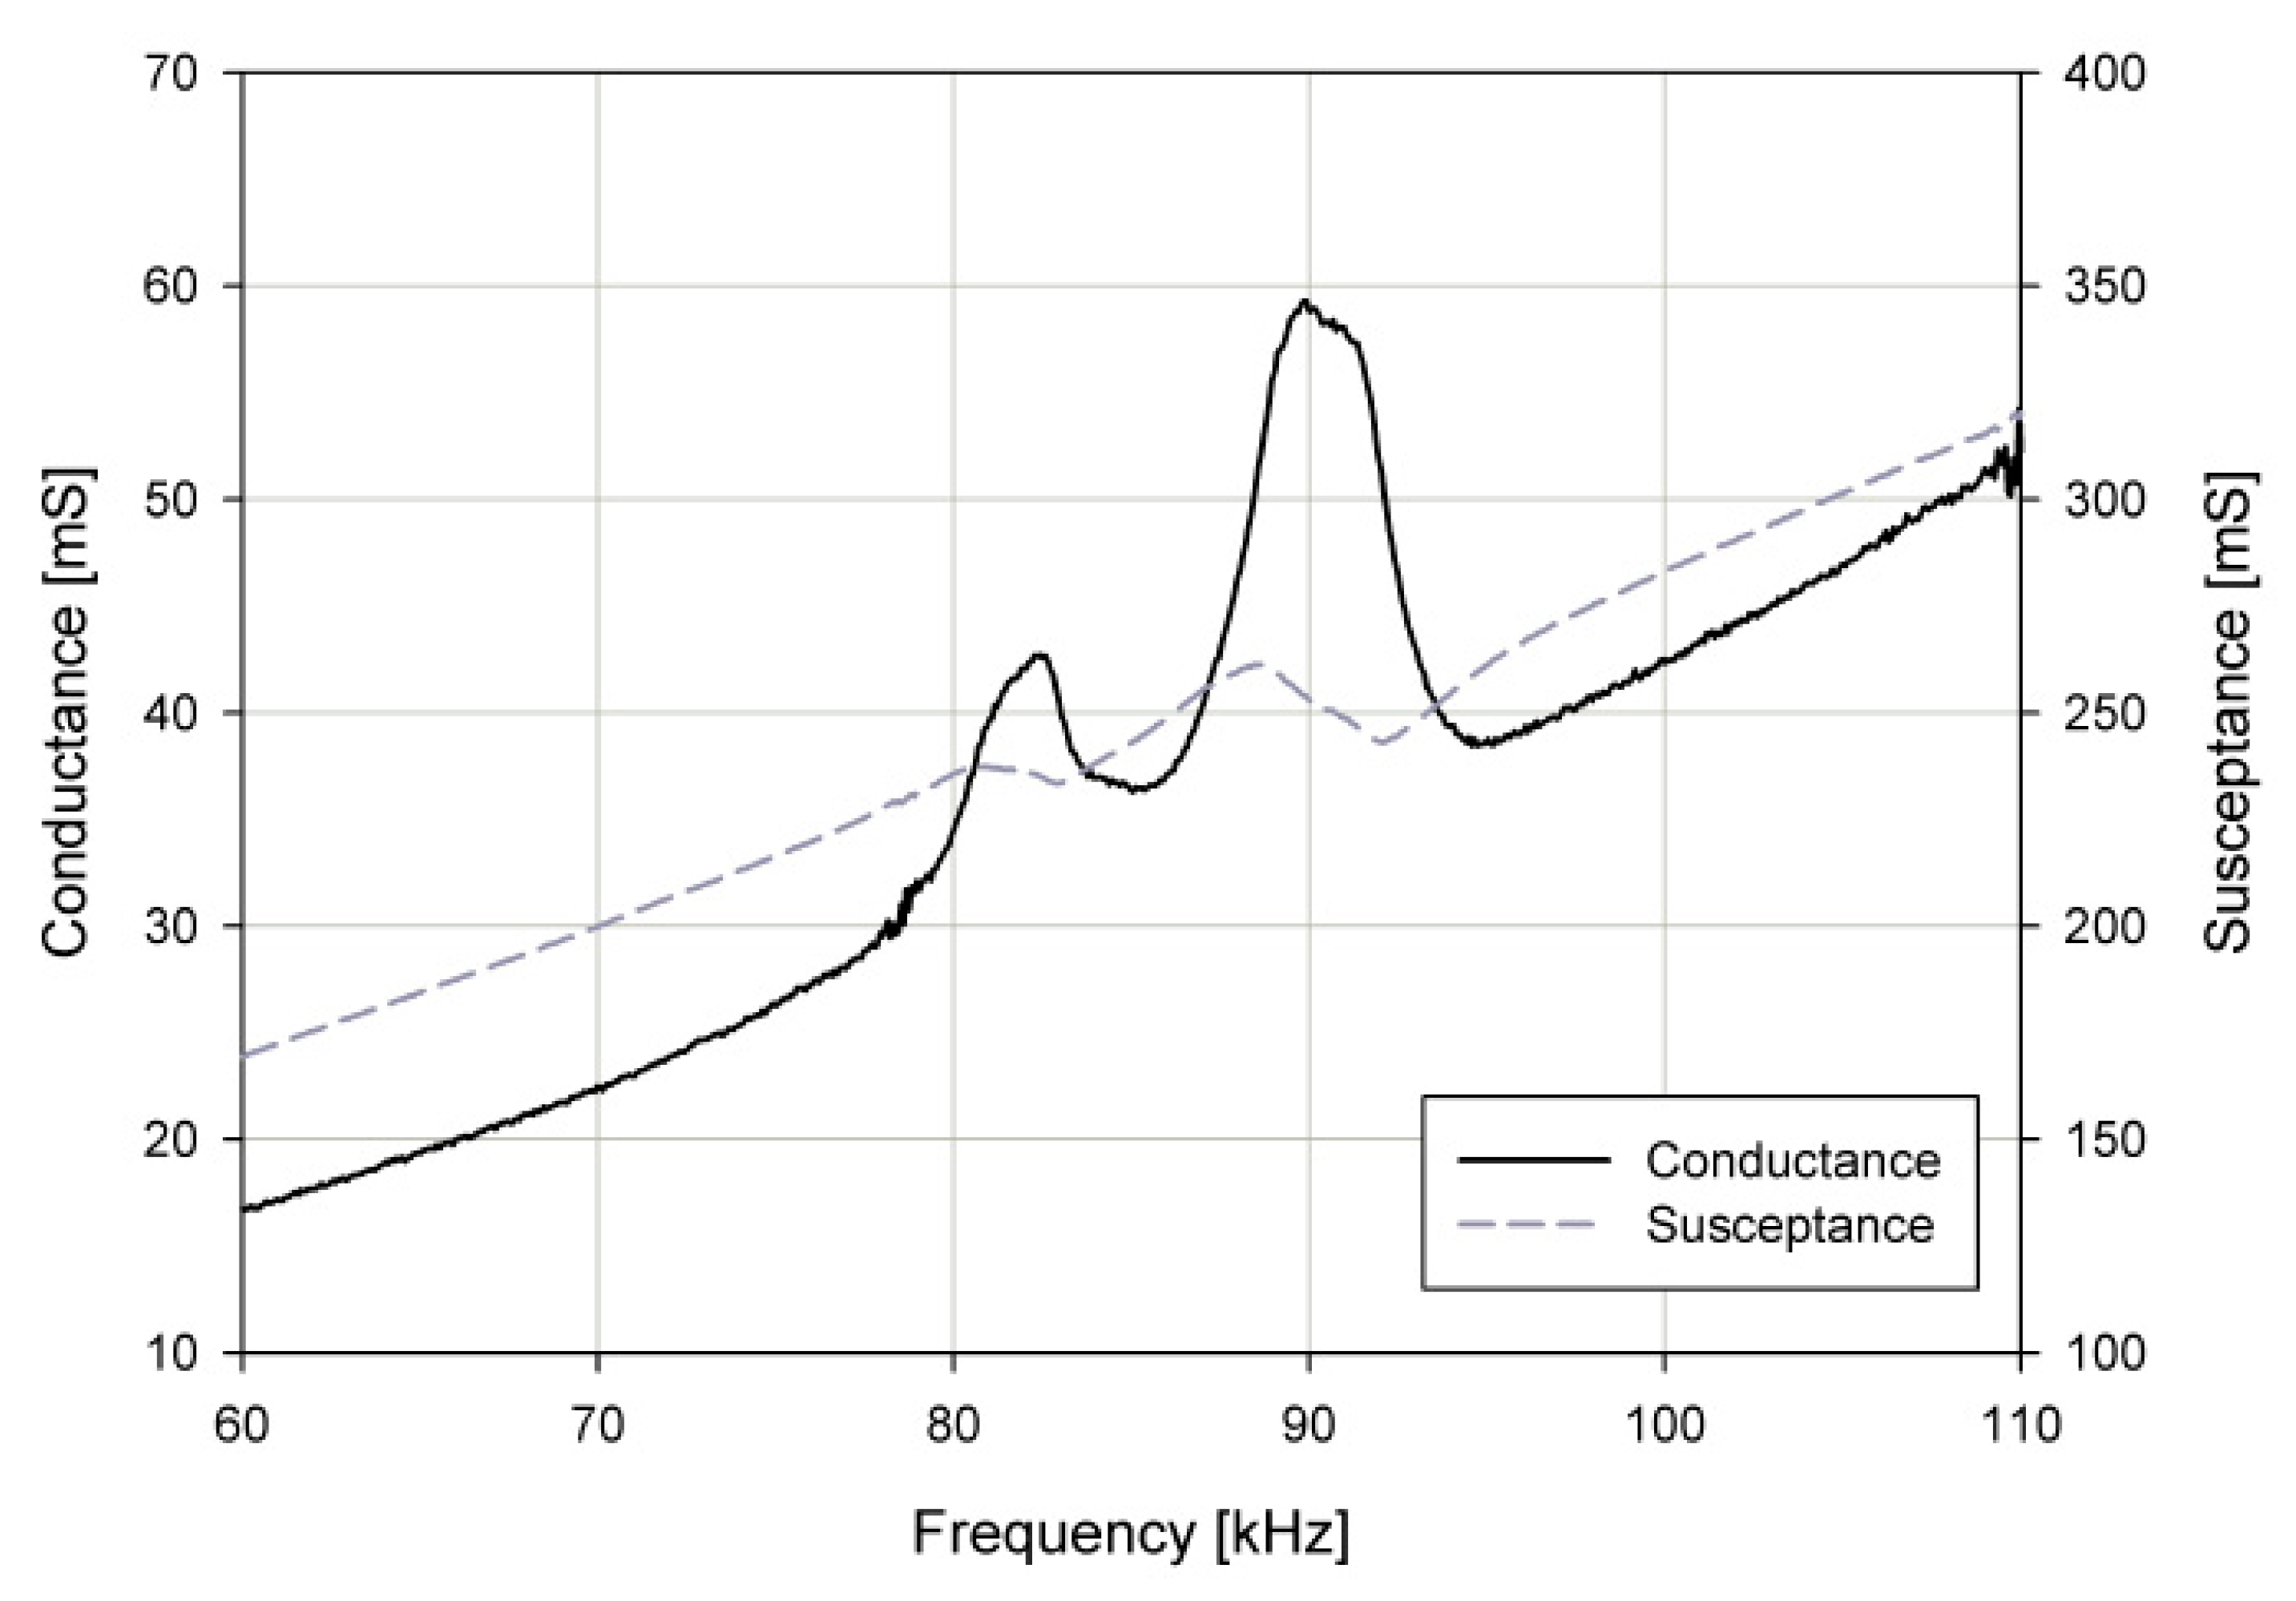
4.1. Admittance Measurement
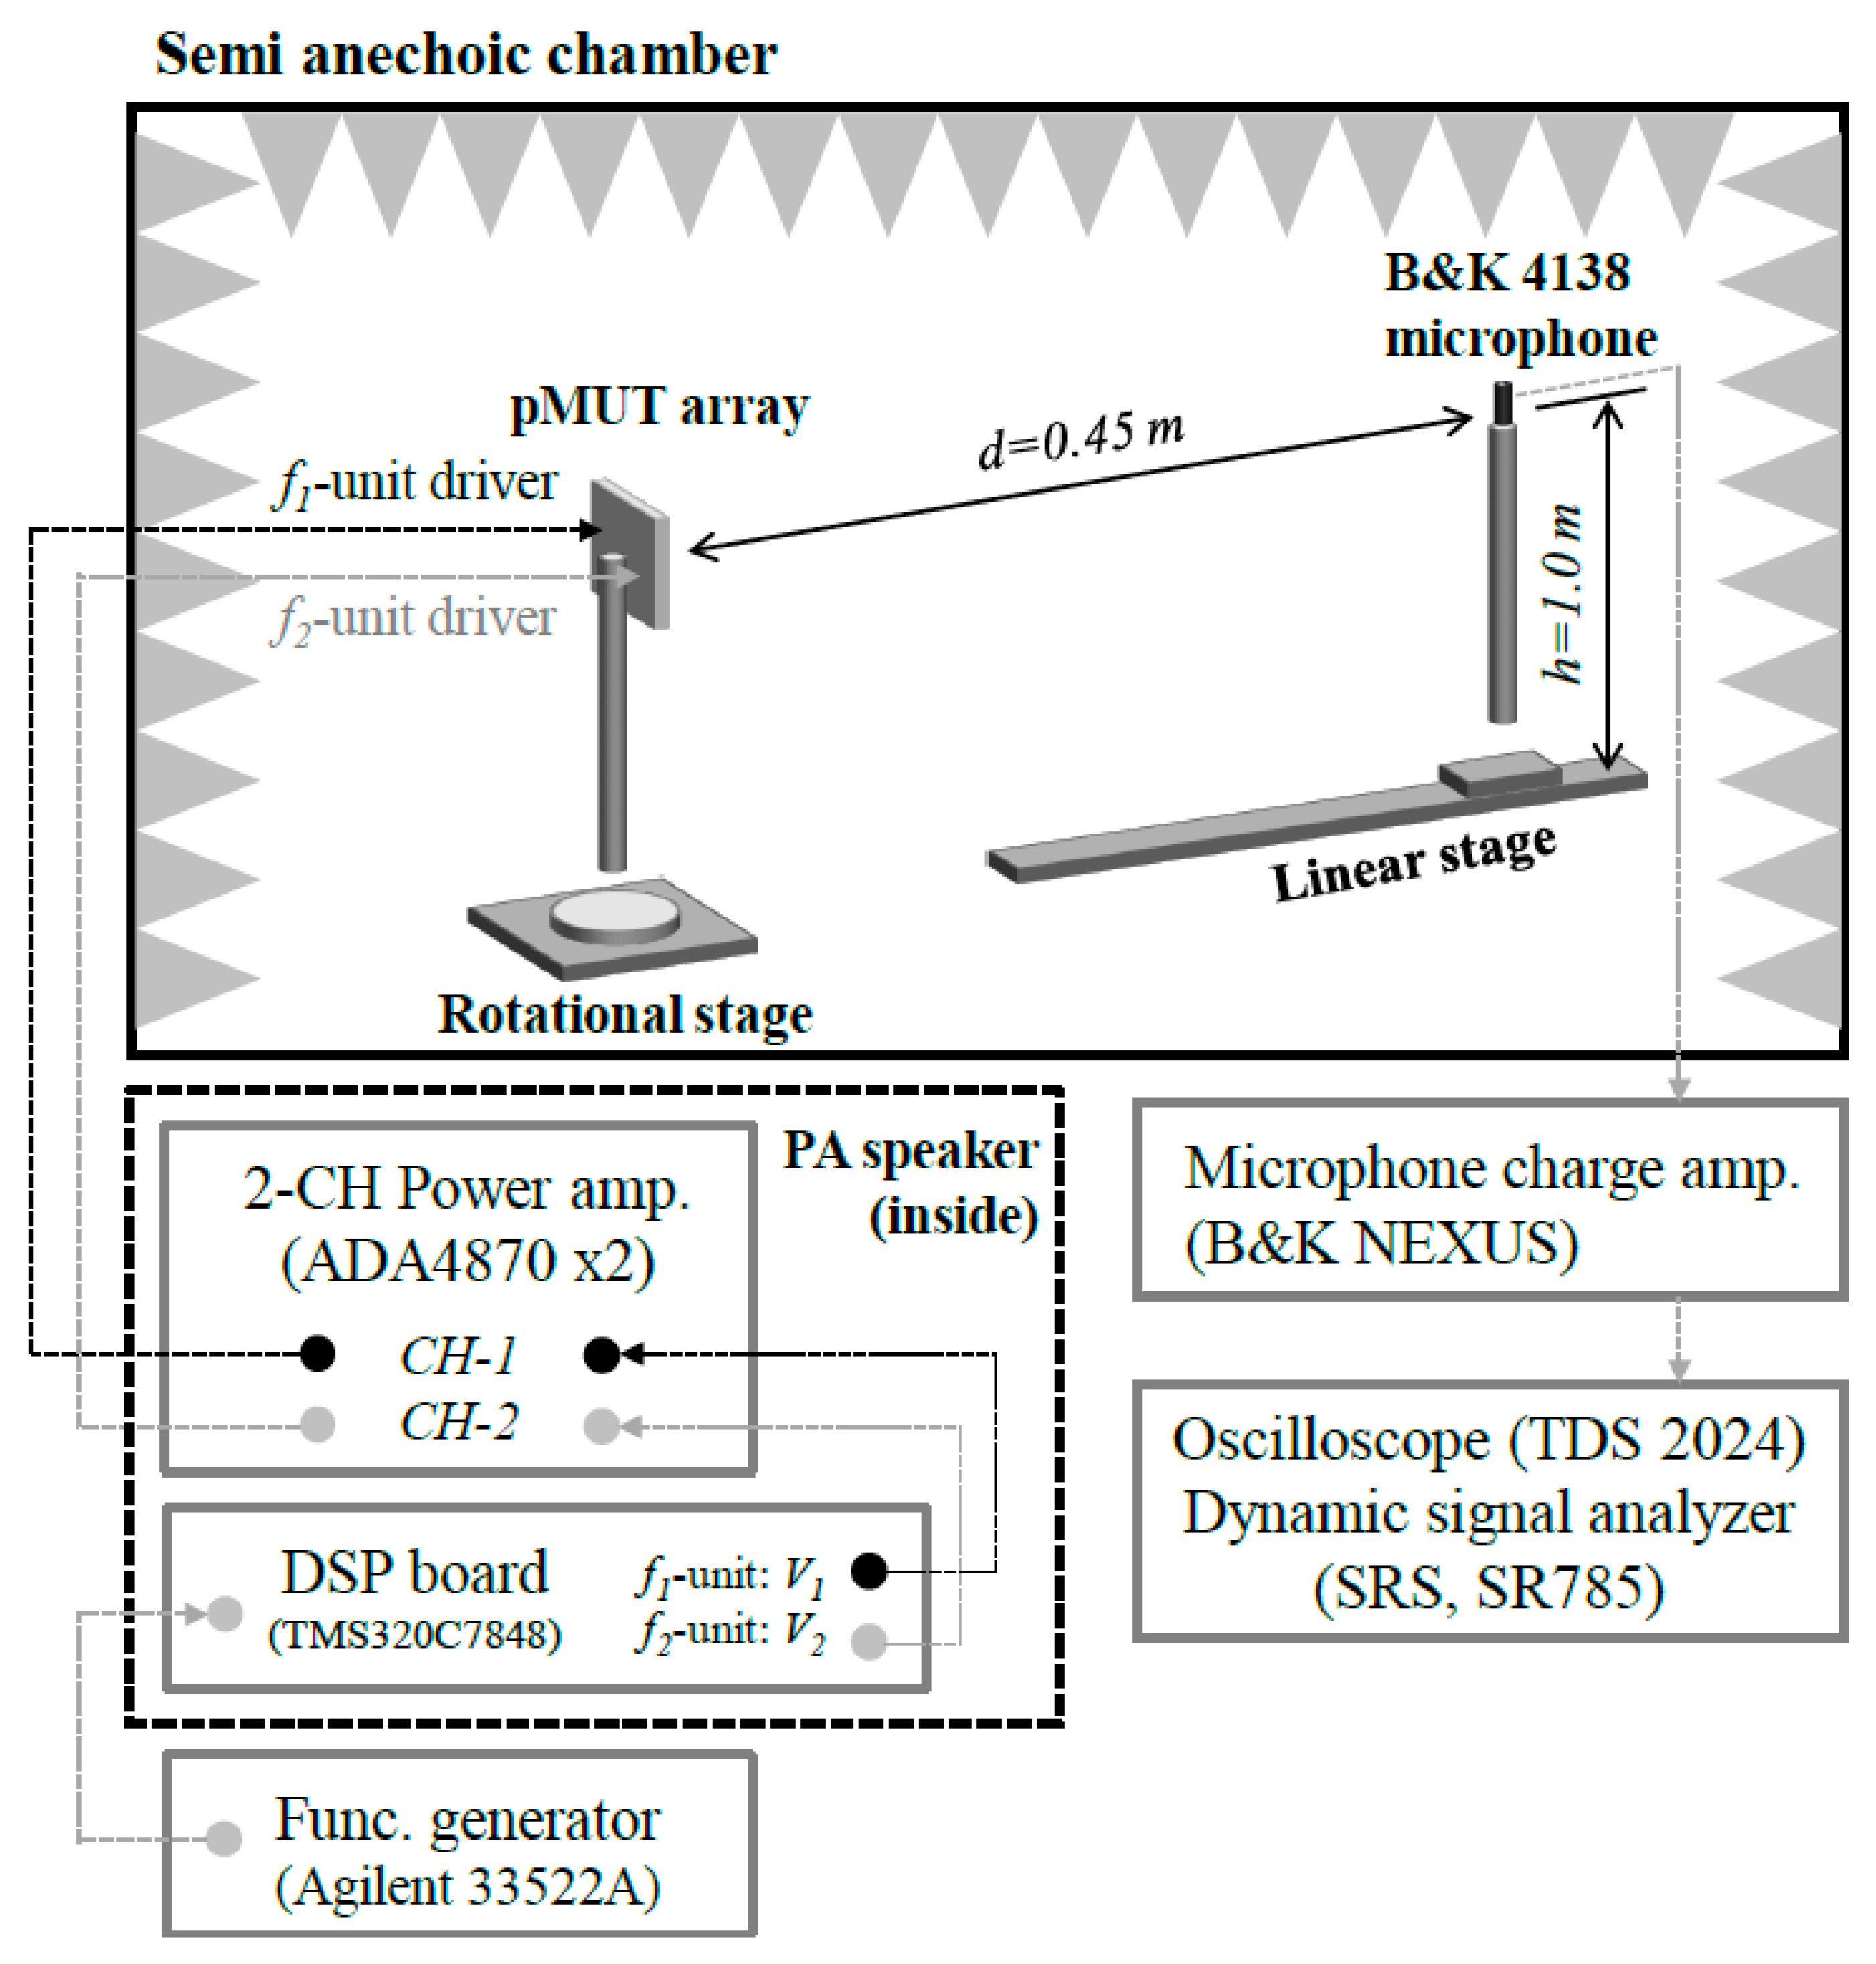
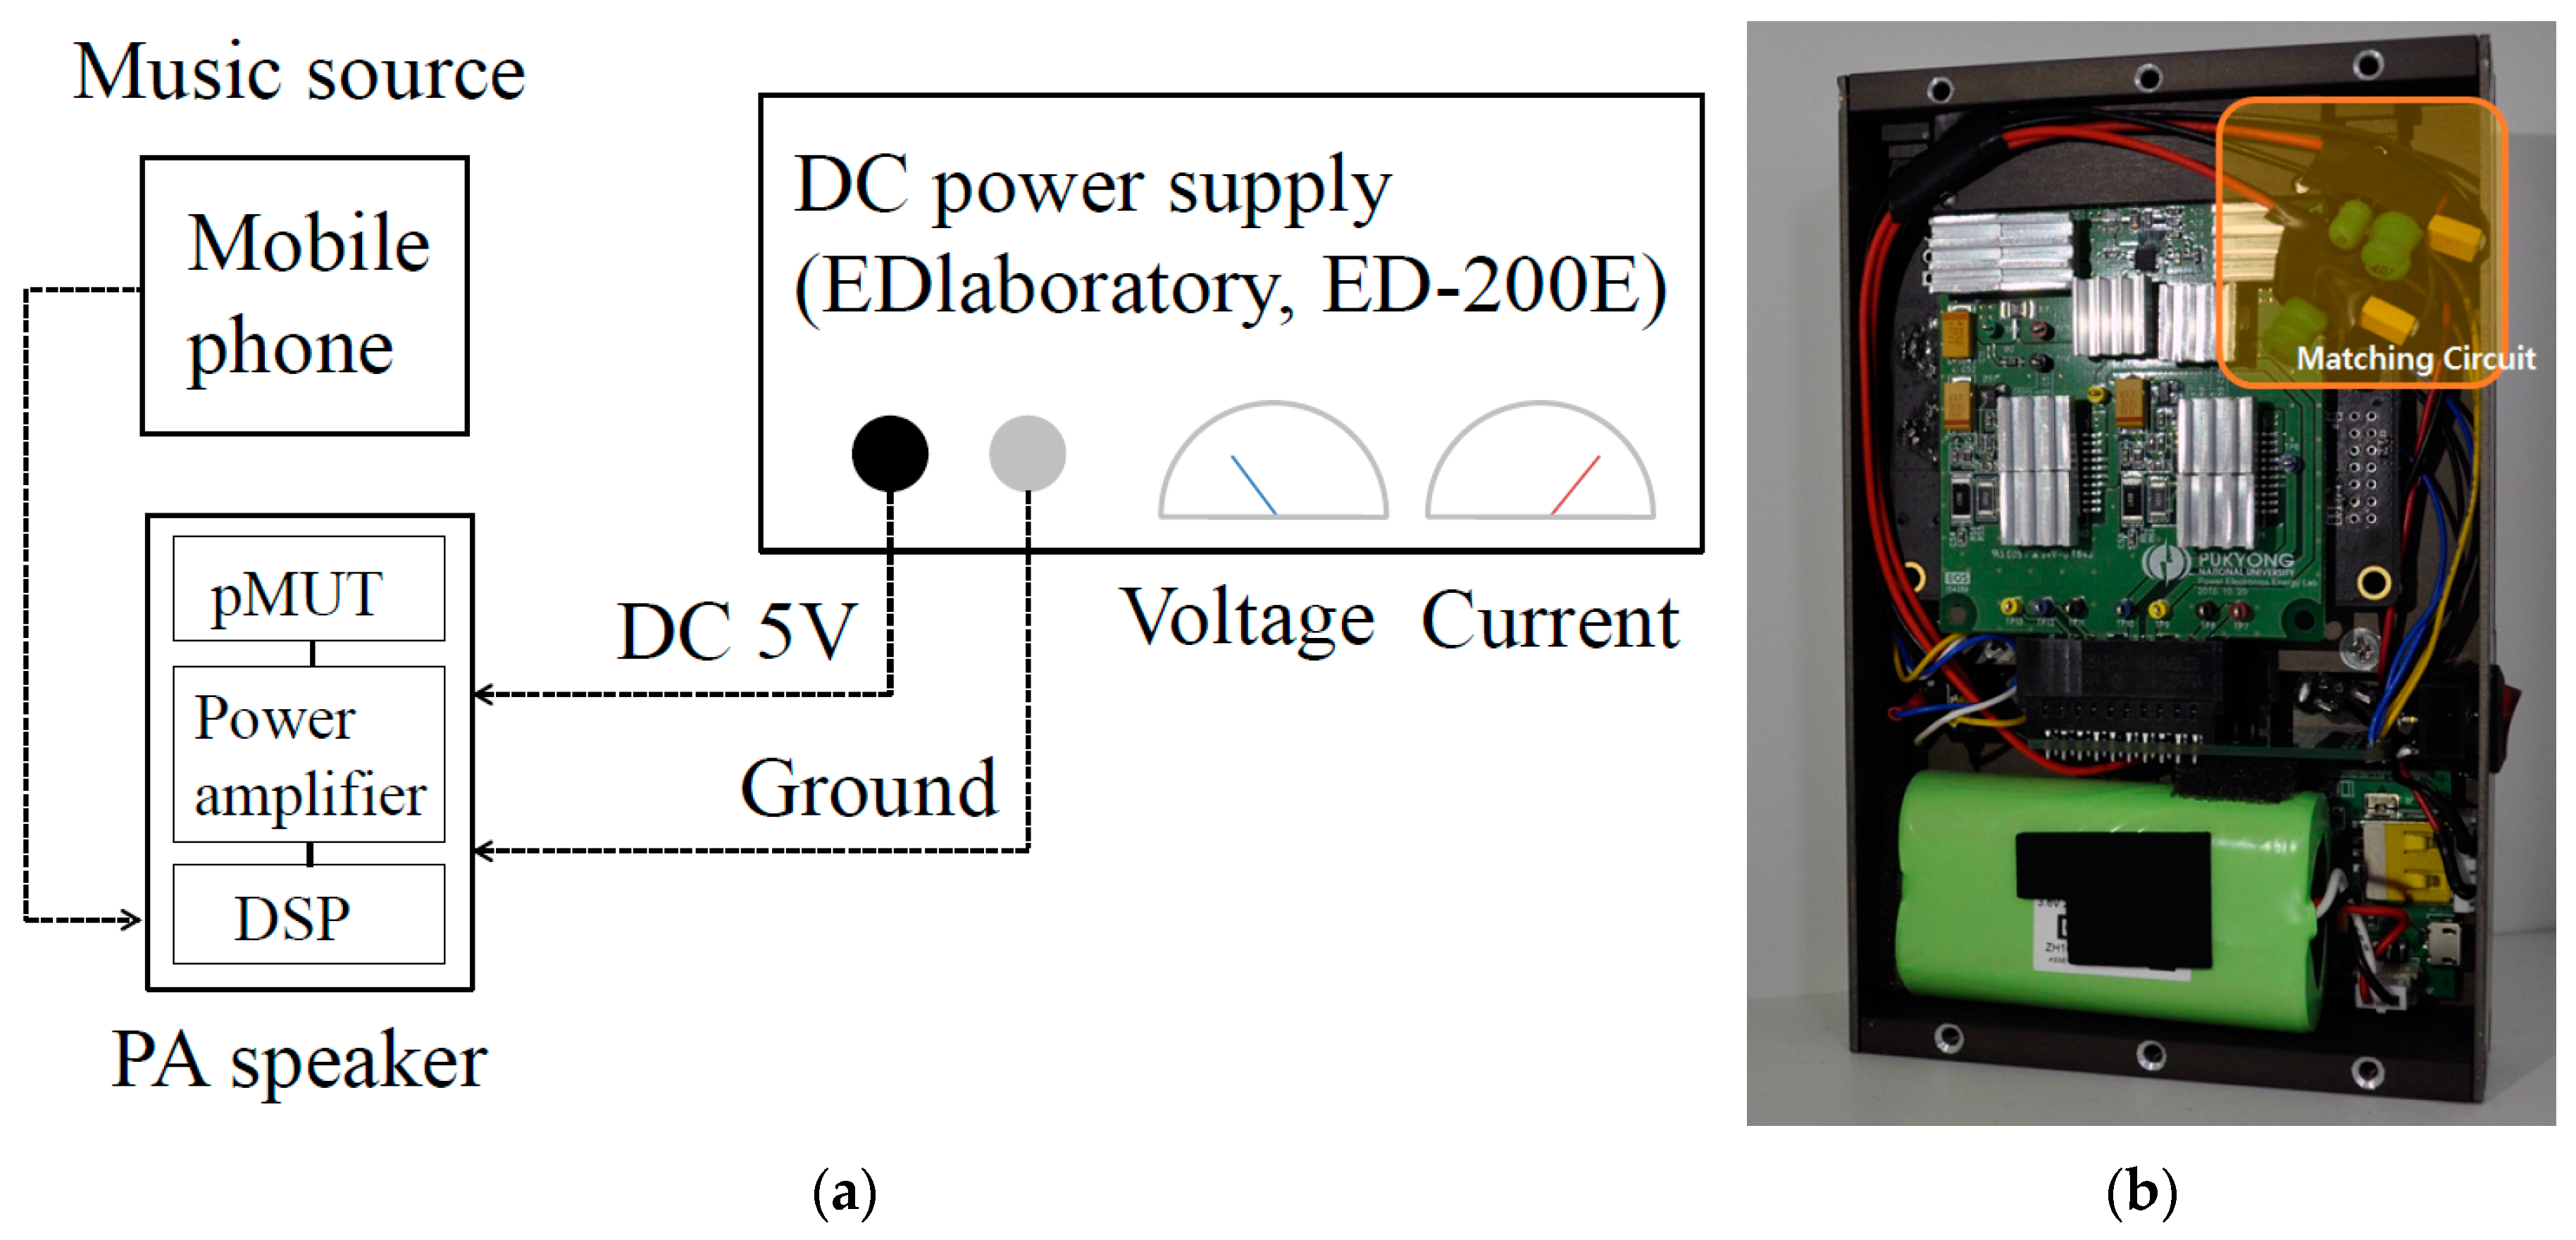
4.2. Acoustic Experimental Setup
4.3. Driving Signal
4.4. Acoustic Characteristics Measurement
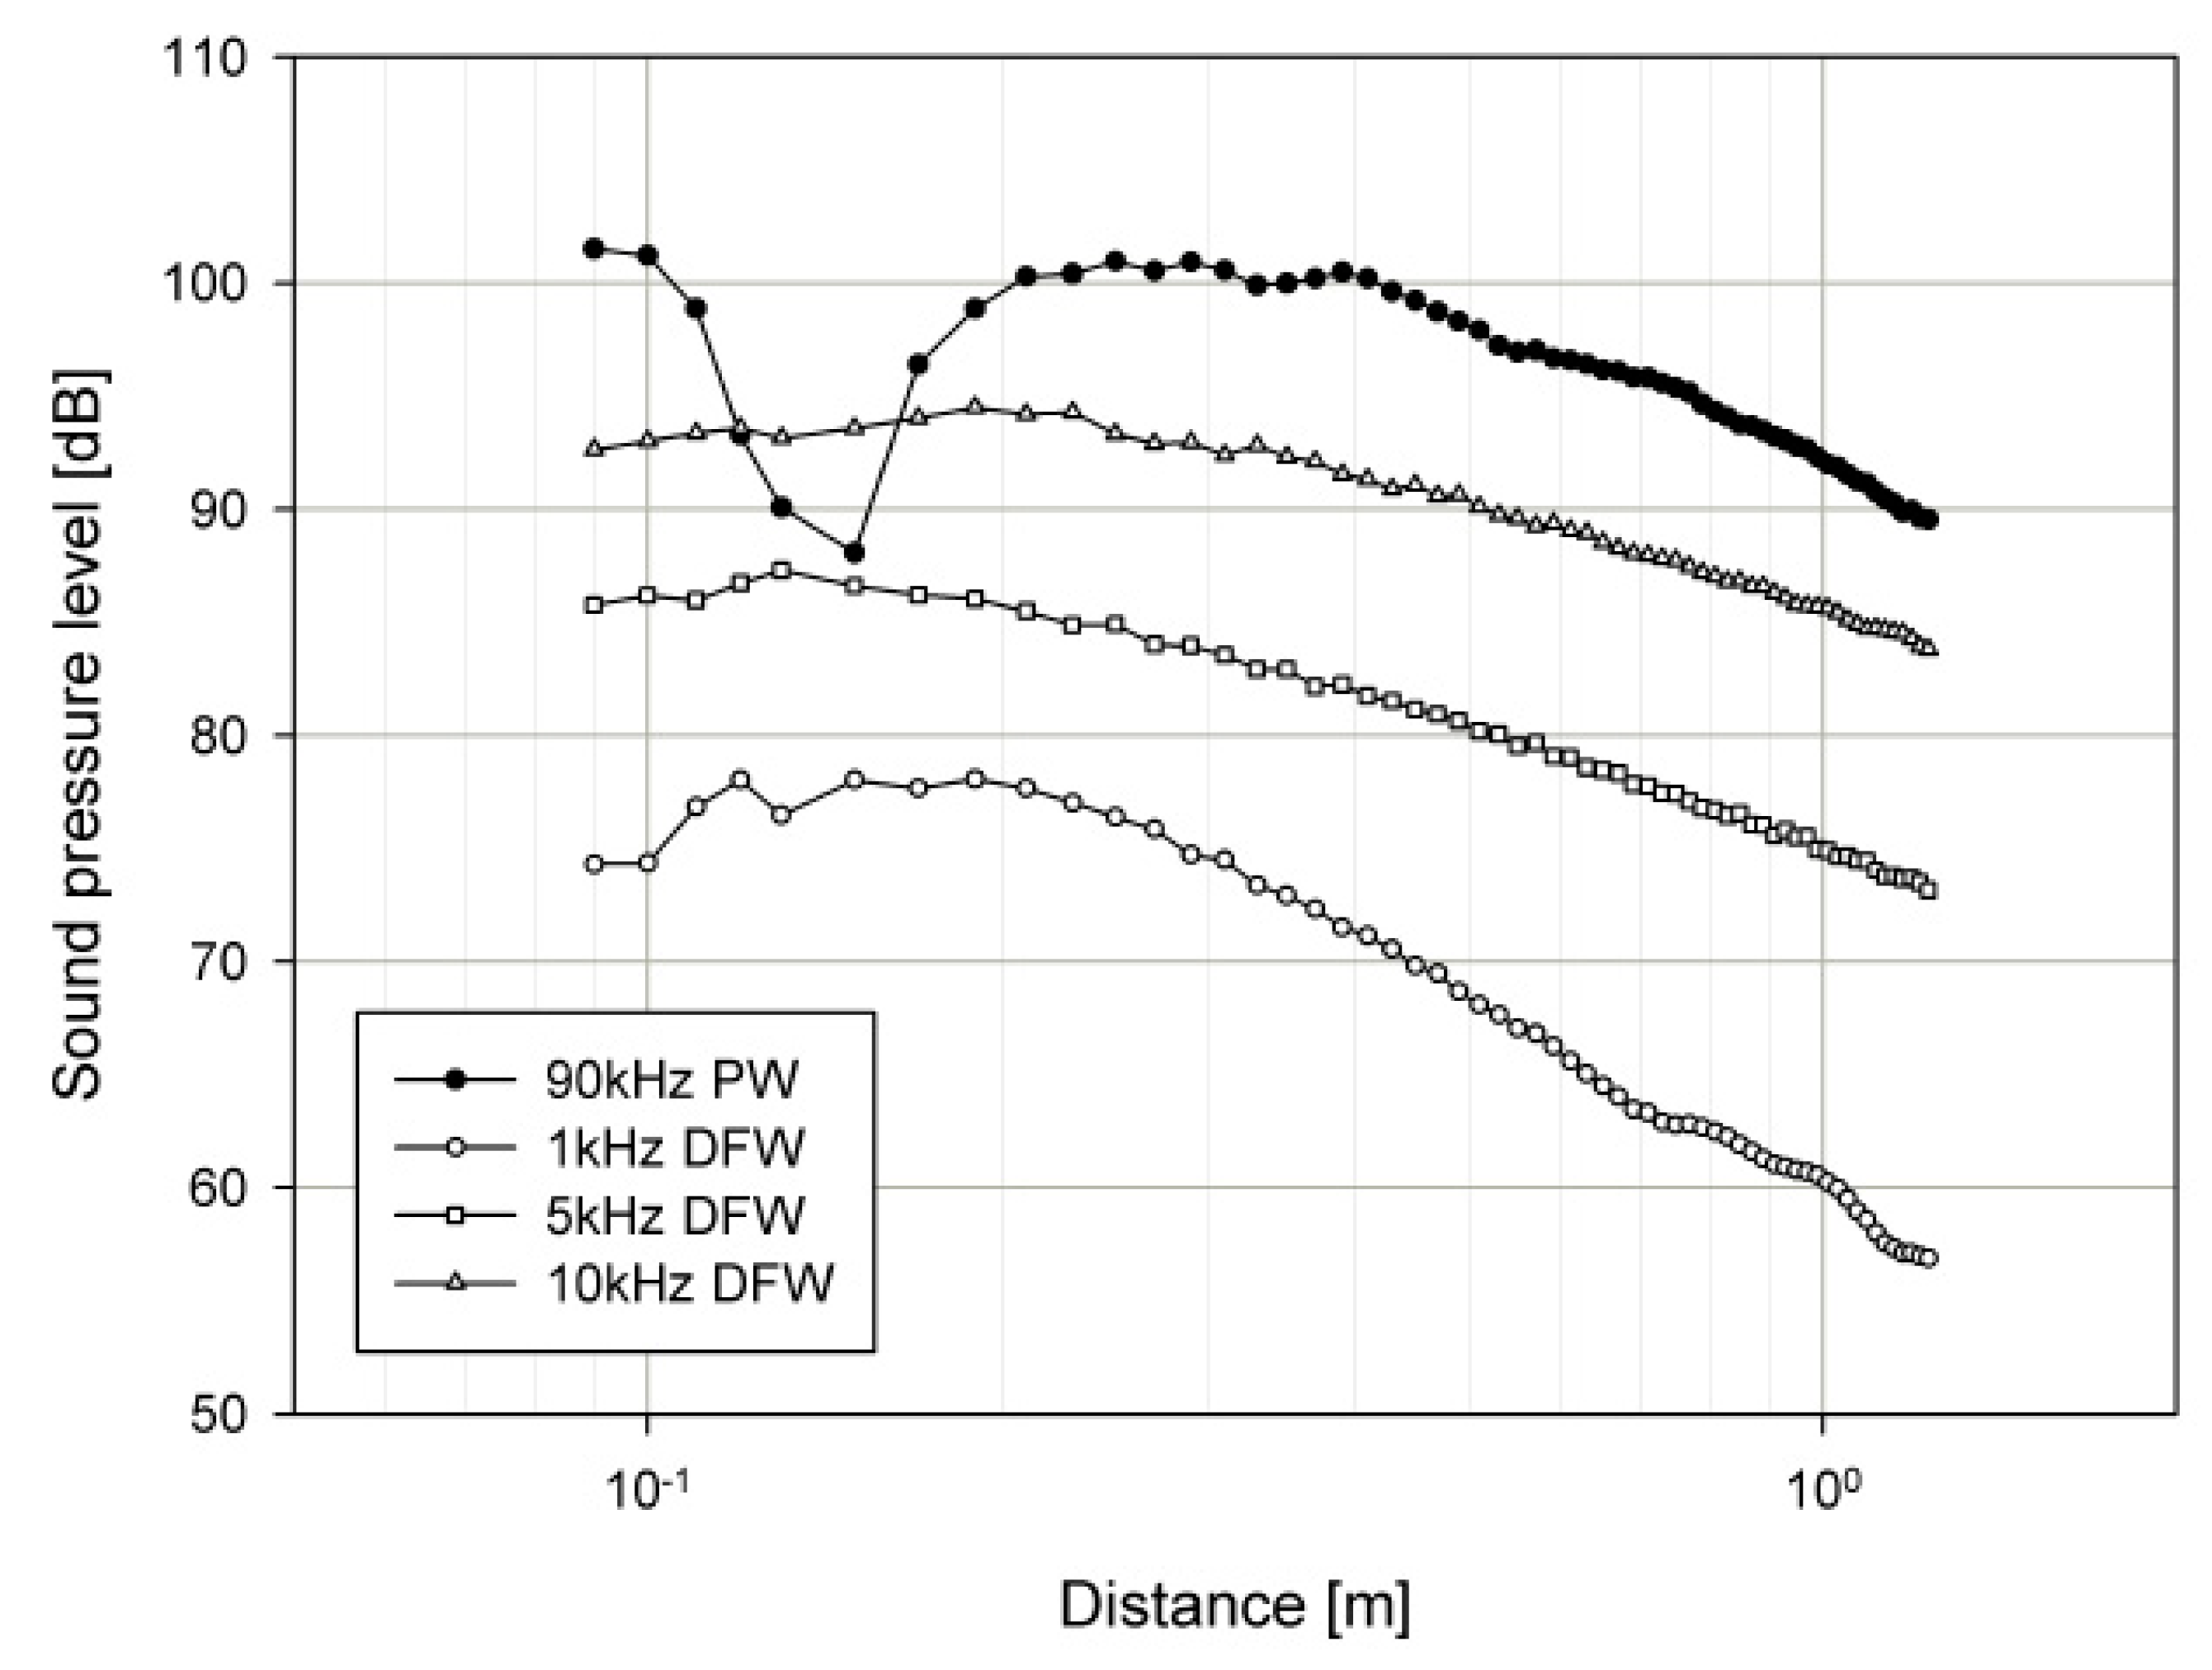
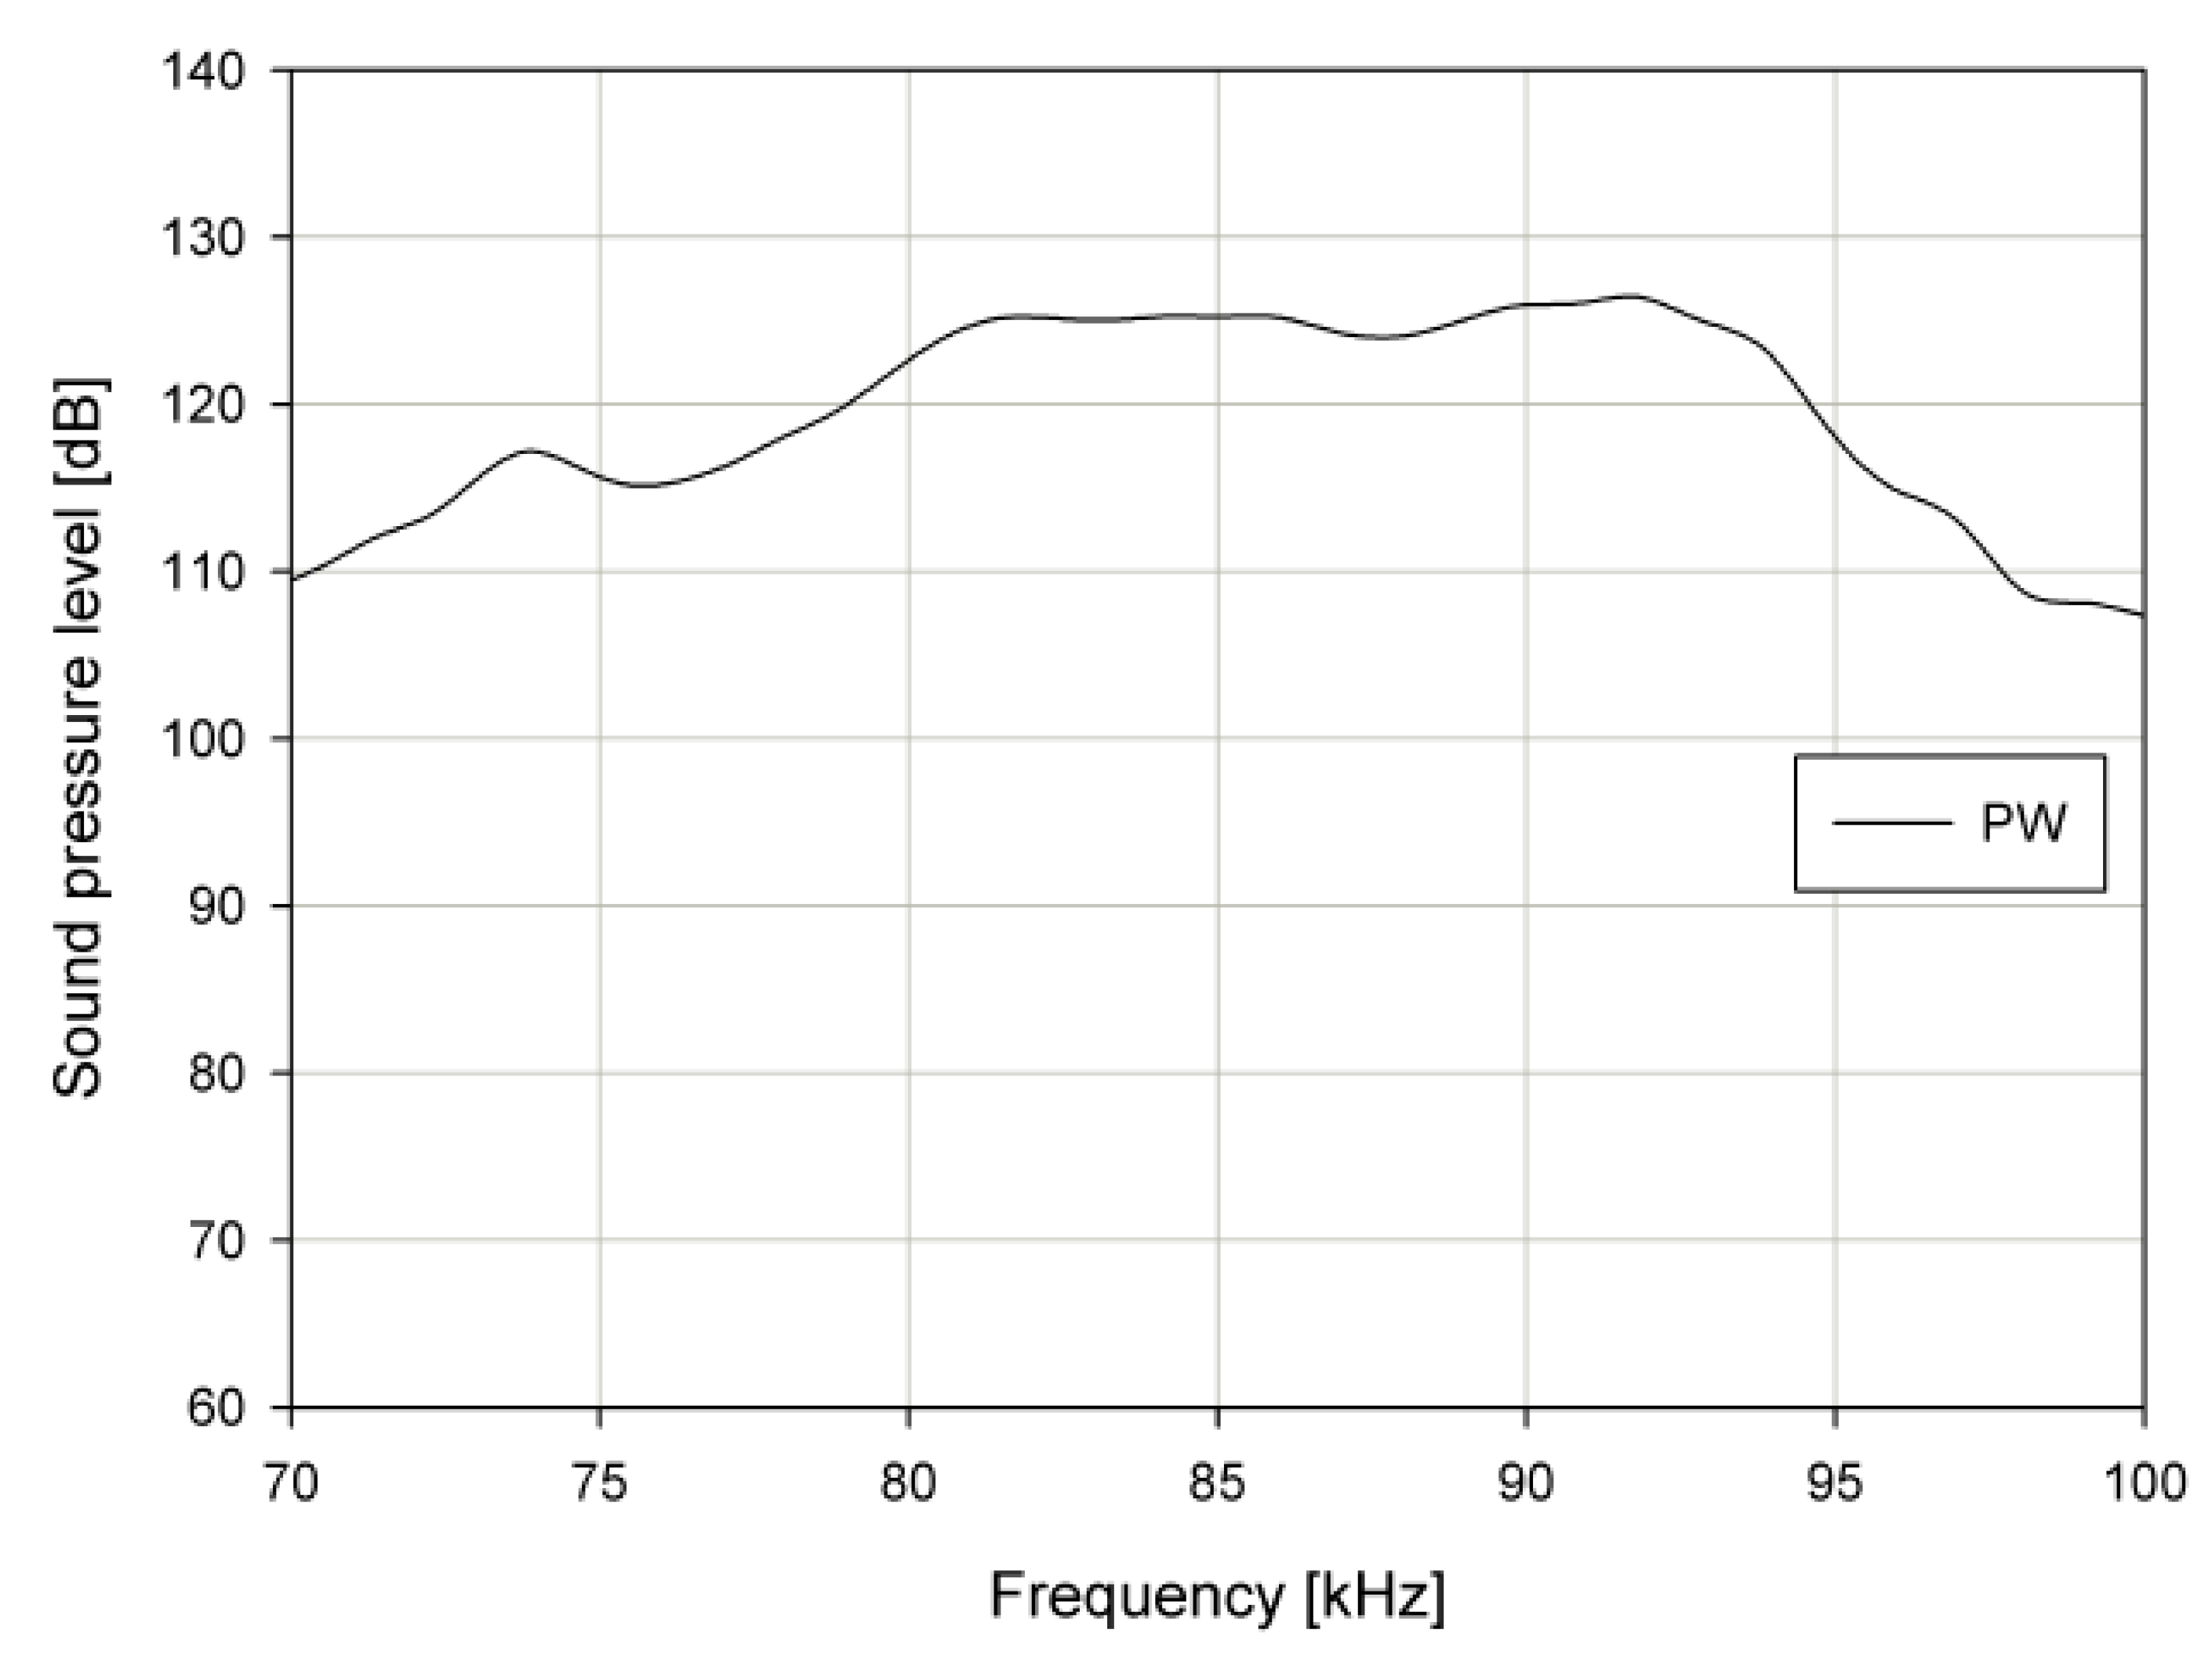
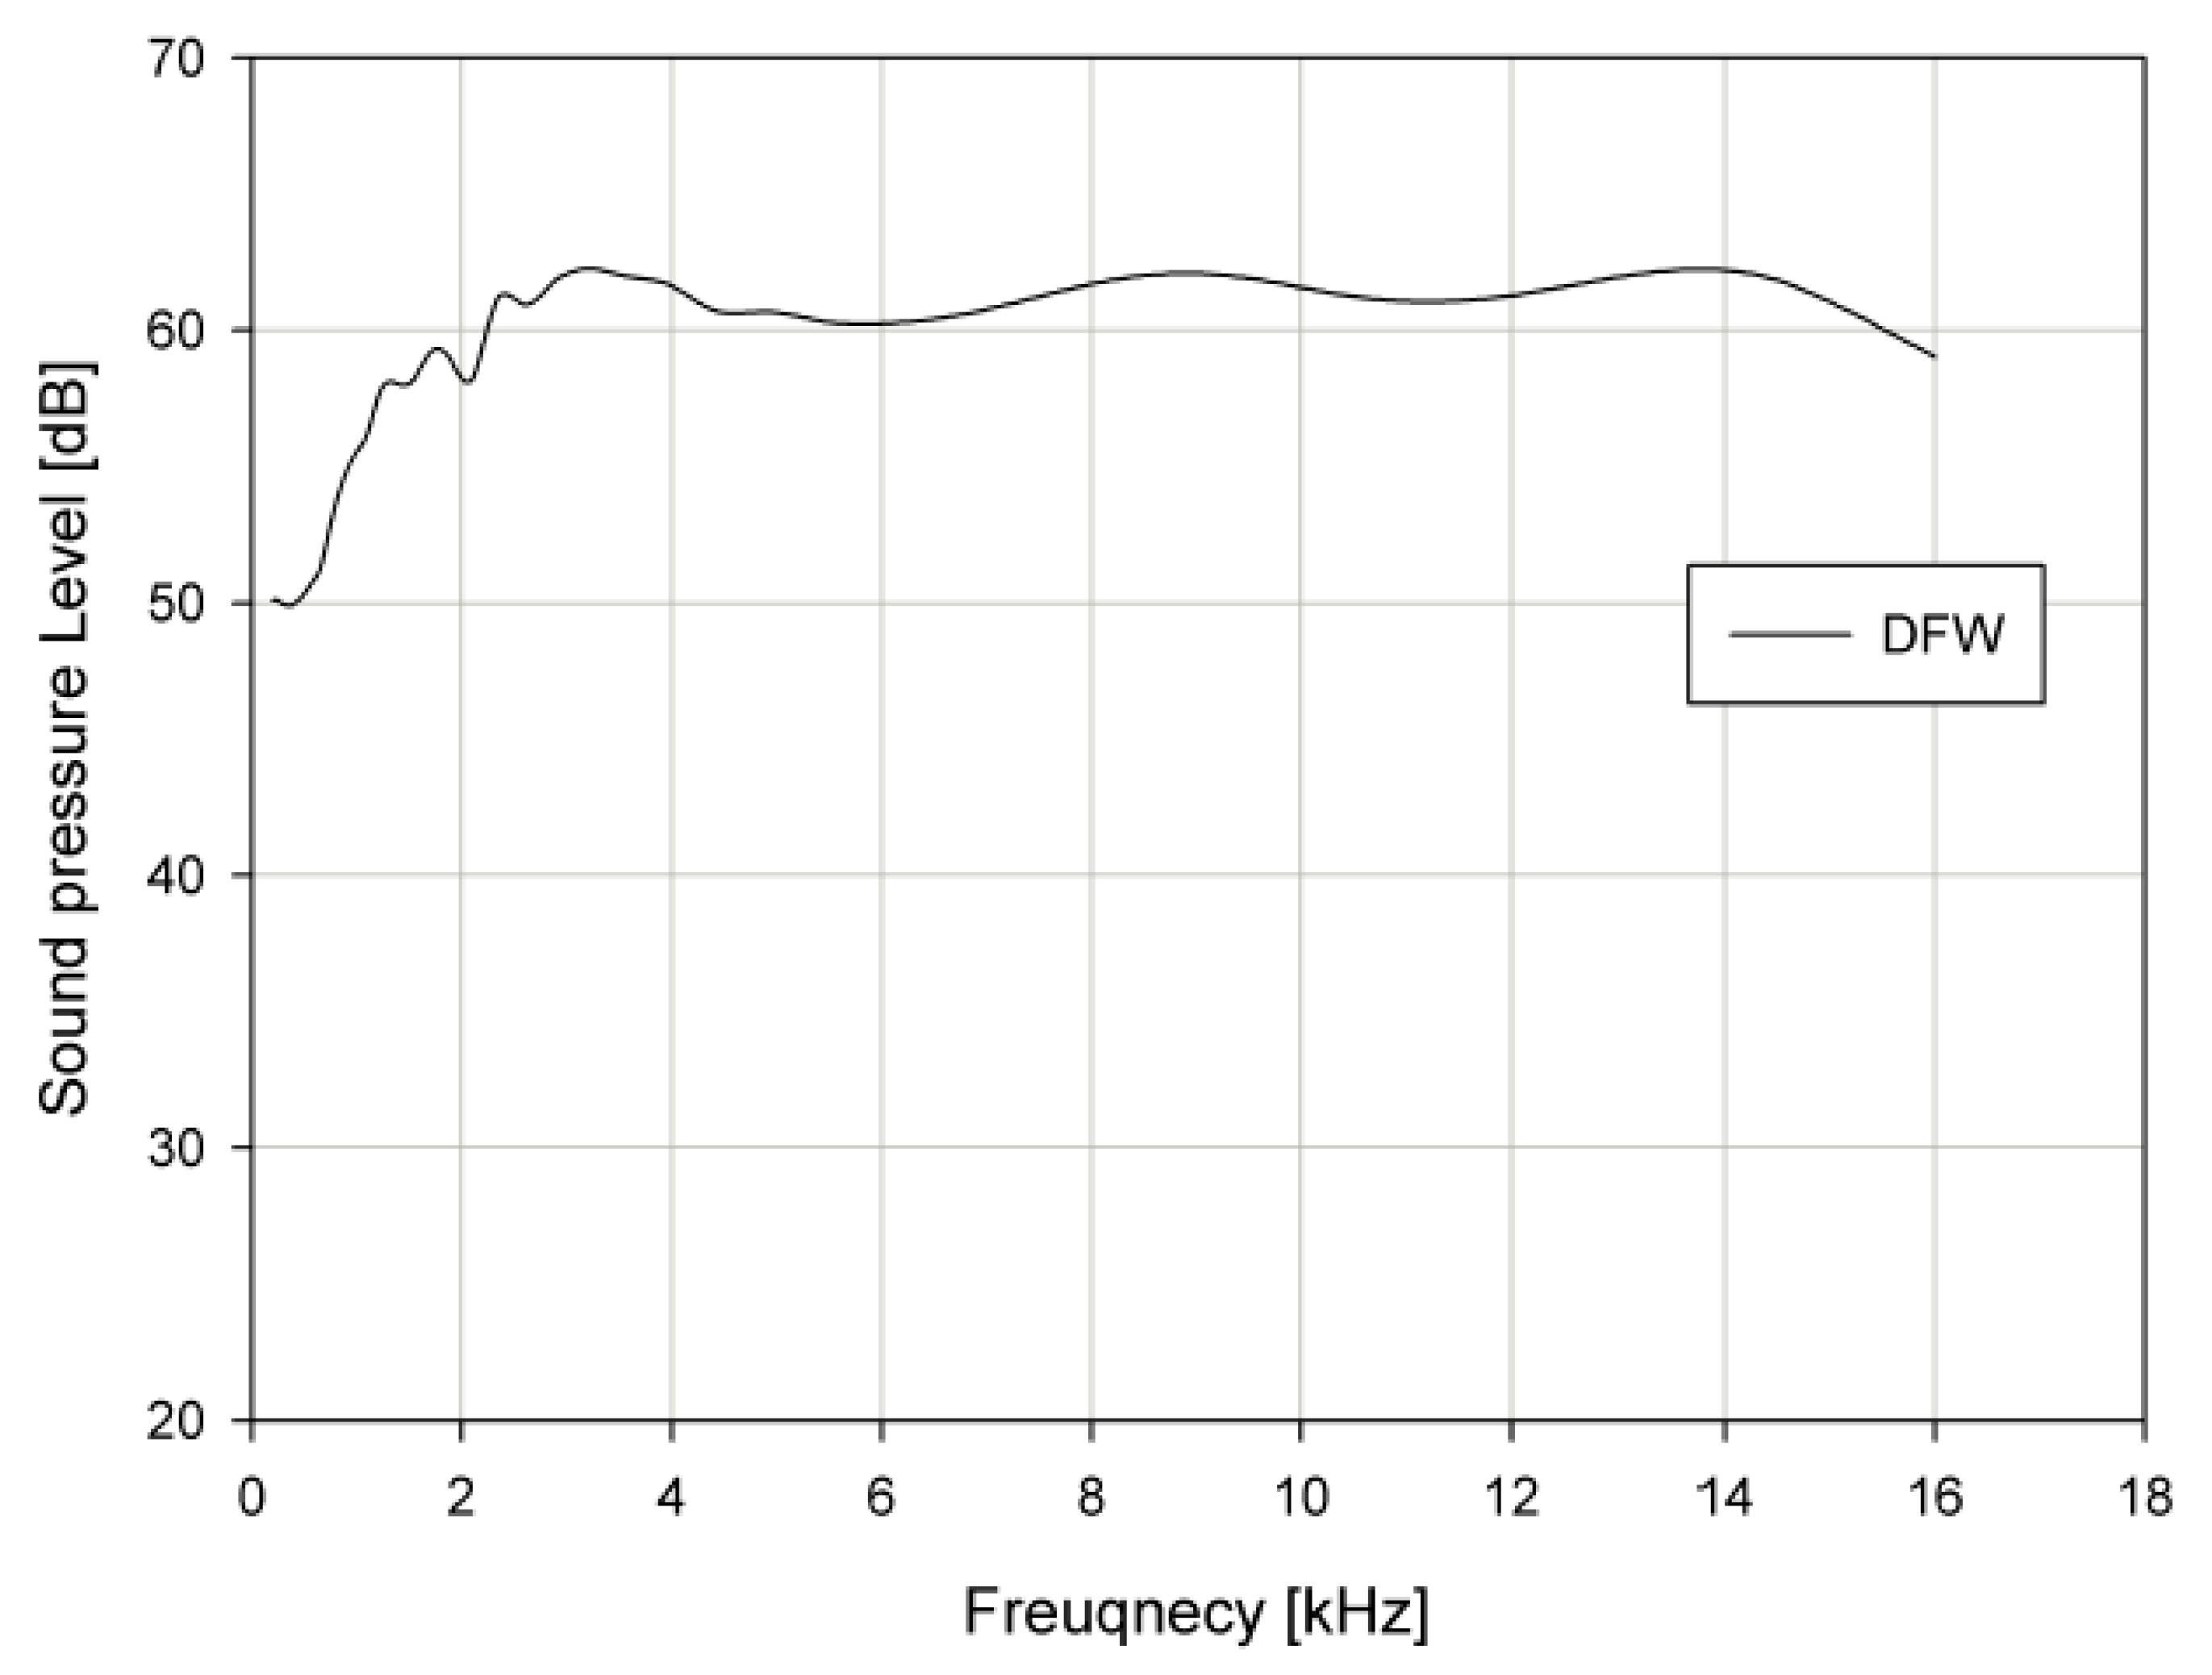
4.4.1. Propagation Curve
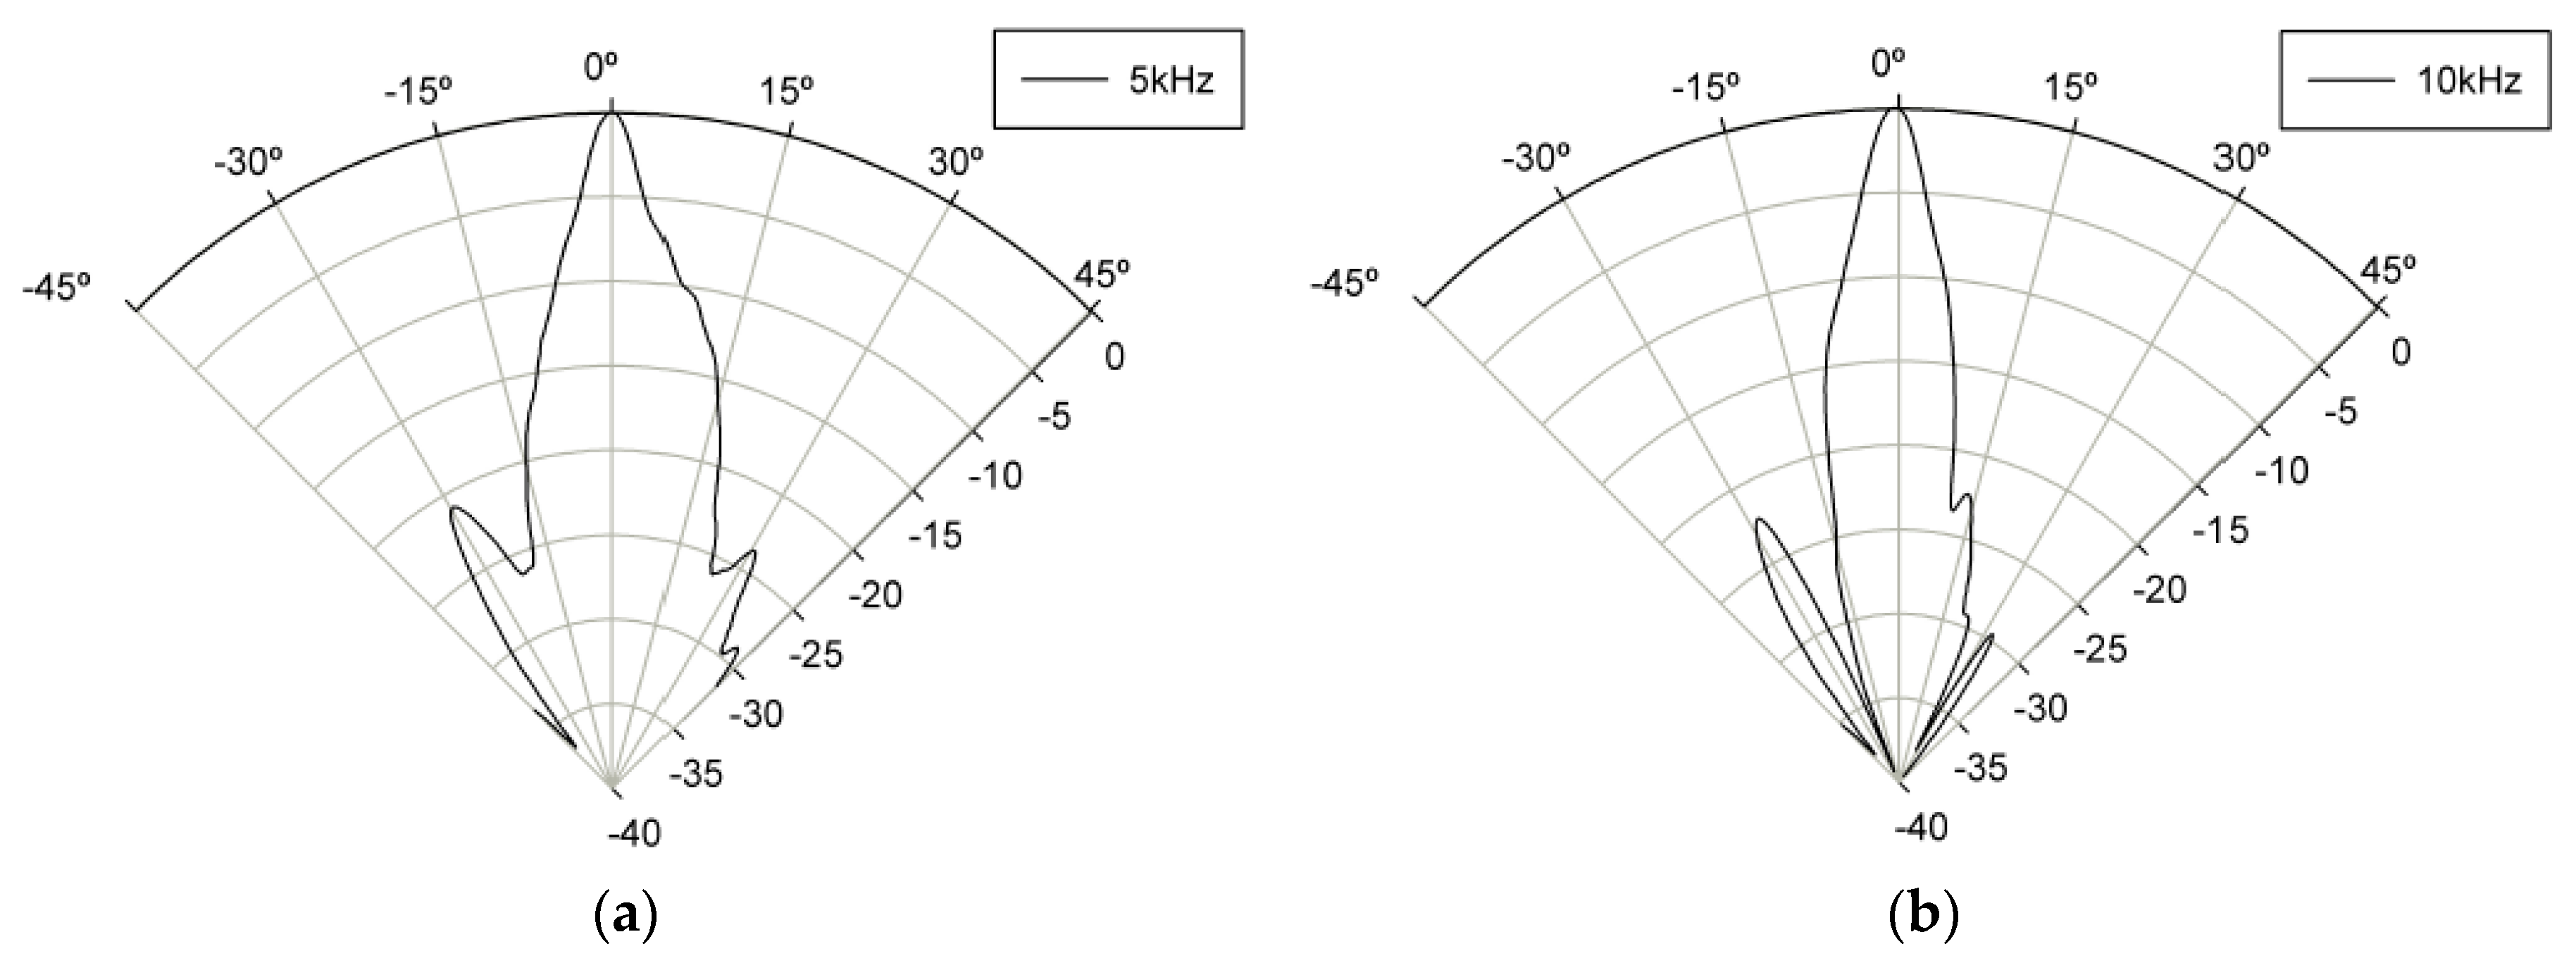
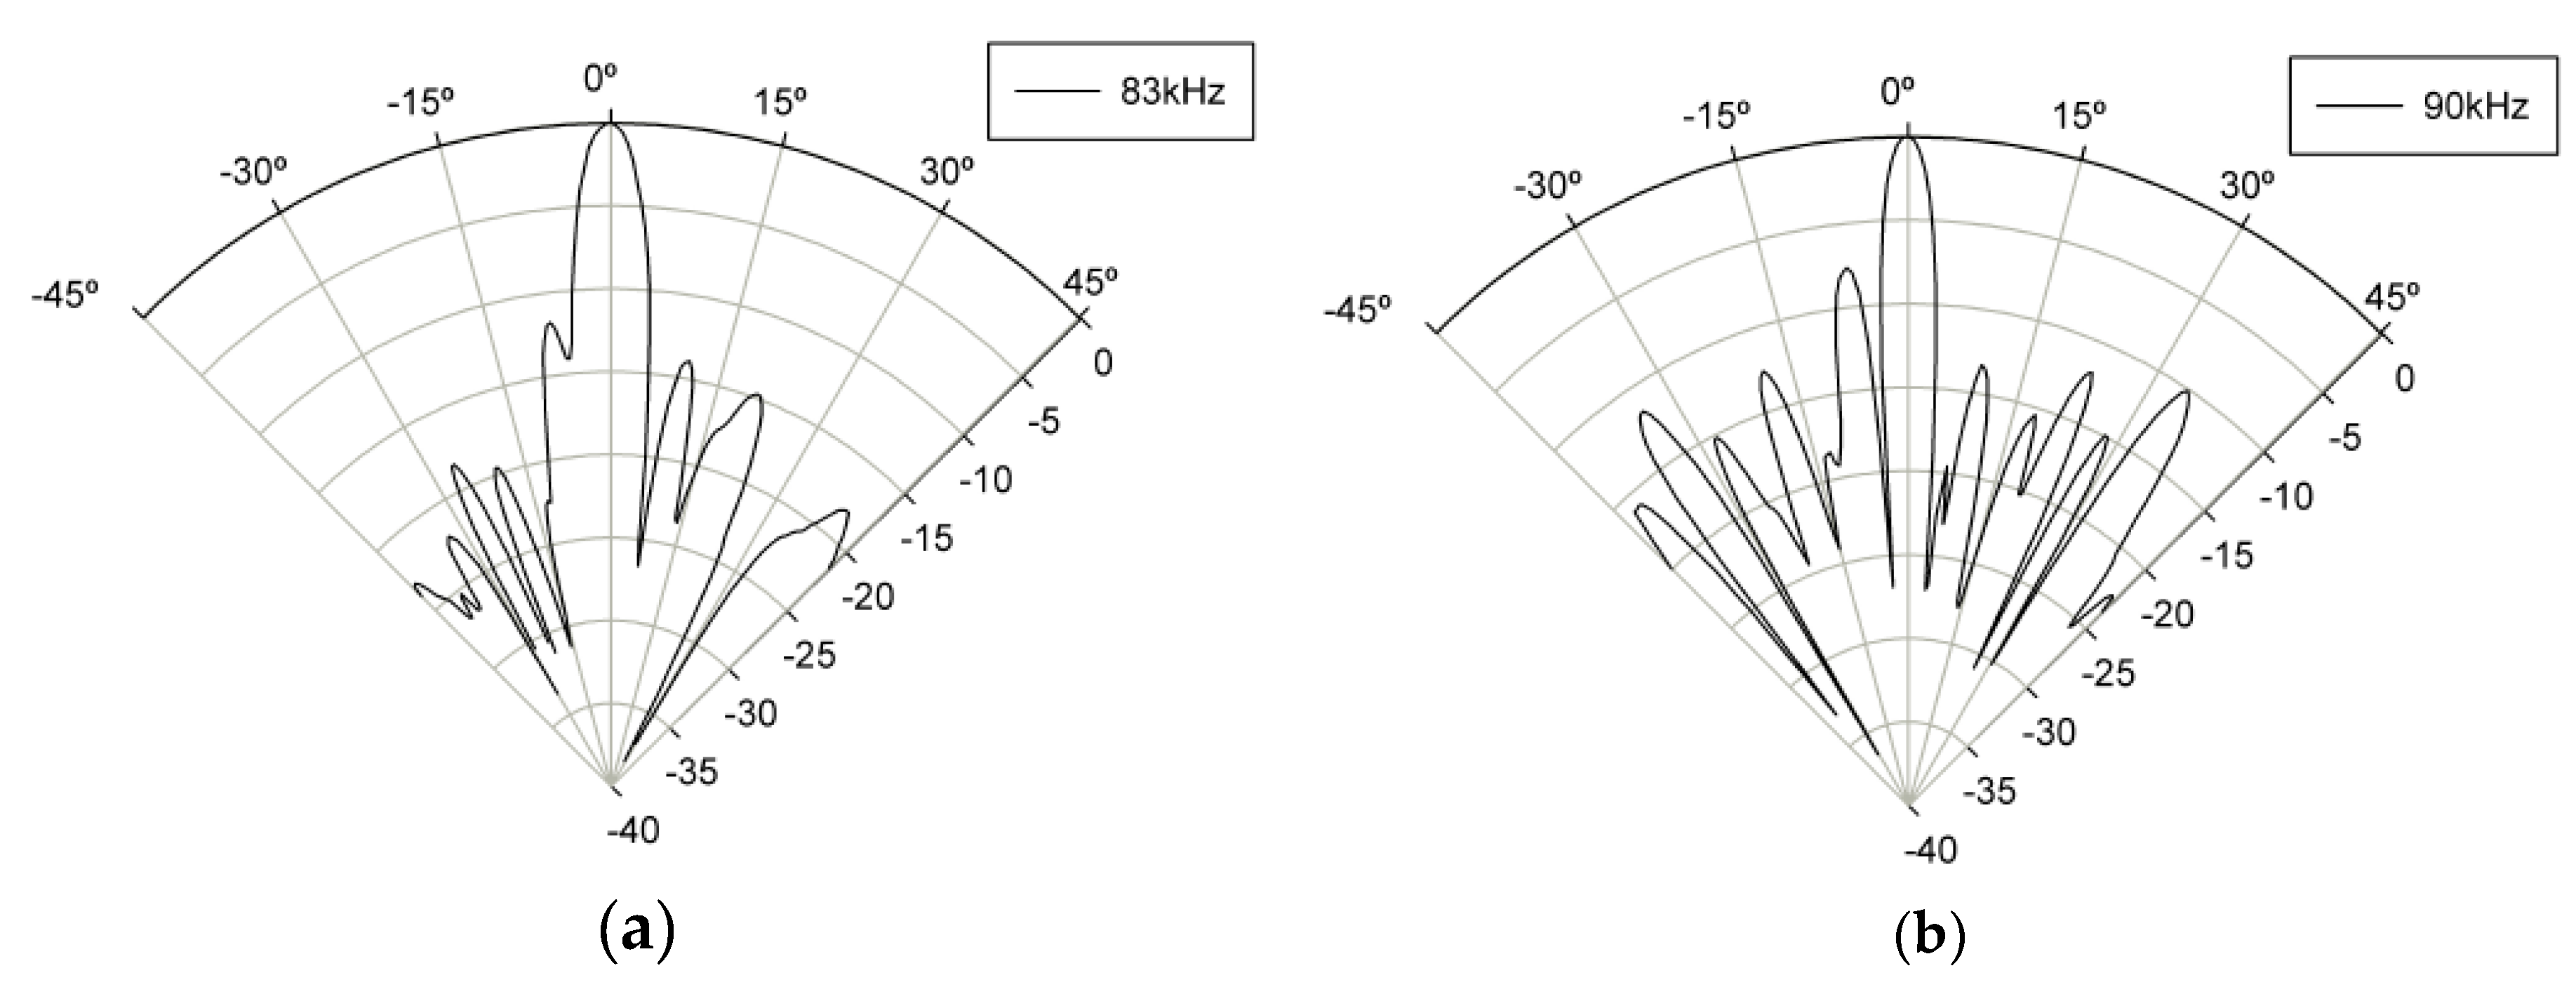
4.4.2. Beam Pattern
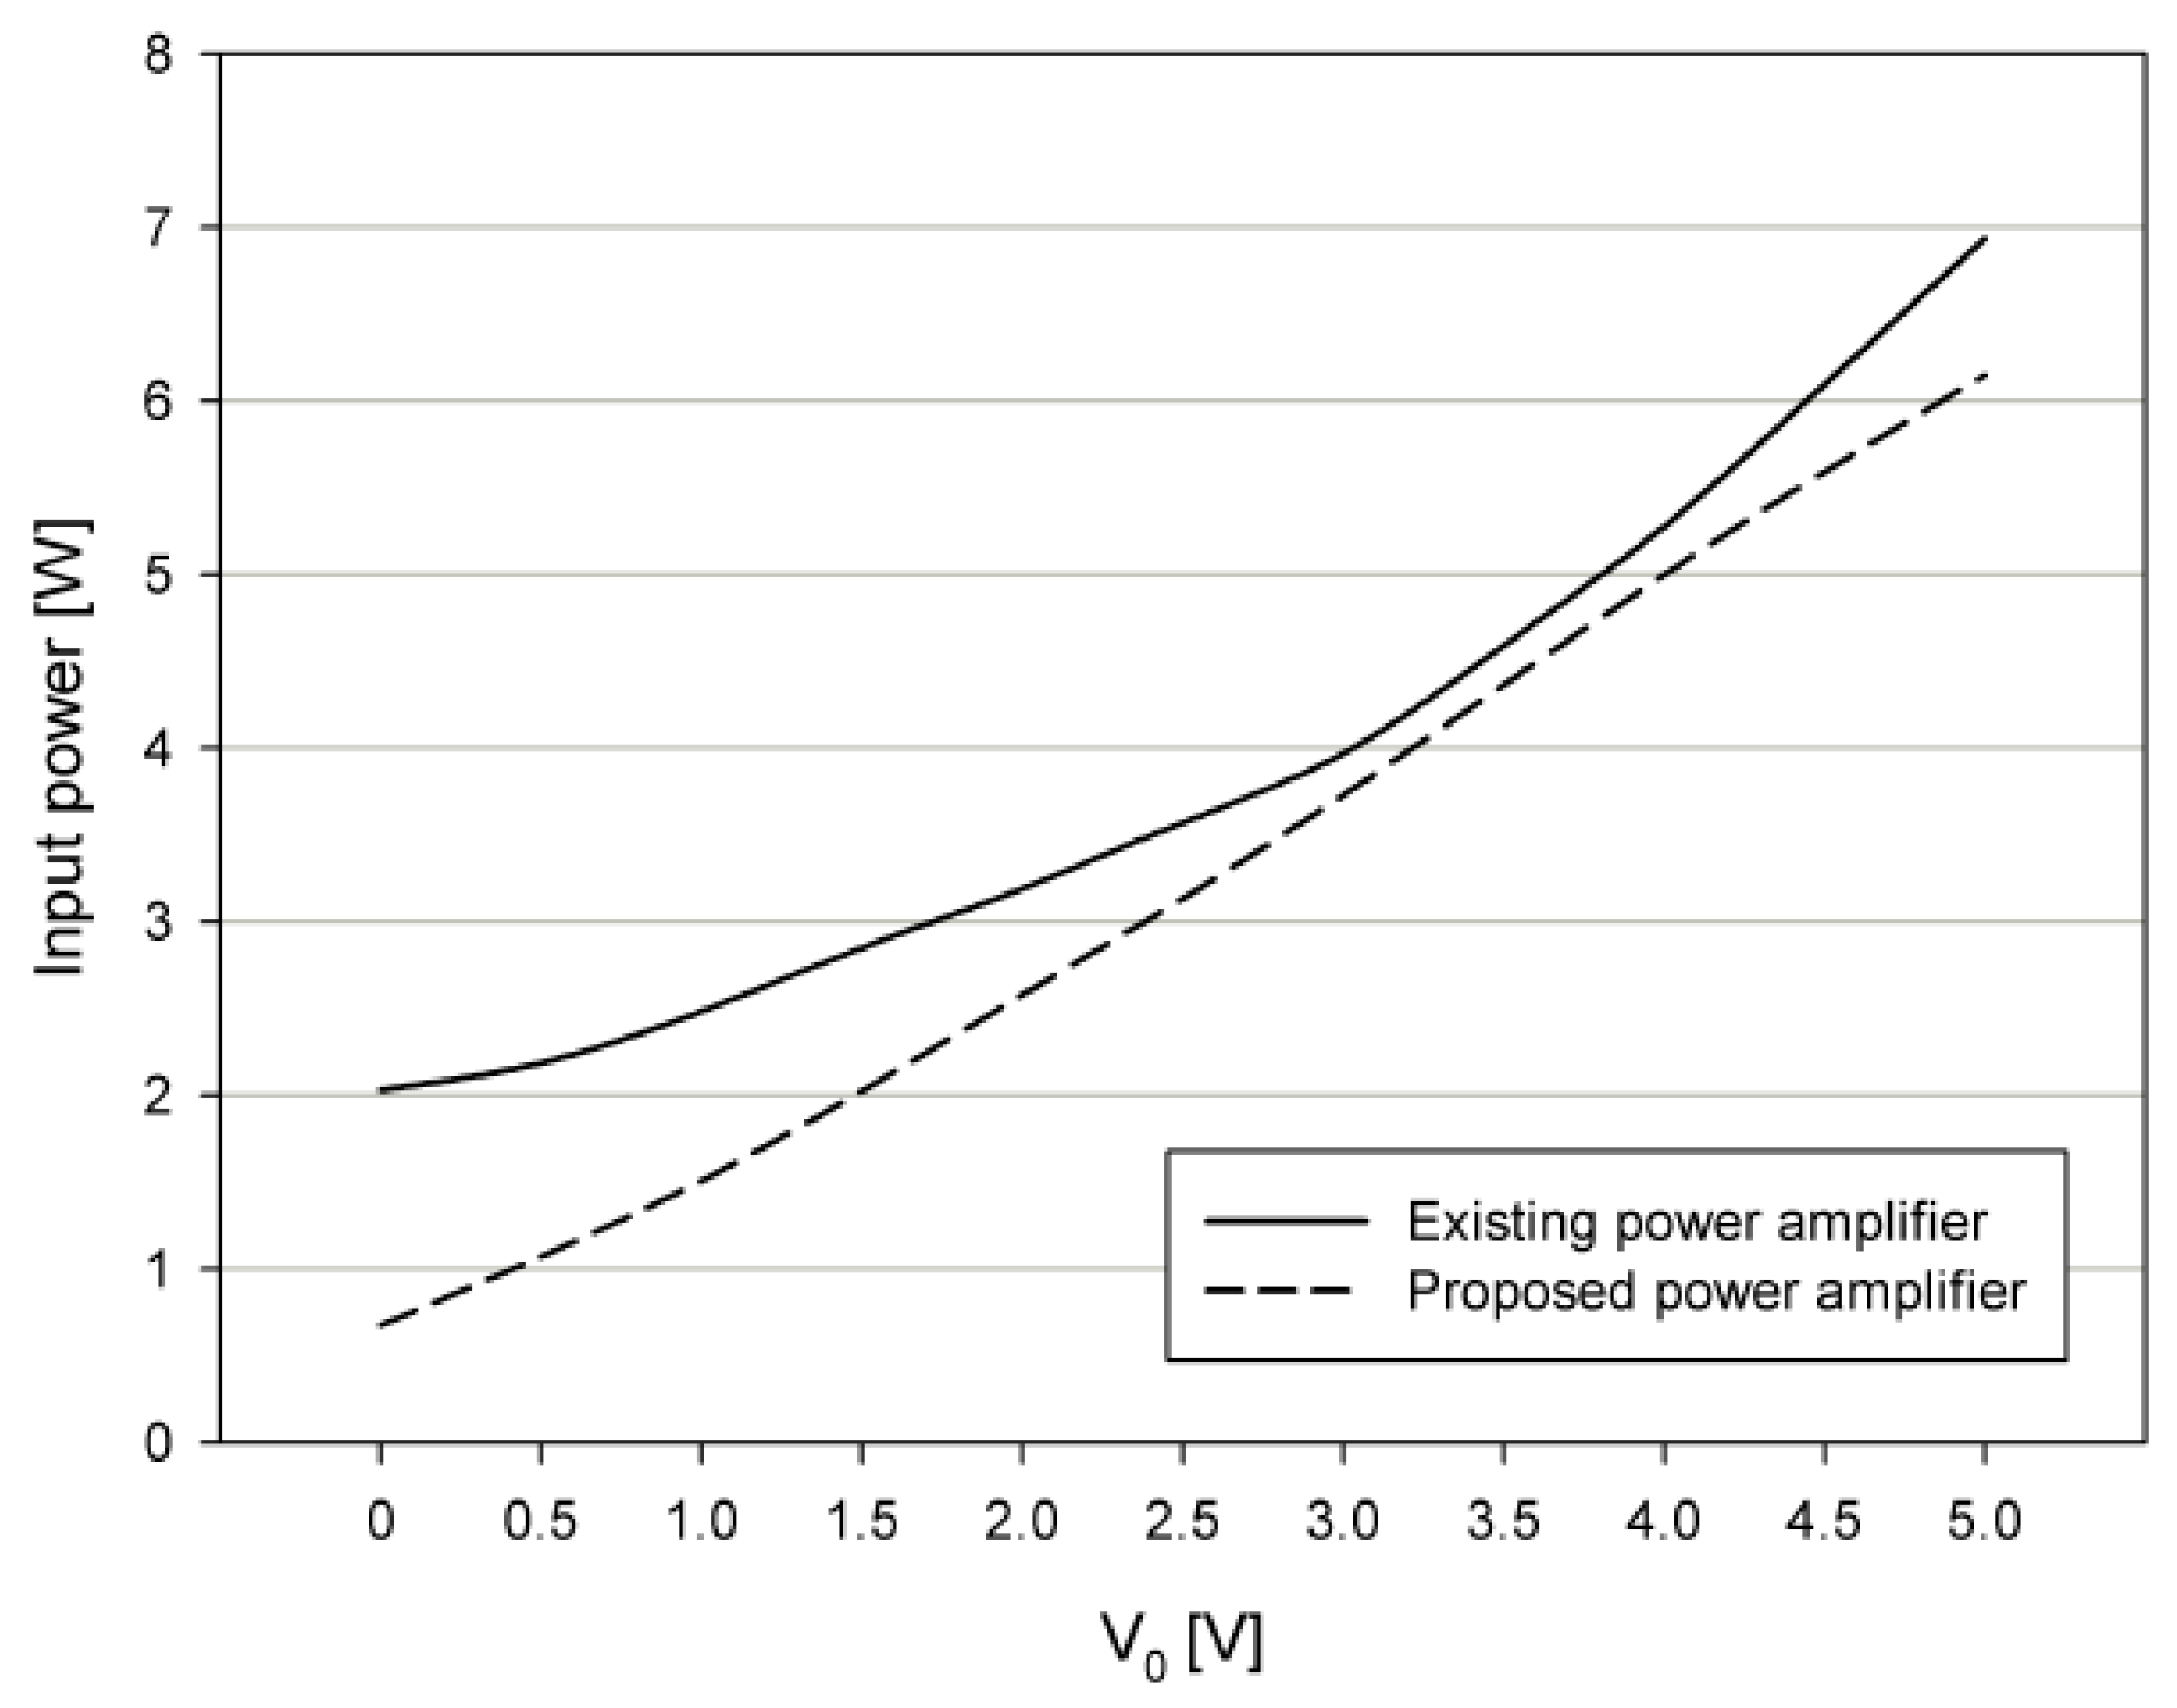
4.5. Power Consumption Measurement
5. Conclusions
Author Contributions
Funding
Conflicts of Interest
References
- Yoneyama, M.; Fujimoto, J.-I.; Kawamo, Y.; Sasabe, S. The audio spotlight: An application of nonlinear interaction of sound waves to a new type of loudspeaker design. J. Acoust. Soc. Am. 1983, 73, 1532–1536. [Google Scholar] [CrossRef]
- Shi, C.; Gan, W.-S. Developemnt of a parametric loudspeaker: A novel directional sound generation technology. IEEE Potentials 2019, 29, 20–24. [Google Scholar] [CrossRef]
- Bennett, M.B.; Blackstock, D.T. Parametric array in air. J. Acoust. Soc. Am. 1975, 57, 562–568. [Google Scholar] [CrossRef]
- Available online: https://www.holosonics.com/products-1/ (accessed on 26 July 2019).
- Kim, J.-Y.; Kim, I.-D.; Moon, W. Design of High-efficiency Power Amplifier System for High-directional Speaker. Trans. Korean Inst. Electr. Eng. 2017, 66, 1215–1221. [Google Scholar]
- Je, Y.; Lee, H.; Been, K.; Moon, W. A micromachined efficient parametric array loudspeaker with a wide radiation frequency band. J. Acoust. Soc. Am. 2015, 137, 1732–1743. [Google Scholar] [CrossRef] [PubMed]
- Hwanga, Y.; Ahn, H.; Nguyen, D.-N.; Kim, W.; Moon, W. An underwater parametric array source transducer composed of PZT/thin-polymer composite. Sens. Actuators A Phys. 2018, 279, 601–616. [Google Scholar] [CrossRef]
- Sennheiser AudioBeam. Available online: http://av.loyola.com/products/audio/sennheiser-speaker-audiobeam.html (accessed on 26 July 2019).
- Available online: http://www.jdsol.co.kr/eng/pro_clarielle.php (accessed on 26 July 2019).
- Je, Y.; Lee, H.; Moon, W. The impact of micromachined ultrasonic radiators on the efficiency of transducers in air. Ultrasonics 2013, 53, 1124–1134. [Google Scholar] [CrossRef] [PubMed]
- Novikov, B.K.; Rudenko, O.V.; Timoshenko, V.I. Nonlinear Underwater Acoustics; The American Institute of Physics: New York, NY, USA, 1987; pp. 1–7, 48–97, 135–197. [Google Scholar]
- Gan, W.-S.; Yang, J.; Kamakura, T. A review of parametric acoustic array in air. Appl. Acoust. 2012, 73, 1211–1219. [Google Scholar] [CrossRef]
- Hamilton, M.F.; Blackstock, D.T. Nonlinear Acoustics; Academic Press: San Diego, CA, USA, 1998; pp. 76–84. [Google Scholar]
- Available online: http://www.transsound.com/En/ProductLists.Asp?SortID=132 (accessed on 26 July 2019).
- Self, D. Audio Power Amplifier Design, 6th ed.; Focal Press: Burlington, MA, USA, 2013; pp. 80–86. [Google Scholar]
- Kinsler, L.E.; Frey, A.R.; Coppens, A.B.; Sanders, J.V. Fundamentals of Acoustics; Wiley: New York, NY, USA, 2000; pp. 107–109, 171–209, 286–288, 390–422. [Google Scholar]
- Borwick, J. Loudspeaker and Headphone Handbook, 3rd ed.; Focal Press: Woburn, MA, USA, 2001; pp. 471–473. [Google Scholar]
- Bae, J.; Madsen, C.K. Synthesis of Optical IIR Allpass Filters Using Layer Peeling Algorithm Based on Eigenvalue Problem. IEEE Photonics Technol. Lett. 2013, 25, 626–628. [Google Scholar] [CrossRef]
- Seok, S.; Lee, B.; Kim, J.; Kim, H.; Chun, K. A new compensation method for the footing effect in MEMS fabrication. J. Micromech. Microeng. 2005, 15, 1791–1796. [Google Scholar] [CrossRef]


| Resonance Frequency | Radius, a | Thickness, t | |
|---|---|---|---|
| f1-pMUT unit | 100 kHz | 725 μm | 15 μm |
| f2-pMUT unit | 110 kHz | 687 μm |
| Parameters | Thickness, t |
|---|---|
| Input power rating | 10 (W) |
| Input voltage | 5–12 (V) |
| Input signal frequency f1, f2 | 83, 90 (kHz) |
| Boost output voltage Vcc | 14 (V) |
| Reference voltage of amplifier | 7 (V) |
| Boost output voltage VEE | 0 (V) |
| Maximum peak output voltage range of the amplifier | +2 to +12 (V) |
| Linear Amplifier (class A, AB, B) | Non-linear Amplifier (class C, D, E, etc.) |
|---|---|
| High output linearity | Low output linearity |
| Low power efficiency (~78.5%) | High power efficiency (~95%) |
| pMUT (at fc) | DSP Board | Power Amplifier | PALS | |
|---|---|---|---|---|
| w/o matching circuit | 1.29 W | 0.5 W | 6.15 W | 6.65 W |
| w/ matching circuit | 2.75 W | 3.25 W |
© 2019 by the authors. Licensee MDPI, Basel, Switzerland. This article is an open access article distributed under the terms and conditions of the Creative Commons Attribution (CC BY) license (http://creativecommons.org/licenses/by/4.0/).
Share and Cite
Ahn, H.; Been, K.; Kim, I.-D.; Lee, C.H.; Moon, W. A Critical Step to Using a Parametric Array Loudspeaker in Mobile Devices. Sensors 2019, 19, 4449. https://doi.org/10.3390/s19204449
Ahn H, Been K, Kim I-D, Lee CH, Moon W. A Critical Step to Using a Parametric Array Loudspeaker in Mobile Devices. Sensors. 2019; 19(20):4449. https://doi.org/10.3390/s19204449
Chicago/Turabian StyleAhn, Hongmin, Kyounghun Been, In-Dong Kim, Chong Hyun Lee, and Wonkyu Moon. 2019. "A Critical Step to Using a Parametric Array Loudspeaker in Mobile Devices" Sensors 19, no. 20: 4449. https://doi.org/10.3390/s19204449
APA StyleAhn, H., Been, K., Kim, I.-D., Lee, C. H., & Moon, W. (2019). A Critical Step to Using a Parametric Array Loudspeaker in Mobile Devices. Sensors, 19(20), 4449. https://doi.org/10.3390/s19204449