1. Introduction
Groundwater is stored in porous sediments in the subsurface (aquifers). Large volumes of water are moving in aquifers with velocities in the order of a few μm s−1 to hundreds of μm s−1. Due to large residence time in aquifers, groundwater is filtered from pollutants and presents a naturally cleaned source of drinking water or irrigation water. Groundwater supply is brought to the surface through wells. Understanding and long-term monitoring of aquifers and wells, especially groundwater flow, is crucial for sustainable management of groundwater resources and prevention of groundwater-related problems, e.g., overpumping, clogging, and groundwater pollution. Having accurate long-term flow information near wells helps to identify wells where clogging will most likely occur and to choose suitable locations for new wells.
Groundwater flow velocity and direction can be either obtained directly by various types of flowmeters installed inside the observation wells, or indirectly from geological modeling tools or geoelectrical imaging [
1,
2]. Common input to the models are field data from tracer tests, borehole logs, hydraulic head measurements and pumping tests. Interpreting data from groundwater flowmeters is not straightforward because the well itself causes a disturbance to the flow. The construction of a well may create preferential flows around it and the shape of the well screen influences vertical flow in the well itself [
3]. Groundwater flow models are a useful tool to understand the overall flow distribution, but they are still based on simplified assumptions and data from a limited number of monitoring wells. For heterogeneous subsurface environments, groundwater models cannot accurately predict local flow distribution. The models can be improved by more accurate input data with higher spatial resolution.
The most recent technology that can provide higher resolution groundwater flow data is optical fiber sensors. Fiber sensors are small in size, can be installed in direct contact with the soil to minimize the disturbance to groundwater flow. Current state-of-the art technology for monitoring groundwater flow is Distributed Temperature Sensing (DTS) [
4]. DTS is based on inelastic scattering in an optical fiber which is sensitive to temperature. The entire length of the fiber is a sensing element providing data with medium spatial and high temperature resolution (currently 12.5 cm and 0.01 °C). Heat is introduced into the subsurface as a tracer for the flow [
5] either via hot water injection [
6,
7] or directly heating up the subsurface [
8,
9]. The accuracy of heat tracing methods needs to be discussed because warming up the subsurface changes properties of water and potentially modifies the flow patterns [
10]. Recent setups combine the heating element directly with the DTS fiber-optic cable referred to as Active Heating-DTS [
11,
12].
In our previous study [
13], we described the possibilities for groundwater flow sensing using another type of optical fiber sensors, Fiber Bragg Grating (FBG) sensors. An FBG sensor is a periodic modulation of refractive index in a fiber core. This grating reflects light with wavelength
(Bragg wavelength) matching the period of the grating
(Bragg condition):
where
is effective refractive index for the propagating light. Gratings are typically shorter than 1 mm, meaning that FBG sensors are localized measurement points in an optical fiber. A shift in the Bragg wavelength
is a result of a modification of refractive index or grating period, either by temperature change ΔT or strain Δ
ϵ in the optical fiber:
where
is a strain–optic coefficient,
is a thermal expansion coefficient, and
is a thermo-optic coefficient. FBG sensors are sensitive to multiple physical processes at the same time (temperature, pressure, and deformation forces). FBG sensors installed in the direct contact with soil can measure soil deformation caused by groundwater extraction from an aquifer [
14,
15,
16]. Various types of FBG extensometers have been tested to monitor natural land subsidence [
17] or subsidence caused by mining [
18]. In these studies, however, drilled boreholes with extensometers were not refilled with the original soil.
Volumetric changes in soil caused by vertical loading are known under term consolidation [
19,
20]. Groundwater extraction decreases pore pressure in saturated soil, which can be measured by piezometers in monitoring wells. Lowering pore pressure results in an increase in vertical stress in an aquifer and subsequent reduction of pore volume and compaction of the soil. Consolidation is therefore coupled to groundwater flow via pore pressure changes. The first coupled theory was developed by Biot [
21]. In current hydrological applications, groundwater flow is modeled separately and pore pressure distribution is then used as the external driving force for the consolidation [
14,
19]. High resolution consolidation data collected from an examined site could also provide an input for the flow models.
Our previous research [
13] showed that FBG sensors with a standard polyvinyl chloride (PVC) and teflon packaging already respond to pressure and flow changes in an aquifer simulator with natural flow. Pressure changes could be related to consolidation, while the mechanism of possible flow coupling is less clear. In this field study, FBG sensors with teflon packaging were deployed in a drinking water well field to investigate new methods of measuring groundwater flow. The packaging was intentionally not adapted to measure only consolidation strain. Response of FBG sensors is discussed for two different groundwater flow cases with multiple wells involved in the extraction.
2. Materials and Methods
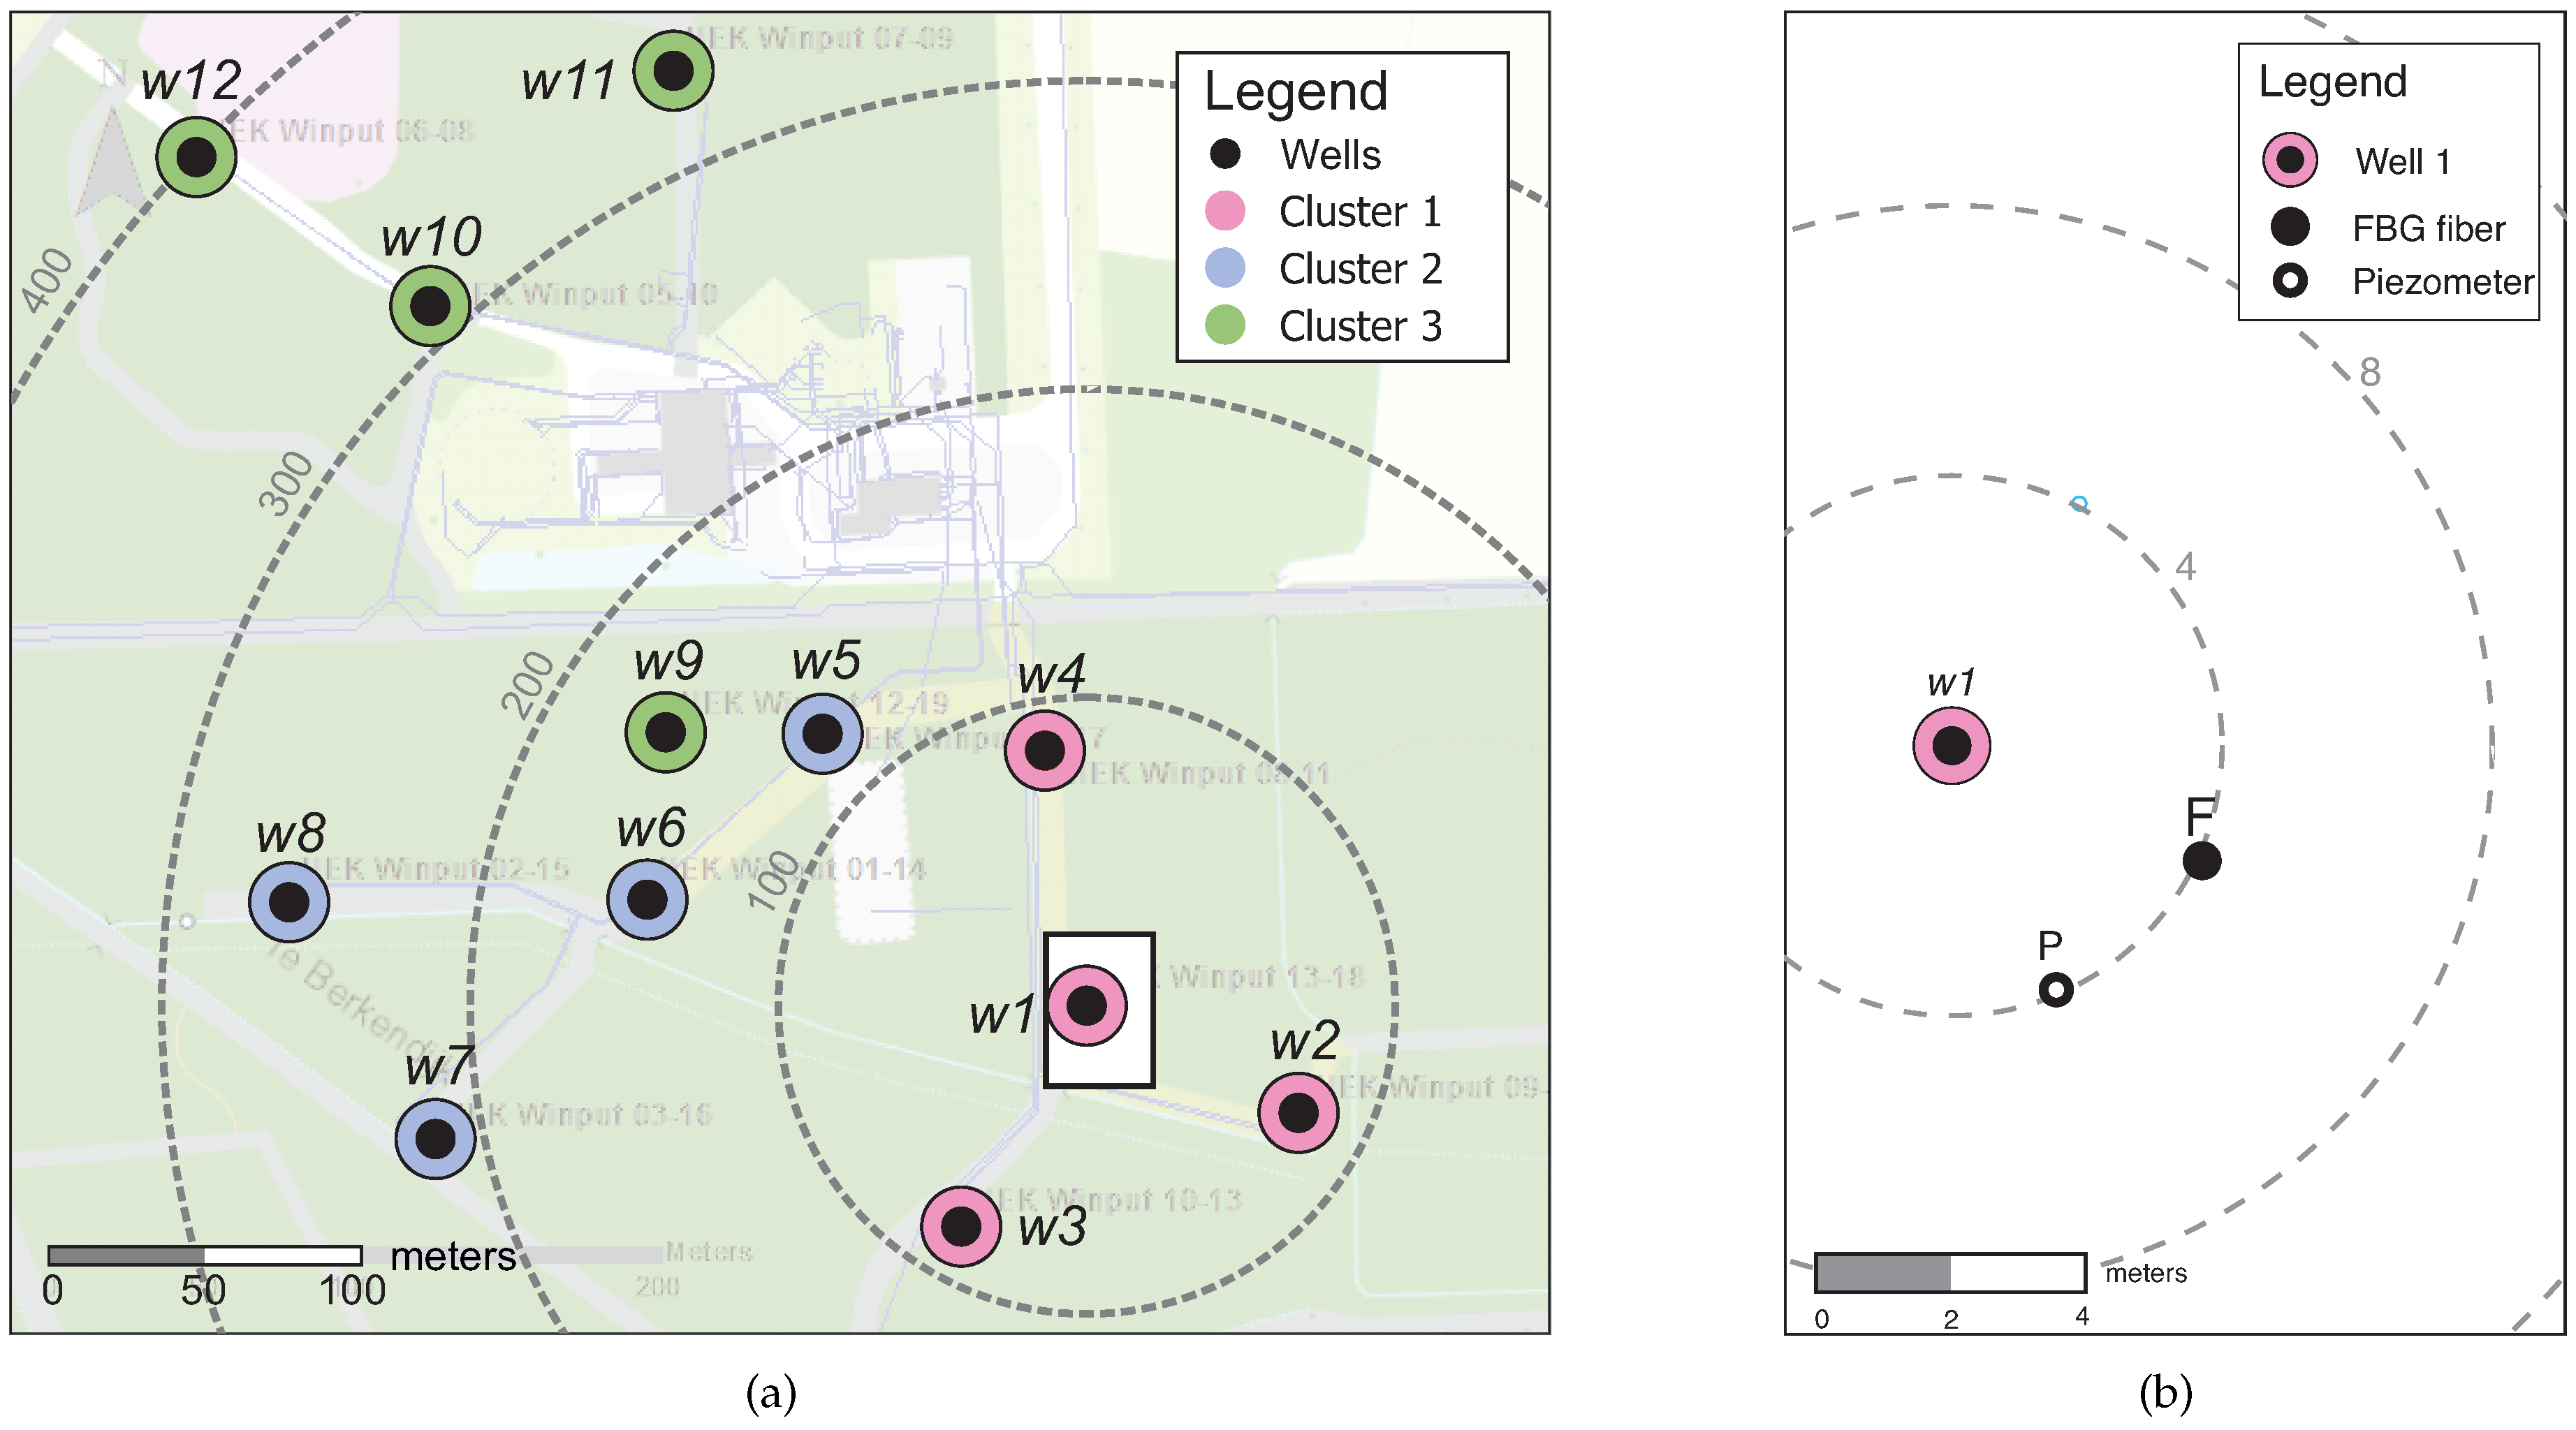
The study was conducted in a drinking water extraction field in Hengelo, Gelderland, The Netherlands. Here, groundwater is extracted from an unconfined aquifer from depths of 15–34 m. Soil borehole logs show mostly sand, gravel and, occasionally, loam layers. The well field contains 12 extraction wells with a maximum flowrate of 130 m
3 h
−1 for each well. The extraction wells are divided into three clusters with four wells in each cluster (see
Figure 1a). During regular operation three pumps extract simultaneously.
Two types of sensors were installed in close proximity of well
(
Figure 1b): Bundles of fiber Bragg grating (FBG) sensors, and reference divers (pressure and temperature sensors). Boreholes of 30 cm diameter were suction drilled 38 m deep (see
Figure 2).
has a well screen at a depth of 17.8–32 m.
The fiber bundle was glued using silicon to a nylon weighted fishing line to keep it stretched while being lowered in the borehole. The borehole was refilled with the mixture of the extracted sediment, the top part was filled with gravel. In this way, the placement of fibers caused minimal disturbance to the aquifer.
PVC tubes with 2 m long thin slits (screens) were installed in the boreholes as piezometer tubes. The borehole was refilled with the mixture of the original material and the slit area was sealed with clay. A reference diver (TD reference diver, van Essen Instruments, Delft, the Netherlands) was installed in the piezometer tube, 10 m below the surface.
Fiber bundle F consisted of three optical fibers placed in a teflon tube for protection (3 mm diameter, 1 mm thick). Each optical fiber contains eight FBG sensors with wavelengths 1518, 1527, 1536, 1545, 1554, 1563, 1572 and 1581 nm, a total of 24 sensor per bundle. FBG sensors were written using UV-laser in a standard single mode SMF28 fiber with an acrylate coating (Loptek, Berlin, Germany). The FBG sensors were 0.7 m apart and covered the range of 17–33 m, corresponding to the screen depth of the nearest well, w1.
An autonomous sensing unit was assembled to collect and transfer data from the field location. A microcontroller (Raspberry Pi model 3B, Raspberry Pi Foundation, UK) handled the communication with the FBG interrogator (Hyperion si155, LUNA, USA), optical switch (eol 1 × 16, National Instruments), weather station (Dreamlink WH1080, Conrad, Germany), and data server. The data were transferred via 3G mobile connection.
The FBG interrogator has a built-in wavelength reference to guarantee long-term accuracy of the measurements. The interrogator’s internal peak detection algorithm identifies the peak Bragg wavelengths from the spectrum 1500–1600 nm with a scanrate of 100 Hz. The interrogator was synchronized with an optical switch. An idle fiber was addressed before addressing each sensor fiber to improve detection. Each FBG sensor was sampled with a 2.1 s period.
The diver measures temperature and absolute pressure
, which is a combination of pore pressure
p and atmospheric pressure
. Diver data were stored every 10 s in an internal memory and had to be collected manually. The weather station measured atmospheric pressure every 60 s. Pore pressure data for comparison with FBG responses were obtained from the reference diver and weather station:
3. Results and Discussion
In this field study, FBG sensors were deployed in a drinking water well field to investigate the response upon well extraction. The FBG responses were measured during regular operation of the well field. The FBG sensors measure local temperature and strain variations in the installed fibers, which can be detected as a wavelength shift
of the reflected light. The strain variation can be caused by several physical effects taking place in a set of coupled domains. FBG response in the well field can be written after adapting the general equation (Equation (
2)):
The first term of FBG response is a temperature () contribution, the second term is a consolidation strain () contribution and the third one is a pore pressure strain () contribution. are transfer coefficients which describe the influence of FBG packaging. is a strain–optic coefficient.
The final response is a the result of all contributions and a coupling efficiency. Measured FBG responses from fiber F were compared to estimated FBG responses. Estimated FBG responses are calculated from pore pressure and temperature data collected from the reference piezometer P (for location, see
Figure 1b). Temperature graphs are not shown because the contribution to the FBG response is not significant (see
Table 1). Due to close proximity of the installed FBG fiber to well
, extraction from this well has a major effect on the FBG sensor response. We can identify two situations that are discussed separately—with and without extraction from
.
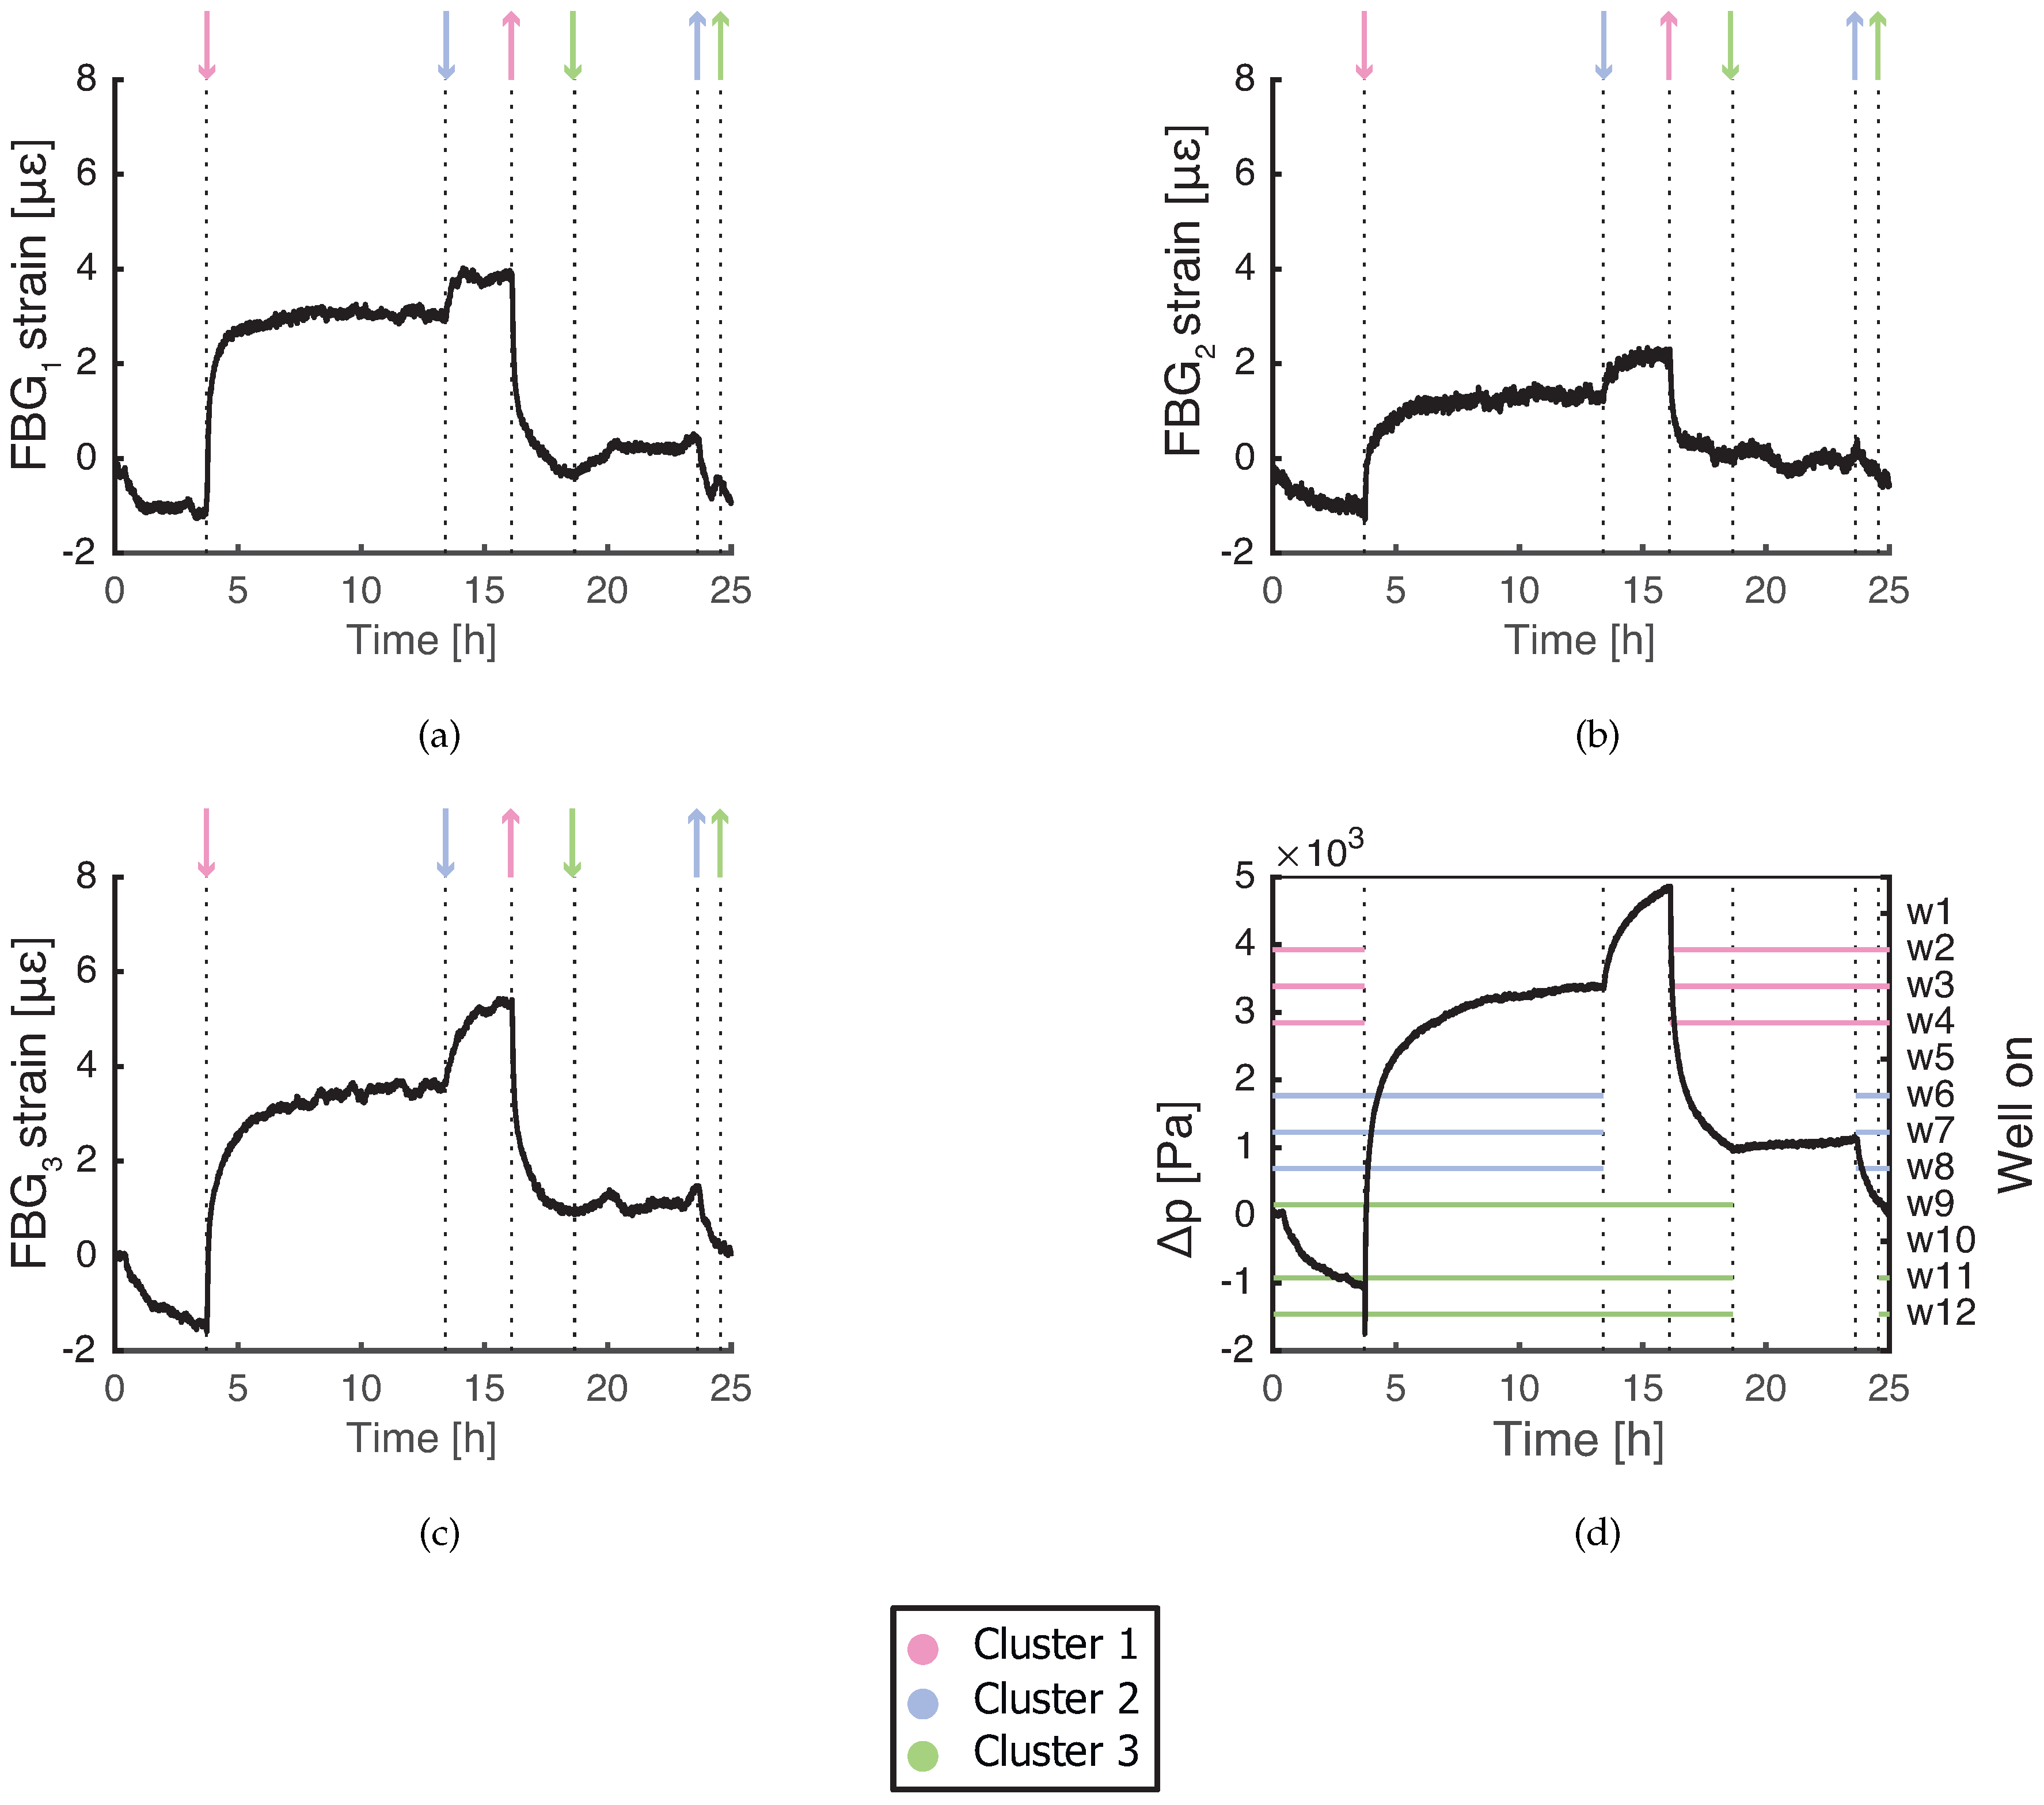
3.1. Operation without Extraction from Well
Without
extracting, all FBG sensors in
Figure 3a–c follow the pore pressure changes in
Figure 3d. Pore pressure changes can be coupled to FBG strain through material deformation of the fiber and packaging or through soil consolidation. According to estimated values from
Table 1, volumetric changes of the fiber due to pore pressure are a negligible contribution to FBG response, as well as temperature. FBG sensors in the current configuration measure consolidation strain in soil due to groundwater extraction.
The amplitude of the FBG response decreases with the distance to the wells which started/stopped the extraction (see
Figure 3a–c). Wells from Cluster 1 cause the largest response, while wells from Cluster 2 cause smaller but detectable response. Influence of wells from the Cluster 3 is visible only for
and
. FBG sensors detect consolidation strain caused by groundwater extraction up to 250 m distance (distance of the furthest well
).
Assuming that consolidation strain is constant within the depth span of the presented FBG sensors (1.4 m), expected values of consolidation strain transfer coefficient
are calculated in
Table 2. The strain measured by the FBG sensors is one order of magnitude lower than consolidation strain, because strain from soil is locally converted to shear deformation of the protective packaging [
28]. There are two mechanisms of strain transfer between soil and polymer interfaces and they are influenced by stiffness of the polymer packaging (Young’s modulus and Poisson’s ratio) [
29]. Soil particles tend to slide and scratch relatively hard polymer surface, while relatively soft surfaces deform and allow soil particles to roll [
30]. Strain transfer is larger when particles slide. In our case, packaging is a soft polymer (teflon with a layer of silicone) and soil particles tend to roll, thus low strain transfer coefficient values are expected.
Friction coefficient between soil and packaging increases with normal pressure applied on the interface. In field conditions, this means that strain transfer coefficient increases with soil density [
31]. Occasionally, stones and gravel of up to 10 cm size were discovered during the installation process and they were placed back into the borehole. Gravel pieces near the FBG sensors lowered the transfer of consolidation strain. FBG strain variation with depth is also caused by differences in the relative position of the fiber inside the tube. The shape of the teflon tube determines how much the fiber can adjust and release the strain.
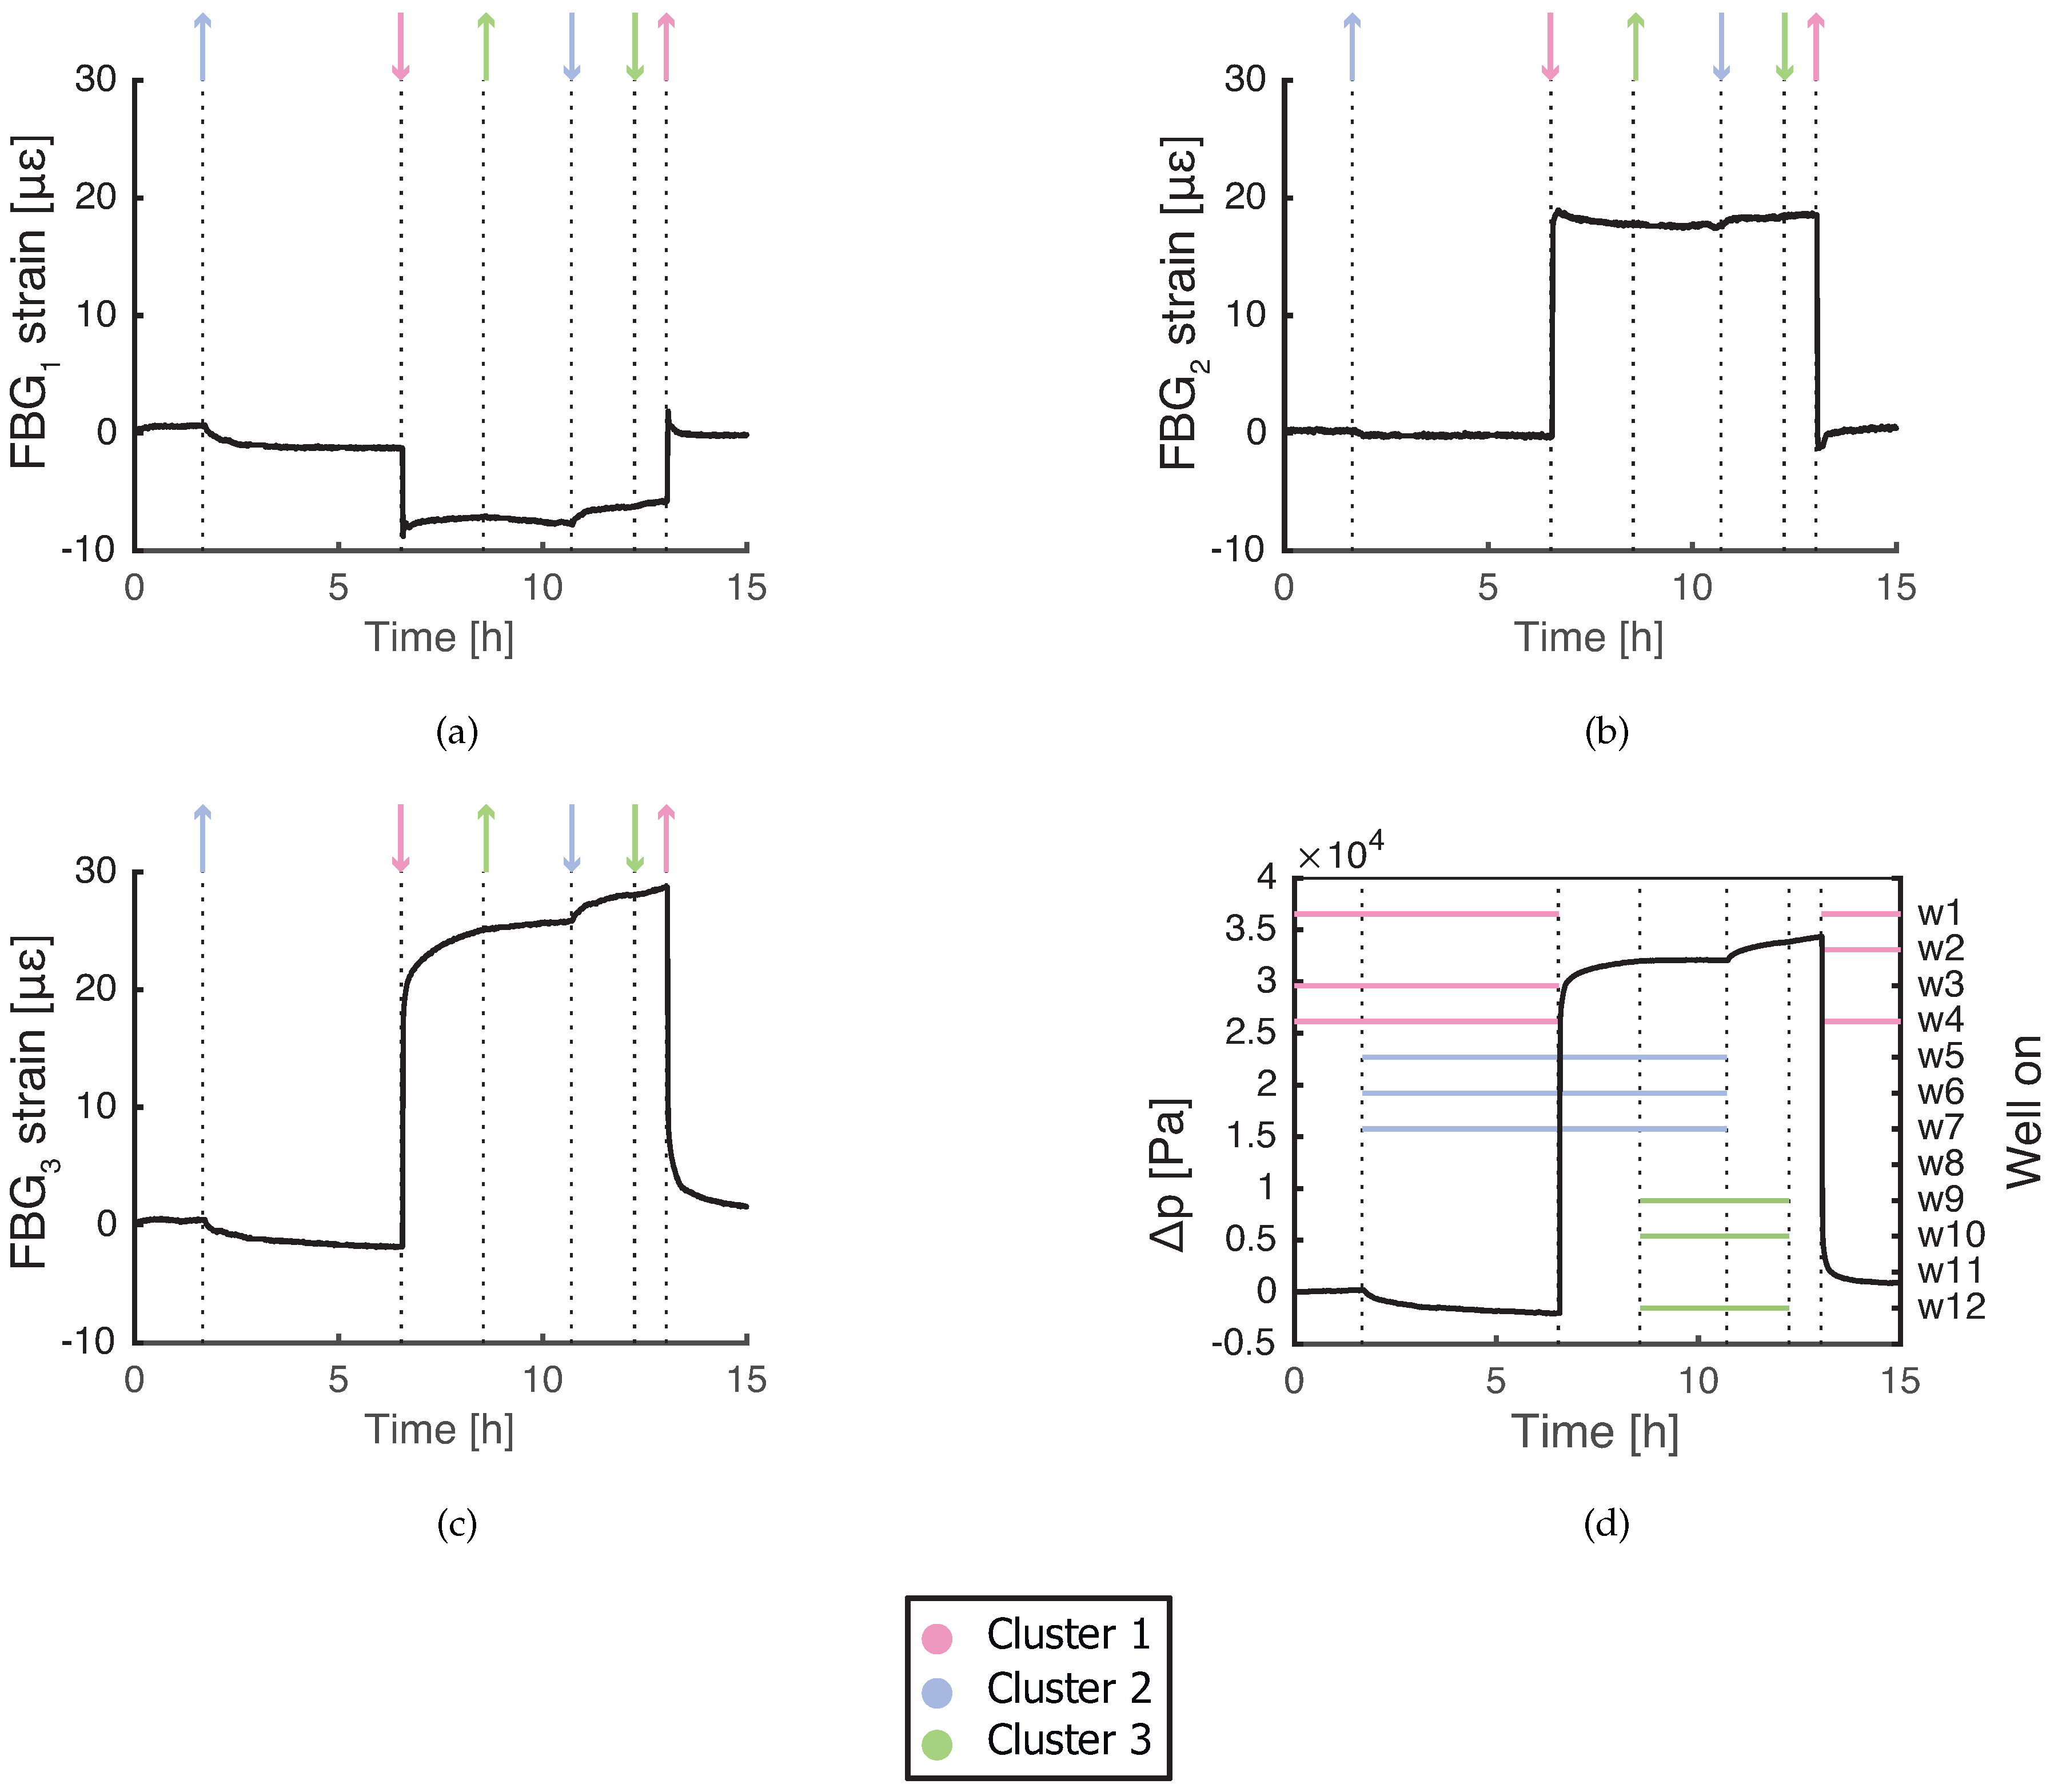
3.2. Operation with Extraction from Well
In the case
is also extracting, the FBG sensors respond immediately to pore pressure changes, with amplitude decreasing with distance. Unlike in the previous case with
off, the responses to Cluster 1 vary both in amplitude and shape (see
Figure 4). The FBG responses to Cluster 2 follow the pore pressure changes in
Figure 4d, while the response to Cluster 3 is barely visible for
and
.
The extraction of clearly influences the FBG sensors. The amplitude of the fast response is approximately equal for start and stop of the Cluster 1 extraction. All soil strain is recovered after compression, which means that the consolidation is in the (primary) elastic stage. Sensors and show the fast response with the same sign as the fast pore pressure change, but they differ in slow relaxation behavior. The initial fast response of has an opposite sign compared to the other sensors. expands when the wells from the Cluster 1 are switched on and compresses at shutdown of the wells. This means that the pore pressure locally increases when the extraction of starts. The explanation could be related to an occurrence of a clay layer near . The discontinuities at the sand–clay boundary might cause local accumulation of groundwater and increase in the pore pressure. Compared to piezometers, FBG sensors can provide high resolution consolidation data from different depths and capture local heterogeneity of soil.
The observed FBG responses are not caused by volumetric changes of the fiber due to pore pressure or temperature (
Table 1), FBG sensors most likely detect soil consolidation. When the extraction of
is involved, the strain from soil is not always transferred with a constant scaling factor
. Various types of FBG relaxation responses to Cluster 1 are not caused by soil consolidation.
FBG relaxation response against the fast response is visible only for
and
in
Figure 4. This response might be linked to the rate of soil compression/expansion. According to the results, if an FBG fiber in a teflon tube compresses/expands faster, it is more likely to show this relaxation behavior. Similar effects were previously observed by Drusová et al. [
13] in an aquifer simulator filled with uniform sand. When pore pressure/flow suddenly changed, FBG sensors with PVC and teflon coating both showed a relaxation response against the pressure changes. It is known that polymers such as teflon and PVC behave differently based on the applied strain rate [
32]. When a shock impulse is applied to these polymers, the relaxation response looks similar to what is measured by FBG sensors. In the case of teflon, this type of relaxation becomes visible with strain rates several orders of magnitude higher [
33] than measured in this study. The maximal applied consolidation strain rate expected in this study was 57
/s (calculated from the results in
Figure 4d). Therefore, the consolidation strain rate is not a factor which determines the FBG response.
The relaxation response of FBG sensors in
Figure 4 can be interpreted as decoupling of soil-packaging interface. Teflon tube slips in the soil and FBG fiber slips in the tube back to its original position after compression/expansion. The limit when the soil-packaging interface starts decoupling is determined by the friction coefficient and the magnitude of consolidation strain [
34].
The larger magnitude of consolidation strain can explain why the relaxation behavior only occurs when start/stops extracting. In the case of extraction without , the consolidation strain is not sufficient to cause the slip, the soil-packaging interface is fully coupled and consolidation strain is elastically transferred to FBG sensors.
According to Zhang et al. [
34], if normal interface pressure is lower, friction coefficient is lower and packaging is more likely to decouple from soil. In the case of extraction with
, the soil-packaging friction coefficient can be influenced by groundwater flow. Groundwater flow close to an extraction well also has a vertical flow component and there is a possibility that flow channels are created along the packaging surface. This effect will decrease the coupling of the soil-packaging interface.
The interface decoupling limit has been reached by and . It is difficult to quantify the interface friction coefficient of the packaging in field conditions because it is influenced by the fiber installation process. The dependence on groundwater flow and soil type of the soil-packaging friction coefficient will be a subject of further research.
Several packaging options were already tested for FBG consolidation sensors. Wu et al. [
29] used FBG fibers with polyurethane, metal sheath and steel conduit. Polyurethane seems to transfer the largest portion of consolidation strain, but it is not durable enough to be deployed at more than 100 m depth. Metal packaging can provide long-term protection of the fiber, but it will reduce the strain transmission [
35]. Huang et al. [
16] placed an FBG extensometer in a PVC tube and increased the friction with soil by adding friction rings. A teflon tube is a very suitable choice when it comes to protection of fibers in the subsurface because of its durability, low chemical reactivity and affordable price. A teflon tube is however not a suitable packaging for FBG consolidation sensors due to high strain losses. On the other hand, due to low friction coefficient, slow slip relaxation could become a new method to detect groundwater flow changes. An ideal packaging for this type of FBG groundwater flow and consolidation sensor would still be a teflon tube with a smaller diameter filled with elastic polymer to facilitate the strain transfer to the FBG sensors. The packaging should have a Young’s modulus lower or comparable to soil.
4. Conclusions
FBG sensors were deployed in an aquifer to find new methods to measure groundwater flow. The sensors measured soil consolidation caused by groundwater extraction from multiple wells. The magnitude of the FBG response to consolidation depends on the distance to extraction wells. Extraction of the nearest well causes the largest strain response, but nearby wells also need to be taken into account as they all influence the pore pressure in the aquifer. FBG sensors respond to an influence of wells from an area within 250 m radius (including Cluster 1, Cluster 2 and ). The magnitude of FBG response at the start and stop of extraction are roughly equal, which means the soil deformation is elastic.
FBG packaging is an important factor which determines the FBG strain response. With our packaging (teflon tube), we measured consolidation strain one order of magnitude lower than the expected value. The influence of packaging on the FBG response is different based on magnitude of the pore pressure changes (groundwater flow). We compared two cases—with and without extraction of the nearest well.
When the nearest well was not extracting, the FBG sensors measured only soil consolidation caused by extraction from the further wells (starting from 80 m distance). The packaging in this case influenced the strain transfer magnitude between soil and FBG fiber. When the nearest well at 4 m distance started/stopped extracting, FBG fibers also showed a relaxation response influenced by a slow slip of the packaging in soil. The results suggest that friction coefficient between FBG packaging and soil is influenced by the groundwater flow, which was higher and not only in horizontal direction when the nearest well was extracting. FBG sensors can be used to measure soil consolidation with high resolution and show the occurrence of soil layers with different permeability.
A new packaging needs to be designed to increase the sensitivity of FBG sensors to consolidation strain and groundwater flow and to discriminate between them. More research needs to be conducted to translate the FBG data into groundwater flow, perhaps in combination with hydrological modeling tools. Once deployed in a well field, FBG sensors could measure continuously during regular operation of the wells. Long-term monitoring of consolidation and flow with high spatial resolution can show the first signs of clogging and identify the layers where it occurs.
Author Contributions
Conceptualization: S.D., R.M.W., A.D.W., H.L.O., methodology: S.D., R.M.W., software: S.D., validation: S.D., formal analysis: S.D., investigation: S.D., resources: S.D., data curation: S.D., writing—original draft preparation: S.D., writing—review and editing: S.D., R.M.W., A.D.W., H.L.O., visualization: S.D., supervision: R.M.W., A.D.W., H.L.O.
Funding
Wetsus is cofunded by the Dutch Ministry of Economic Affairs and Ministry of Infrastructure and Environment, the European Union Regional Development Fund, the Province of Fryslân, and the Northern Netherlands Provinces. This research received funding from the European Union’s Horizon 2020 research and innovation programme under the Marie Skłodowska-Curie grant agreement No 665874.
Acknowledgments
This work was performed in the cooperation framework of Wetsus, European Centre of Excellence for Sustainable Water Technology (
www.wetsus.eu). We are grateful to the participants of the research theme “Groundwater technology” for fruitful discussions and financial support.
Conflicts of Interest
The authors declare no conflict of interest. The funders had a role in the decision to publish the results.
Abbreviations
The following abbreviations are used in this manuscript:
| FBG | Fiber Bragg grating |
| DTS | Distributed temperature sensing |
| PVC | Polyvinyl chloride |
References
- Revil, A.; Karaoulis, M.; Johnson, T.; Kemna, A. Review: Some low-frequency electrical methods for subsurface characterization and monitoring in hydrogeology. Hydrogeol. J. 2012, 20, 617–658. [Google Scholar] [CrossRef]
- Robert, T.J.S. Geophysical Identification, Characterization, and Monitoring of Preferential Groundwater Flow Paths in Fractured Media. Ph.D. Thesis, University of Liège, Liège, Belgium, 2012. [Google Scholar]
- Bayless, E.R.; Wayne, A.; Mandell, J.R.U. Accuracy of Flowmeters Measuring Horizontal Groundwater Flow in an Unconsolidated Aquifer Simulator. Ground Water Monit. Remediat. 2011, 31, 48–62. [Google Scholar] [CrossRef]
- Bense, V.F.; Read, T.; Bour, O.; Le Borgne, T.; Coleman, T.; Krause, S.; Chalari, A.; Mondanos, M.; Ciocca, F.; Selker, J.S. Distributed Temperature Sensing as a downhole tool in hydrogeology. Water Resour. Res. 2016, 52, 9259–9273. [Google Scholar] [CrossRef]
- Anderson, M.P. Heat as a ground water tracer. Ground Water 2005, 43, 951–968. [Google Scholar] [CrossRef]
- Read, T.; Bour, O.; Bense, V.; Borgne, T.L.; Goderniaux, P.; Klepikova, M.V.; Hochreutener, R.; Lavenant, N.; Boschero, V. Characterizing groundwater flow and heat transport in fractured rock using fiber-optic distributed temperature sensing. Geophys. Res. Lett. 2013, 40. [Google Scholar] [CrossRef]
- Klepikova, M.V.; Borgne, T.L.; Bour, O.; Dentz, M. Heat as a tracer for understanding transport processes in fracturedmedia: Theory and field assessment from multiscale thermal push-pull tracer tests. Water Resour. Res. 2016, 52, 1–40. [Google Scholar] [CrossRef]
- Read, T.; Bense, V.F.; Hochreutener, R.; Bour, O.; Le Borgne, T.; Lavenant, N.; Selker, J.S. Thermal-plume fibre optic tracking (T-POT) test for flow velocity measurement in groundwater boreholes. Geosci. Instrum. Methods Data Syst. 2015, 4, 197–202. [Google Scholar] [CrossRef]
- Briggs, M.A.; Buckley, S.F.; Bagtzoglou, A.C.; Werkema, D.D.; Lane, J.W., Jr. Actively heated high-resolution fiber-optic-distributed temperature sensing to quantify streambed flow dynamics in zones of strong groundwater upwelling. Water Resour. Res. 2016, 52, 5179–5194. [Google Scholar] [CrossRef]
- Somogyvári, M.; Bayer, P.; Brauchler, R. Travel-time-based thermal tracer tomography. Hydrol. Earth Syst. Sci. 2016, 20, 1885–1901. [Google Scholar] [CrossRef]
- Bakx, W.; Doornenbal, P.J.; van Weesep, R.J.; Bense, V.F.; Oude Essink, G.H.P.; Bierkens, M.F.P. Determining the Relation between Groundwater Flow Velocities and Measured Temperature Differences Using Active Heating-Distributed Temperature Sensing. Water 2019, 11, 1619. [Google Scholar] [CrossRef]
- Des Tombe, B.F.; Bakker, M.; Smits, F.; Schaars, F.; van der Made, K.J. Estimation of the Variation in Specific Discharge Over Large Depth Using Distributed Temperature Sensing (DTS) Measurements of the Heat Pulse Response. Water Resour. Res. 2019, 55, 811–826. [Google Scholar] [CrossRef]
- Drusová, S.; Bakx, W.; Wexler, A.D.; Offerhaus, H.L. Possibilities for Groundwater Flow Sensing with Fiber Bragg Grating Sensors. Sensors 2019, 19, 1730. [Google Scholar] [CrossRef]
- Gambolati, G.; Teatini, P. Geomechanics of subsurface water withdrawal and injection. Water Resour. Res. 2015, 51, 3922–3955. [Google Scholar] [CrossRef]
- Zhu, H.H.; Shi, B.; Zhang, C.C. FBG-Based Monitoring of Geohazards: Current Status and Trends. Sensors 2017, 17, 452. [Google Scholar] [CrossRef]
- Huang, A.B.; Wang, C.C.; Lee, J.T.; Ho, Y.T. Applications of FBG-based sensors to ground stability monitoring. J. Rock Mech. Geotech. Eng. 2016, 8, 513–520. [Google Scholar] [CrossRef]
- Schenato, L. A Review of Distributed Fibre Optic Sensors for Geo-Hydrological Applications. Appl. Sci. 2017, 7, 896. [Google Scholar] [CrossRef]
- Wang, J.; Jiang, L.; Sun, Z.; Hu, B.; Zhang, F.; Song, G.; Liu, T.; Qi, J.; Zhang, L. Research on the Surface Subsidence Monitoring Technology Based on Fiber Bragg Grating Sensing. Photonic Sens. 2017, 7, 20–26. [Google Scholar] [CrossRef][Green Version]
- Loáiciga, H.A. Consolidation Settlement in Aquifers Caused by Pumping. J. Geotech. Geoenviron. Eng. 2012, 139, 1191–1204. [Google Scholar] [CrossRef]
- Niu, W.; Wang, Z.; Chen, F.; Li, H. Settlement Analysis of a Confined Sand Aquifer Overlain by a Clay Layer due to Single Well Pumping. Math. Probl. Eng. 2013, 2013. [Google Scholar] [CrossRef]
- Biot, M.A. Theory of elasticity and consolidation for a porous anisotropic solid. J. Appl. Phys. 1955, 26. [Google Scholar] [CrossRef]
- Shen, S.L.; Xu, Y.S. Numerical evaluation of land subsidence induced by groundwater pumping in Shanghai. Can. Geotech. J. 2011, 48, 1378–1392. [Google Scholar] [CrossRef]
- Shen, S.L.; Ma, L.; Xu, Y.S.; Yin, Z.Y. Interpretation of increased deformation rate in aquifer IV due to groundwater pumping in Shanghai. Can. Geotech. J. 2013, 51, 1129–1142. [Google Scholar] [CrossRef]
- Look, B. Handbook of Geotechnical Investigation and Design Tables; Taylor & Francis/Balkema: Leiden, The Netherlands, 2007. [Google Scholar]
- Sheng, H.J.; Fu, M.Y.; Chen, T.C.; Liu, W.F.; Bor, S.S. A Lateral Pressure Sensor Using a Fiber Bragg Grating. IEEE Photonics Technol. Lett. 2004, 16, 1146–1148. [Google Scholar] [CrossRef]
- Li, D.; Ren, L.; Li, H. Mechanical Property and Strain Transferring Mechanism in Optical Fiber Sensors. In Fiber Optic Sensors; Yasin, D.M., Ed.; IntechOpen Limited: London, UK, 2012. [Google Scholar]
- Cadusch, P.J.; Thompson, A.C.; Stoddart, P.R.; Wade, S.A. Modeling of Bend Effects on Fiber Bragg Gratings Modeling of Bend Effects on Fiber Bragg Gratings. Proc. SPIE Int. Soc. Opt. Eng. 2012. [Google Scholar] [CrossRef]
- Her, S.C.; Huang, C.Y. Effect of Coating on the Strain Transfer of Optical Fiber Sensors. Sensors 2011, 11, 6926–6941. [Google Scholar] [CrossRef] [PubMed]
- Wu, J.; Jiang, H.; Su, J.; Shi, B.; Jiang, Y.; Gu, K. Application of distributed fiber optic sensing technique in land subsidence monitoring. J. Civ. Struct. Health Monit. 2015, 5, 587–597. [Google Scholar] [CrossRef]
- O’Rourke, T.D.; Druschel, S.J.; Netravali, A.N. Shear strength characteristics of sand-polymer interfaces. J. Geotech. Eng. 1990, 116, 451–469. [Google Scholar] [CrossRef]
- Fuggle, A.; Frost, J. Particle size effects in interface shear behavior and geomembrane wear. In Proceedings of the International Symposium on Characterization and Behavior of Interfaces, Atlanta, GA, USA, 21 September 2008; pp. 51–57. [Google Scholar]
- Bourne, N.K. On the Shock Response of Polymers to Extreme Loading. J. Dyn. Behav. Mater. 2016, 2, 33–42. [Google Scholar] [CrossRef]
- Walley, S.M.; Field, J.E. Strain rate sensitivity of polymers in compression from low to high rates. DYMAT J. 1994, 1.3, 211–227. [Google Scholar]
- Zhang, C.C.; Zhu, H.H.; She, J.K.; Zhang, D.; Shi, B. Quantitative evaluation of optical fiber/soil interfacial behavior and its implications for sensing fiber selection. IEEE Sens. J. 2015, 15, 3059–3067. [Google Scholar] [CrossRef]
- Lin, Y.B.; Chang, K.C.; Chern, J.C.; Wang, L.A. Packaging Methods of Fiber-Bragg Grating Sensors in Civil Structure Applications. IEEE Sens. J. 2016. [Google Scholar] [CrossRef]
© 2019 by the authors. Licensee MDPI, Basel, Switzerland. This article is an open access article distributed under the terms and conditions of the Creative Commons Attribution (CC BY) license (http://creativecommons.org/licenses/by/4.0/).


