Quality of Daily-Life Gait: Novel Outcome for Trials that Focus on Balance, Mobility, and Falls


 ,
, 
Abstract
1. Introduction
2. Materials and Methods
2.1. Participants
2.2. Measurements
2.3. Data Analysis
2.4. Statistics
3. Results
4. Discussion
5. Conclusions
Author Contributions
Funding
Acknowledgments
Conflicts of Interest
Appendix A

| p | r | Mean | s2BS | s2WS | s2E | |
|---|---|---|---|---|---|---|
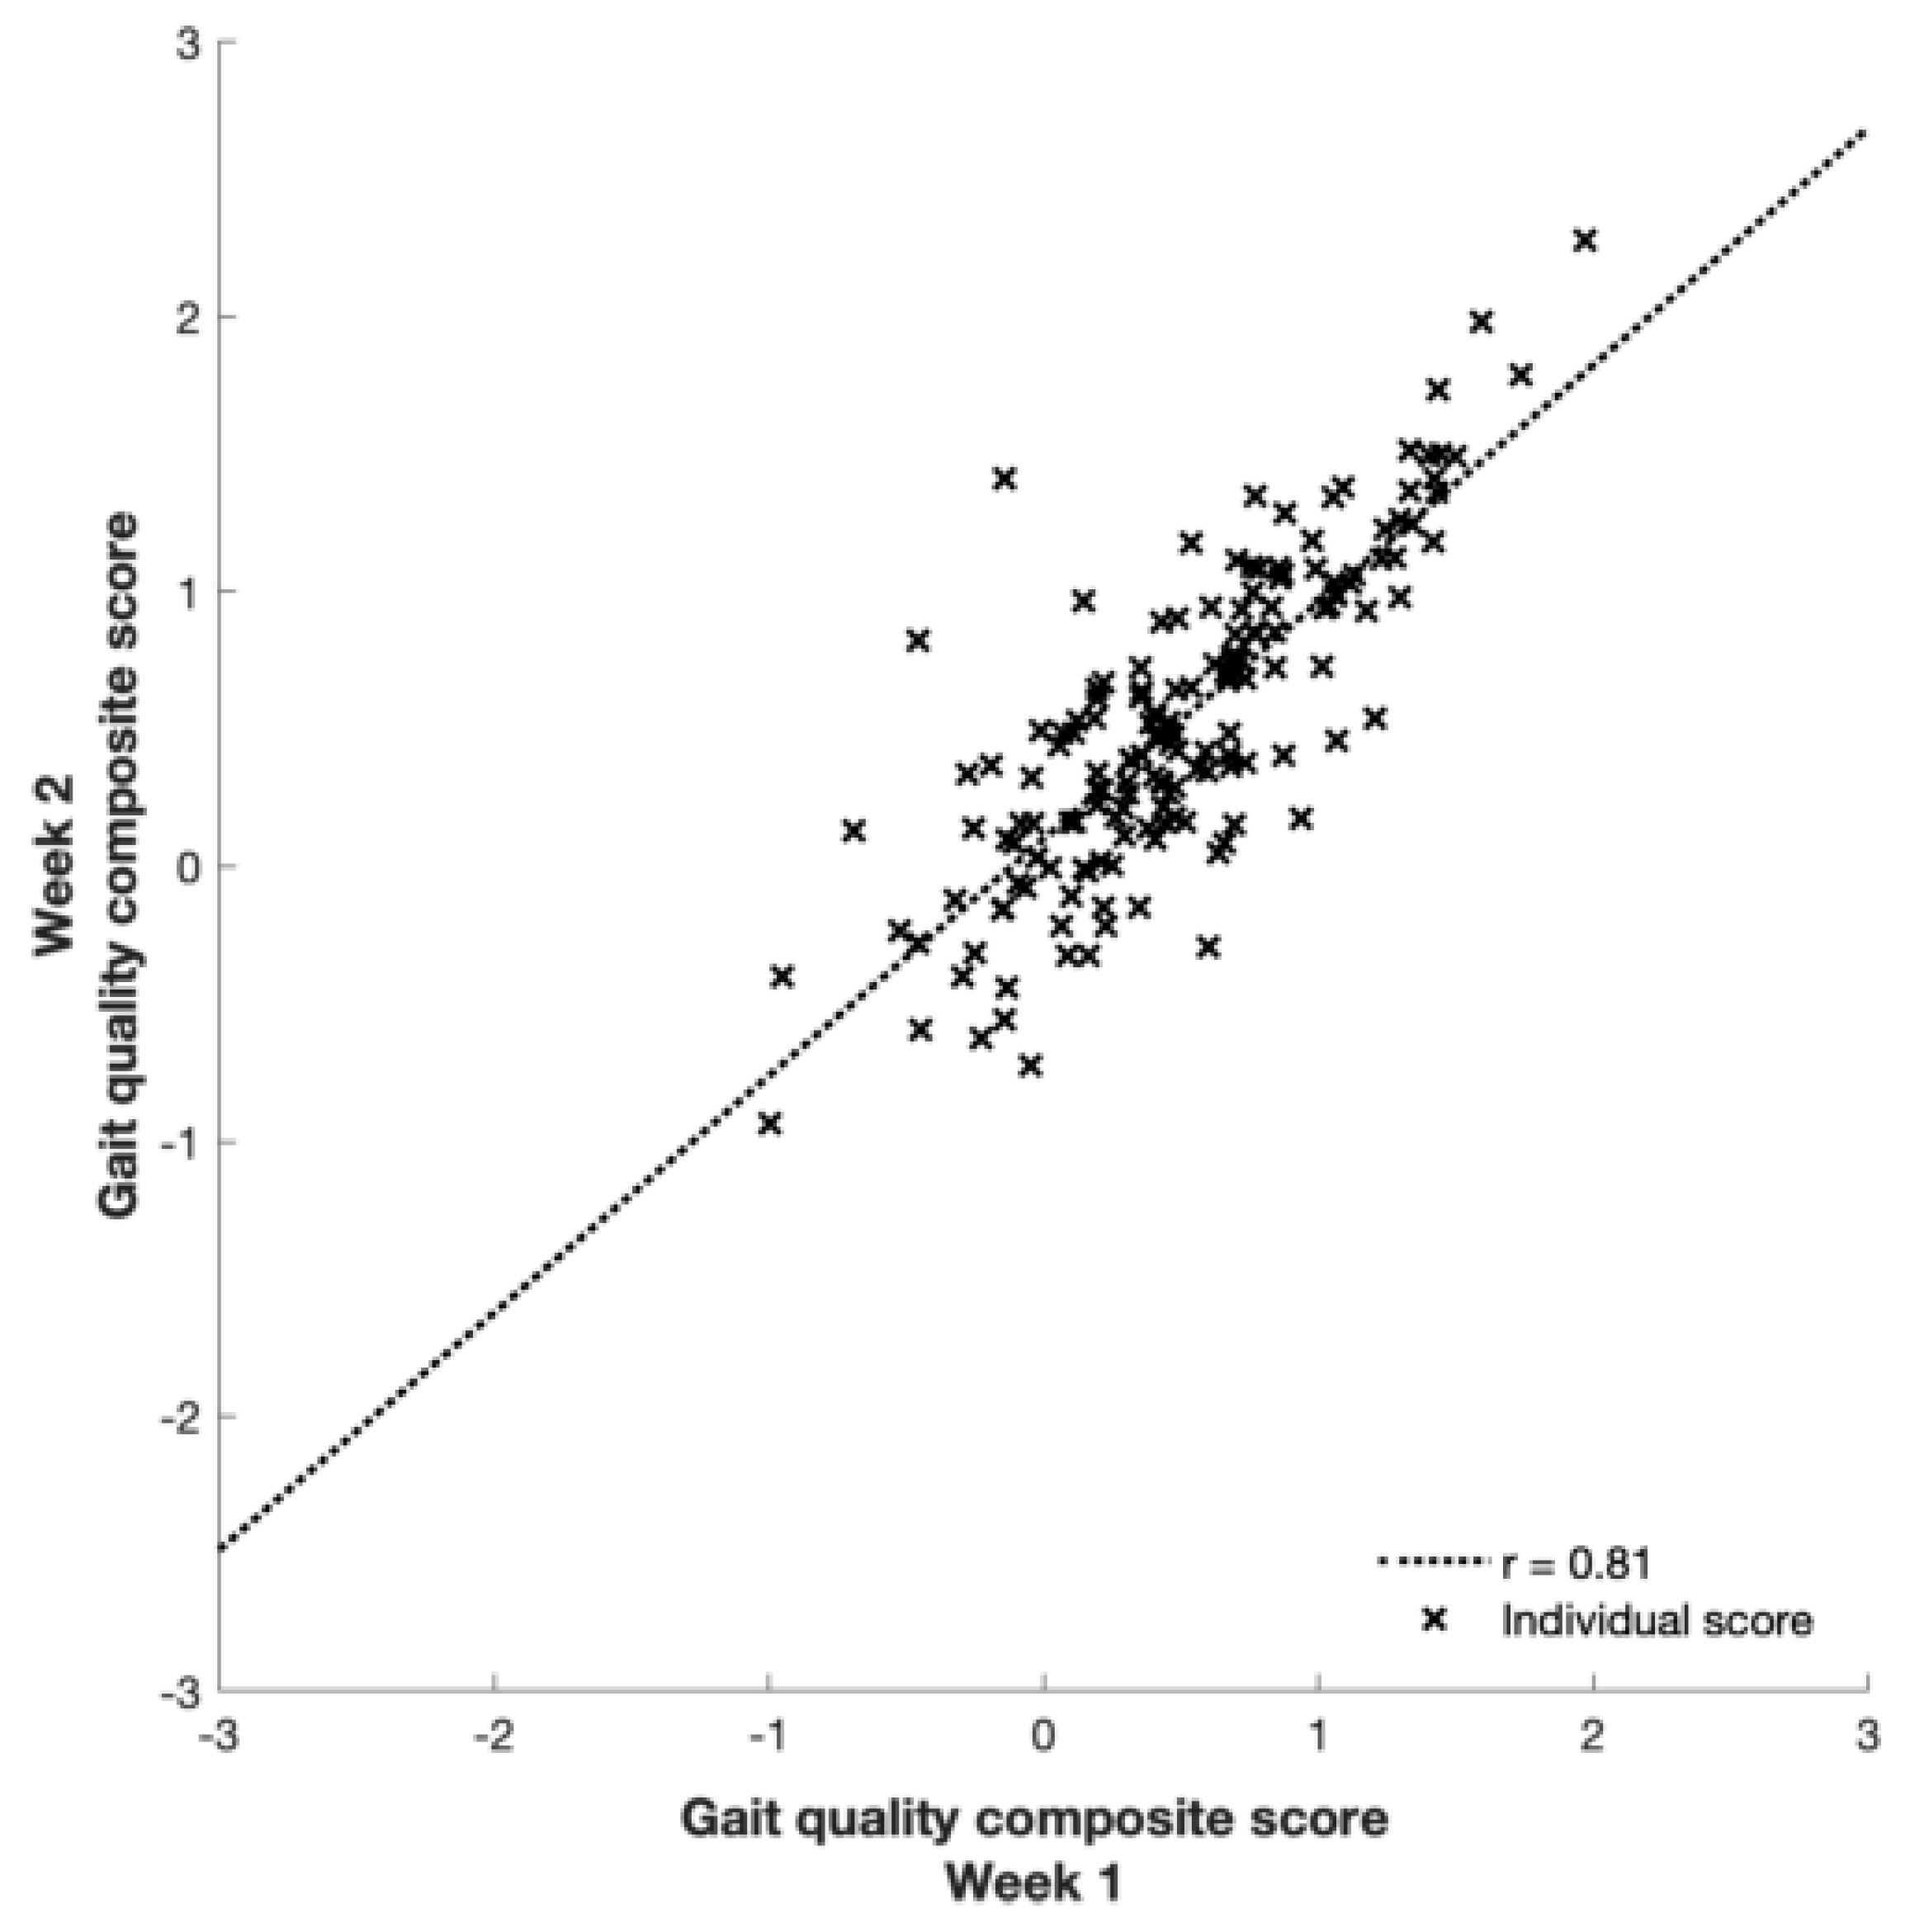
| Gait quality composite score | 0.64 | 0.81 | 0.51369 | 0.54700 | 0.08068 | 0.05759 |
| Stride autocorrelation VT | 0.54 | 0.82 | 0.37464 | 0.01051 | 0.00040 | 0.00103 |
| Stride autocorrelation ML | 0.65 | 0.94 | 0.34724 | 0.02069 | 0.00013 | 0.00060 |
| Stride autocorrelation AP | 0.63 | 0.83 | 0.32881 | 0.00945 | 0.00021 | 0.00088 |
| Walking speed | 0.39 | 0.93 | 0.45073 | 0.01030 | 0.00027 | 0.00036 |
| Step length | 0.41 | 0.97 | 0.63683 | 0.02457 | 0.00022 | 0.00032 |
| Stride time variability | 0.74 | 0.85 | 9.36259 | 13.19347 | 0.11324 | 1.05325 |
| Stride speed variability | 0.87 | 0.95 | 0.04695 | 0.00030 | 2.20 × 10⁻⁷ | 7.90 × 10⁻⁶ |
| Stride length variability | 0.65 | 0.93 | 0.04456 | 0.00029 | 2.07 × 10⁻⁶ | 1.01 × 10⁻⁵ |
| Standard deviation VT | 0.77 | 0.92 | 1.32658 | 0.17858 | 0.00061 | 0.00733 |
| Standard deviation ML | 0.18 | 0.94 | 1.16407 | 0.09332 | 0.00560 | 0.00305 |
| Standard deviation AP | 0.13 | 0.96 | 1.08260 | 0.09554 | 0.00479 | 0.00203 |
| Stride frequency | 0.51 | 0.95 | 0.82482 | 0.01119 | 0.00013 | 0.00030 |
| Percentage of power <0.7 hz VT | 0.65 | 0.88 | 0.23888 | 0.04349 | 0.00059 | 0.00284 |
| Percentage of power <0.7 hz ML | 0.76 | 0.90 | 11.96214 | 96.31279 | 0.45914 | 4.98382 |
| Percentage of power <0.7 hz AP | 0.85 | 0.77 | 11.29116 | 29.95935 | 0.13423 | 3.85606 |
| Index of harmonicity VT | 0.19 | 0.96 | 0.62043 | 0.04940 | 0.00156 | 0.00092 |
| Index of harmonicity ML | 0.68 | 0.92 | 0.64420 | 0.06977 | 0.00048 | 0.00276 |
| Index of harmonicity AP | 0.45 | 0.90 | 0.77248 | 0.00890 | 0.00026 | 0.00046 |
| Harmonic ratio VT | 0.47 | 0.90 | 1.53576 | 0.07348 | 0.00211 | 0.00406 |
| Harmonic ratio ML | 0.23 | 0.92 | 1.33320 | 0.02929 | 0.00187 | 0.00129 |
| Harmonic ratio AP | 0.61 | 0.86 | 1.46828 | 0.05386 | 0.00103 | 0.00396 |
| Dominant frequency VT | 0.22 | 0.78 | 1.82738 | 0.16622 | 0.03063 | 0.02044 |
| Dominant frequency ML | 0.22 | 0.84 | 0.85494 | 0.13286 | 0.01897 | 0.01257 |
| Dominant frequency AP | 0.23 | 0.88 | 1.58025 | 0.06492 | 0.00598 | 0.00417 |
| Amplitude of dominant frequency VT | 0.68 | 0.93 | 0.49412 | 0.04264 | 0.00026 | 0.00155 |
| Amplitude of dominant frequency ML | 1.00 | 0.91 | 0.47481 | 0.05827 | 9.2 × 10⁻⁹ | 0.00263 |
| Amplitude of dominant frequency AP | 0.11 | 0.85 | 0.51044 | 0.02357 | 0.00501 | 0.00198 |
| Width of dominant frequency VT | 0.14 | 0.80 | 0.76624 | 0.02141 | 0.00572 | 0.00267 |
| Width of dominant frequency ML | 0.39 | 0.90 | 0.79147 | 0.01238 | 0.00049 | 0.00066 |
| Width of dominant frequency AP | 0.14 | 0.80 | 0.75841 | 0.00611 | 0.00167 | 0.00075 |
| Range VT | 0.60 | 0.89 | 9.56290 | 9.84092 | 0.15828 | 0.55808 |
| Range ML | 0.47 | 0.95 | 7.95077 | 10.04315 | 0.13792 | 0.26707 |
| Range AP | 0.40 | 0.91 | 7.33318 | 7.13497 | 0.23150 | 0.32894 |
| Local divergence rate/stride VT | 0.75 | 0.87 | 2.11436 | 0.13693 | 0.00097 | 0.00919 |
| Local divergence rate/stride ML | 0.21 | 0.92 | 2.16970 | 0.15560 | 0.01077 | 0.00689 |
| Local divergence rate/stride AP | 0.58 | 0.86 | 2.19507 | 0.09652 | 0.00217 | 0.00707 |
| Sample entropy VT | 0.80 | 0.91 | 0.24764 | 0.00271 | 8.33 × 10⁻⁶ | 0.00013 |
| Sample entropy ML | 0.74 | 0.91 | 0.31207 | 0.00394 | 2.07 × 10⁻⁵ | 0.00018 |
| Sample entropy AP | 0.06 | 0.91 | 0.26908 | 0.00359 | 0.00064 | 0.00017 |
| Small effect | Medium effect | Large effect | |||||||
|---|---|---|---|---|---|---|---|---|---|
| Cohen’s d = 0.3 | Cohen’s d = 0.5 | Cohen’s d = 0.8 | |||||||
| r = 0.3 | r = 0.6 | r = 0.9 | r = 0.3 | r = 0.6 | r = 0.9 | r = 0.3 | r = 0.6 | r = 0.9 | |
| Gait quality composite | 303 | 208 | 114 | 110 | 76 | 42 | 44 | 31 | 18 |
| Walking speed | 259 | 158 | 56 | 95 | 58 | 22 | 38 | 24 | 10 |
| Stride frequency | 254 | 151 | 49 | 93 | 56 | 19 | 37 | 23 | 9 |
| Stride length | 251 | 148 | 44 | 92 | 54 | 17 | 37 | 22 | 8 |
| Standard deviation VT | 252 | 151 | 51 | 92 | 56 | 19 | 37 | 23 | 9 |
| Standard deviation ML | 270 | 169 | 67 | 99 | 62 | 25 | 40 | 25 | 11 |
| Standard deviation AP | 266 | 163 | 61 | 97 | 60 | 23 | 39 | 25 | 10 |
| Range VT | 258 | 158 | 59 | 94 | 58 | 23 | 38 | 24 | 10 |
| Range ML | 254 | 152 | 50 | 93 | 56 | 19 | 37 | 23 | 9 |
| Range AP | 262 | 162 | 62 | 96 | 60 | 23 | 39 | 24 | 10 |
| Walking speed variability | 250 | 148 | 45 | 91 | 54 | 18 | 37 | 22 | 8 |
| Stride time variability | 257 | 160 | 63 | 94 | 59 | 24 | 38 | 24 | 11 |
| Stride length variability | 253 | 152 | 50 | 92 | 56 | 19 | 37 | 23 | 9 |
| Stride autocorrelation VT | 268 | 173 | 77 | 98 | 63 | 29 | 39 | 26 | 13 |
| Stride autocorrelation ML | 252 | 150 | 48 | 92 | 55 | 18 | 37 | 23 | 8 |
| Stride autocorrelation AP | 263 | 167 | 71 | 96 | 61 | 27 | 39 | 25 | 12 |
| Amplitude of dominant frequency VT | 253 | 151 | 50 | 92 | 56 | 19 | 37 | 23 | 9 |
| Amplitude of dominant frequency ML | 251 | 151 | 51 | 92 | 56 | 19 | 37 | 23 | 9 |
| Amplitude of dominant frequency AP | 323 | 227 | 130 | 118 | 83 | 48 | 47 | 34 | 20 |
| Width of dominant frequency VT | 341 | 248 | 155 | 124 | 91 | 57 | 50 | 37 | 23 |
| Width of dominant frequency ML | 265 | 166 | 66 | 97 | 61 | 25 | 39 | 25 | 11 |
| Width of dominant frequency AP | 343 | 250 | 156 | 125 | 91 | 57 | 50 | 37 | 24 |
| Percentage of power <0.7 hz VT | 258 | 159 | 61 | 94 | 59 | 23 | 38 | 24 | 10 |
| Percentage of power <0.7 hz ML | 254 | 154 | 54 | 93 | 57 | 21 | 37 | 23 | 9 |
| Percentage of power <0.7 hz AP | 260 | 167 | 74 | 95 | 61 | 28 | 38 | 25 | 12 |
| Index of harmonicity VT | 260 | 157 | 54 | 95 | 58 | 21 | 38 | 24 | 9 |
| Index of harmonicity ML | 253 | 152 | 51 | 92 | 56 | 20 | 37 | 23 | 9 |
| Index of harmonicity AP | 262 | 162 | 62 | 95 | 59 | 24 | 38 | 24 | 10 |
| Harmonic ratio VT | 262 | 162 | 63 | 96 | 60 | 24 | 39 | 25 | 11 |
| Harmonic ratio ML | 273 | 172 | 72 | 99 | 63 | 27 | 40 | 26 | 12 |
| Harmonic ratio AP | 260 | 163 | 65 | 95 | 60 | 25 | 38 | 25 | 11 |
| Local divergence rate/stride VT | 256 | 157 | 59 | 93 | 58 | 23 | 38 | 24 | 10 |
| Local divergence rate/stride ML | 274 | 174 | 73 | 100 | 64 | 28 | 40 | 26 | 12 |
| Local divergence rate/stride AP | 261 | 164 | 66 | 95 | 60 | 25 | 38 | 25 | 11 |
| Sample entropy VT | 253 | 152 | 52 | 92 | 56 | 20 | 37 | 23 | 9 |
| Sample entropy ML | 253 | 153 | 53 | 92 | 56 | 20 | 37 | 23 | 9 |
| Sample entropy AP | 310 | 210 | 110 | 113 | 77 | 41 | 45 | 31 | 17 |
References
- Gillespie, L.D.; Robertson, M.C.; Gillespie, W.J.; Sherrington, C.; Gates, S.; Clemson, L.M.; Lamb, S.E. Interventions for preventing falls in older people living in the community. Cochrane Database Syst. Rev. 2012, 9, CD007146. [Google Scholar] [CrossRef] [PubMed]
- Cummings, S.R.; Nevitt, M.C.; Kidd, S. Forgetting falls: The limited accuracy of recall of falls in the elderly. J. Am. Geriatr. Soc. 1988, 36, 613–616. [Google Scholar] [CrossRef] [PubMed]
- Lamb, S.E.; Jorstad-Stein, E.C.; Hauer, K.; Becker, C. Development of a common outcome data set for fall injury prevention trials: The Prevention of Falls Network Europe consensus. J. Am. Geriatr. Soc. 2005, 53, 1618–1622. [Google Scholar] [CrossRef] [PubMed]
- Gregg, E.W.; Pereira, M.A.; Caspersen, C.J. Physical activity, falls, and fractures among older adults: A review of the epidemiologic evidence. J. Am. Geriatr. Soc. 2000, 48, 883–893. [Google Scholar] [CrossRef] [PubMed]
- Connell, B.R.; Wolf, S.L. Environmental and behavioral circumstances associated with falls at home among healthy elderly individuals. Arch. Phys. Med. Rehabil. 1997, 78, 179–186. [Google Scholar] [CrossRef]
- Van Ancum, J.M.; van Schooten, K.S.; Jonkman, N.H.; Huijben, B.; van Lummel, R.C.; Meskers, C.G.; Maier, A.B.; Pijnappels, M. Gait speed assessed by a 4-m walk test is not representative of daily-life gait speed in community-dwelling adults. Maturitas 2019, 121, 28–34. [Google Scholar] [CrossRef] [PubMed]
- Rispens, S.M.; Van Dieën, J.H.; Van Schooten, K.S.; Lizama, L.E.C.; Daffertshofer, A.; Beek, P.J.; Pijnappels, M. Fall-related gait characteristics on the treadmill and in daily life. J. Neuroeng. Rehabil. 2016, 13, 12. [Google Scholar] [CrossRef] [PubMed]
- Rispens, S.M.; van Schooten, K.S.; Pijnappels, M.; Daffertshofer, A.; Beek, P.J.; van Dieen, J.H. Do extreme values of daily-life gait characteristics provide more information about fall risk than median values? JMIR Res. Protoc. 2015, 4, e4. [Google Scholar] [CrossRef]
- Weiss, A.; Brozgol, M.; Dorfman, M.; Herman, T.; Shema, S.; Giladi, N.; Hausdorff, J.M. Does the evaluation of gait quality during daily life provide insight into fall risk? A novel approach using 3-day accelerometer recordings. Neurorehabil. Neural Repair 2013, 27, 742–752. [Google Scholar] [CrossRef]
- Van Schooten, K.S.; Pijnappels, M.; Rispens, S.M.; Elders, P.J.; Lips, P.; Daffertshofer, A.; Beek, P.J.; van Dieen, J.H. Daily-life gait quality as predictor of falls in older people: A 1-year prospective cohort study. PLoS ONE 2016, 11, e0158623. [Google Scholar] [CrossRef]
- Van Schooten, K.S.; Pijnappels, M.; Rispens, S.M.; Elders, P.J.; Lips, P.; van Dieen, J.H. Ambulatory fall-risk assessment: Amount and quality of daily-life gait predict falls in older adults. J. Gerontol. A Biol. Sci. Med. Sci. 2015, 70, 608–615. [Google Scholar] [CrossRef] [PubMed]
- Helbostad, J.L.; Leirfall, S.; Moe-Nilssen, R.; Sletvold, O. Physical fatigue affects gait characteristics in older persons. J. Gerontol. A Biol. Sci. Med. Sci. 2007, 62, 1010–1015. [Google Scholar] [CrossRef] [PubMed]
- Manor, B.; Wolenski, P.; Guevaro, A.; Li, L. Differential effects of plantar desensitization on locomotion dynamics. J. Electromyogr. Kinesiol. 2009, 19, e320–e328. [Google Scholar] [CrossRef] [PubMed]
- Van Schooten, K.S.; Sloot, L.H.; Bruijn, S.M.; Kingma, H.; Meijer, O.G.; Pijnappels, M.; van Dieen, J.H. Sensitivity of trunk variability and stability measures to balance impairments induced by galvanic vestibular stimulation during gait. Gait Posture 2011, 33, 656–660. [Google Scholar] [CrossRef] [PubMed]
- Hamacher, D.; Hamacher, D.; Rehfeld, K.; Schega, L.J.C.B. Motor-cognitive dual-task training improves local dynamic stability of normal walking in older individuals. Clin. Biomech. 2016, 32, 138–141. [Google Scholar] [CrossRef] [PubMed]
- Henderson, E.J.; Lord, S.R.; Brodie, M.A.; Gaunt, D.M.; Lawrence, A.D.; Close, J.C.; Whone, A.L.; Ben-Shlomo, Y. Rivastigmine for gait stability in patients with Parkinson’s disease (ReSPonD): A randomised, double-blind, placebo-controlled, phase 2 trial. Lancet Neurol. 2016, 15, 249–258. [Google Scholar] [CrossRef]
- Folstein, M.F.; Folstein, S.E.; McHugh, P.R. Mini-mental state. J. Psychiatr. Res. 1975, 12, 189–198. [Google Scholar] [CrossRef]
- Dijkstra, B.; Kamsma, Y.; Zijlstra, W. Detection of gait and postures using a miniaturised triaxial accelerometer-based system: Accuracy in community-dwelling older adults. Age Ageing 2010, 39, 259–262. [Google Scholar] [CrossRef]
- Van Schooten, K.S.; Rispens, S.M.; Elders, P.J.; Lips, P.; van Dieen, J.H.; Pijnappels, M. Assessing Physical Activity in Older Adults: Required Days of Trunk Accelerometer Measurements for Reliable Estimation. JAPA 2015, 23, 9–17. [Google Scholar] [CrossRef]
- Toebes, M.J.; Hoozemans, M.J.; Mathiassen, S.E.; Dekker, J.; van Dieen, J.H. Measurement strategy and statistical power in studies assessing gait stability and variability in older adults. Ageing Clin. Exp. Res. 2016, 28, 257–265. [Google Scholar] [CrossRef]
- Van Schooten, K.S.; Rispens, S.M.; Pijnappels, M.; Daffertshofer, A.; van Dieen, J.H. Assessing gait stability: The influence of state space reconstruction on inter- and intra-day reliability of local dynamic stability during over-ground walking. J. Biomech. 2013, 46, 137–141. [Google Scholar] [CrossRef] [PubMed]


| p | r | Mean | s2BS | s2WS | s2E | |
|---|---|---|---|---|---|---|
| Gait quality composite score | 0.64 | 0.81 | 0.51369 | 0.54700 | 0.08068 | 0.05759 |
| Walking speed | 0.39 | 0.93 | 0.45073 | 0.01030 | 0.00027 | 0.00036 |
| Stride frequency | 0.51 | 0.95 | 0.82482 | 0.01119 | 0.00013 | 0.00030 |
| Standard deviation VT | 0.77 | 0.92 | 1.32658 | 0.17858 | 0.00061 | 0.00733 |
| Standard deviation ML | 0.18 | 0.94 | 1.16407 | 0.09332 | 0.00560 | 0.00305 |
| Range AP | 0.40 | 0.91 | 7.33318 | 7.13497 | 0.23150 | 0.32894 |
| Stride autocorrelation VT | 0.54 | 0.82 | 0.37464 | 0.01051 | 0.00040 | 0.00103 |
| Stride autocorrelation AP | 0.63 | 0.83 | 0.32881 | 0.00945 | 0.00021 | 0.00088 |
| Amplitude of dominant frequency VT | 0.68 | 0.93 | 0.49412 | 0.04264 | 0.00026 | 0.00155 |
| Amplitude of dominant frequency ML | 1.00 | 0.91 | 0.47481 | 0.05827 | 9.26 × 10⁻⁹ | 0.00263 |
| Amplitude of dominant frequency AP | 0.11 | 0.85 | 0.51044 | 0.02357 | 0.00501 | 0.00198 |
| Width of dominant frequency AP | 0.14 | 0.80 | 0.75841 | 0.00611 | 0.00167 | 0.00075 |
| Index of harmonicity VT | 0.19 | 0.96 | 0.62043 | 0.04940 | 0.00156 | 0.00092 |
| Index of harmonicity ML | 0.68 | 0.92 | 0.64420 | 0.06977 | 0.00048 | 0.00276 |
| Harmonic ratio VT | 0.47 | 0.90 | 1.53576 | 0.07348 | 0.00211 | 0.00406 |
| Local divergence rate/stride VT | 0.75 | 0.87 | 2.11436 | 0.13693 | 0.00097 | 0.00919 |
| Local divergence rate/stride AP | 0.58 | 0.86 | 2.19507 | 0.09652 | 0.00217 | 0.00707 |
| Sample entropy ML | 0.74 | 0.91 | 0.31207 | 0.00394 | 2.07 × 10⁻⁵ | 0.00018 |
| Small Effect | Medium Effect | Large Effect | |||||||
|---|---|---|---|---|---|---|---|---|---|
| Cohen’s d = 0.3 | Cohen’s d = 0.5 | Cohen’s d = 0.8 | |||||||
| r = 0.3 | r = 0.6 | r = 0.9 | r = 0.3 | r = 0.6 | r = 0.9 | r = 0.3 | r = 0.6 | r = 0.9 | |
| Gait quality composite score | 303 | 208 | 114 | 110 | 76 | 42 | 44 | 31 | 18 |
| Walking speed | 259 | 158 | 56 | 95 | 58 | 22 | 38 | 24 | 10 |
| Stride frequency | 254 | 151 | 49 | 93 | 56 | 19 | 37 | 23 | 9 |
| Stride length | 251 | 148 | 44 | 92 | 54 | 17 | 37 | 22 | 8 |
| Standard deviation VT | 252 | 151 | 51 | 92 | 56 | 19 | 37 | 23 | 9 |
| Standard deviation AP | 266 | 163 | 61 | 97 | 60 | 23 | 39 | 25 | 10 |
| Range AP | 262 | 162 | 62 | 96 | 60 | 23 | 39 | 24 | 10 |
| Stride autocorrelation VT | 268 | 173 | 77 | 98 | 63 | 29 | 39 | 26 | 13 |
| Stride autocorrelation AP | 263 | 167 | 71 | 96 | 61 | 27 | 39 | 25 | 12 |
| Amplitude of dominant frequency VT | 253 | 151 | 50 | 92 | 56 | 19 | 37 | 23 | 9 |
| Amplitude of dominant frequency ML | 251 | 151 | 51 | 92 | 56 | 19 | 37 | 23 | 9 |
| Amplitude of dominant frequency AP | 323 | 227 | 130 | 118 | 83 | 48 | 47 | 34 | 20 |
| Width of dominant frequency AP | 343 | 250 | 156 | 125 | 91 | 57 | 50 | 37 | 24 |
| Index of harmonicity VT | 260 | 157 | 54 | 95 | 58 | 21 | 38 | 24 | 9 |
| Index of harmonicity ML | 253 | 152 | 51 | 92 | 56 | 20 | 37 | 23 | 9 |
| Harmonic ratio VT | 262 | 162 | 63 | 96 | 60 | 24 | 39 | 25 | 11 |
| Local divergence rate/stride VT | 256 | 157 | 59 | 93 | 58 | 23 | 38 | 24 | 10 |
| Local divergence rate/stride AP | 261 | 164 | 66 | 95 | 60 | 25 | 38 | 25 | 11 |
| Sample entropy ML | 253 | 153 | 53 | 92 | 56 | 20 | 37 | 23 | 9 |
© 2019 by the authors. Licensee MDPI, Basel, Switzerland. This article is an open access article distributed under the terms and conditions of the Creative Commons Attribution (CC BY) license (http://creativecommons.org/licenses/by/4.0/).
Share and Cite
van Schooten, K.S.; Pijnappels, M.; Lord, S.R.; van Dieën, J.H. Quality of Daily-Life Gait: Novel Outcome for Trials that Focus on Balance, Mobility, and Falls. Sensors 2019, 19, 4388. https://doi.org/10.3390/s19204388
van Schooten KS, Pijnappels M, Lord SR, van Dieën JH. Quality of Daily-Life Gait: Novel Outcome for Trials that Focus on Balance, Mobility, and Falls. Sensors. 2019; 19(20):4388. https://doi.org/10.3390/s19204388
Chicago/Turabian Stylevan Schooten, Kimberley S., Mirjam Pijnappels, Stephen R. Lord, and Jaap H. van Dieën. 2019. "Quality of Daily-Life Gait: Novel Outcome for Trials that Focus on Balance, Mobility, and Falls" Sensors 19, no. 20: 4388. https://doi.org/10.3390/s19204388
APA Stylevan Schooten, K. S., Pijnappels, M., Lord, S. R., & van Dieën, J. H. (2019). Quality of Daily-Life Gait: Novel Outcome for Trials that Focus on Balance, Mobility, and Falls. Sensors, 19(20), 4388. https://doi.org/10.3390/s19204388