Generalized Parking Occupancy Analysis Based on Dilated Convolutional Neural Network †


Abstract
1. Introduction
2. Related Work
3. Datasets
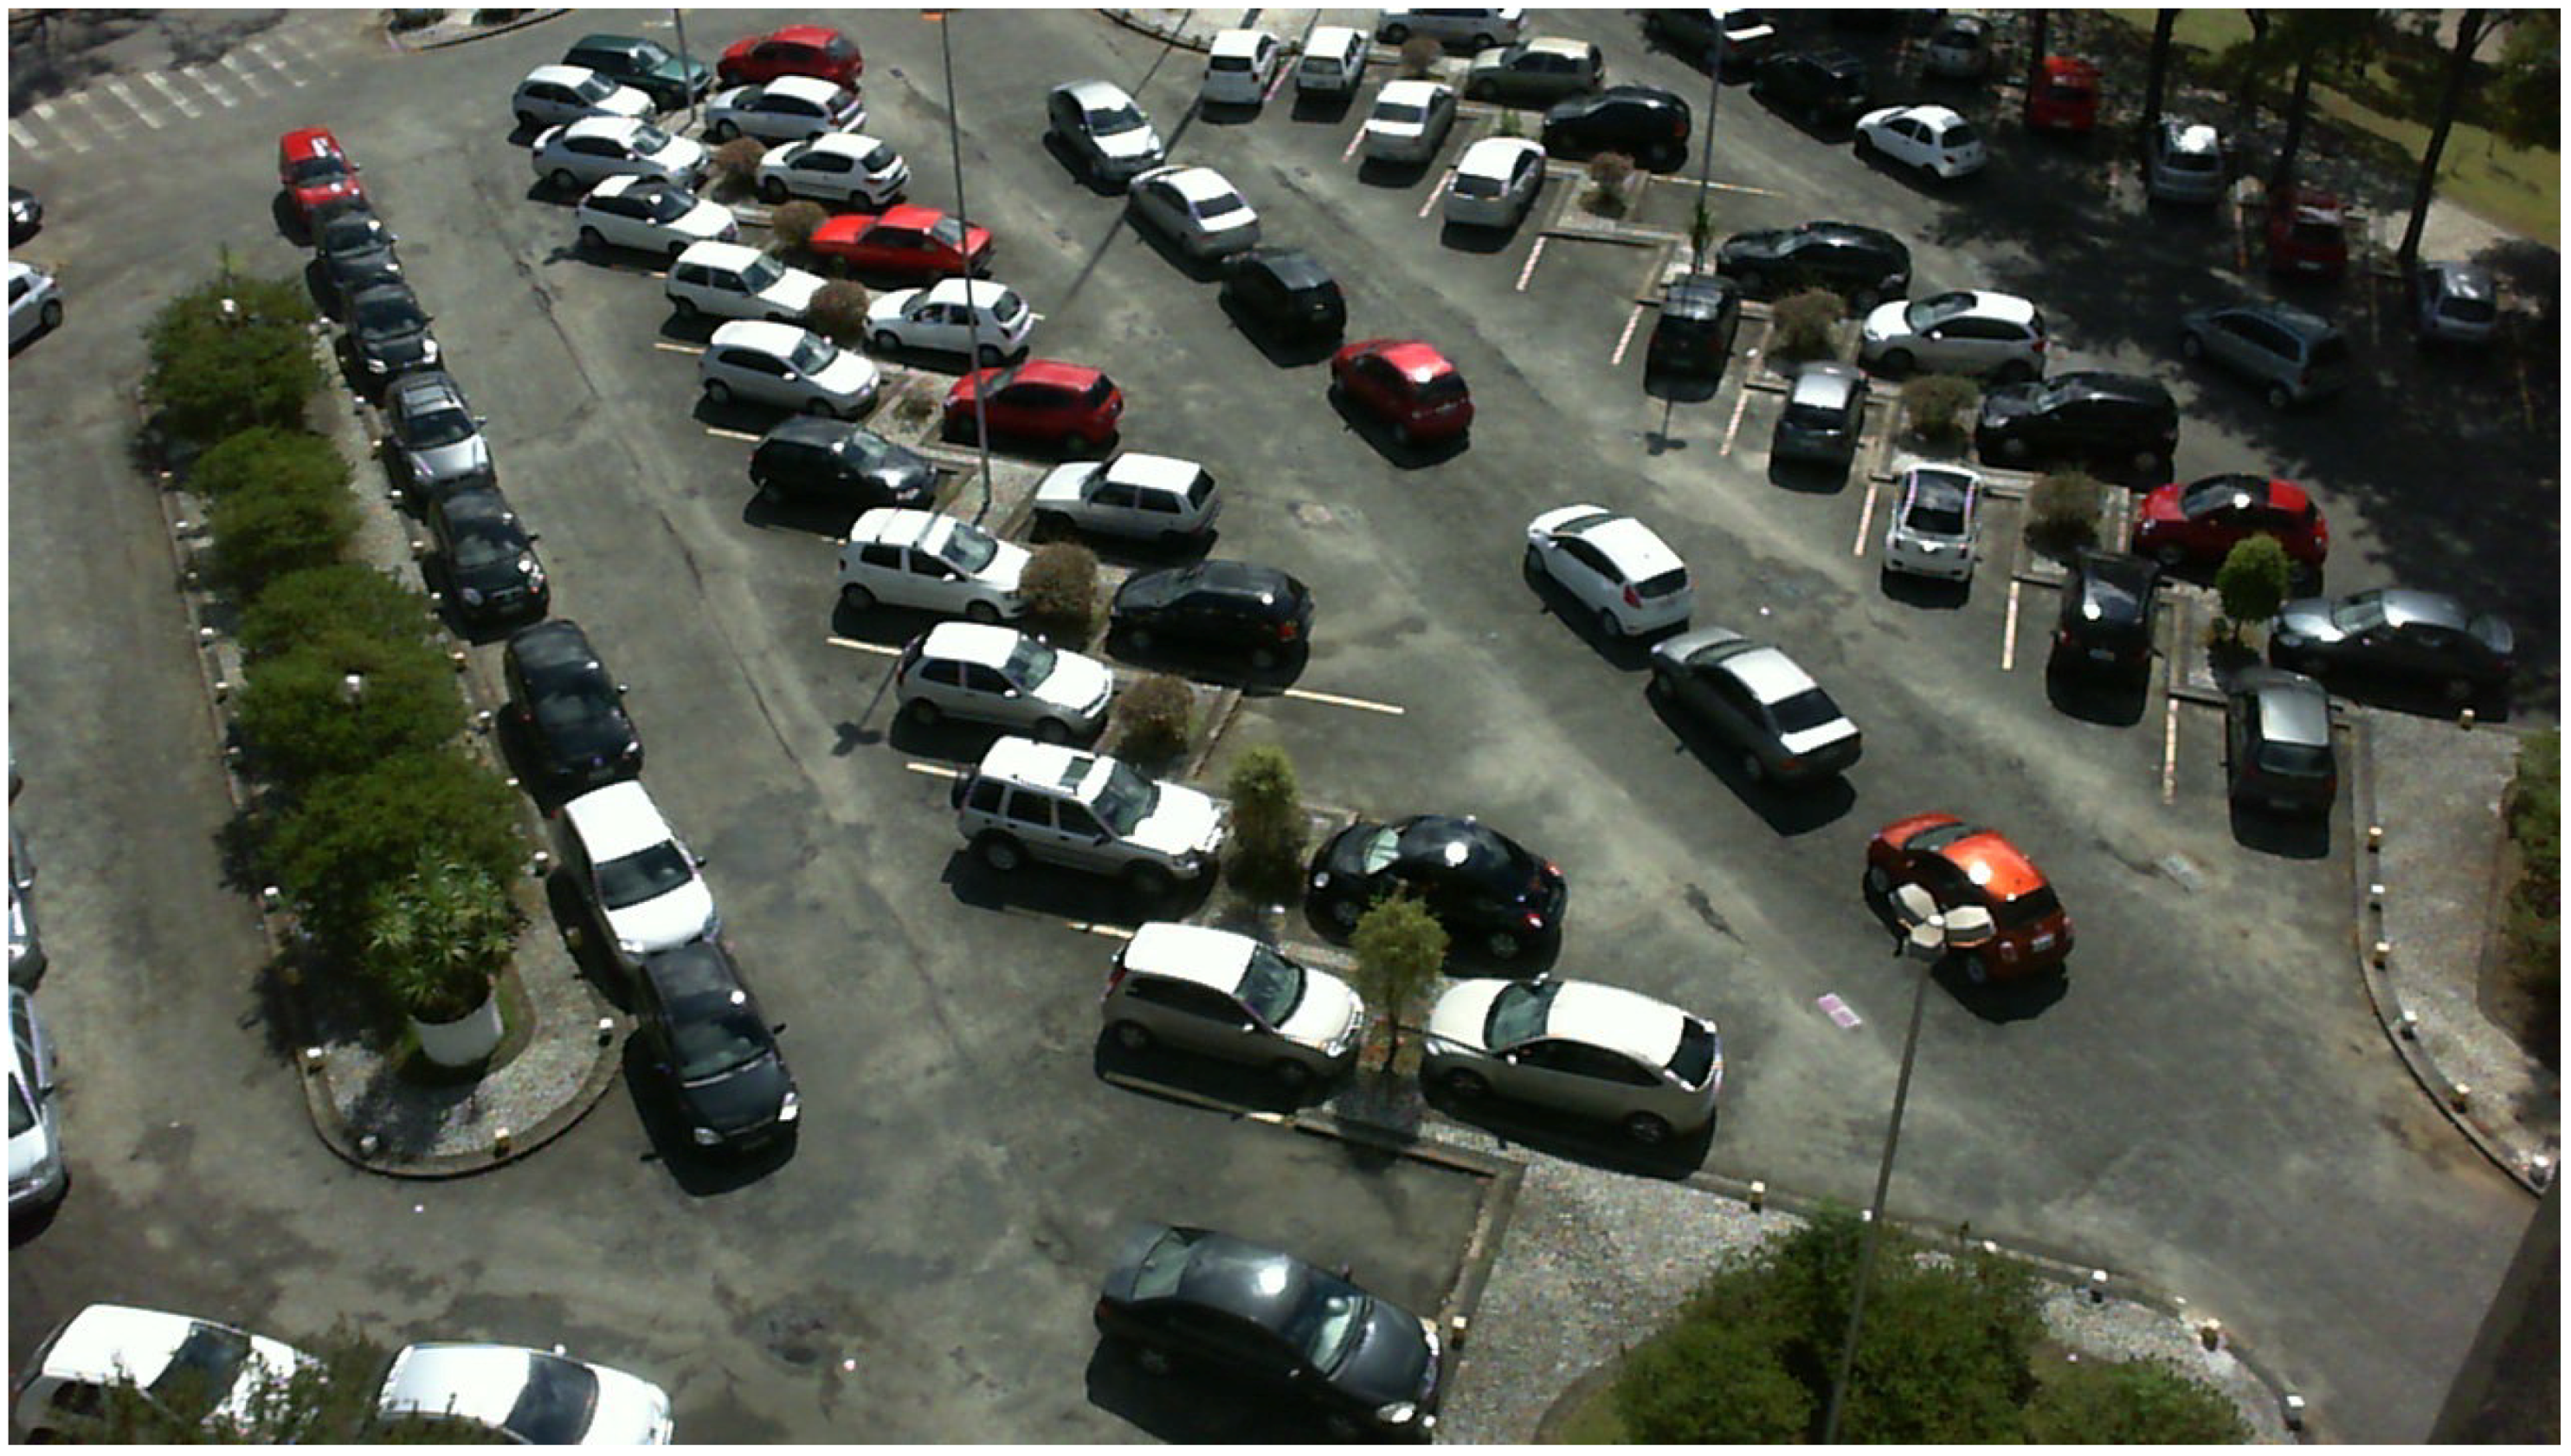
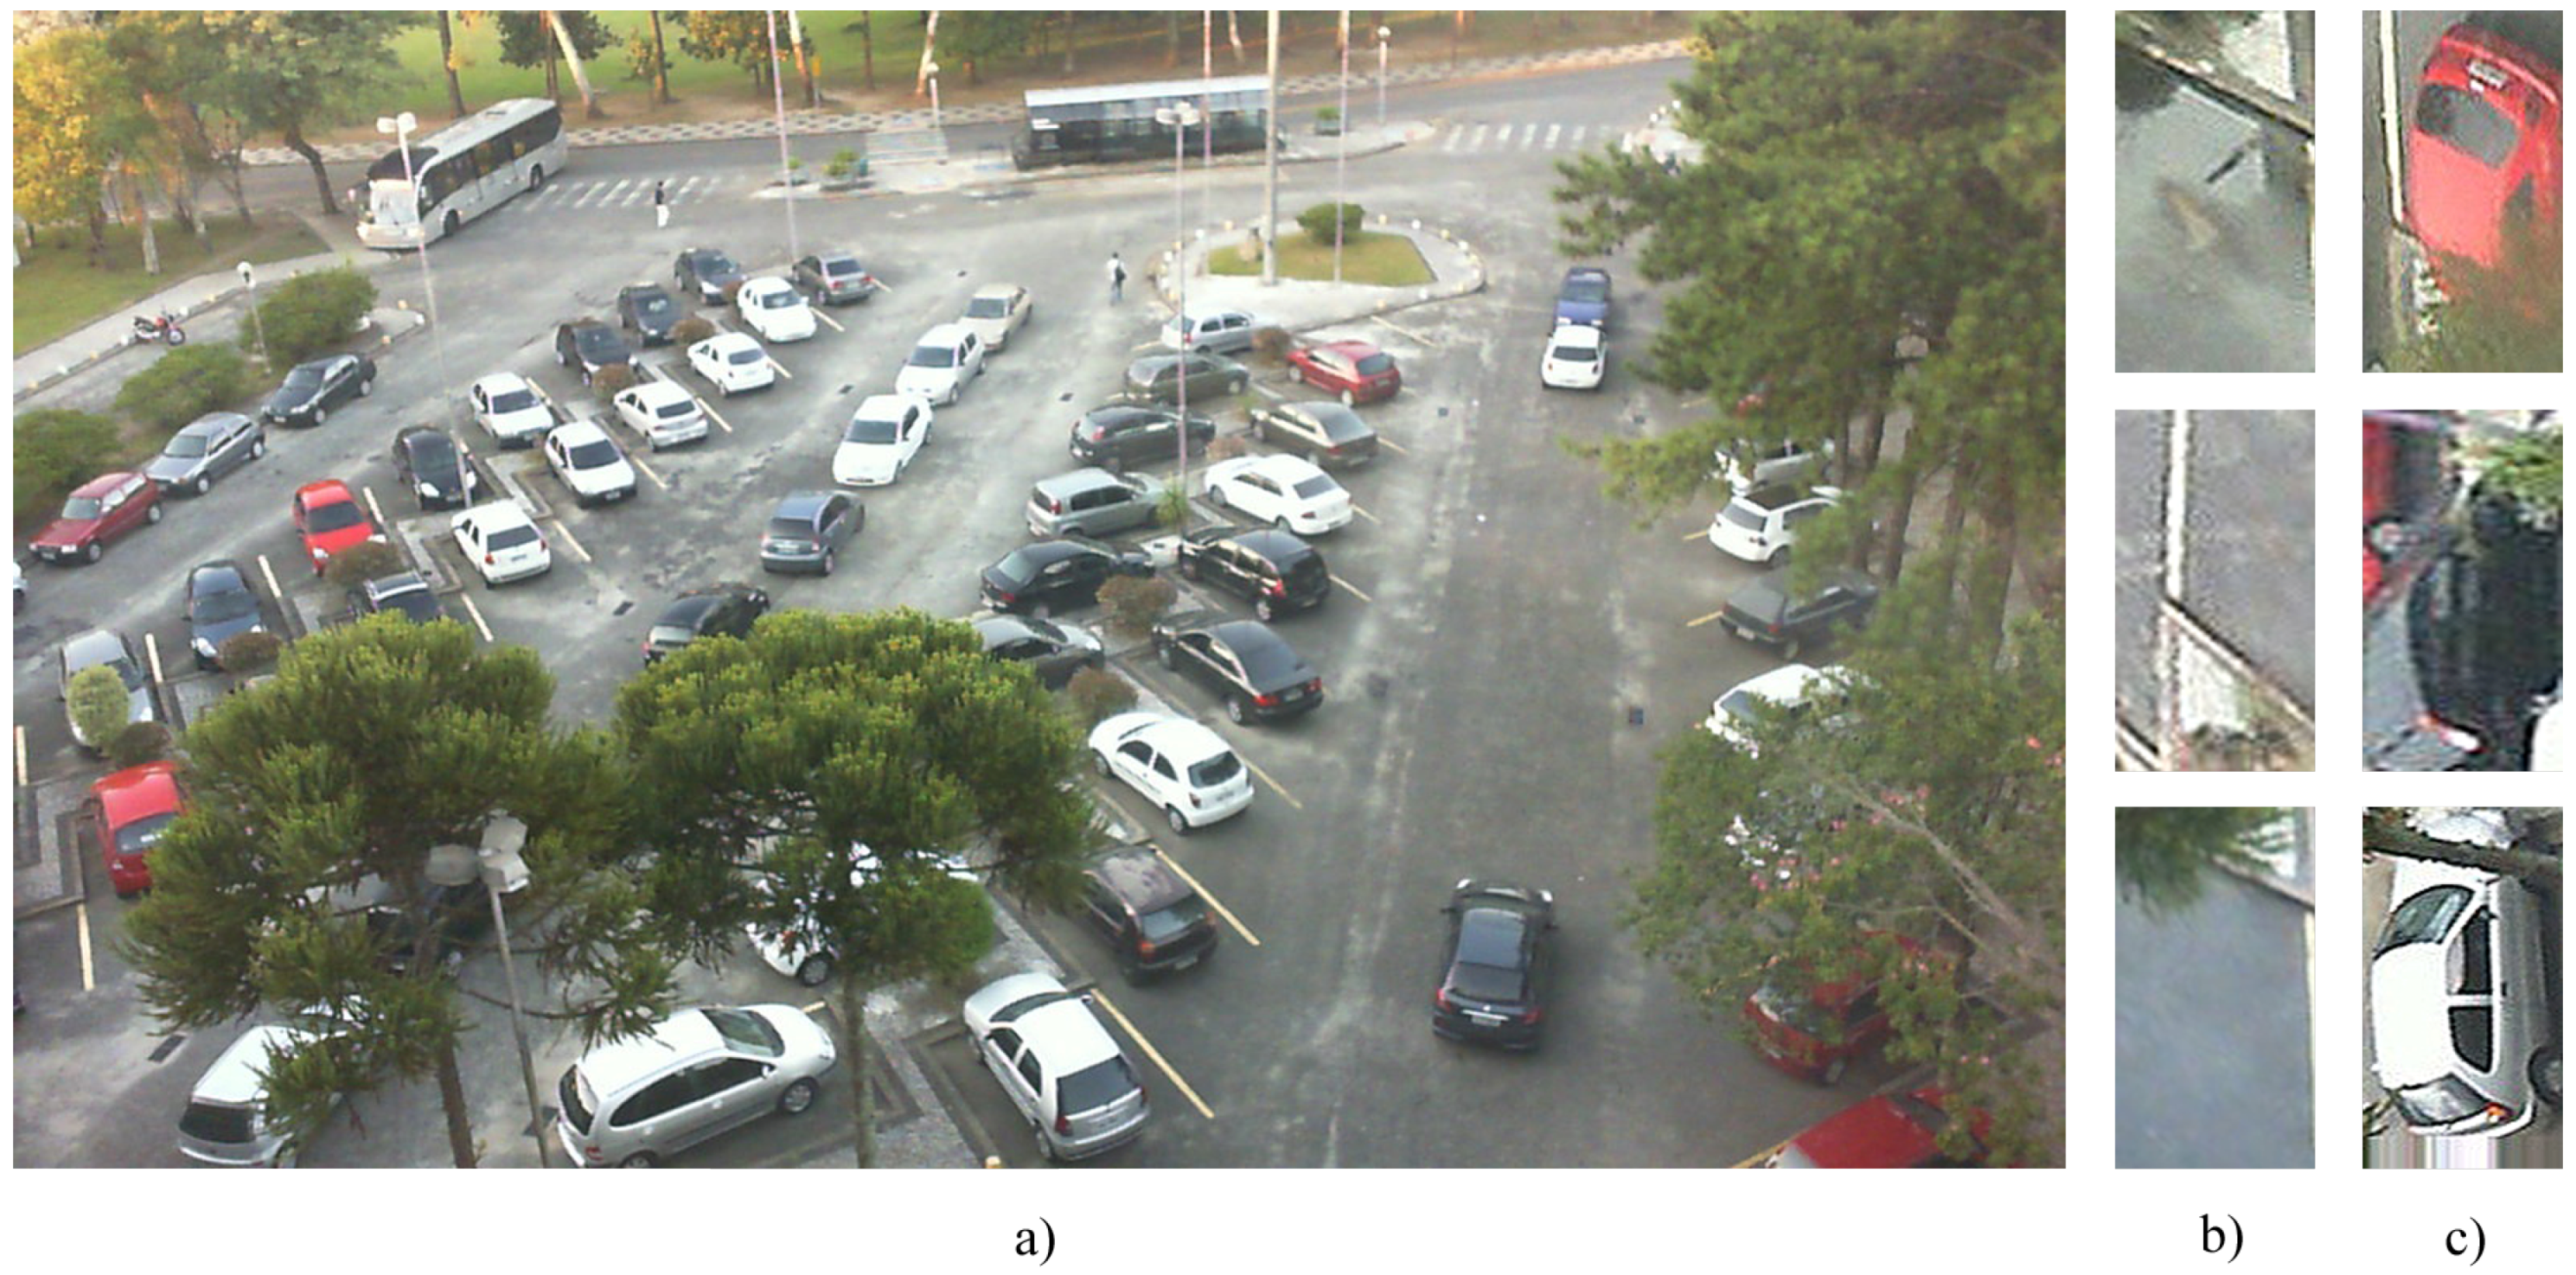
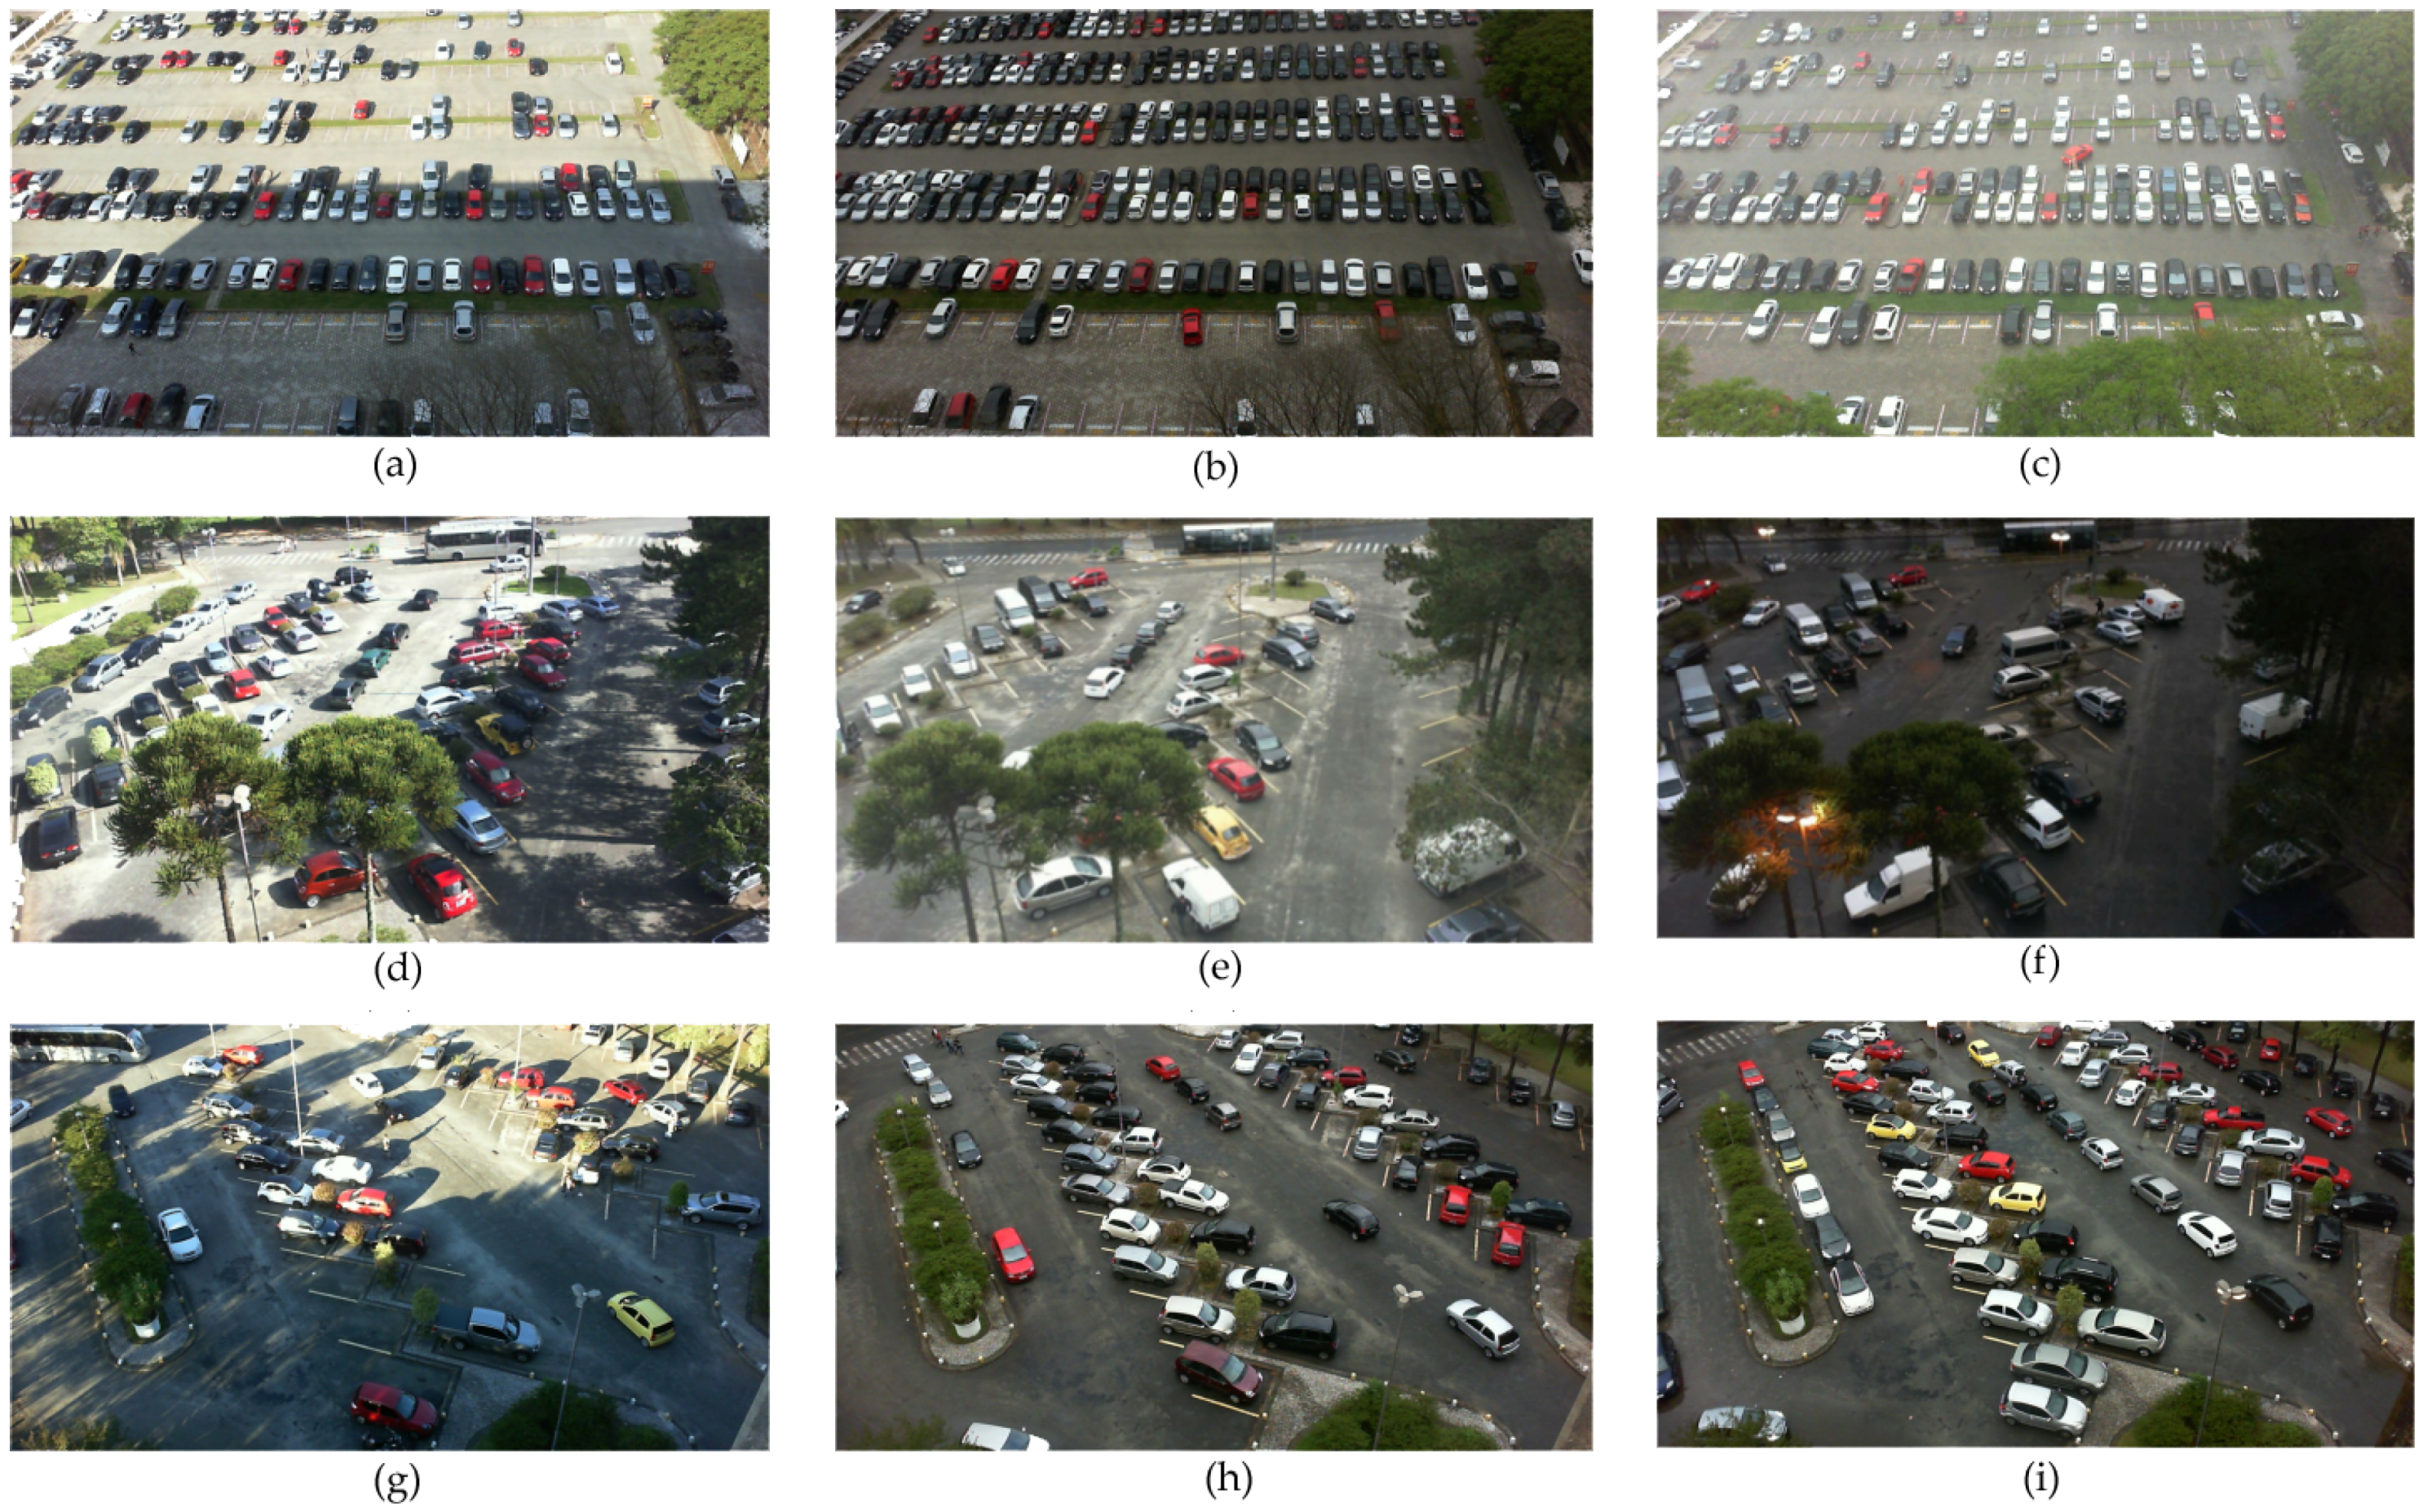
3.1. PKLot Dataset
- The captured images show various parking areas having dissimilar features.
- Generally, commercial surveillance system cameras are placed at a high above the cars, and therefore, they can observe all the vehicles in a certain parking place. However, this makes our task more challenging, and therefore, the cameras were positioned at various heights to obtain a variety of images.
- The images were captured under diverse weather conditions, such as sunny, rainy, and overcast, which represent various illumination conditions.
- Various types of challenges, such as over-exposure due to sunlight, differences in perspective, the presence of shadows, and reduced light on rainy days, are provided by the current dataset images.
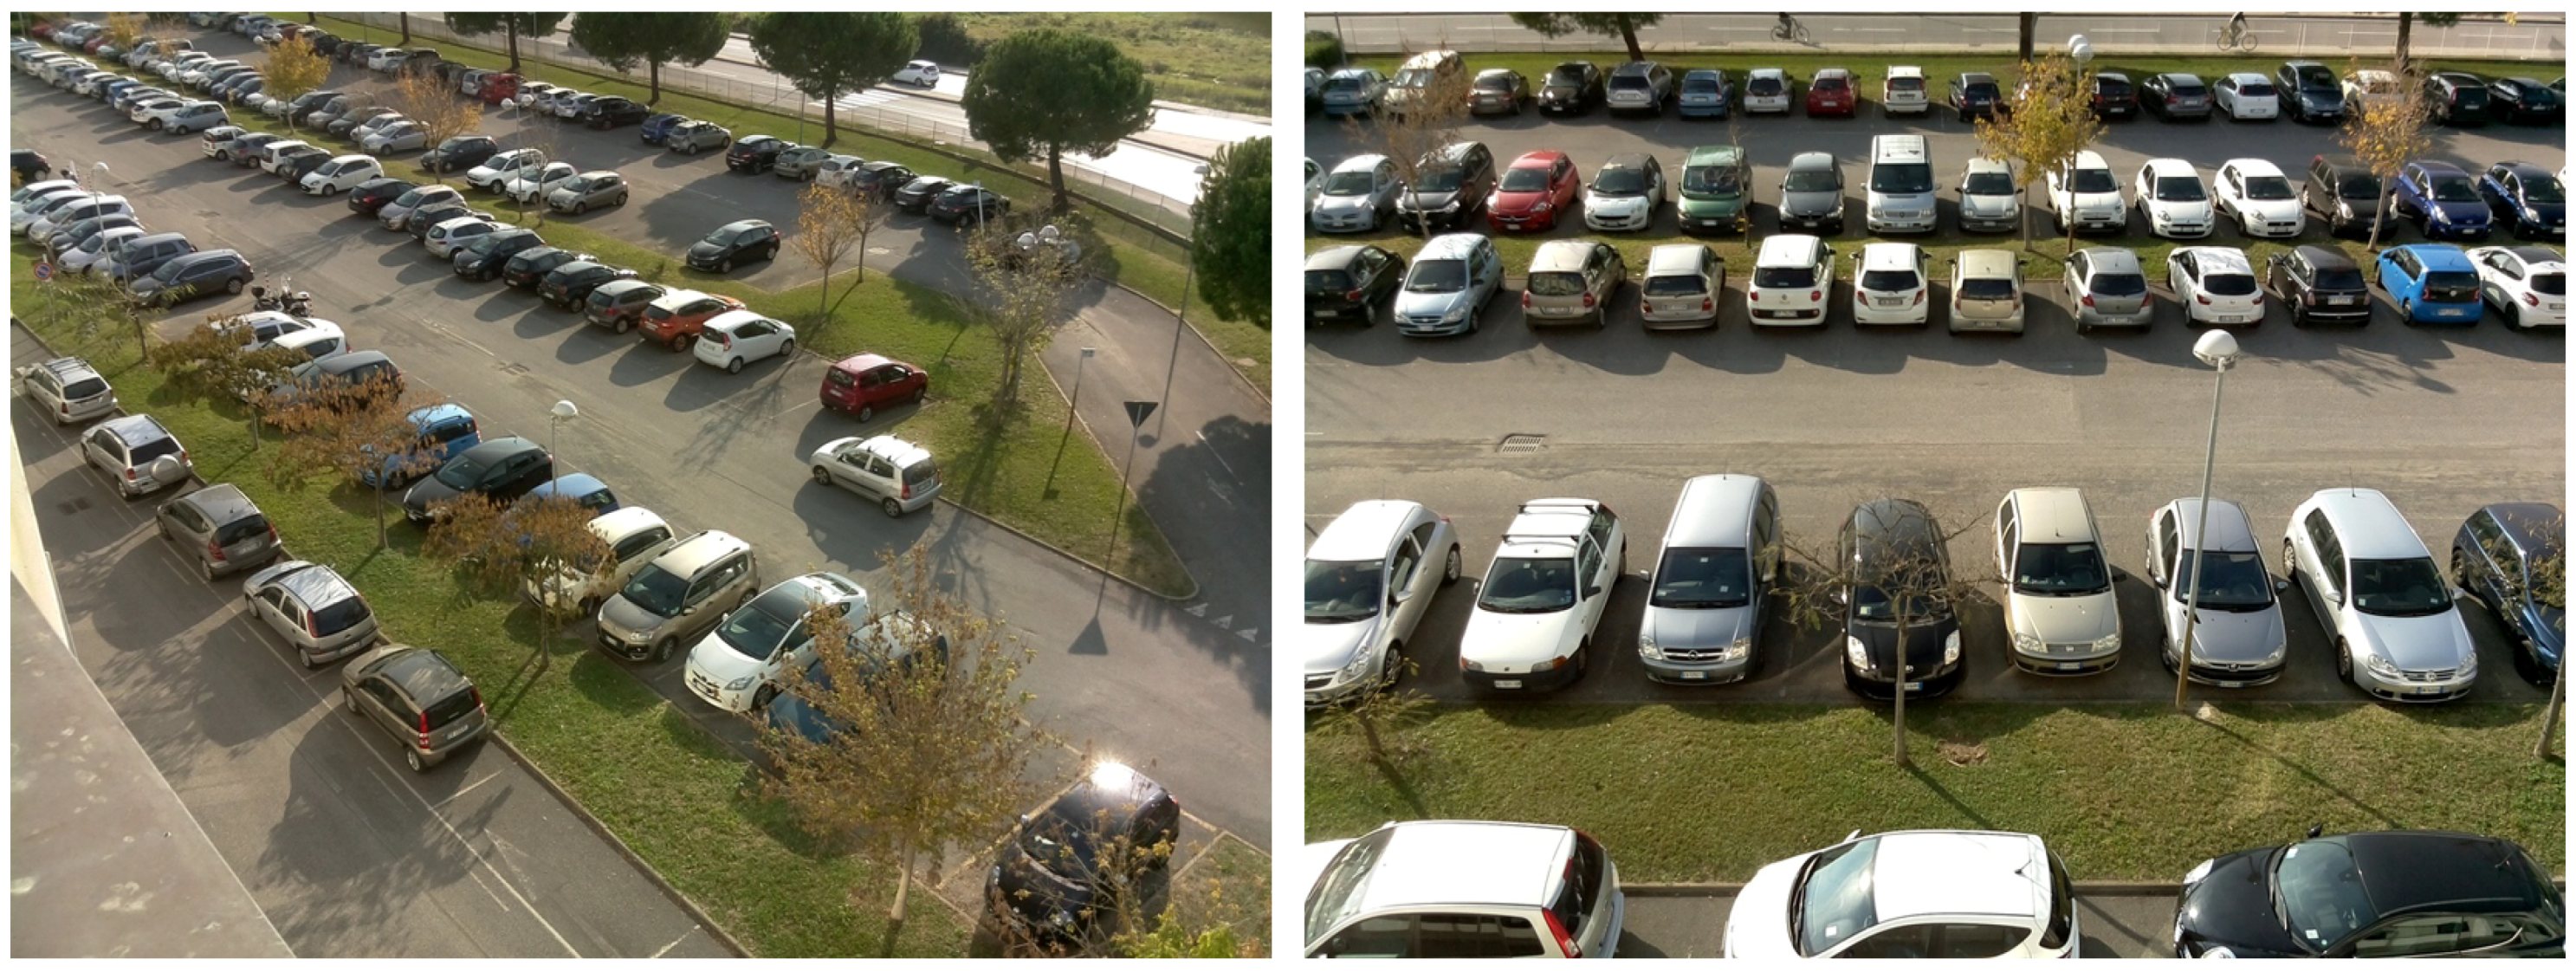
3.2. CNRPark + EXT Dataset
4. Proposed Architecture
4.1. Brief Overview of AlexNet Structure
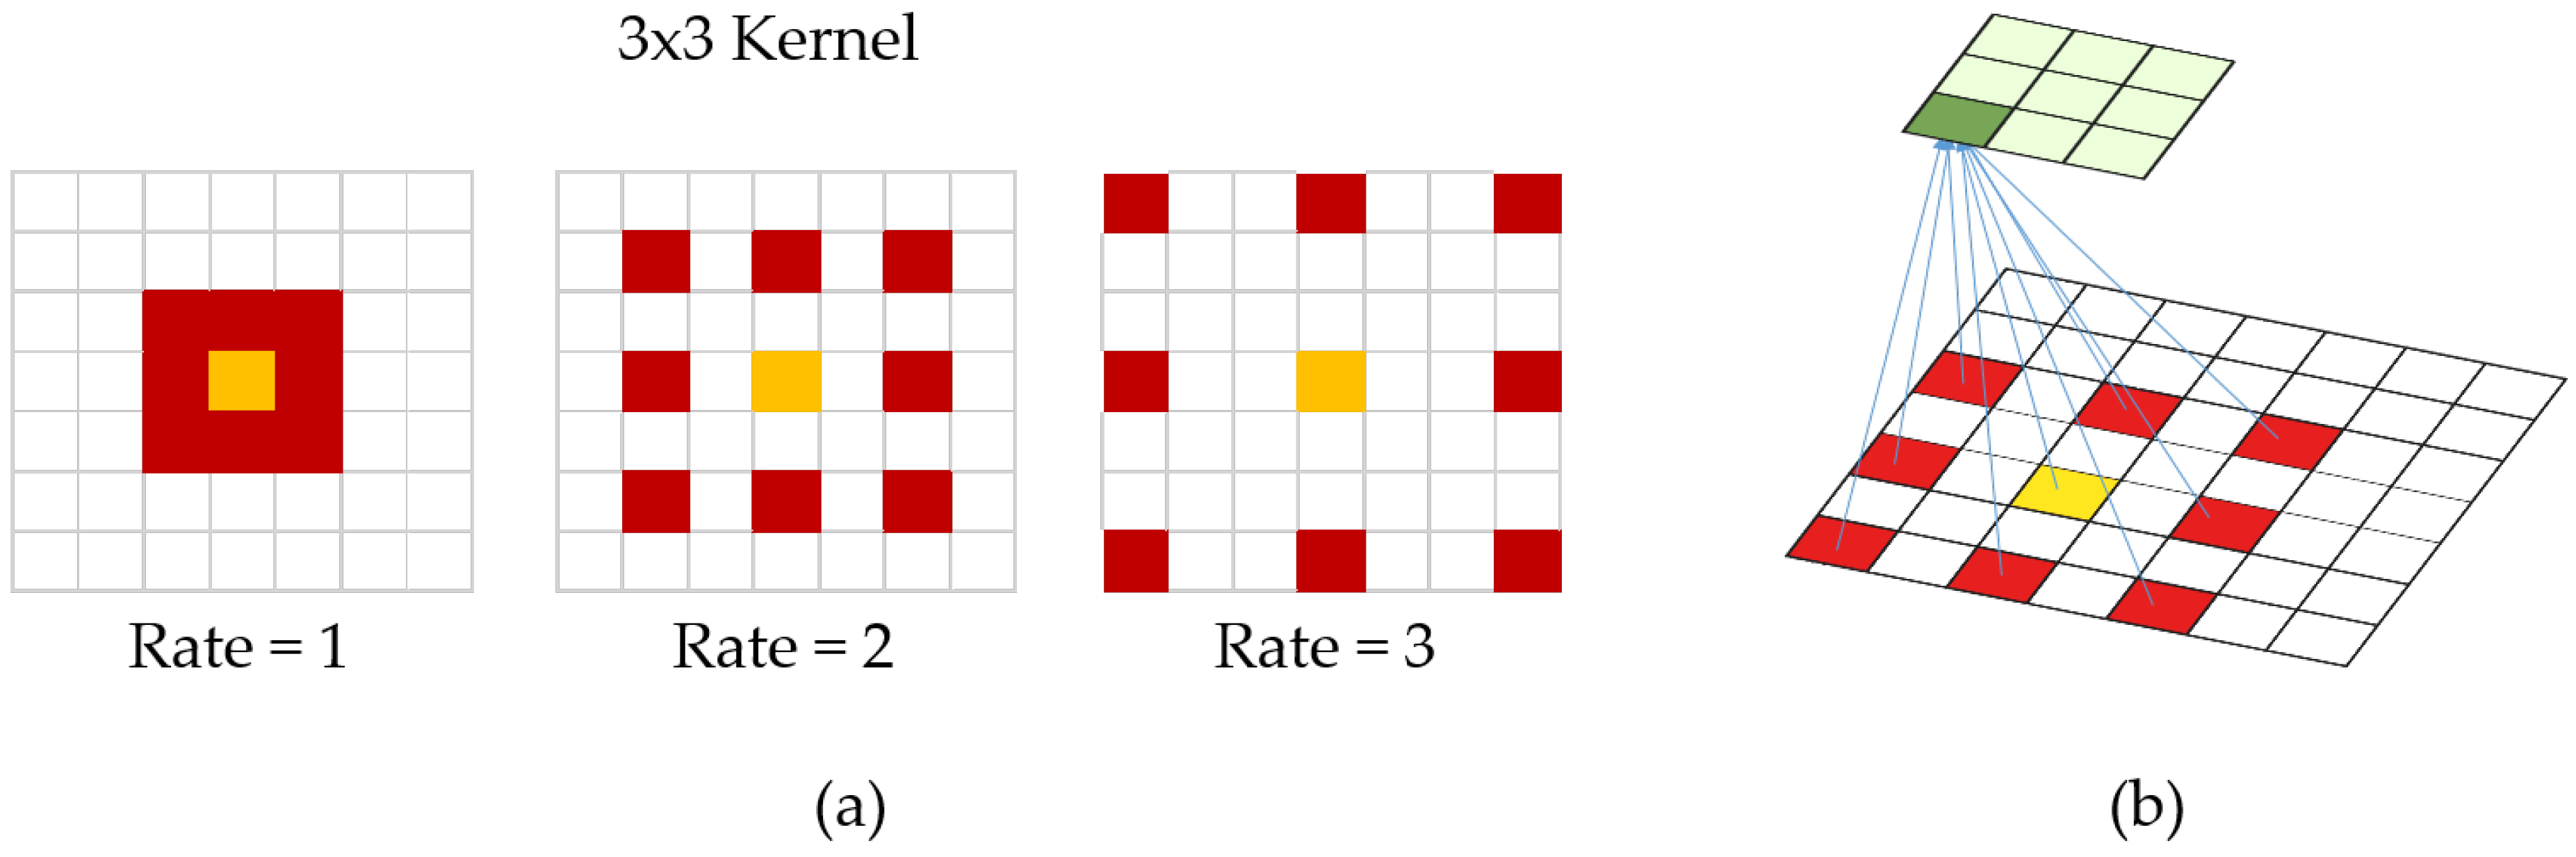
4.2. Dilated Convolution
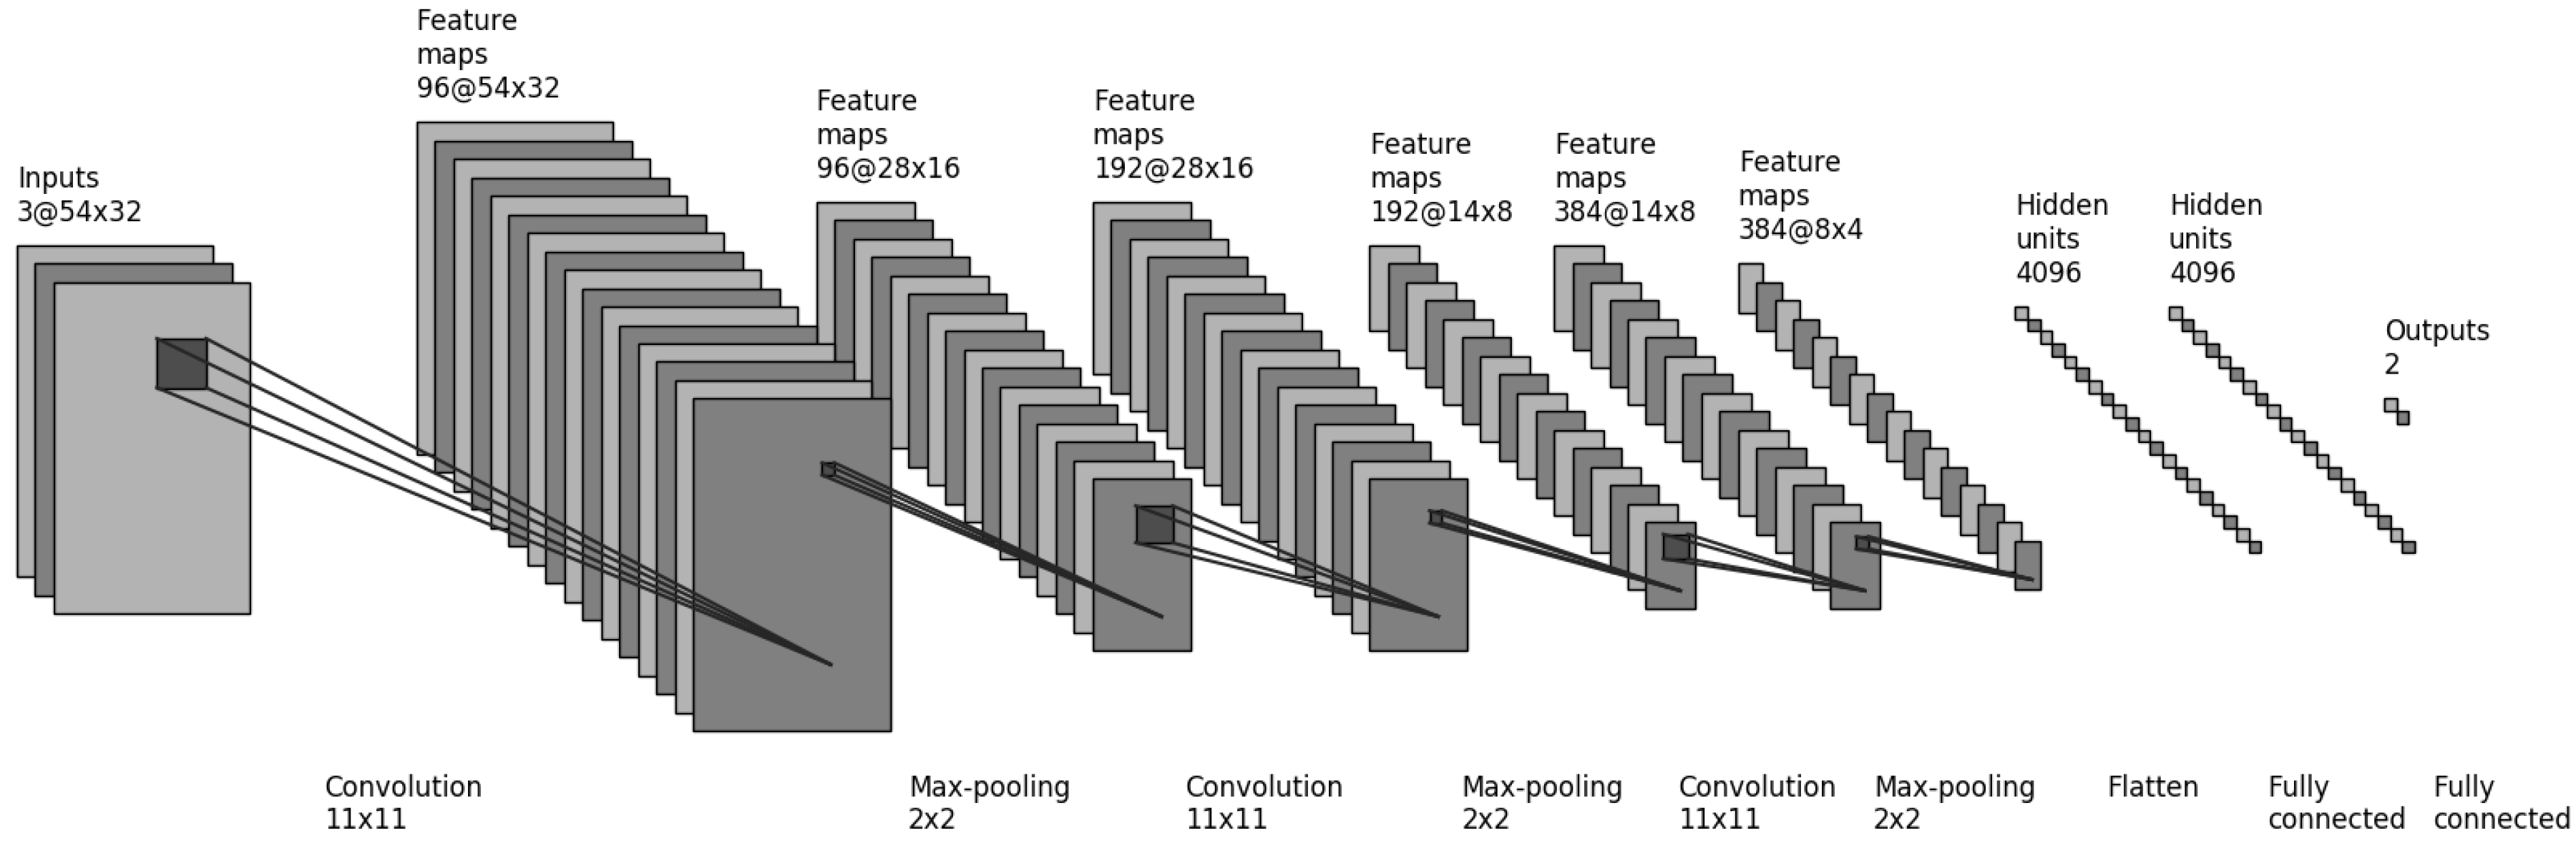
4.3. CarNet Structure
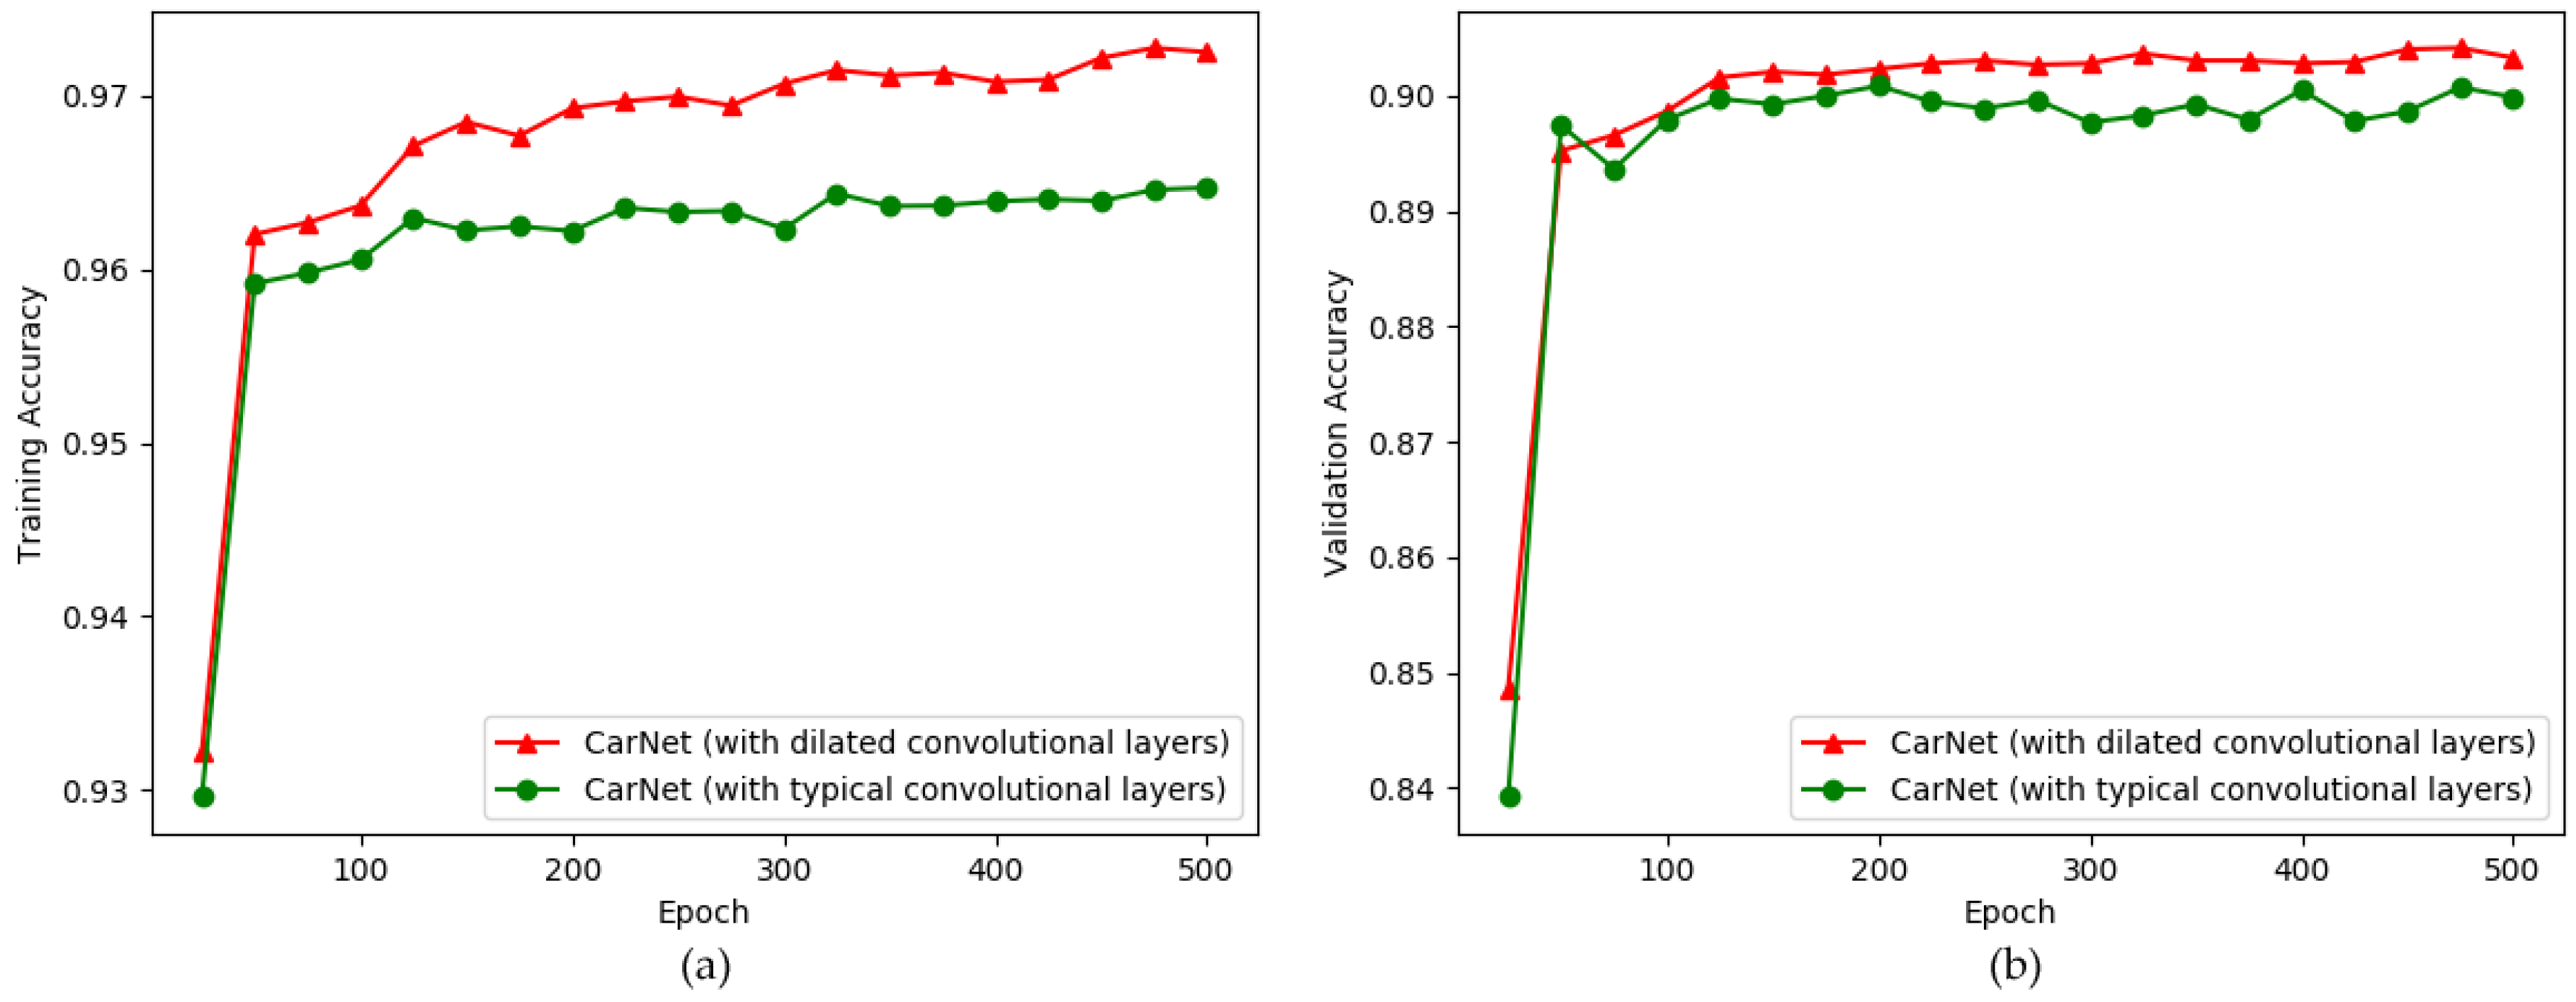
- We use dilated convolutional layers to build our architecture. A brief overview of dilated convolution is provided in Figure 6. The reason we use dilated convolution is we have to avoid learning too deep. Dilated convolution allows a model to learn large features while ignoring small ones. It resembles filtering mostly high-frequency features.
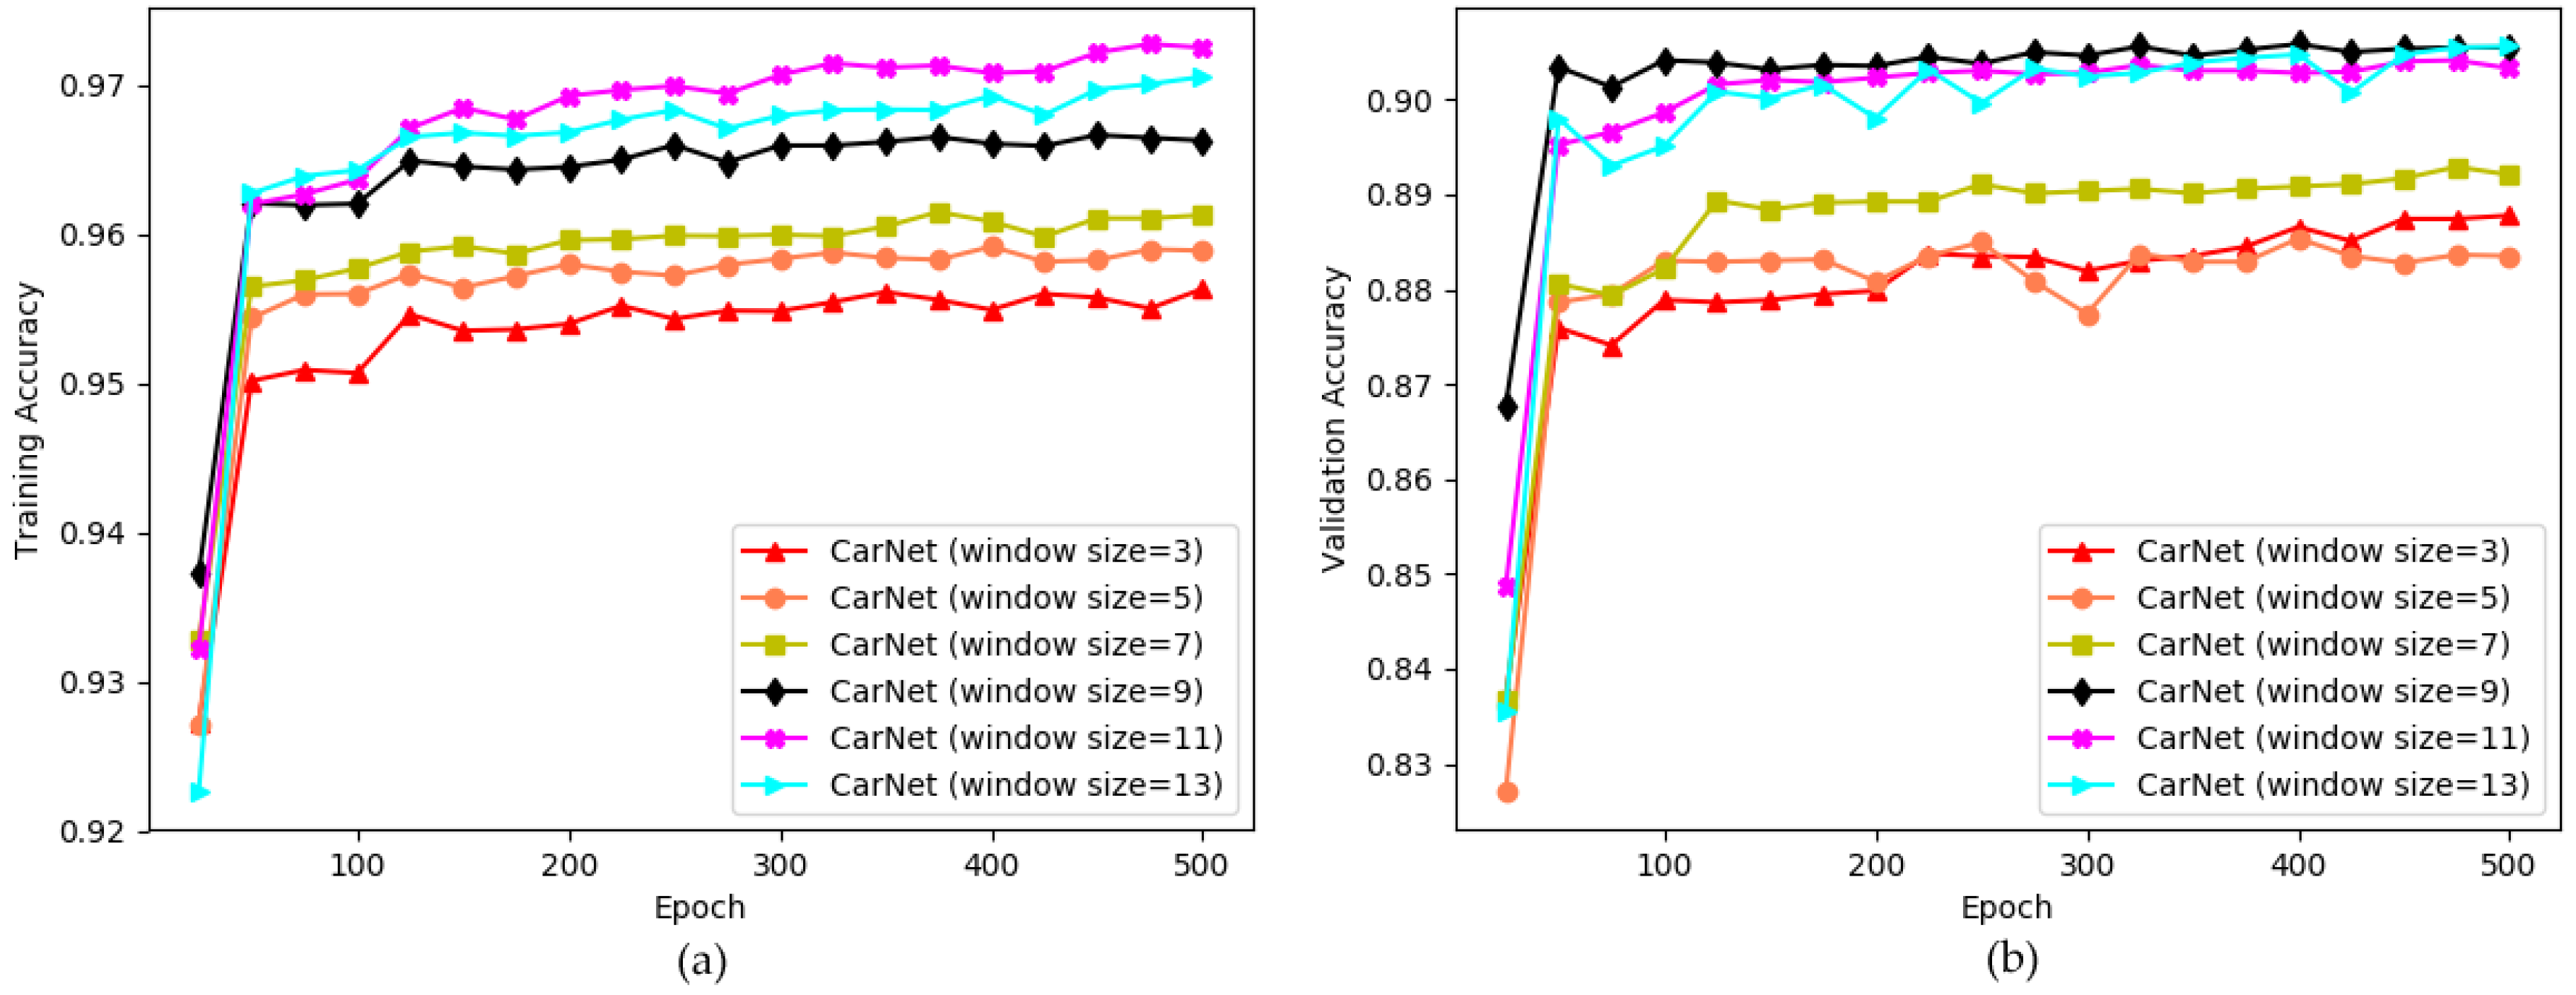
- We use large kernel sizes to learn features from parking lot images. As we know from deep learning that larger windows sizes cause larger features to be learned. In our experiments, we therefore applied a large window size. Comprehensive details are provided in the following sections.
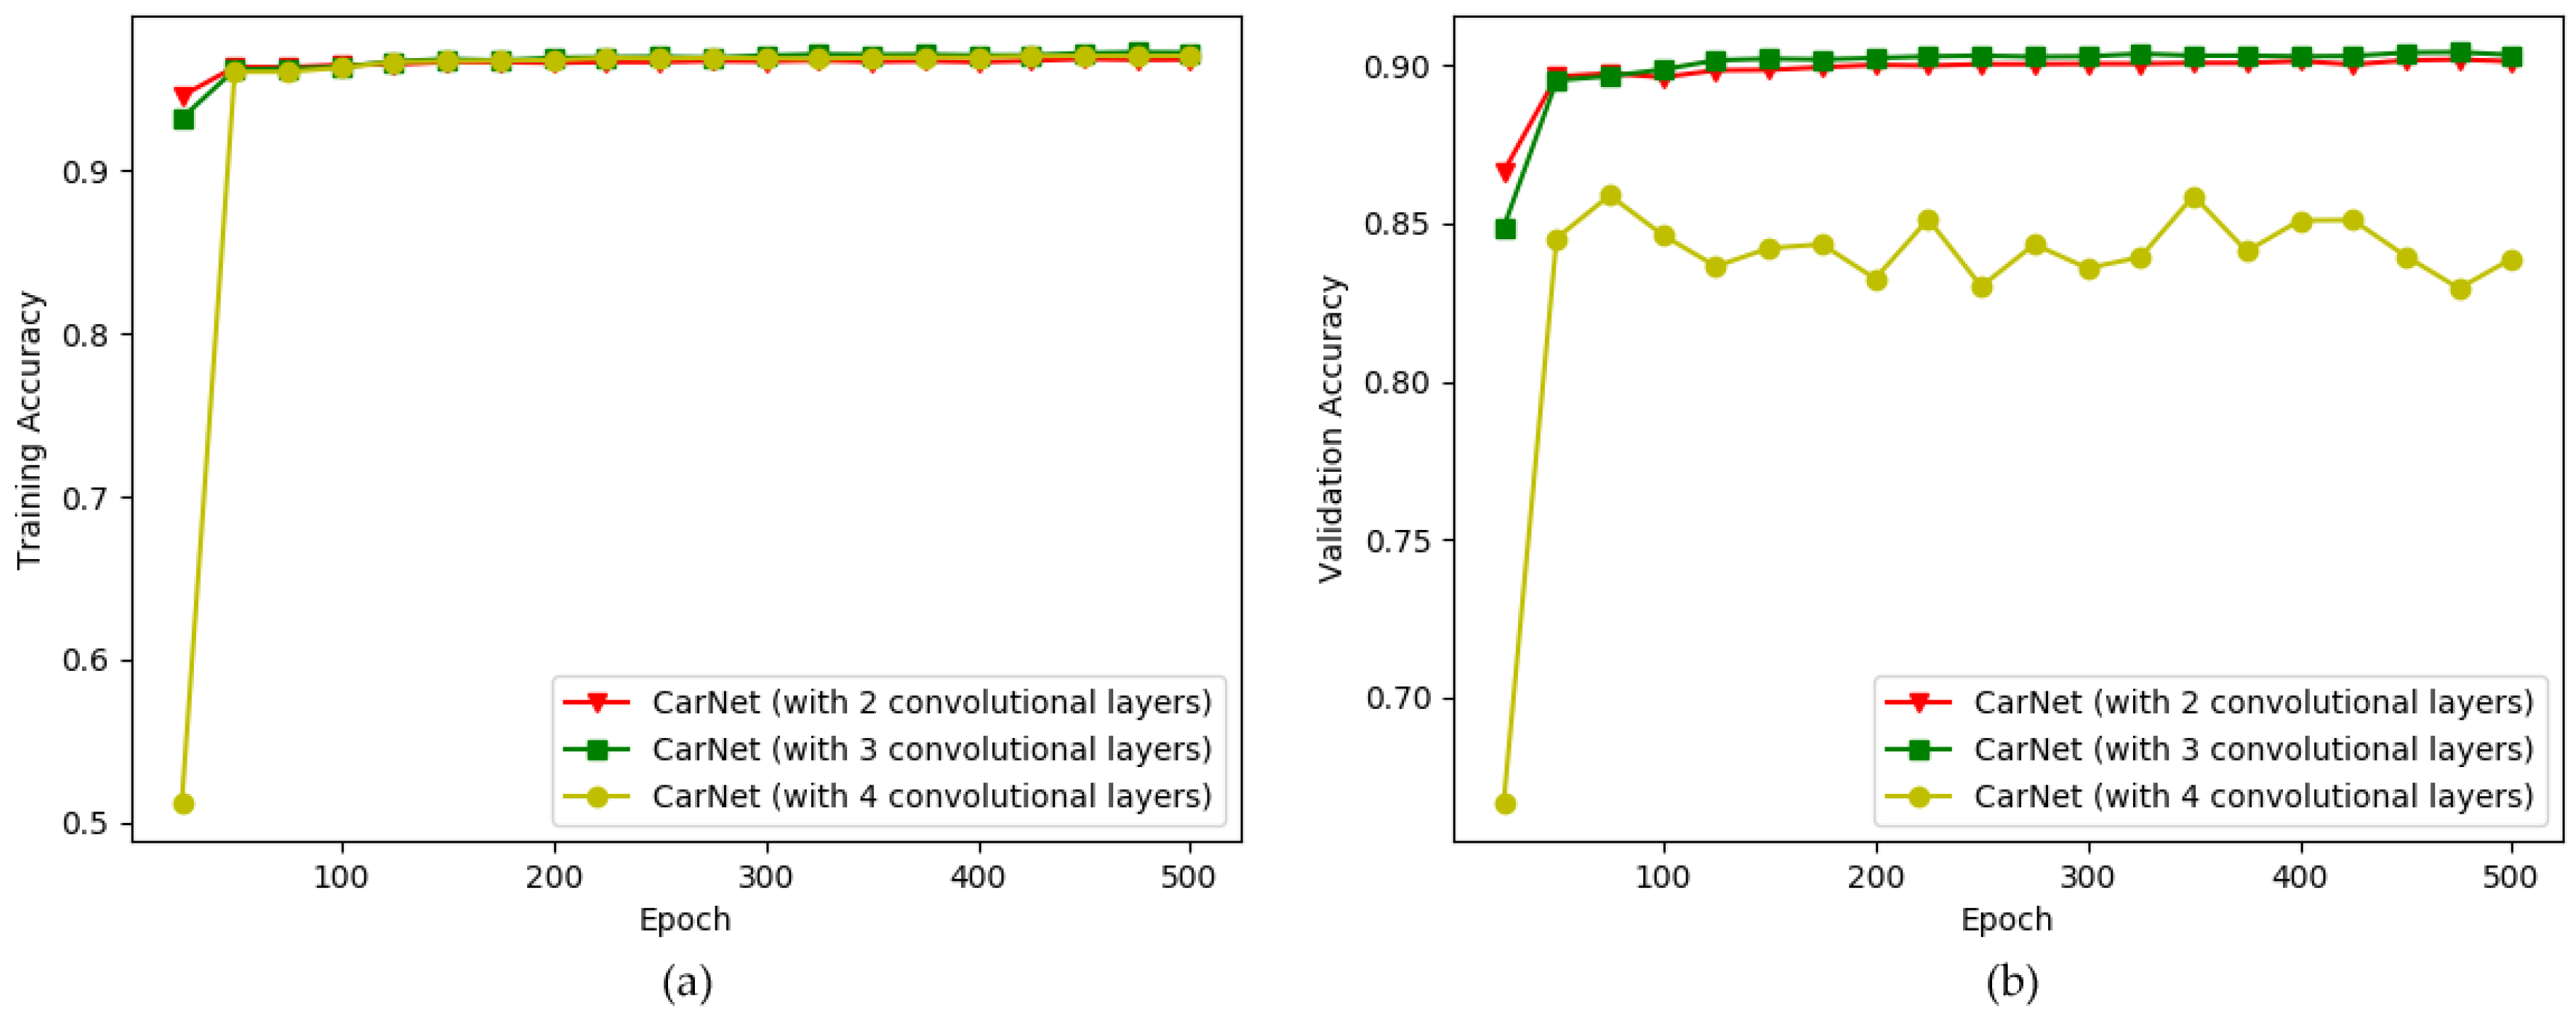
- We investigated empirically the optimal number of layers that is perfectly suited for solving the current issue. A small number of layers, three, is used in our CarNet. If it contains too many layers, a model learns too deeply. Our task is not to classify 1000 groups, as is that of AlexNet, but is simpler because we have only two classes. Thus, learning too deep would lead to a failure. We proved this in our experiments, as described in Section 5. Moreover, most previous deep learning approaches, including [5], used a small number of layers, mostly three.
5. Experimental Results
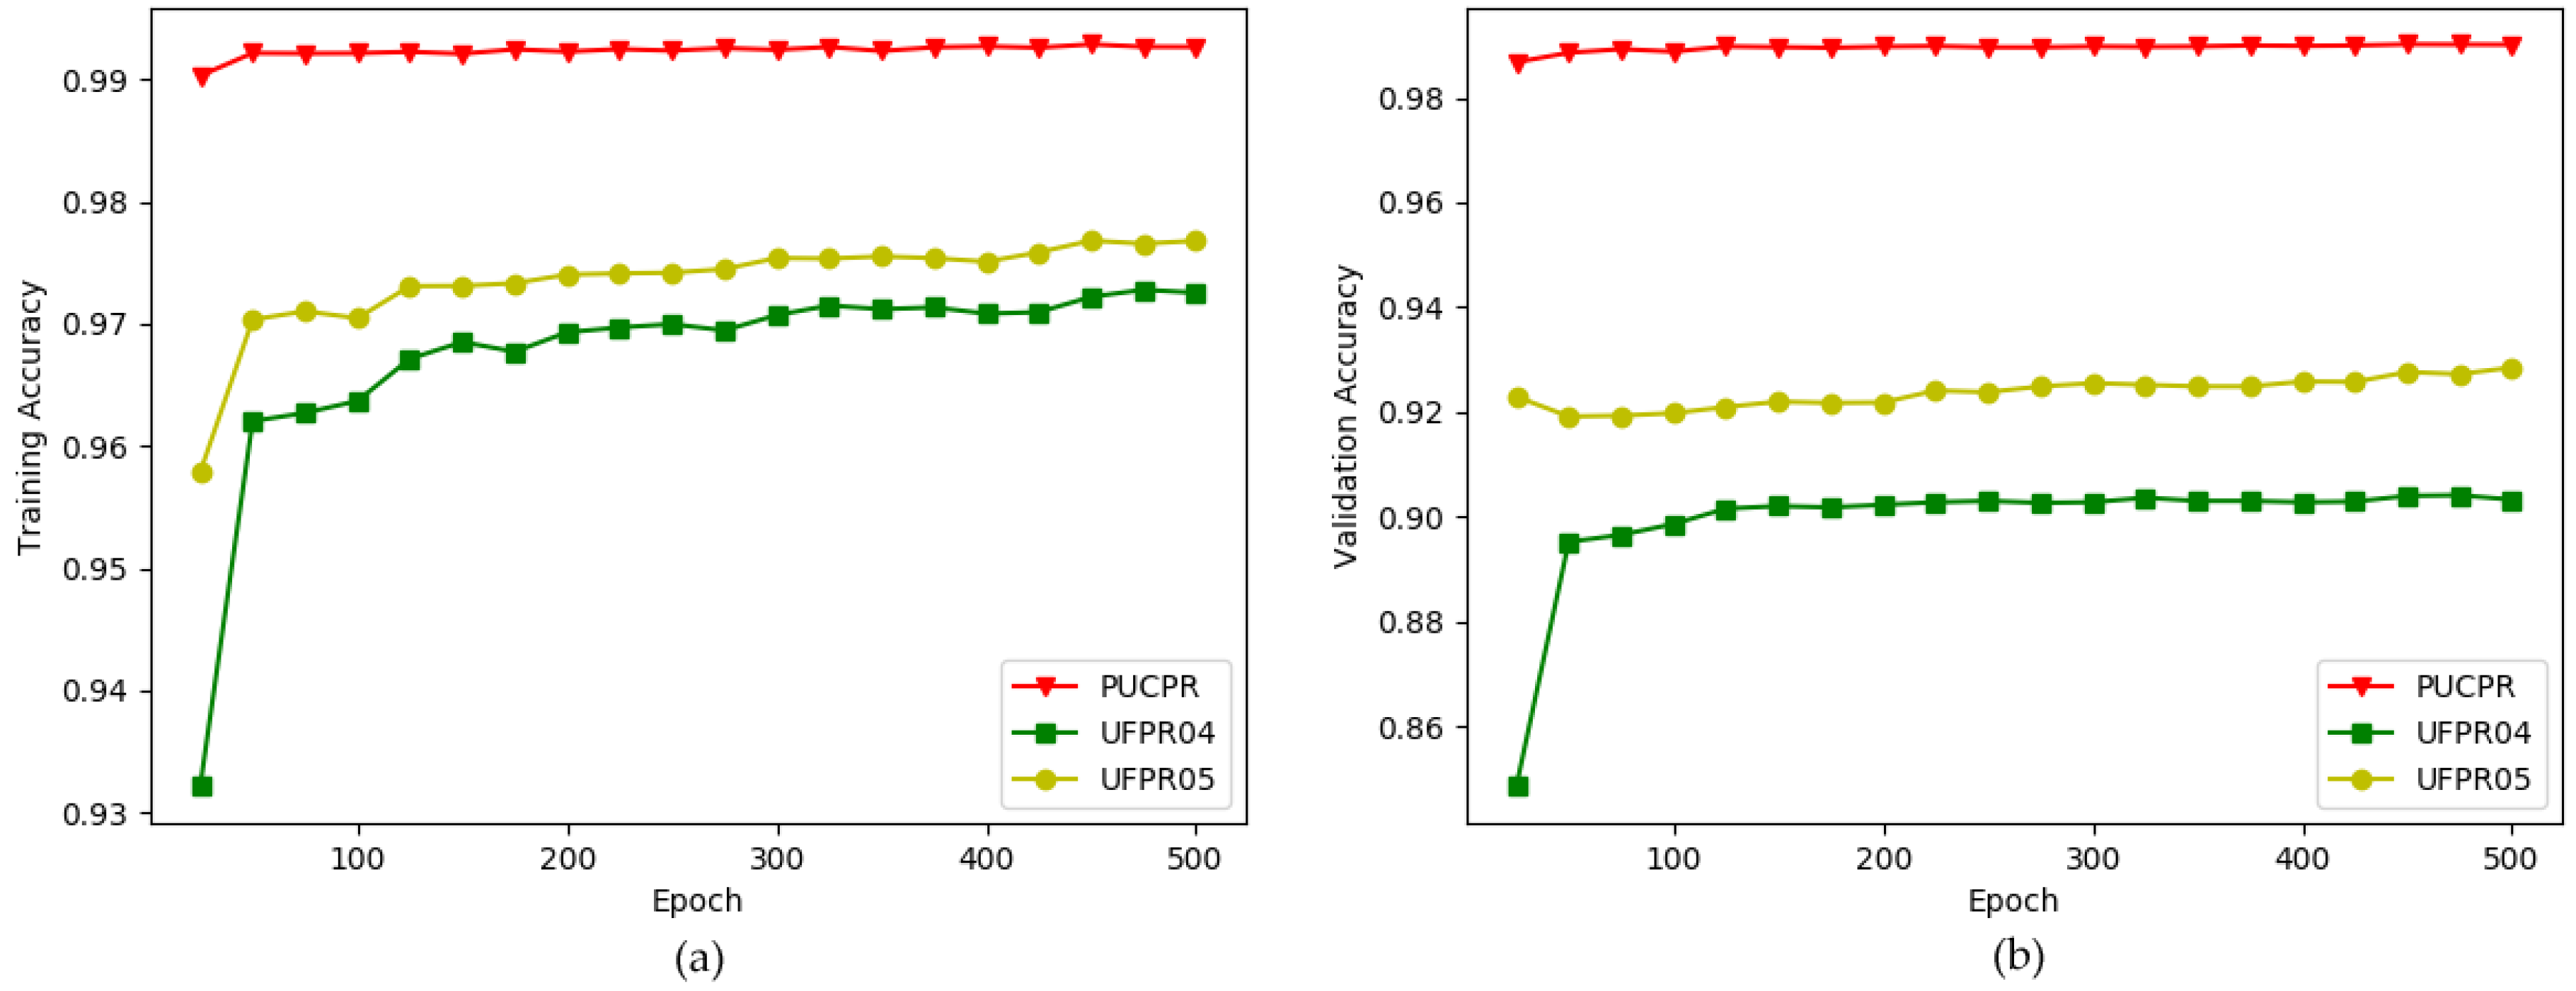
5.1. Exploring an Optimal Architecture—CarNet, by Making Experiments on PKLot Dataset
5.2. Comparison of CarNet with Respect to Well-Known Architectures by Making Experiments on PKLot and CNRPark + EXT Datasets
5.2.1. Experimental Results on PKLot Dataset
5.2.2. Experimental Results on CNRPark + EXT Dataset
5.3. Comparison of CarNet with Previous Approaches by Making Experiments on PKLot and CNRPark + EXT Datasets
6. Conclusions
Author Contributions
Funding
Conflicts of Interest
References
- Tian, B.; Morris, B.T.; Tang, M.; Liu, Y.; Yao, Y.; Gou, C.; Shen, D.; Tang, S. Hierarchical and Networked Vehicle Surveillance in Its: A Survey. IEEE Trans. Intell. Transp. Syst. 2015, 16, 557–580. [Google Scholar]
- Tang, V.W.; Zheng, Y.; Cao, J. An Intelligent Car Park Management System Based on Wireless Sensor Networks. In Proceedings of the 1st International Symposium on Pervasive Computing and Applications, Urumchi, Urumchi, China, 3–5 August 2006; pp. 65–70. [Google Scholar]
- Ichihashi, H.; Notsu, A.; Honda, K.; Katada, T.; Fujiyoshi, M. Vacant Parking Space Detector for Outdoor Parking Lot by Using Surveillance Camera and FCM classifier. In Proceedings of the IEEE International Conference on Fuzzy Systems, Jeju Island, Korea, 20–24 August 2009; pp. 127–134. [Google Scholar]
- De Almeida, P.R.; Oliveira, L.S.; Britto, A.S., Jr.; Silva, E.J., Jr.; Koerich, A.L. Pklot—A Robust Dataset for Parking Lot Classification. Expert Syst. Appl. 2015, 42, 4937–4949. [Google Scholar] [CrossRef]
- Amato, G.; Carrara, F.; Falchi, F.; Gennaro, C.; Meghini, C.; Vairo, C. Deep Learning for Decentralized Parking Lot Occupancy Detection. Expert Syst. Appl. 2017, 72, 327–334. [Google Scholar] [CrossRef]
- Krizhevsky, A.; Sutskever, I.; Hinton, G.E. ImageNet Classification with Deep Convolutional Neural Networks. In Advances in Neural Information Processing Systems 25: 26th Annual Conference on Neural Information Processing Systems 2012; Curran Associates, Inc.: Red Hook, NY, USA, 2012. [Google Scholar]
- Ashok, V.G.; Gupta, A.; Shiva, S.; Iyer, H.; Gowda, D.; Srinivas, A. A Novel Parking Solution for Metropolitan Parking Garages. In Proceedings of the 3rd WSEAS International Conference on Urban Planning and Transportation, Sozopol, Bulgaria, 22–24 July 2010; pp. 153–159. [Google Scholar]
- Funck, S.; Mohler, N.; Oertel, W. Determining Car-Park Occupancy from Single Images. In Proceedings of the IEEE International Symposium on Intelligent Vehicles, Parma, Italy, 14–17 June 2004; pp. 325–328. [Google Scholar]
- Mathur, S.; Jin, T.; Kasturirangan, N.; Chandrashekharan, J.; Xue, W.; Gruteser, M.; Trappe, W. ParkNet: Drive-by Sensing of Road-side Parking Statistics. In Proceedings of the 8th Annual International Conference on Mobile Systems, Applications and Services, San Francisco, CA, USA, 15–18 June 2010; pp. 1–14. [Google Scholar]
- Mathur, S.; Kaul, S.; Gruteser, M.; Trappe, W. ParkNet: A Mobile Sensor Network for Harvesting Real Time Vehicular Parking Information. In Proceedings of the MobiHoc S3 Workshop on MobiHoc S3, New Orleans, LA, USA, 18–21 May 2009; pp. 25–28. [Google Scholar]
- Wolff, J.; Heuer, T.; Gao, H.; Weinmann, M.; Voit, S.; Hartmann, U. Parking Monitor System Based on Magnetic Field Sensors. In Proceedings of the IEEE Conference on Intelligent Transportation Systems, Toronto, ON, Canada, 17–20 September 2006; pp. 1275–1279. [Google Scholar]
- Liu, K.S.; Gao, J.; Wu, X.; Lin, S. On-Street Parking Guidance with Real-Time Sensing Data for Smart Cities. In Proceedings of the 15th Annual IEEE International Conference on Sensing, Communication, and Networking (SECON), Hong Kong, China, 11–13 June 2018; pp. 1–9. [Google Scholar]
- Begum, R.; Halse, S.V. The Smart Car Parking System Using GSM and LabVIEW. Int. J. Comput. Sci. Math. Sci. 2018, 9, 135–142. [Google Scholar] [CrossRef]
- Olasupo, T.O.; Otero, C.E.; Otero, L.D.; Olasupo, K.O.; Kostanic, I. Path Loss Models for Low-Power, Low-Data Rate Sensor Nodes for Smart Car Parking Systems. IEEE Trans. Intell. Transp. Syst. 2018, 19, 1774–1783. [Google Scholar] [CrossRef]
- Leone, G.R.; Moroni, D.; Pieri, G.; Petracca, M.; Salvetti, O.; Azzara, A.; Marino, F. An Intelligent Cooperative Visual Sensor Network for Urban Mobility. Sensors 2017, 17, 2588. [Google Scholar] [CrossRef] [PubMed]
- Hossen, M.I.; Goh, M.; Connie, T.; Aris, A.; Pei, W.L. A Review on Outdoor Parking Systems Using Feasibility of Mobile Sensors. In Proceedings of the International Conference on Computational Science and Technology, Singapore, 24–28 February 2018; pp. 241–251. [Google Scholar]
- Hammoudi, K.; Melkemi, M.; Benhabiles, H.; Dornaika, F.; Hamrioui, S.; Rodrigues, J. Analyzing and managing the slot occupancy of car parking by exploiting vision-based urban surveillance networks. In Proceedings of the International Conference on Selected Topics in Mobile and Wireless Networking (MoWNeT), Avignon, France, 17–19 May 2017; pp. 1–6. [Google Scholar]
- Lin, T.; Rivano, H.; Le Mouël, F. A Survey of Smart Parking Solutions. IEEE Trans. Intell. Transp. Syst. 2017, 18, 3229–3253. [Google Scholar] [CrossRef]
- Balzano, W.; Vitale, F. DiG-Park: A Smart Parking Availability Searching Method Using V2V/V2I and DGP-Class Problem. In Proceedings of the 31st International Conference on Advanced Information Networking and Applications Workshops (WAINA), Taipei, Taiwan, 27–29 March 2017; pp. 698–703. [Google Scholar]
- Xiang, X.; Lv, N.; Zhai, M.; El Saddik, A. Real-Time Parking Occupancy Detection for Gas Stations Based on Haar-AdaBoosting and CNN. IEEE Sens. J. 2017, 17, 6360–6367. [Google Scholar] [CrossRef]
- Amato, G.; Carrara, F.; Falchi, F.; Gennaro, C.; Vairo, C. Car parking occupancy detection using smart camera networks and Deep Learning. In Proceedings of the IEEE Symposium on Computers and Communication (ISCC), Messina, Italy, 27–30 June 2016; pp. 1212–1217. [Google Scholar]
- Yang, C.F.; Ju, Y.H.; Hsieh, C.Y.; Lin, C.Y.; Tsai, M.H.; Chang, H.L. iParking—A real-time parking space monitoring and guiding system. Veh. Commun. 2017, 9, 301–305. [Google Scholar] [CrossRef]
- Vítek, S.; Melničuk, P. A Distributed Wireless Camera System for the Management of Parking Spaces. Sensors 2018, 18, 69. [Google Scholar] [CrossRef]
- Lu, R.; Lin, X.; Zhu, H.; Shen, X. Spark: A New Vanet-Based Smart Parking Scheme for Large Parking Lots. In Proceedings of the IEEE INFOCOM, Rio de Janeiro, Brazil, 19–25 April 2009; pp. 1413–1421. [Google Scholar]
- Geng, Y.; Cassandras, C.G. New Smart Parking System Based on Resource Allocation and Reservations. Trans. Intell. Transp. Syst. 2013, 14, 1129–1139. [Google Scholar] [CrossRef]
- Tang, C.; Wei, X.; Zhu, C.; Chen, W.; Rodrigues, J.J. Towards Smart Parking Based on Fog Computing. IEEE Access 2018, 6, 70172–70185. [Google Scholar] [CrossRef]
- Badii, C.; Nesi, P.; Paoli, I. Predicting Available Parking Slots on Critical and Regular Services by Exploiting a Range of Open Data. IEEE Access 2018, 6, 44059–44071. [Google Scholar] [CrossRef]
- Chunhe, Y.; Jilin, L. A Type of Sensor to Detect Occupancy of Vehicle Berth in Carpark. In Proceedings of the 7th International Conference on Signal Processing, Beijing, China, 31 August–4 September 2004; pp. 2708–2711. [Google Scholar]
- Kotb, A.O.; Shen, Y.C.; Huang, Y. Smart Parking Guidance, Monitoring and Reservations: A Review. IEEE Intell. Transp. Syst. Mag. 2017, 9, 6–16. [Google Scholar] [CrossRef]
- Safi, Q.G.K.; Luo, S.; Pan, L.; Liu, W.; Hussain, R.; Bouk, S.H. SVPS: Cloud-based smart vehicle parking system over ubiquitous VANETs. Comput. Netw. 2018, 138, 18–30. [Google Scholar] [CrossRef]
- Huang, C.C.; Wang, S.J. A Hierarchical Bayesian Generation Framework for Vacant Parking Space Detection. IEEE Trans. Circuits Syst. Video Technol. 2010, 20, 1770–1785. [Google Scholar] [CrossRef]
- Lee, C.H.; Wen, M.G.; Han, C.C.; Kou, D.C. An Automatic Monitoring Approach for Unsupervised Parking Lots in Outdoor. In Proceedings of the IEEE International Carnahan Conference on Security Technology, Las Palmas, Spain, 11–14 October 2005; pp. 271–274. [Google Scholar]
- Horprasert, T.; Harwood, D.; Davis, L.S. A Statistical Approach for Real-time Robust Background Subtraction and Shadow Detection. In Proceedings of the 7th IEEE International Conference on Computer Vision, Kerkyra, Greece, 20–27 September 1999; pp. 1–19. [Google Scholar]
- Sastre, R.L.; Jimenez, P.G.; Acevedo, F.J.; Bascon, S.M. Computer Algebra Algorithms Applied to Computer Vision in a Parking Management System. Proceedings of IEEE International Symposium on Industrial Electronics, Vigo, Spain, 4–7 June 2007; pp. 1675–1680. [Google Scholar]
- Schneiderman, H.; Kanade, T. Object Detection Using the Statistics of Parts. Int. J. Comput. Vis. 2004, 56, 151–177. [Google Scholar] [CrossRef]
- Viola, P.; Jones, M.J. Robust Real-time Face Detection. Int. J. Comput. Vis. 2004, 57, 137–154. [Google Scholar] [CrossRef]
- Masmoudi, I.; Wali, A.; Alimi, A.M. Parking Spaces Modeling for Inter Spaces Occlusion Handling. In Proceedings of the 22nd International Conference in Central European Computer Graphics, Visualization and Computer Vision Co-Operation with EUROGRAPHICS Association, Pilsen, Czech Republic, 2–5 June 2014; pp. 119–124. [Google Scholar]
- Caicedo, F.; Blazquez, C.; Miranda, P. Prediction of Parking Space Availability in Real Time. Expert Syst. Appl. 2012, 39, 7281–7290. [Google Scholar] [CrossRef]
- Lan, K.C.; Shih, W.Y. An Intelligent Driver Location System for Smart Parking. Expert Syst. Appl. 2014, 41, 2443–2456. [Google Scholar] [CrossRef]
- Chen, X.; Xiang, S.; Liu, C.L.; Pan, C.H. Vehicle Detection in Satellite Images by Hybrid Deep Convolutional Neural Networks. IEEE Geosci. Remote Sens. Lett. 2014, 11, 1797–1801. [Google Scholar] [CrossRef]
- Jermsurawong, J.; Ahsan, U.; Haidar, A.; Haiwei, D.O.N.G.; Mavridis, N. One-day Long Statistical Analysis of Parking Demand by Using Single-Camera Vacancy Detection. J. Transp. Syst. Eng. Inf. Technol. 2014, 14, 33–44. [Google Scholar] [CrossRef]
- Huang, C.C.; Tai, Y.S.; Wang, S.J. Vacant Parking Space Detection Based on Plane-based Bayesian Hierarchical Framework. IEEE Trans. Circuits Syst. Video Technol. 2013, 23, 1598–1610. [Google Scholar] [CrossRef]
- Delibaltov, D.; Wu, W.; Loce, R.P.; Bernal, E.A. Parking Lot Occupancy Determination from Lamp-post Camera Images. In Proceedings of the 16th International IEEE Conference on Intelligent Transportation Systems, The Hague, The Netherlands, 6–9 October 2013; pp. 2387–2392. [Google Scholar]
- Wu, Q.; Huang, C.; Wang, S.Y.; Chiu, W.C.; Chen, T. Robust Parking Space Detection Considering Inter-Space Correlation. In Proceedings of the IEEE International Conference on Multimedia and Expo, Beijing, China, 2–5 July 2007; pp. 659–662. [Google Scholar]
- Tsai, L.W.; Hsieh, J.W.; Fan, K.C. Vehicle Detection Using Normalized Color and Edge Map. IEEE Trans. Image Process. 2007, 16, 850–864. [Google Scholar] [CrossRef]
- Seo, Y.W.; Urmson, C. Utilizing Prior Information to Enhance Self-supervised Aerial Image Analysis for Extracting Parking Lot Structures. In Proceedings of the IEEE/RSJ International Conference on Intelligent Robots and Systems, St. Louis, MO, USA, 10–15 October 2009; pp. 339–344. [Google Scholar]
- Ahrnbom, M.; Astrom, K.; Nilsson, M. Fast Classification of Empty and Occupied Parking Spaces Using Integral Channel Features. In Proceedings of the IEEE Conference on Computer Vision and Pattern Recognition (CVPR) Workshops, Las Vegas Valley, NV, USA, 26 June–1 July 2016; pp. 9–15. [Google Scholar]
- Yu, F.; Koltun, V. Multi-Scale Context Aggregation by Dilated Convolutions. arXiv, 2016; arXiv:1511.07122v3. [Google Scholar]
- René, C.L.; Flynn, M.D.; Vidal, R.; Reiter, A.; Hager, G.D. Temporal Convolutional Networks for Action Segmentation and Detection. In Proceedings of the IEEE Conference on Computer Vision and Pattern Recognition (CVPR), Honolulu, HI, USA, 22–25 July 2017; pp. 156–165. [Google Scholar]
- Van Den Oord, A.; Dieleman, S.; Zen, H.; Simonyan, K.; Vinyals, O.; Graves, A.; Kalchbrenner, N.; Senior, A.; Kavukcuoglu, K. Wavenet: A generative model for raw audio. In Proceedings of the 9th ISCA Speech Synthesis Workshop, Sunnyvale, CA, USA, 13–15 September 2016; p. 125. [Google Scholar]
- Kalchbrenner, N.; Espeholt, L.; Simonyan, K.; Oord, A.V.D.; Graves, A.; Kavukcuoglu, K. Neural Machine Translation in Linear Time. arXiv, 2017; arXiv:1511.07122v3. [Google Scholar]
- Simonyan, K.; Zisserman, A. Very Deep Convolutional Networks for Large-Scale Image Recognition. In Proceedings of the 3rd International Conference on Learning Representations (ICLR), San Diego, CA, USA, 7–9 May 2015. [Google Scholar]
- Chollet, F. Xception: Deep Learning with Depthwise Separable Convolutions. In Proceedings of the IEEE Conference on Computer Vision and Pattern Recognition (CVPR), Honolulu, HI, USA, 21–26 July 2017; pp. 1251–1258. [Google Scholar]
- Szegedy, C.; Vanhoucke, V.; Ioffe, S.; Shlens, J.; Wojna, Z. Rethinking the Inception Architecture for Computer Vision. In Proceedings of the IEEE Conference on Computer Vision and Pattern Recognition (CVPR), Las Vegas Valley, NV, USA, 26 June–1 July 2016; pp. 2818–2826. [Google Scholar]
- He, K.; Zhang, X.; Ren, S.; Sun, J. Deep Residual Learning for Image Recognition. In Proceedings of the IEEE Conference on Computer Vision and Pattern Recognition (CVPR), Las Vegas Valley, NV, USA, 26 June–1 July 2016; pp. 770–778. [Google Scholar]


| Datasets | Empty Spaces | Occupied Spaces | Total |
|---|---|---|---|
| PKLot [4] | 337,780 | 358,119 | 695,899 |
| CNRPark + EXT [5] | 65,658 | 79,307 | 144,965 |
| Name of Method | Training Accuracy | Validation Accuracy |
|---|---|---|
| PUCPR | 99.26% | 99.01% |
| UFPR04 | 97.23% | 90.70% |
| UFPR05 | 97.68% | 92.85% |
| Name of Method | Training Accuracy | Validation Accuracy |
|---|---|---|
| CarNet (without dilated convolutional layers) | 96.47% | 89.99% |
| CarNet (with dilated convolutional layers) | 97.23% | 90.70% |
| Name of Method | Name of Training Subset | Testing Accuracy | ||
|---|---|---|---|---|
| PUCPR | UFPR04 | UFPR05 | ||
| CarNet (with a dilation) | PUCPR | 98.80% | 94.40% | 97.70% |
| UFPR04 | 98.30% | 95.60% | 97.60% | |
| UFPR05 | 98.40% | 95.20% | 97.50% | |
| CarNet (without a dilation) | PUCPR | 94.70% | 94.30% | 93.80% |
| UFPR04 | 95.60% | 94.50% | 92.30% | |
| UFPR05 | 95.80% | 94.90% | 94.10% | |
| Name of Method | Training Accuracy | Validation Accuracy |
|---|---|---|
| CarNet (with two convolutional layers) | 96.82% | 90.02% |
| CarNet (with three convolutional layers) | 97.23% | 90.70% |
| CarNet (with four convolutional layers) | 97.06% | 83.88% |
| Name of Method | Name of Training Subset | Testing Accuracy | ||
|---|---|---|---|---|
| PUCPR | UFPR04 | UFPR05 | ||
| CarNet (with two layers) | PUCPR | 95.60% | 94.20% | 92.20% |
| UFPR04 | 96.10% | 95% | 90.30% | |
| UFPR05 | 95.70% | 95.10% | 91.70% | |
| CarNet (with three layers) | PUCPR | 98.80% | 94.40% | 97.70% |
| UFPR04 | 98.30% | 95.60% | 97.60% | |
| UFPR05 | 98.40% | 95.20% | 97.50% | |
| CarNet (with four layers) | PUCPR | 62.80% | 89.20% | 68.40% |
| UFPR04 | 57.90% | 88% | 65.30% | |
| UFPR05 | 63.40% | 87.50% | 66.60% | |
| Name of Method | Training Accuracy | Validation Accuracy |
|---|---|---|
| CarNet (window size = 3) | 95.63% | 88.78% |
| CarNet (window size = 5) | 95.89% | 88.35% |
| CarNet (window size = 7) | 96.13% | 89.21% |
| CarNet (window size = 9) | 96.63% | 90.55% |
| CarNet (window size = 11) | 97.23% | 90.70% |
| CarNet (window size = 13) | 97.06% | 90.56% |
| Name of Method | Name of Training Subset | Testing Accuracy | ||
|---|---|---|---|---|
| PUCPR | UFPR04 | UFPR05 | ||
| CarNet (with window size 3) | PUCPR | 92.60% | 92.80% | 95.70% |
| UFPR04 | 92.90% | 94.10% | 94.50% | |
| UFPR05 | 92.10% | 94.50% | 95.10% | |
| CarNet (with window size 5) | PUCPR | 94.80% | 93.40% | 92.40% |
| UFPR04 | 94.20% | 93.60% | 92.90% | |
| UFPR05 | 95.30% | 94.10% | 95.10% | |
| CarNet (with window size 7) | PUCPR | 96.20% | 94.20% | 96.30% |
| UFPR04 | 96.30% | 94.80% | 95.10% | |
| UFPR05 | 96.30% | 95.20% | 95.90% | |
| CarNet (with window size 9) | PUCPR | 92.70% | 92.20% | 93.90% |
| UFPR04 | 94.90% | 95.30% | 93.70% | |
| UFPR05 | 93.10% | 94.30% | 94.20% | |
| CarNet (with window size 11) | PUCPR | 98.80% | 94.40% | 97.70% |
| UFPR04 | 98.30% | 95.60% | 97.60% | |
| UFPR05 | 98.40% | 95.20% | 97.50% | |
| CarNet (with window size 13) | PUCPR | 97.40% | 93.30% | 95.80% |
| UFPR04 | 97% | 95.40% | 96.20% | |
| UFPR05 | 97.10% | 95.10% | 96% | |
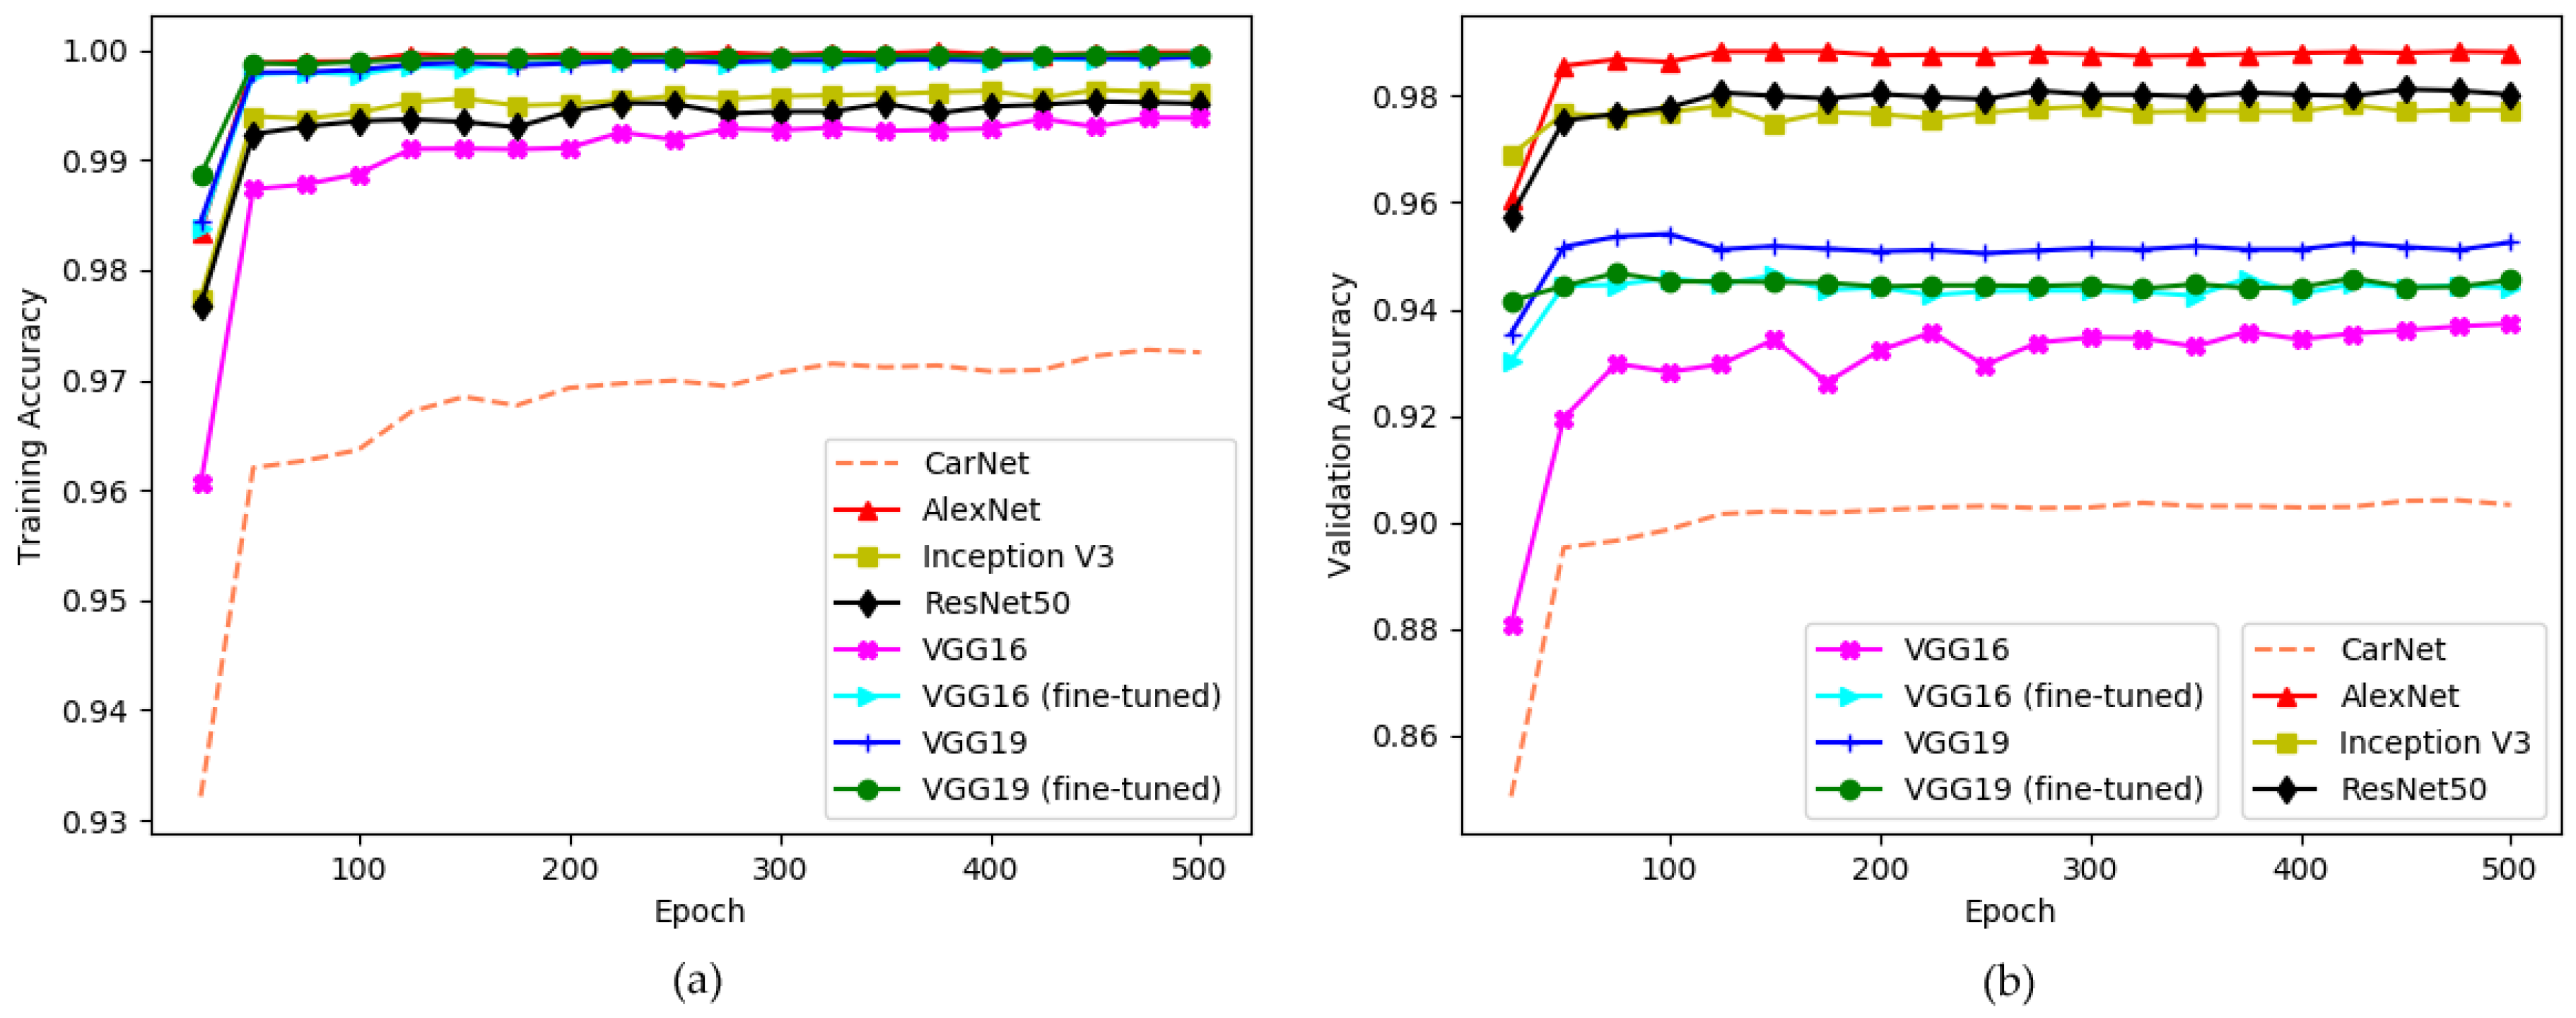
| Name of Method | Training Accuracy | Validation Accuracy |
|---|---|---|
| AlexNet [6] | 99.98% | 98.82% |
| CarNet | 97.23% | 90.70% |
| VGG16 [52] | 99.38% | 93.72% |
| VGG16 (fine-tuned) [52] | 99.94% | 94.44% |
| VGG19 [52] | 99.94% | 95.25% |
| VGG19 (fine-tuned) [52] | 99.96% | 94.54% |
| Xception [53] | 99.92% | 98.53% |
| Inception V3 [54] | 99.61% | 97.73% |
| ResNet50 [55] | 99.51% | 98.02% |
| Name of Method | Name of Training Subset | Testing Accuracy | ||
|---|---|---|---|---|
| PUCPR | UFPR04 | UFPR05 | ||
| AlexNet [6] | PUCPR | 98.60% | 88.80% | 83.40% |
| UFPR04 | 89.50% | 98.20% | 87.60% | |
| UFPR05 | 88.20% | 87.30% | 98% | |
| CarNet | PUCPR | 98.80% | 94.40% | 97.70% |
| UFPR04 | 98.30% | 95.60% | 97.60% | |
| UFPR05 | 98.40% | 95.20% | 97.50% | |
| VGG16 [52] | PUCPR | 88.20% | 94.20% | 90.80% |
| UFPR04 | 89.70% | 95.30% | 90% | |
| UFPR05 | 90.50% | 94.90% | 91.80% | |
| VGG16 (fine-tuned) [52] | PUCPR | 69.10% | 91.70% | 92.60% |
| UFPR04 | 67.90% | 95% | 86.80% | |
| UFPR05 | 91.20% | 92.80% | 92.80% | |
| VGG19 [52] | PUCPR | 81.50% | 93.80% | 94.60% |
| UFPR04 | 80.40% | 92.30% | 91.90% | |
| UFPR05 | 88.80% | 95.10% | 95.90% | |
| VGG19 (fine-tuned) [52] | PUCPR | 84.70% | 94.10% | 91.90% |
| UFPR04 | 85.40% | 94.10% | 92.30% | |
| UFPR05 | 87.60% | 94.30% | 95.40% | |
| Xception [53] | PUCPR | 96.30% | 92.50% | 93.3 |
| UFPR04 | 94% | 94.60% | 93.40% | |
| UFPR05 | 95.70% | 90.90% | 91.20% | |
| Inception V3 [54] | PUCPR | 90.80% | 91.10% | 94.2 |
| UFPR04 | 91.70% | 95.20% | 92.40% | |
| UFPR05 | 94.30% | 92.9 | 93.70% | |
| ResNet50 [55] | PUCPR | 90.50% | 93.90% | 94.10% |
| UFPR04 | 93.70% | 94.80% | 93.30% | |
| UFPR05 | 92.20% | 94.80% | 95.50% | |
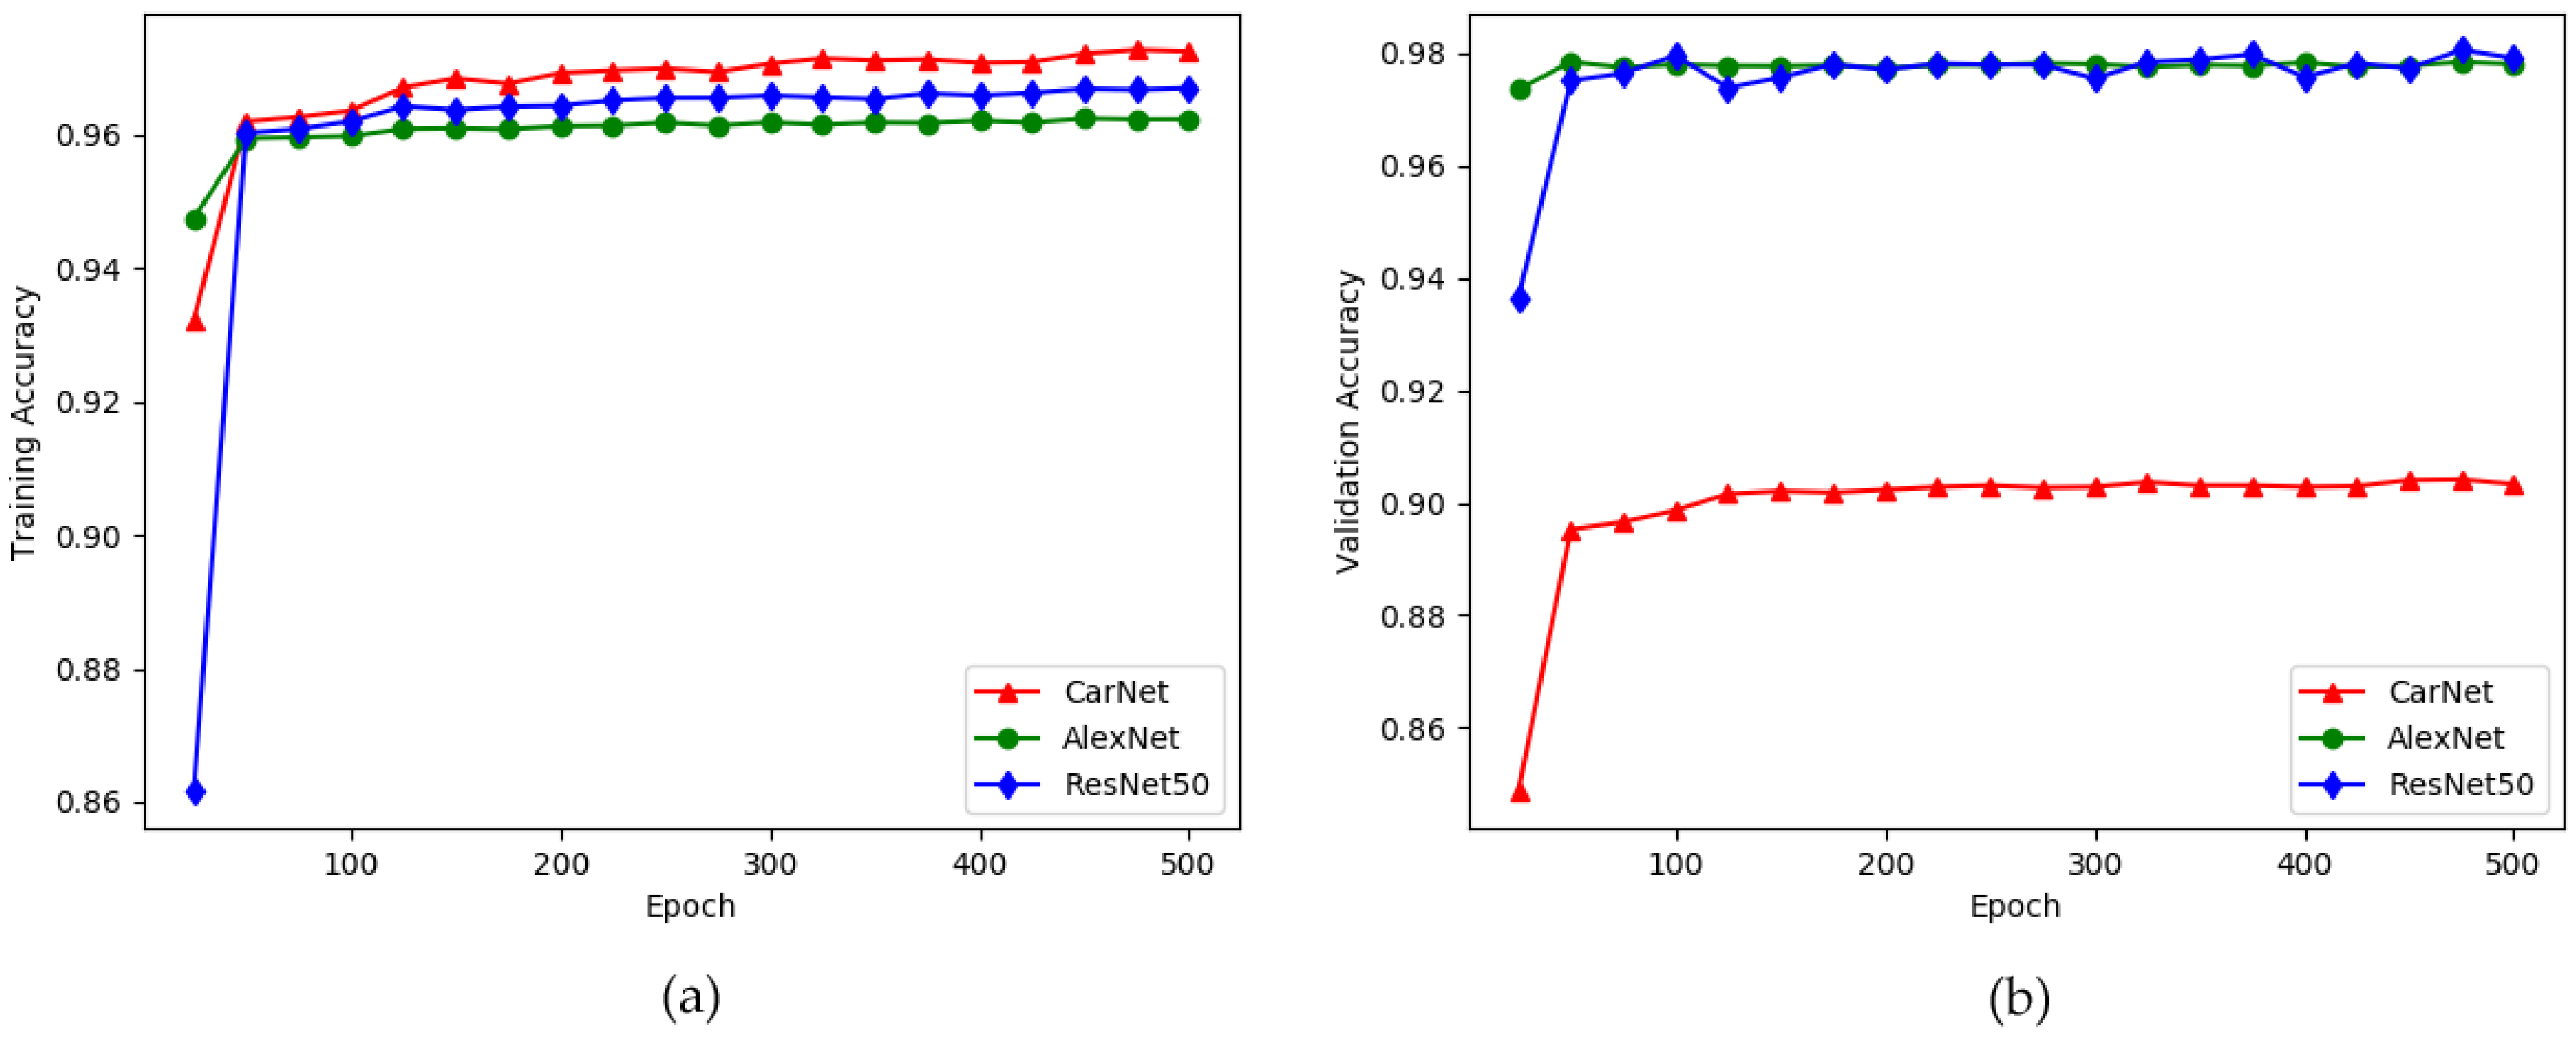
| Name of Method | Training Accuracy | Validation Accuracy |
|---|---|---|
| CarNet | 97.91% | 90.05% |
| AlexNet [6] | 96.99% | 97.91% |
| ResNet50 [55] | 96.51% | 97.80% |
| Name of Method | Testing Accuracy |
|---|---|
| CarNet | 97.24% |
| AlexNet [6] | 96.54% |
| ResNet50 [55] | 96.24% |
| Name of Architecture | Training Subset | Testing Subset | Accuracy (%) | Mean (%) |
|---|---|---|---|---|
| mAlexNet [5] | UFPR04 | UFPR04 | 99.54 | 96.74 |
| UFPR04 | UFPR05 | 93.29 | ||
| UFPR04 | PUCPR | 98.27 | ||
| UFPR05 | UFPR04 | 93.69 | ||
| UFPR05 | UFPR05 | 99.49 | ||
| UFPR05 | PUCPR | 92.72 | ||
| PUCPR | UFPR04 | 98.03 | ||
| PUCPR | UFPR05 | 96 | ||
| PUCPR | PUCPR | 99.9 | ||
| CarNet | UFPR04 | UFPR04 | 95.6 | 97.04 |
| UFPR04 | UFPR05 | 97.6 | ||
| UFPR04 | PUCPR | 98.3 | ||
| UFPR05 | UFPR04 | 95.2 | ||
| UFPR05 | UFPR05 | 97.5 | ||
| UFPR05 | PUCPR | 98.4 | ||
| PUCPR | UFPR04 | 94.4 | ||
| PUCPR | UFPR05 | 97.6 | ||
| PUCPR | PUCPR | 98.8 |
| Name of Architecture | Training Dataset | Testing Dataset | Accuracy (%) | Mean (%) |
|---|---|---|---|---|
| mAlexNet [5] | PKLot [4] | CNRPark + EXT [5] | 83.88 | 88.70 |
| CNRPark + EXT [5] | PKLot [4] | 84.53 | ||
| CNRPark + EXT [5] | CNRPark + EXT [5] | 97.71 | ||
| CarNet | PKLot [4] | CNRPark + EXT [5] | 94.77 | 97.03 |
| CNRPark + EXT [5] | PKLot [4] | 98.21 | ||
| CNRPark + EXT [5] | CNRPark + EXT [5] | 98.11 |
| Name of Architecture | Training Set | Testing Test | AUC Score | Method Achieved Best Result |
|---|---|---|---|---|
| CarNet | UFPR04 | UFPR04 | 97.9 | PKLot [4] |
| Martin et al. (LR) [47] | UFPR04 | UFPR04 | 0.9994 | |
| Martin et al. (SVM) [47] | UFPR04 | UFPR04 | 0.9996 | |
| PKLot [4] | UFPR04 | UFPR04 | 0.9999 | |
| CarNet | UFPR04 | UFPR05 | 99.35 | CarNet |
| Martin et al. (LR) [47] | UFPR04 | UFPR05 | 0.9928 | |
| Martin et al. (SVM) [47] | UFPR04 | UFPR05 | 0.9772 | |
| PKLot [4] | UFPR04 | UFPR05 | 0.9595 | |
| CarNet | UFPR04 | PUCPR | 99.82 | CarNet |
| Martin et al. (LR) [47] | UFPR04 | PUCPR | 0.9881 | |
| Martin et al. (SVM) [47] | UFPR04 | PUCPR | 0.9569 | |
| PKLot [4] | UFPR04 | PUCPR | 0.9713 | |
| CarNet | UFPR05 | UFPR04 | 97.96 | Martin et al. (LR) [47] |
| Martin et al. (LR) [47] | UFPR05 | UFPR04 | 0.9963 | |
| Martin et al. (SVM) [47] | UFPR05 | UFPR04 | 0.9943 | |
| PKLot [4] | UFPR05 | UFPR04 | 0.9533 | |
| CarNet | UFPR05 | UFPR05 | 99.89 | PKLot [4] |
| Martin et al. (LR) [47] | UFPR05 | UFPR05 | 0.9987 | |
| Martin et al. (SVM) [47] | UFPR05 | UFPR05 | 0.9988 | |
| PKLot [4] | UFPR05 | UFPR05 | 0.9995 | |
| CarNet | UFPR05 | PUCPR | 97.91 | CarNet |
| Martin et al. (LR) [47] | UFPR05 | PUCPR | 0.9779 | |
| Martin et al. (SVM) [47] | UFPR05 | PUCPR | 0.9405 | |
| PKLot [4] | UFPR05 | PUCPR | 0.9761 | |
| CarNet | PUCPR | UFPR04 | 98.45 | CarNet |
| Martin et al. (LR) [47] | PUCPR | UFPR04 | 0.9829 | |
| Martin et al. (SVM) [47] | PUCPR | UFPR04 | 0.9843 | |
| PKLot [4] | PUCPR | UFPR04 | 0.9589 | |
| CarNet | PUCPR | UFPR05 | 99.38 | CarNet |
| Martin et al. (LR) [47] | PUCPR | UFPR05 | 0.9457 | |
| Martin et al. (SVM) [47] | PUCPR | UFPR05 | 0.9401 | |
| PKLot [4] | PUCPR | UFPR05 | 0.9152 | |
| CarNet | PUCPR | UFPR05 | 99.86 | PKLot [4] |
| Martin et al. (LR) [47] | PUCPR | UFPR05 | 0.9994 | |
| Martin et al. (SVM) [47] | PUCPR | UFPR05 | 0.9994 | |
| PKLot [4] | PUCPR | UFPR05 | 0.9999 |
© 2019 by the authors. Licensee MDPI, Basel, Switzerland. This article is an open access article distributed under the terms and conditions of the Creative Commons Attribution (CC BY) license (http://creativecommons.org/licenses/by/4.0/).
Share and Cite
Nurullayev, S.; Lee, S.-W. Generalized Parking Occupancy Analysis Based on Dilated Convolutional Neural Network. Sensors 2019, 19, 277. https://doi.org/10.3390/s19020277
Nurullayev S, Lee S-W. Generalized Parking Occupancy Analysis Based on Dilated Convolutional Neural Network. Sensors. 2019; 19(2):277. https://doi.org/10.3390/s19020277
Chicago/Turabian StyleNurullayev, Sherzod, and Sang-Woong Lee. 2019. "Generalized Parking Occupancy Analysis Based on Dilated Convolutional Neural Network" Sensors 19, no. 2: 277. https://doi.org/10.3390/s19020277
APA StyleNurullayev, S., & Lee, S.-W. (2019). Generalized Parking Occupancy Analysis Based on Dilated Convolutional Neural Network. Sensors, 19(2), 277. https://doi.org/10.3390/s19020277