Indoor Positioning on Disparate Commercial Smartphones Using Wi-Fi Access Points Coverage Area


Abstract
:1. Introduction
- An indoor positioning approach is presented which solves the problem of device dependence. The proposed approach is tested with three different smartphones including Galaxy S8, LG G6, and LG G7.
- The proposed approach is tested in a static as well as dynamic environment with human presence. The impact of human body loss is evaluated at a public place with low, medium, and high human presence.
- The proposed approach works with different phone orientations in a similar fashion. Also, the testing is performed with user data while walking in different directions.
2. Limitations of Wi-Fi Fingerprinting Positioning
2.1. Similar RSS at Distinct Locations
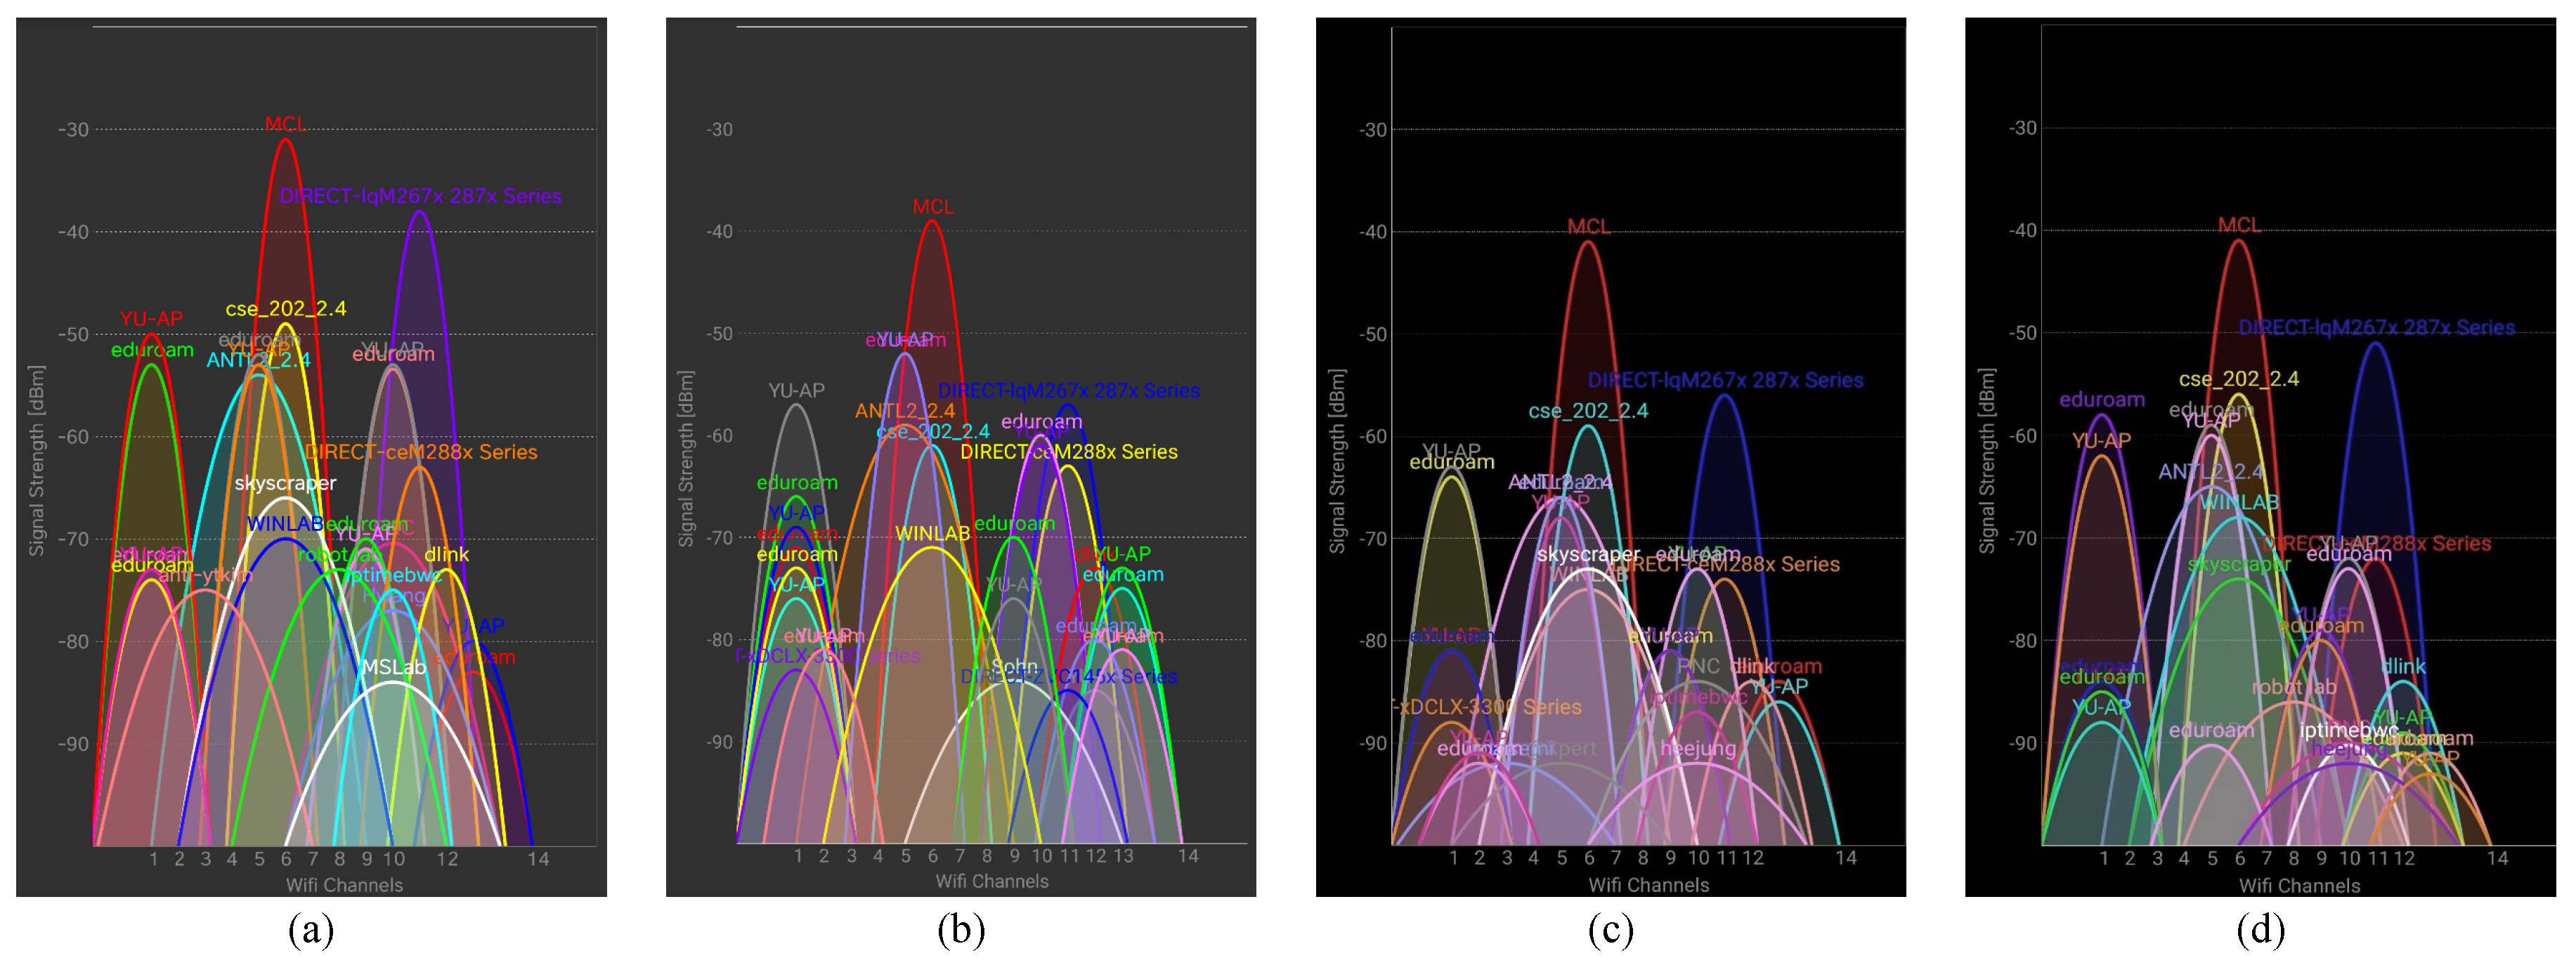
2.2. Impact of Device Diversity
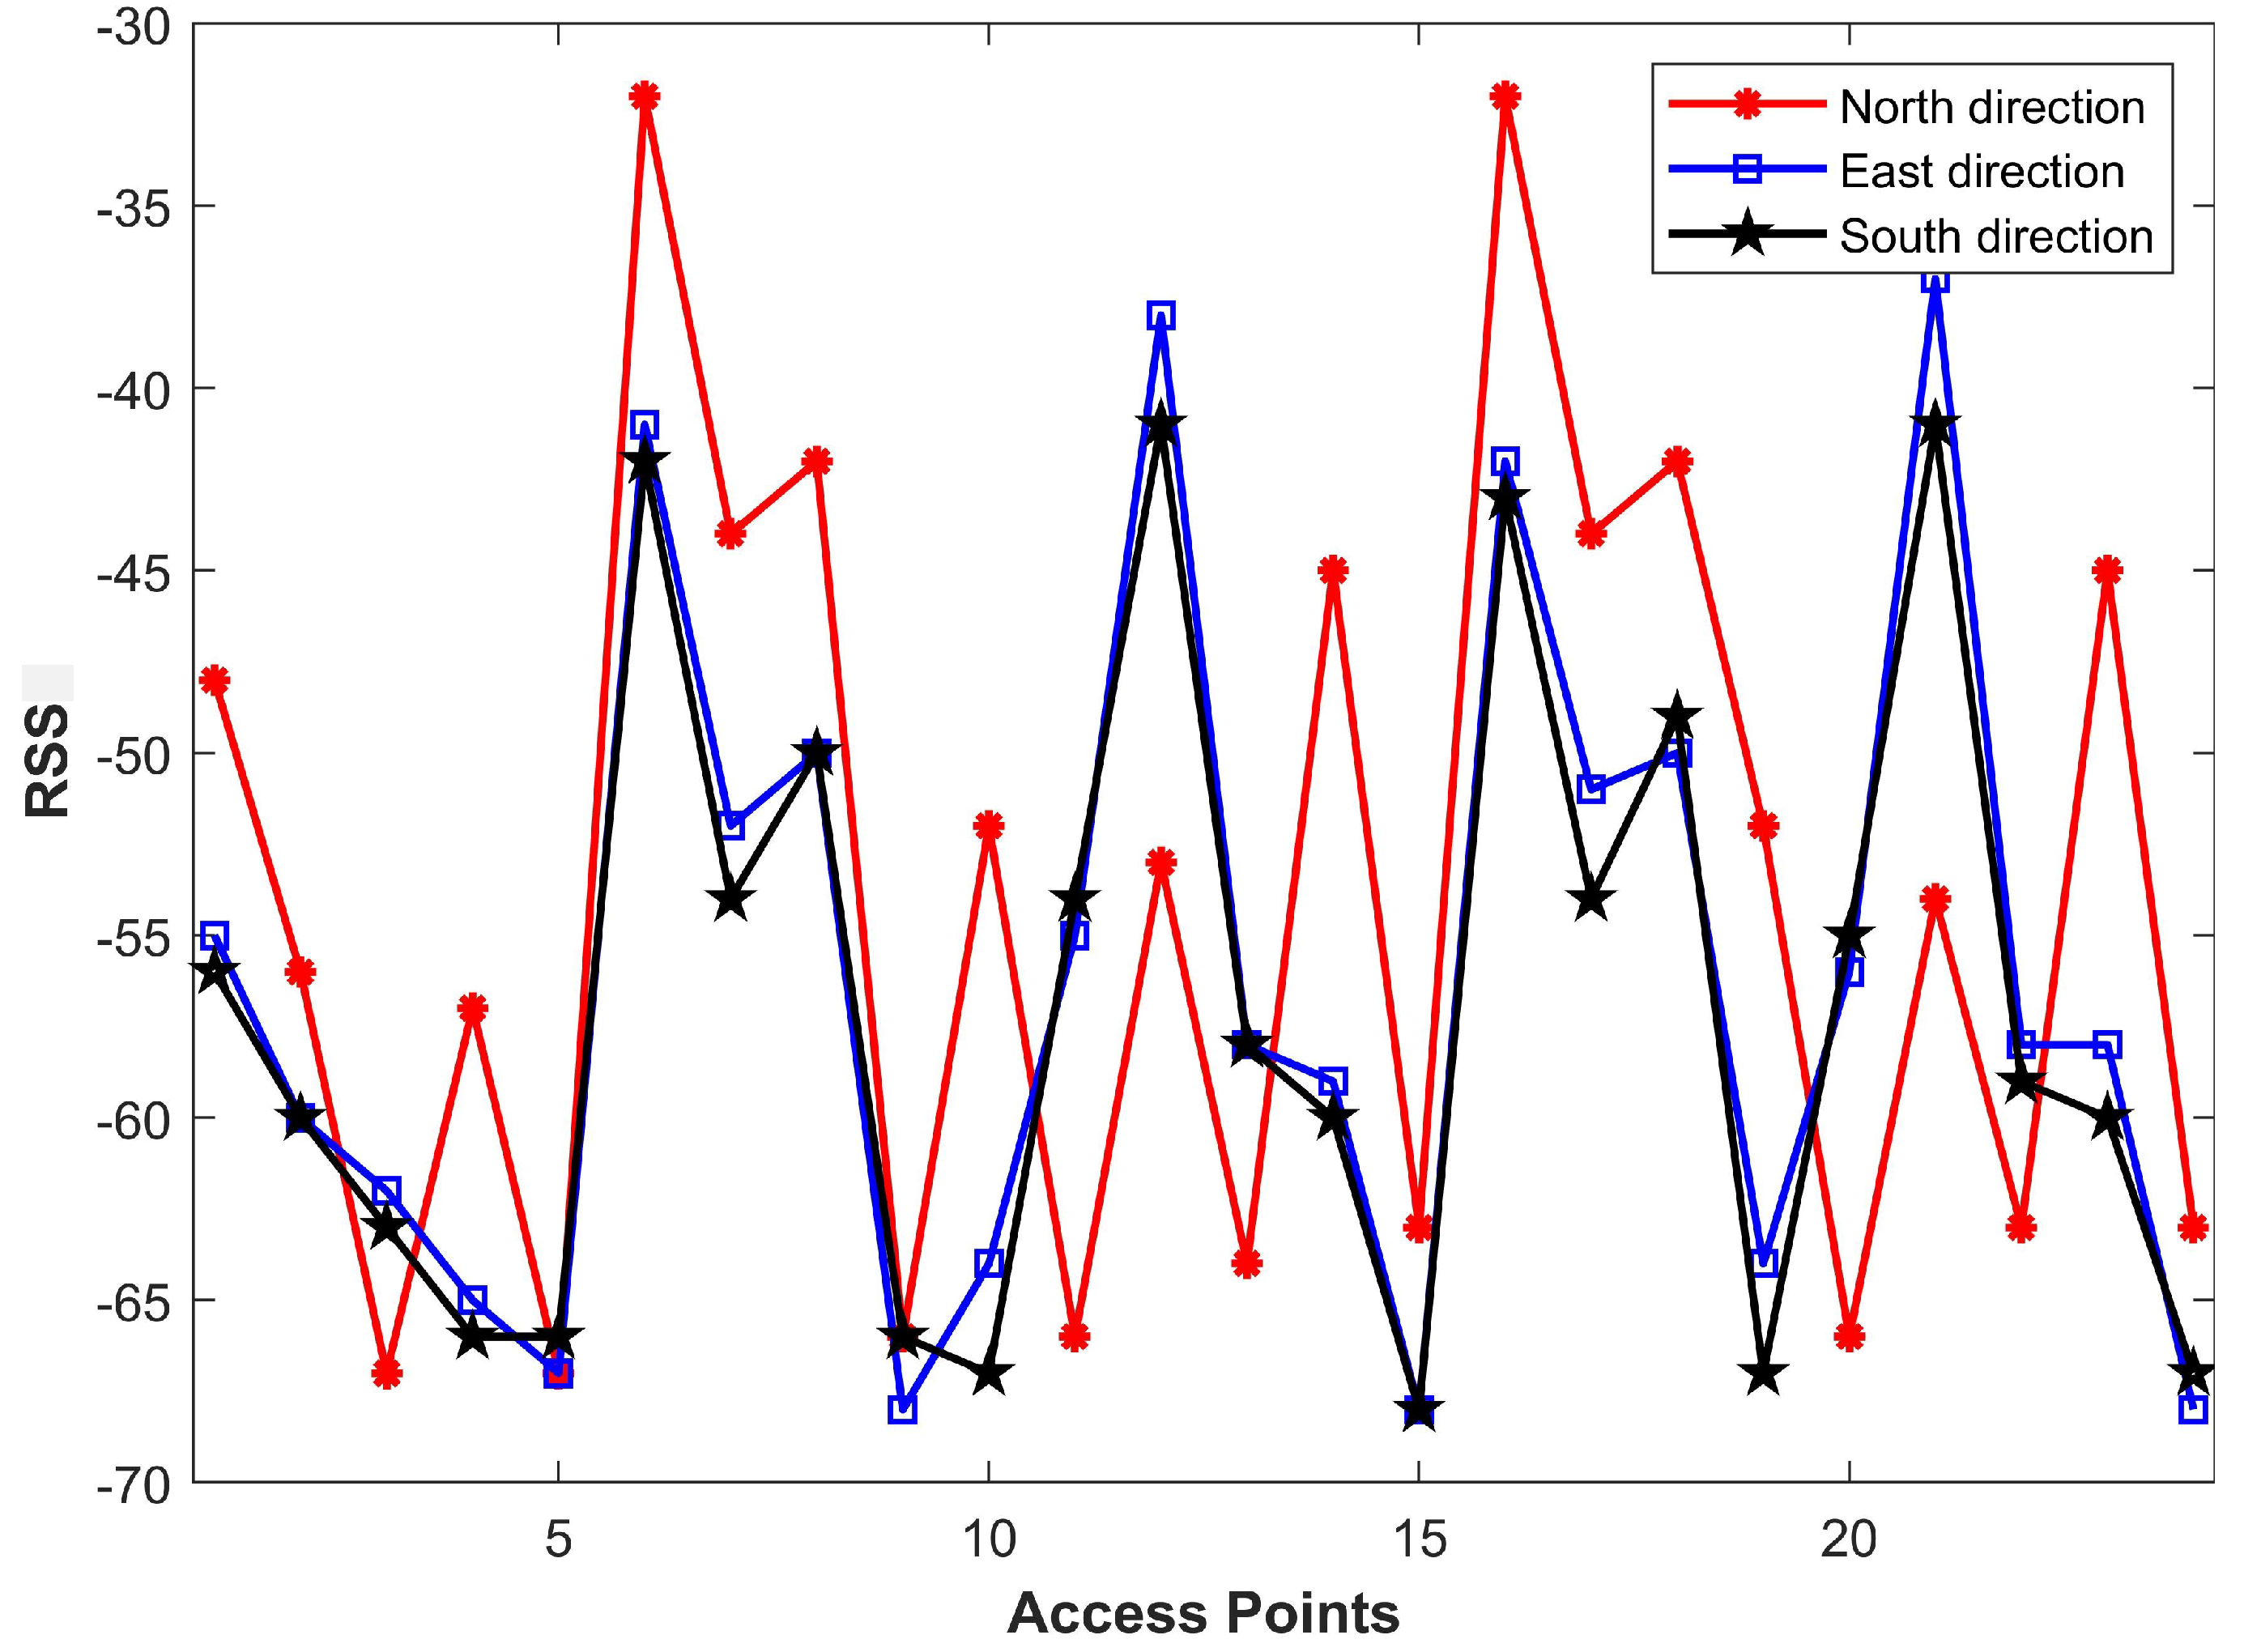
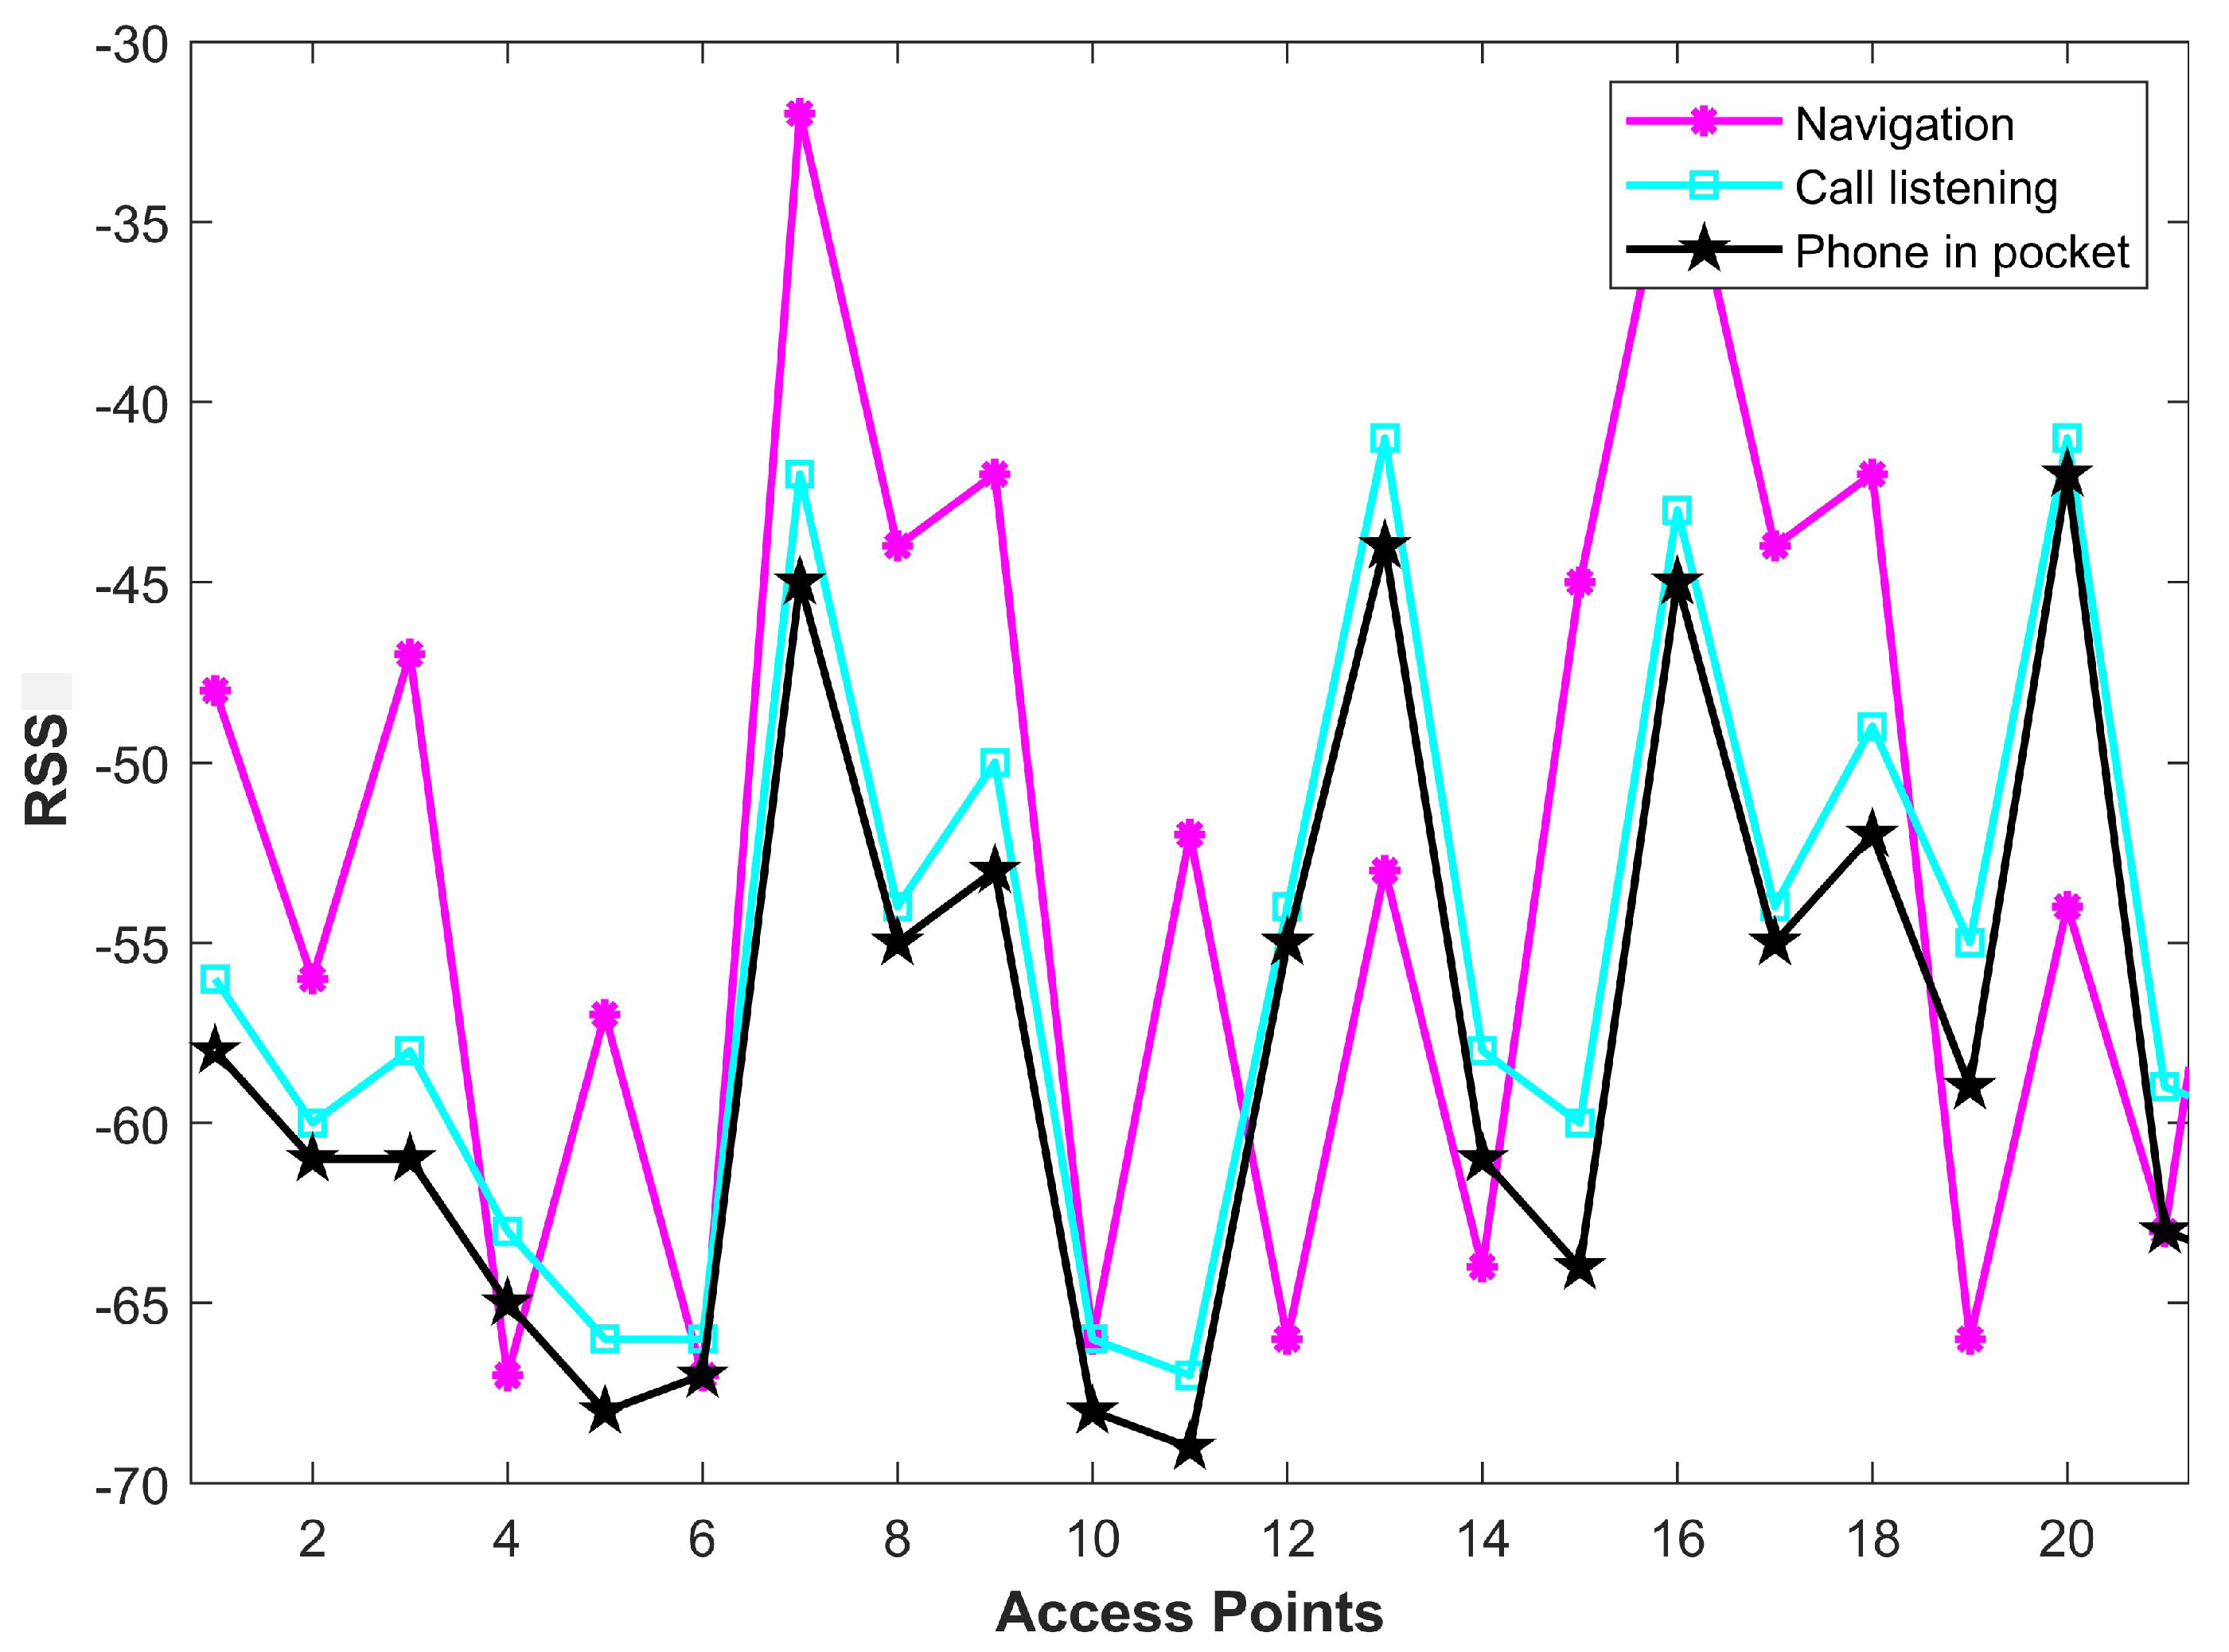
2.3. Phone Orientation and User’s Direction
2.4. Varying Indoor Conditions and RSS
3. Related Work
4. Proposed Approach
4.1. Assumptions for the Proposed Approach
- The Wi-Fi APs’ position remains the same during the training and testing phases.
- We assume that the RSS value at a particular location is normally distributed. The same assumption has been made by other works as well [42].
- Another assumption made is that the RSS values of different APs are independent of other APs.
4.2. Theoretical Formulations of the Proposed Approach
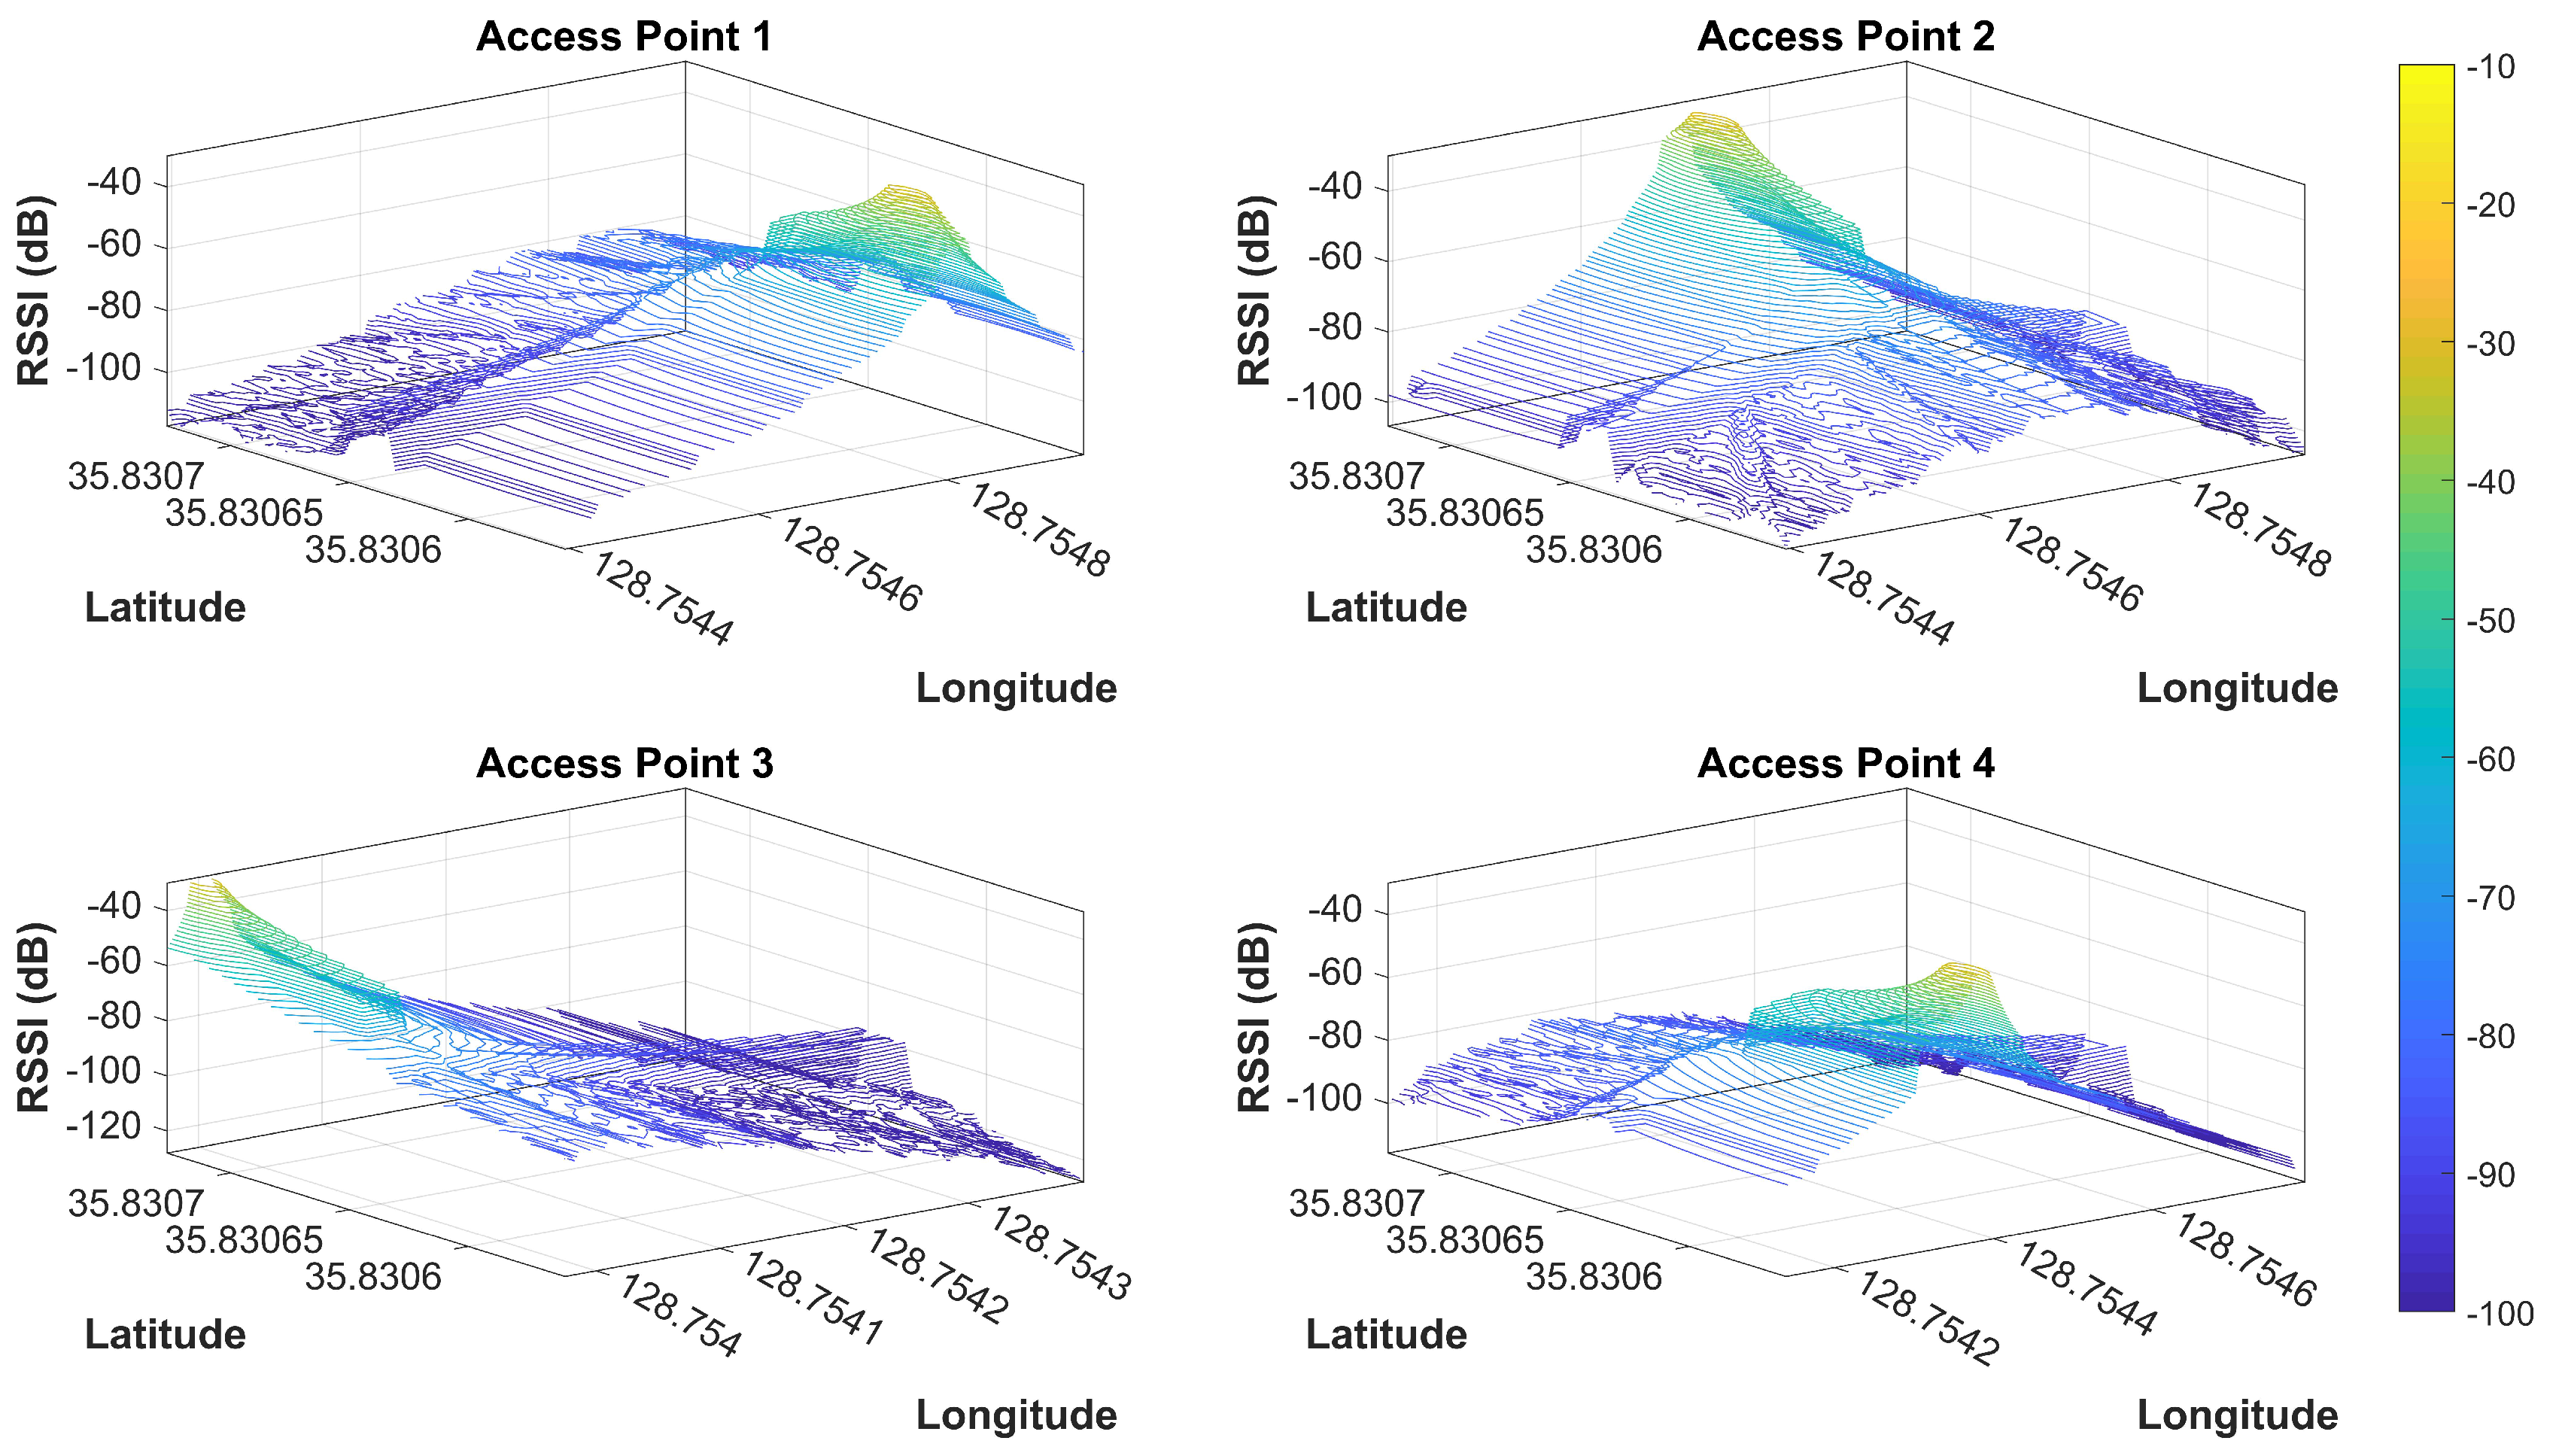
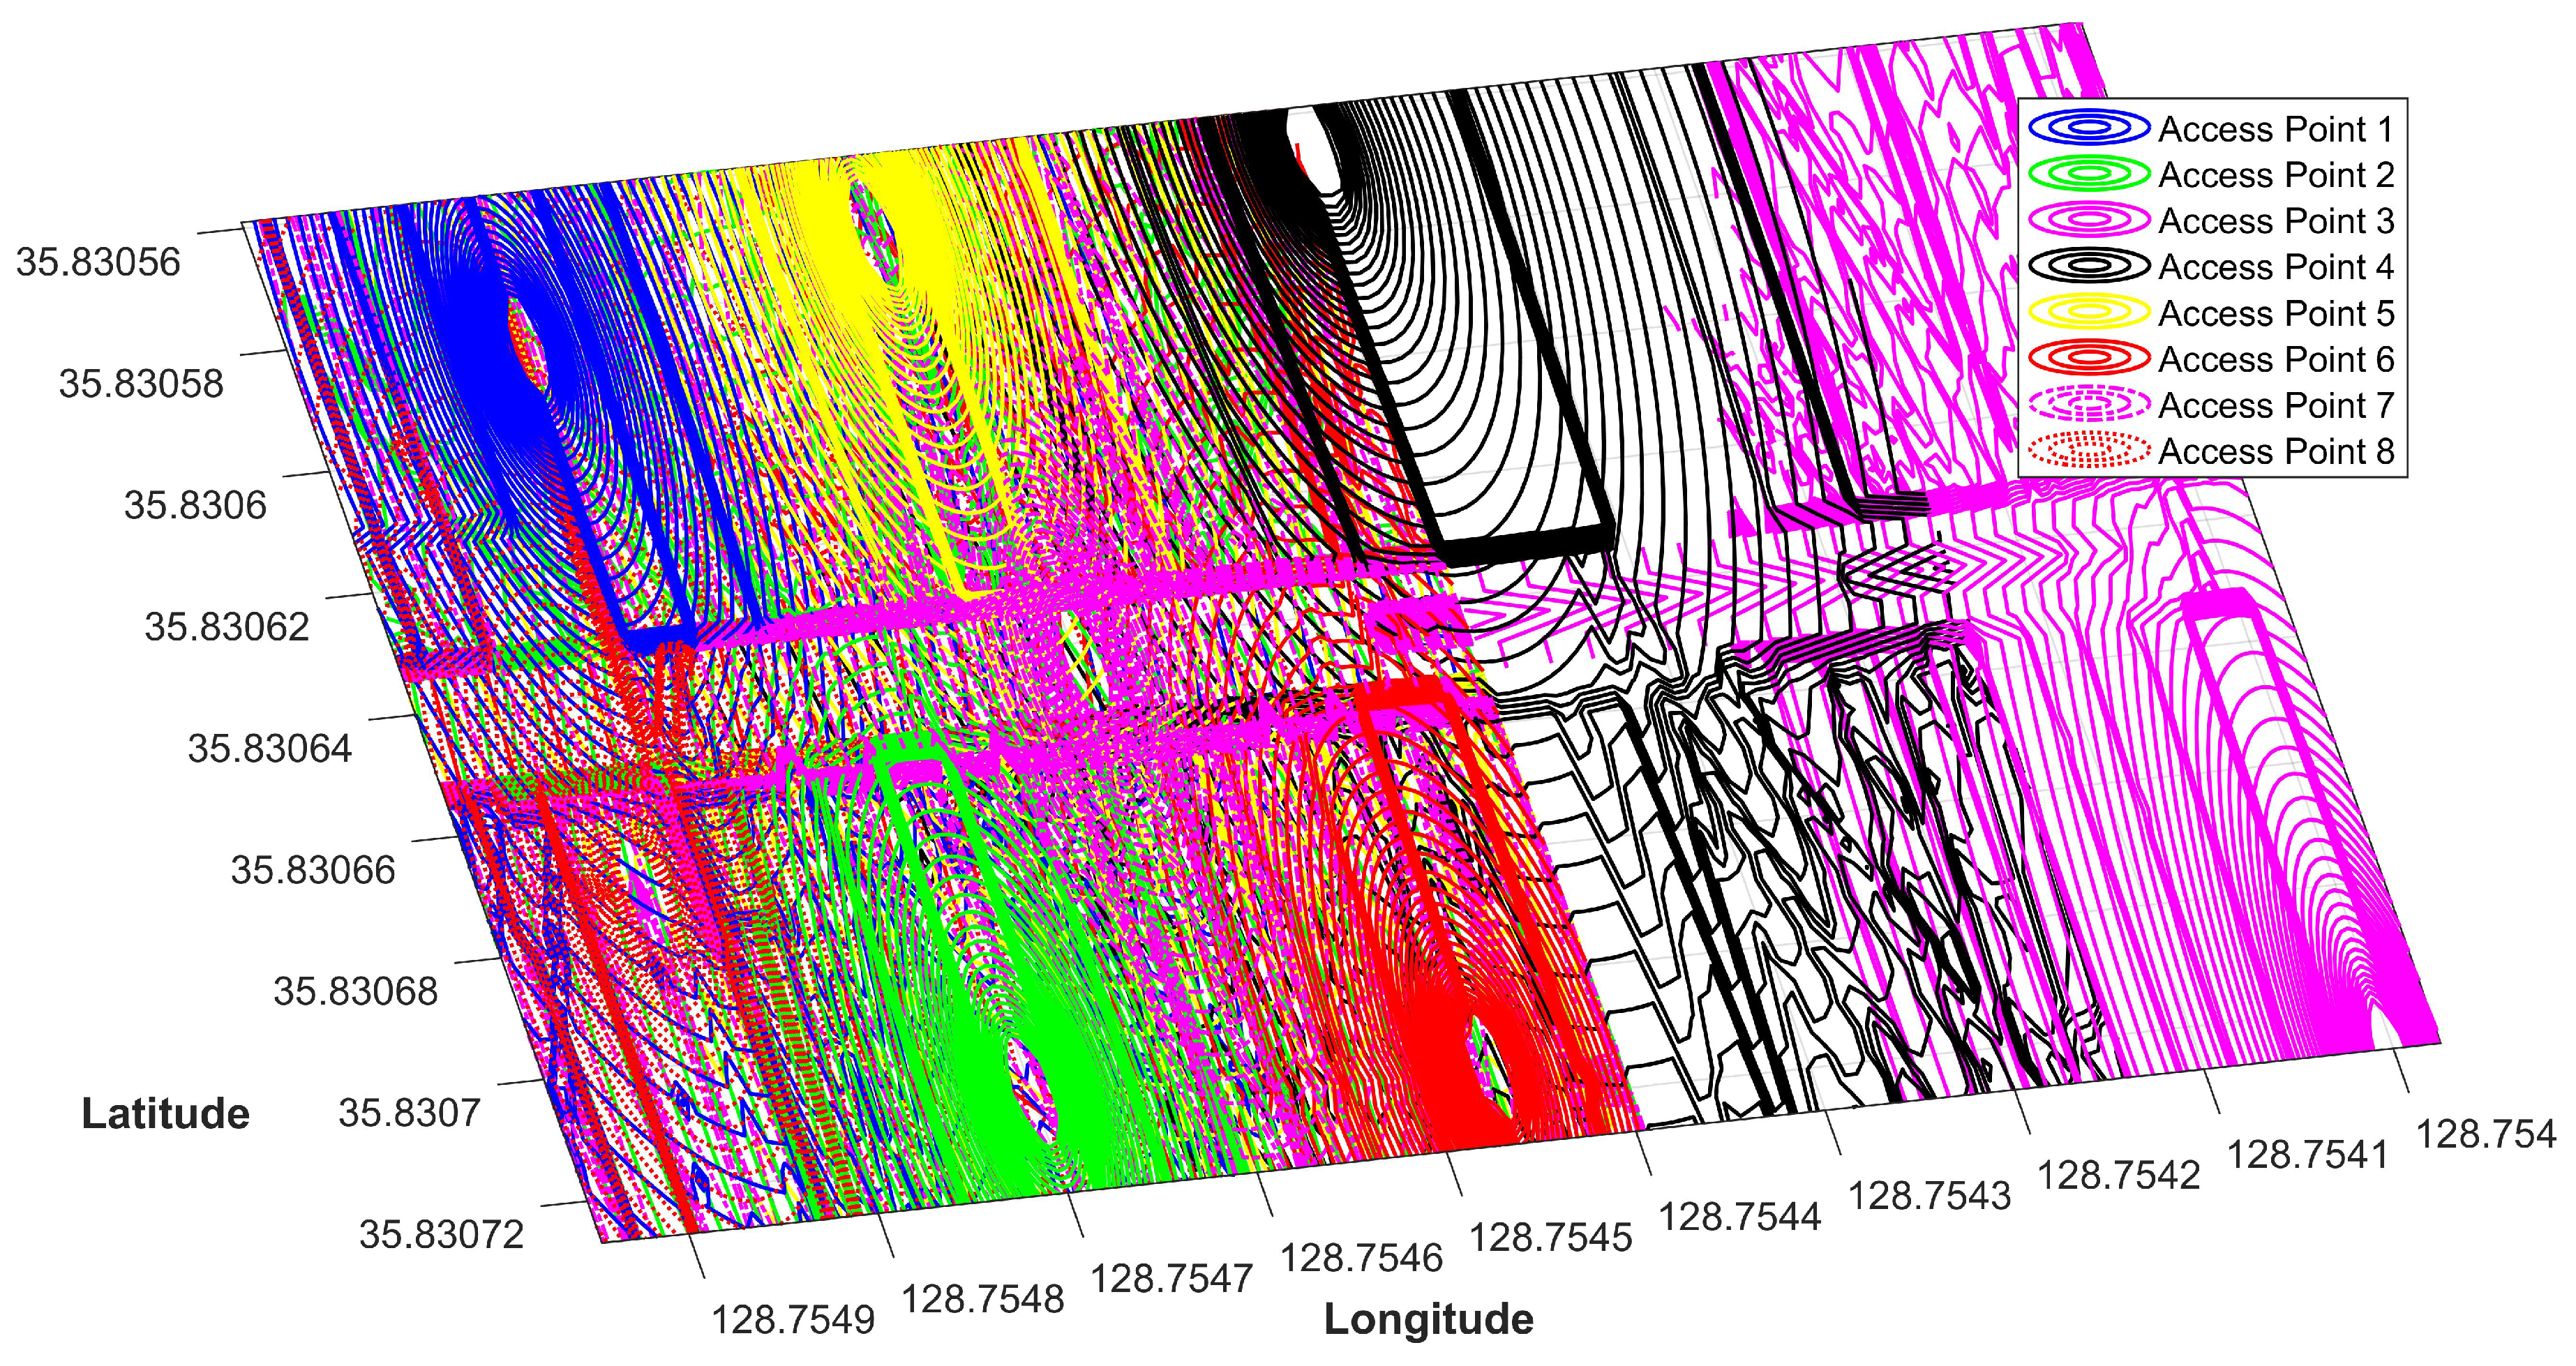
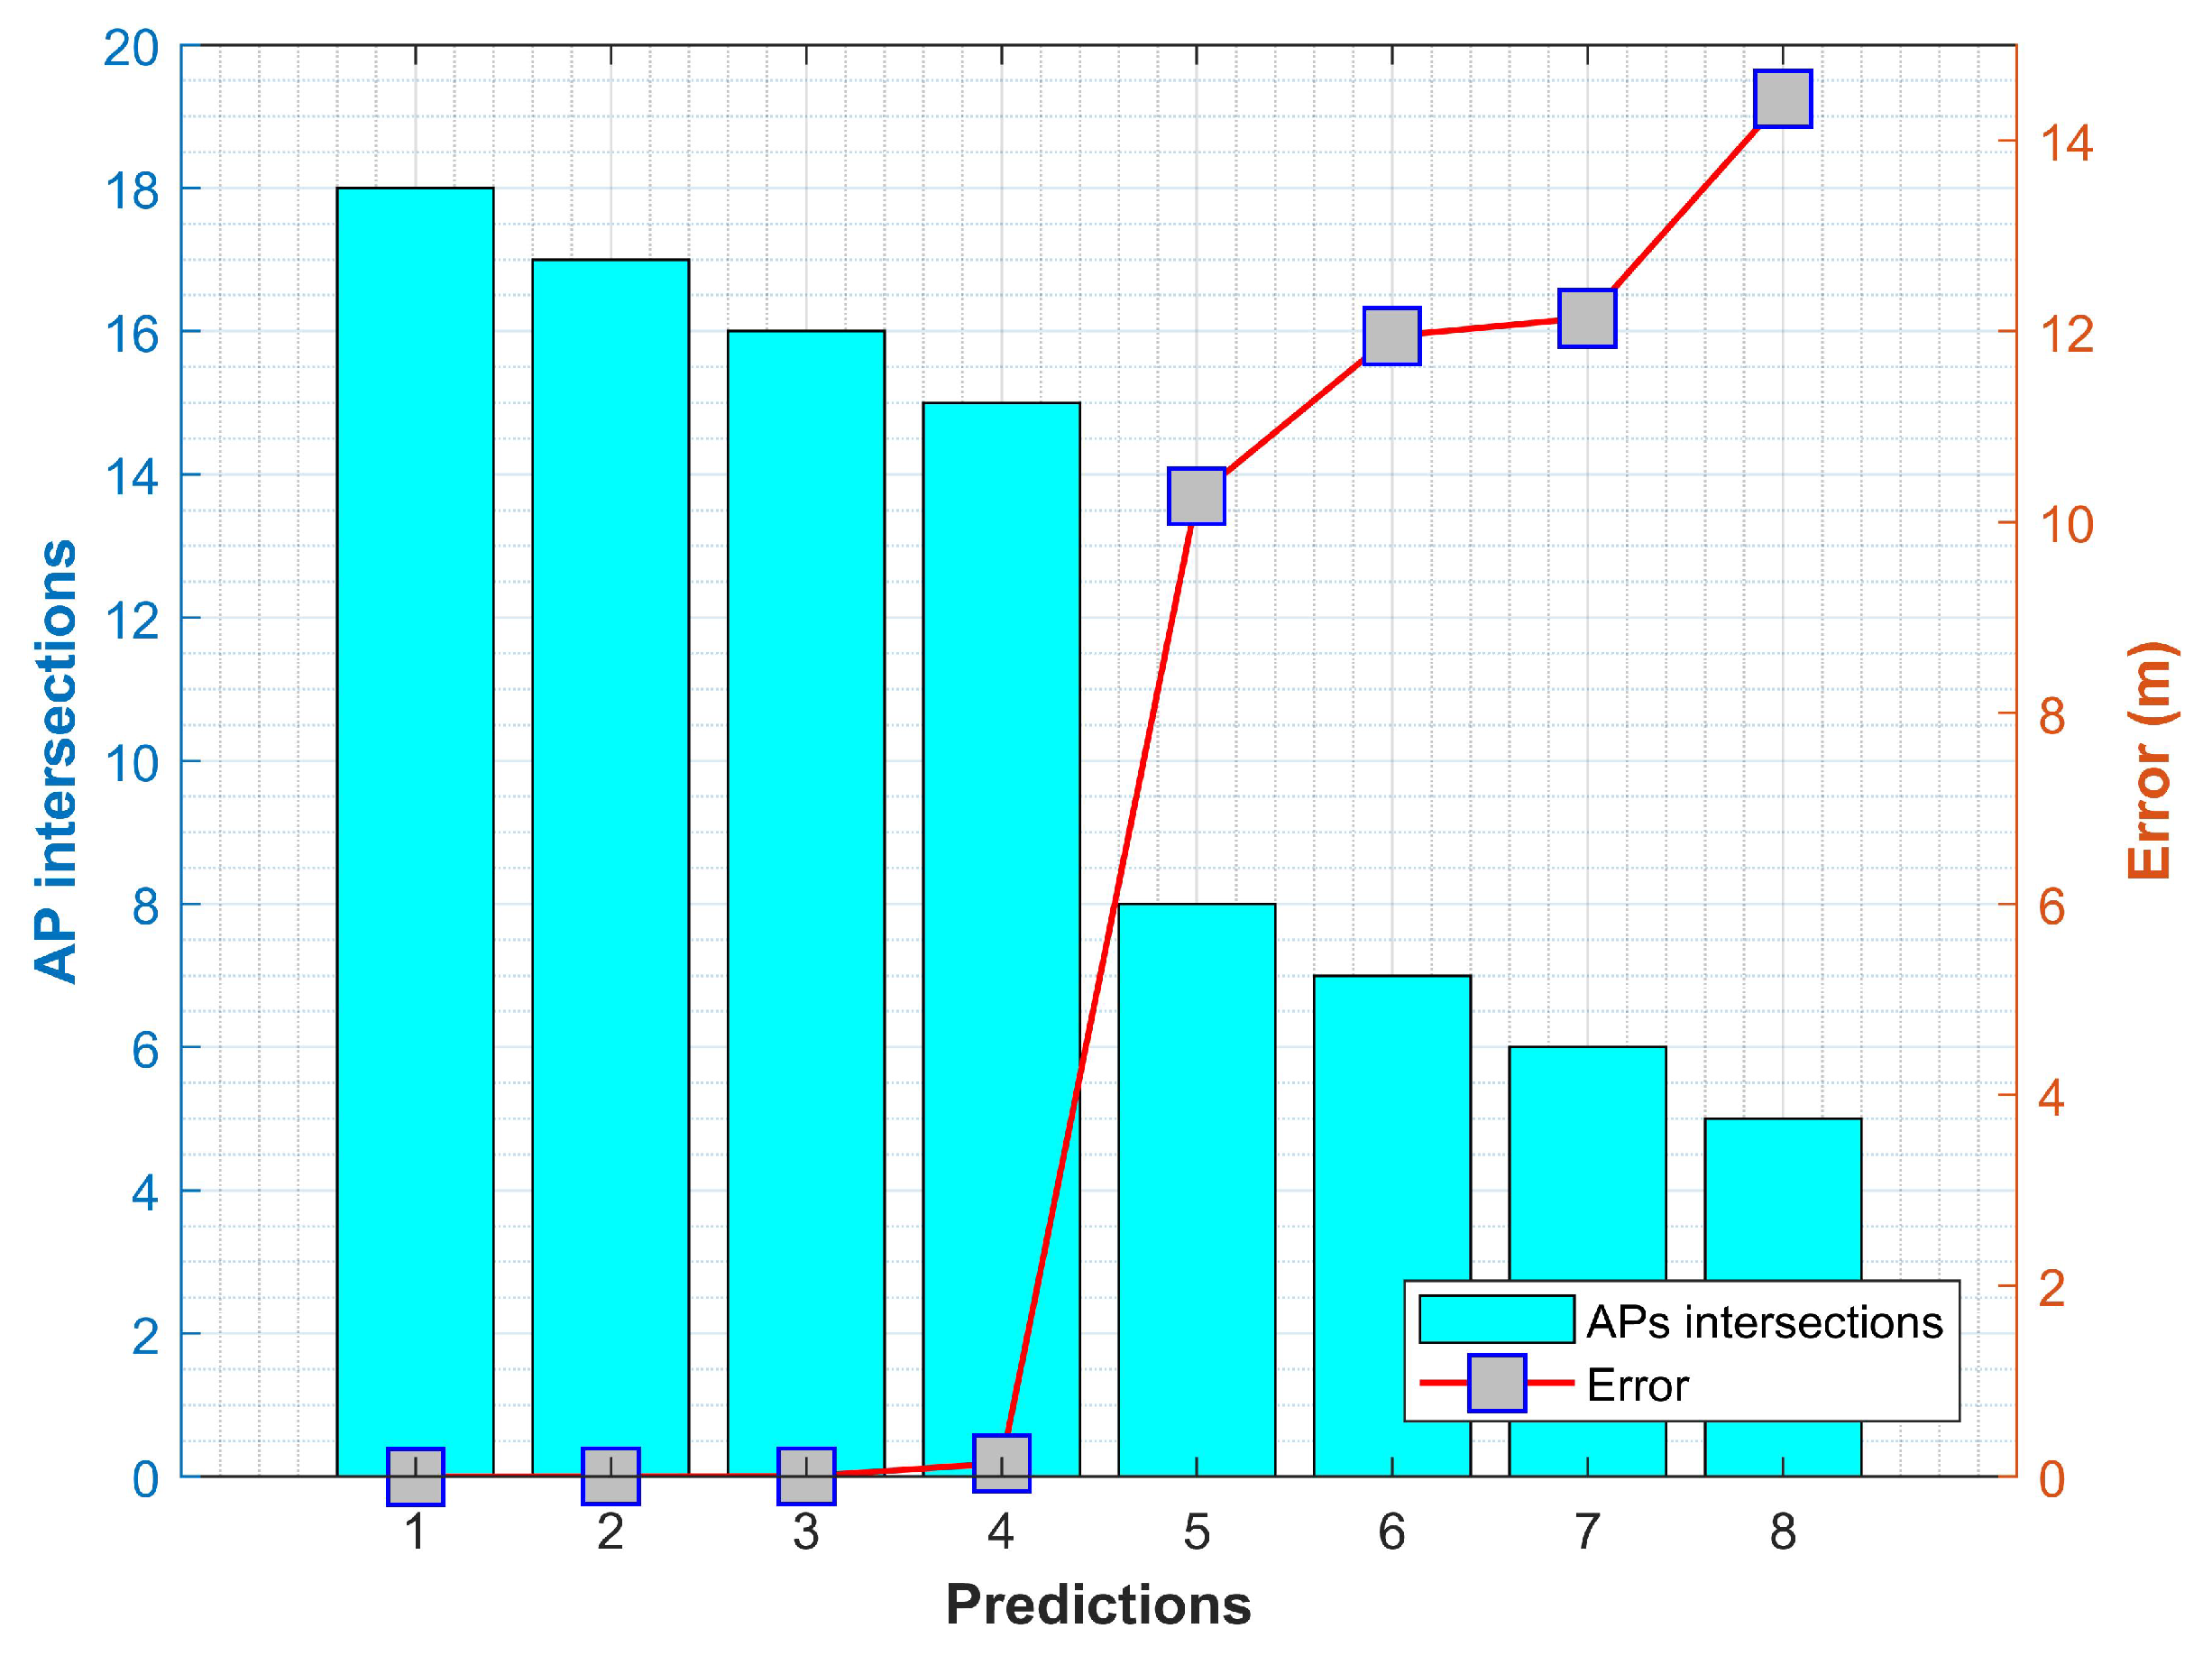
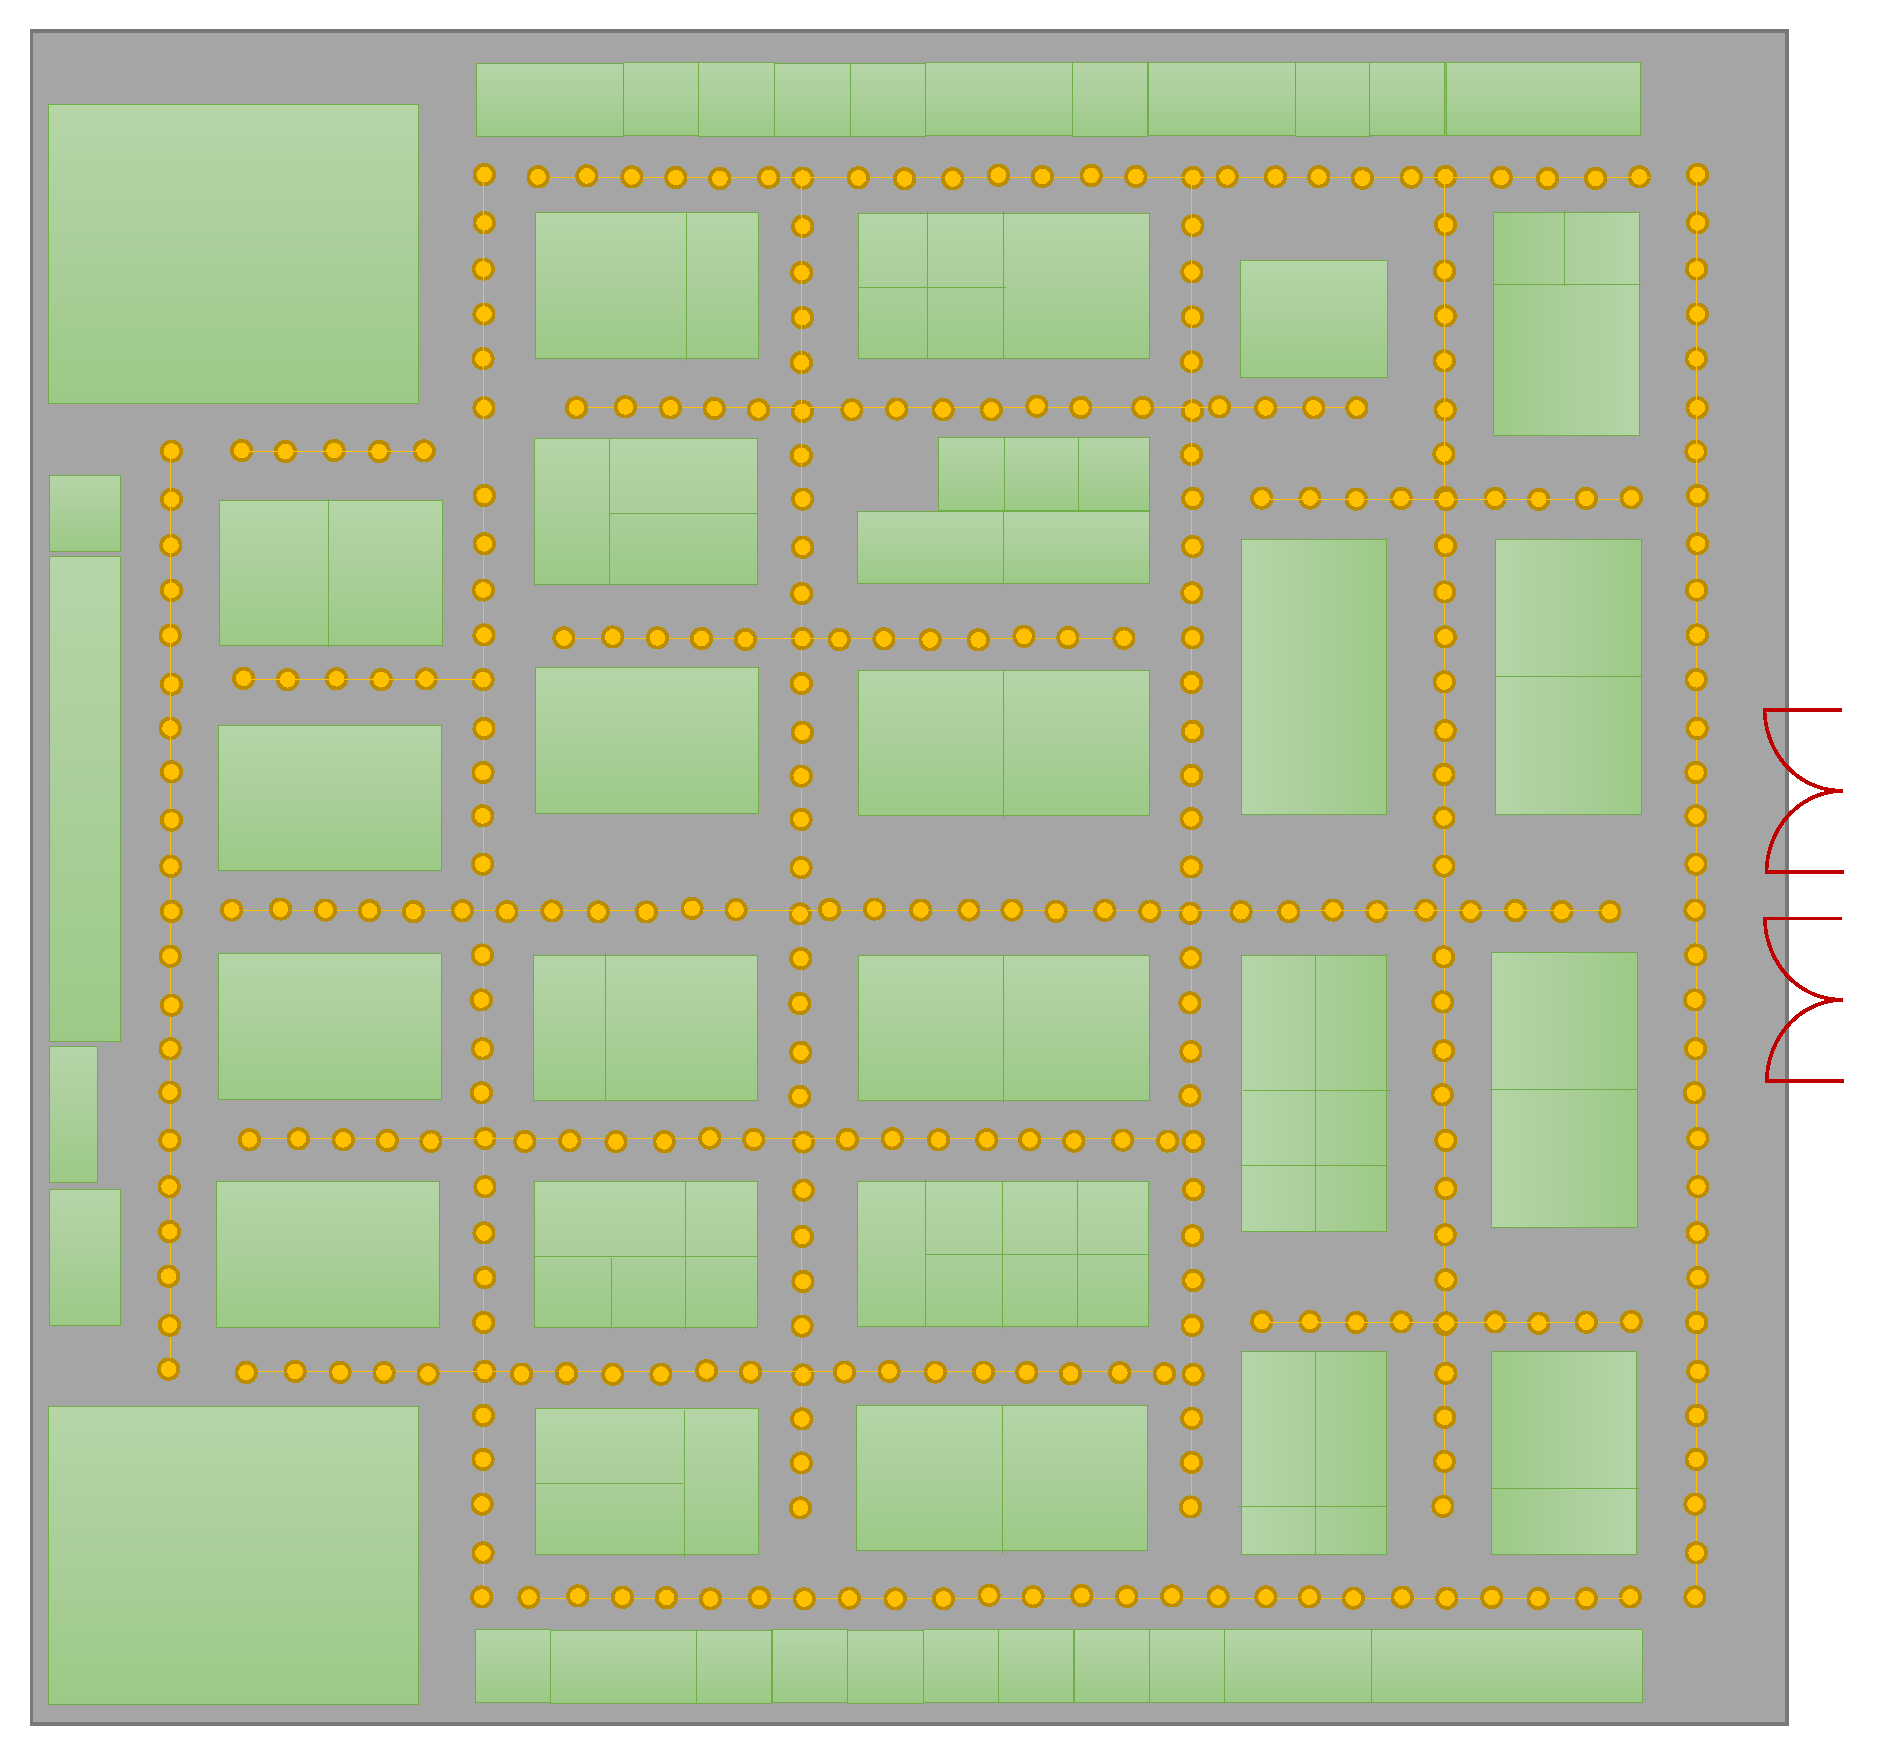
4.2.1. APs Coverage Uniqueness
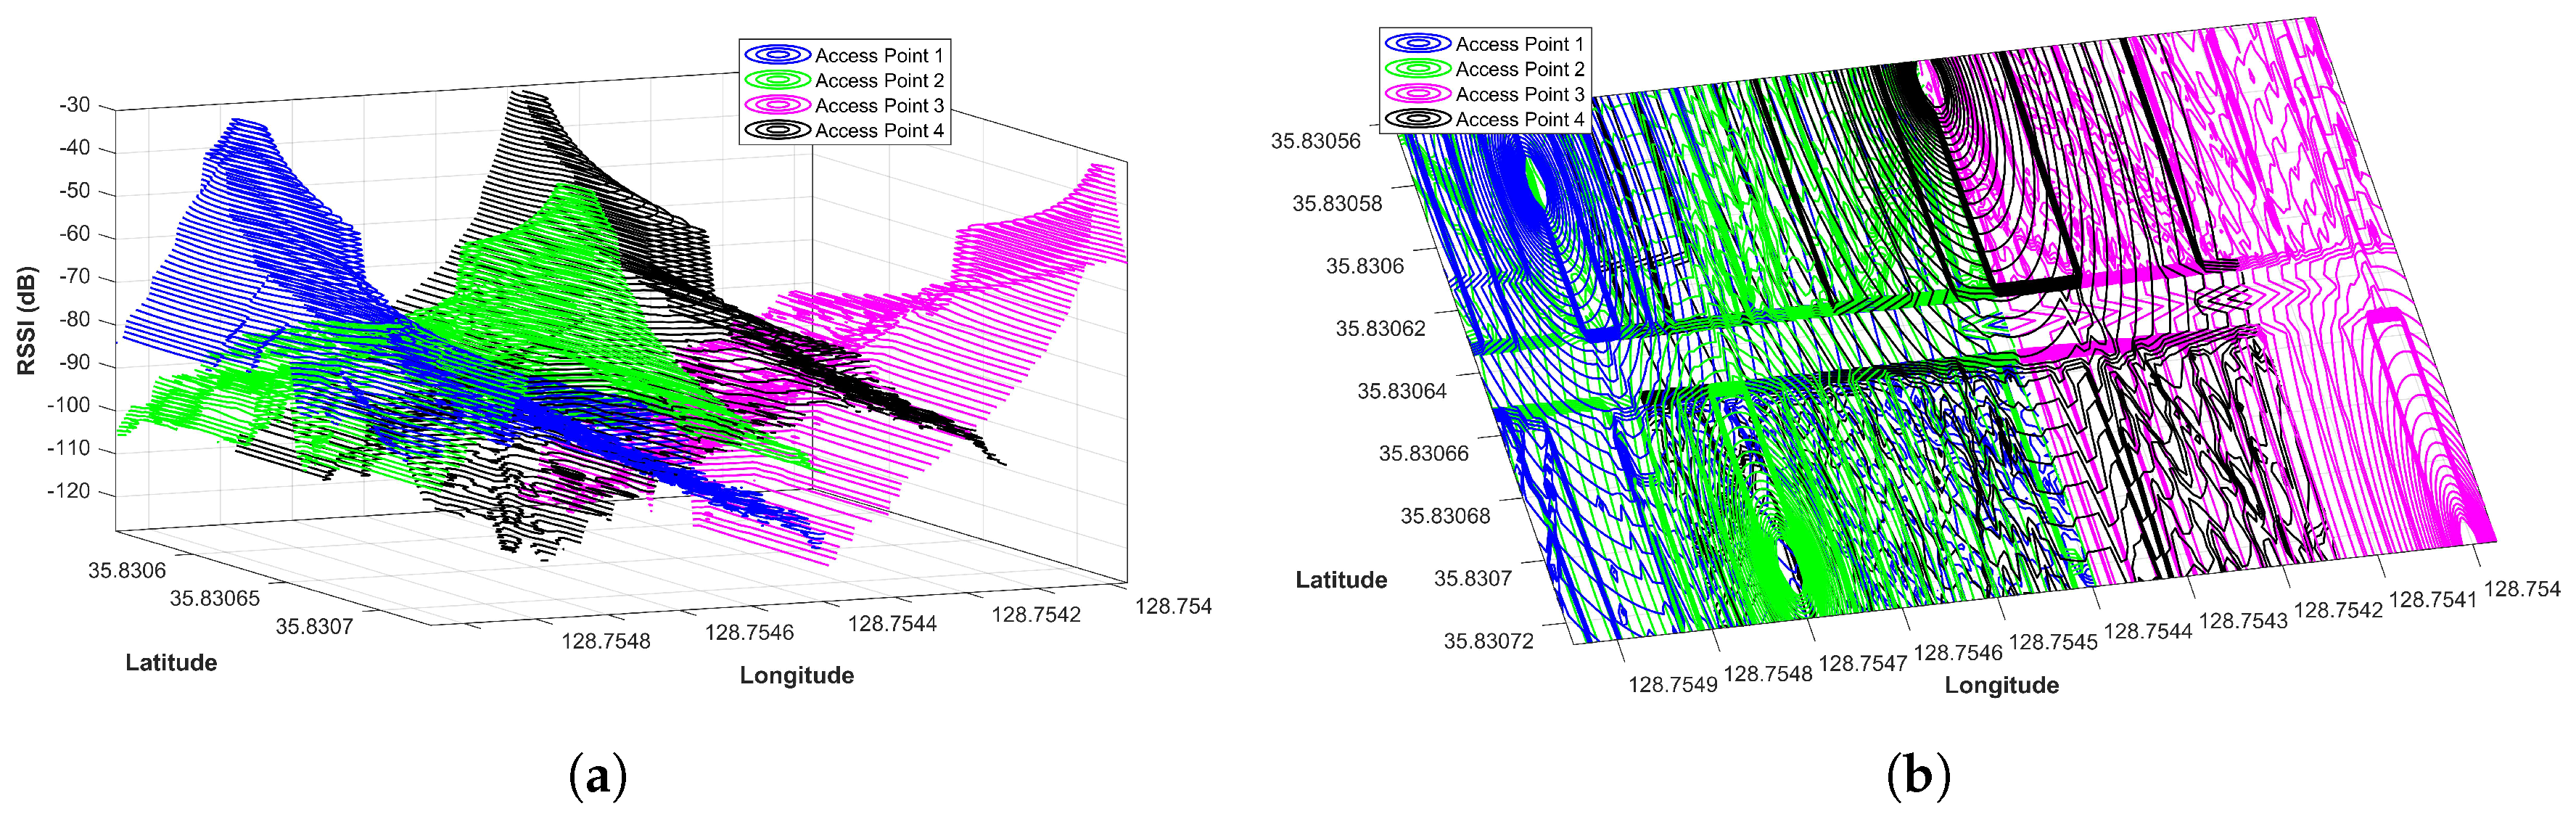
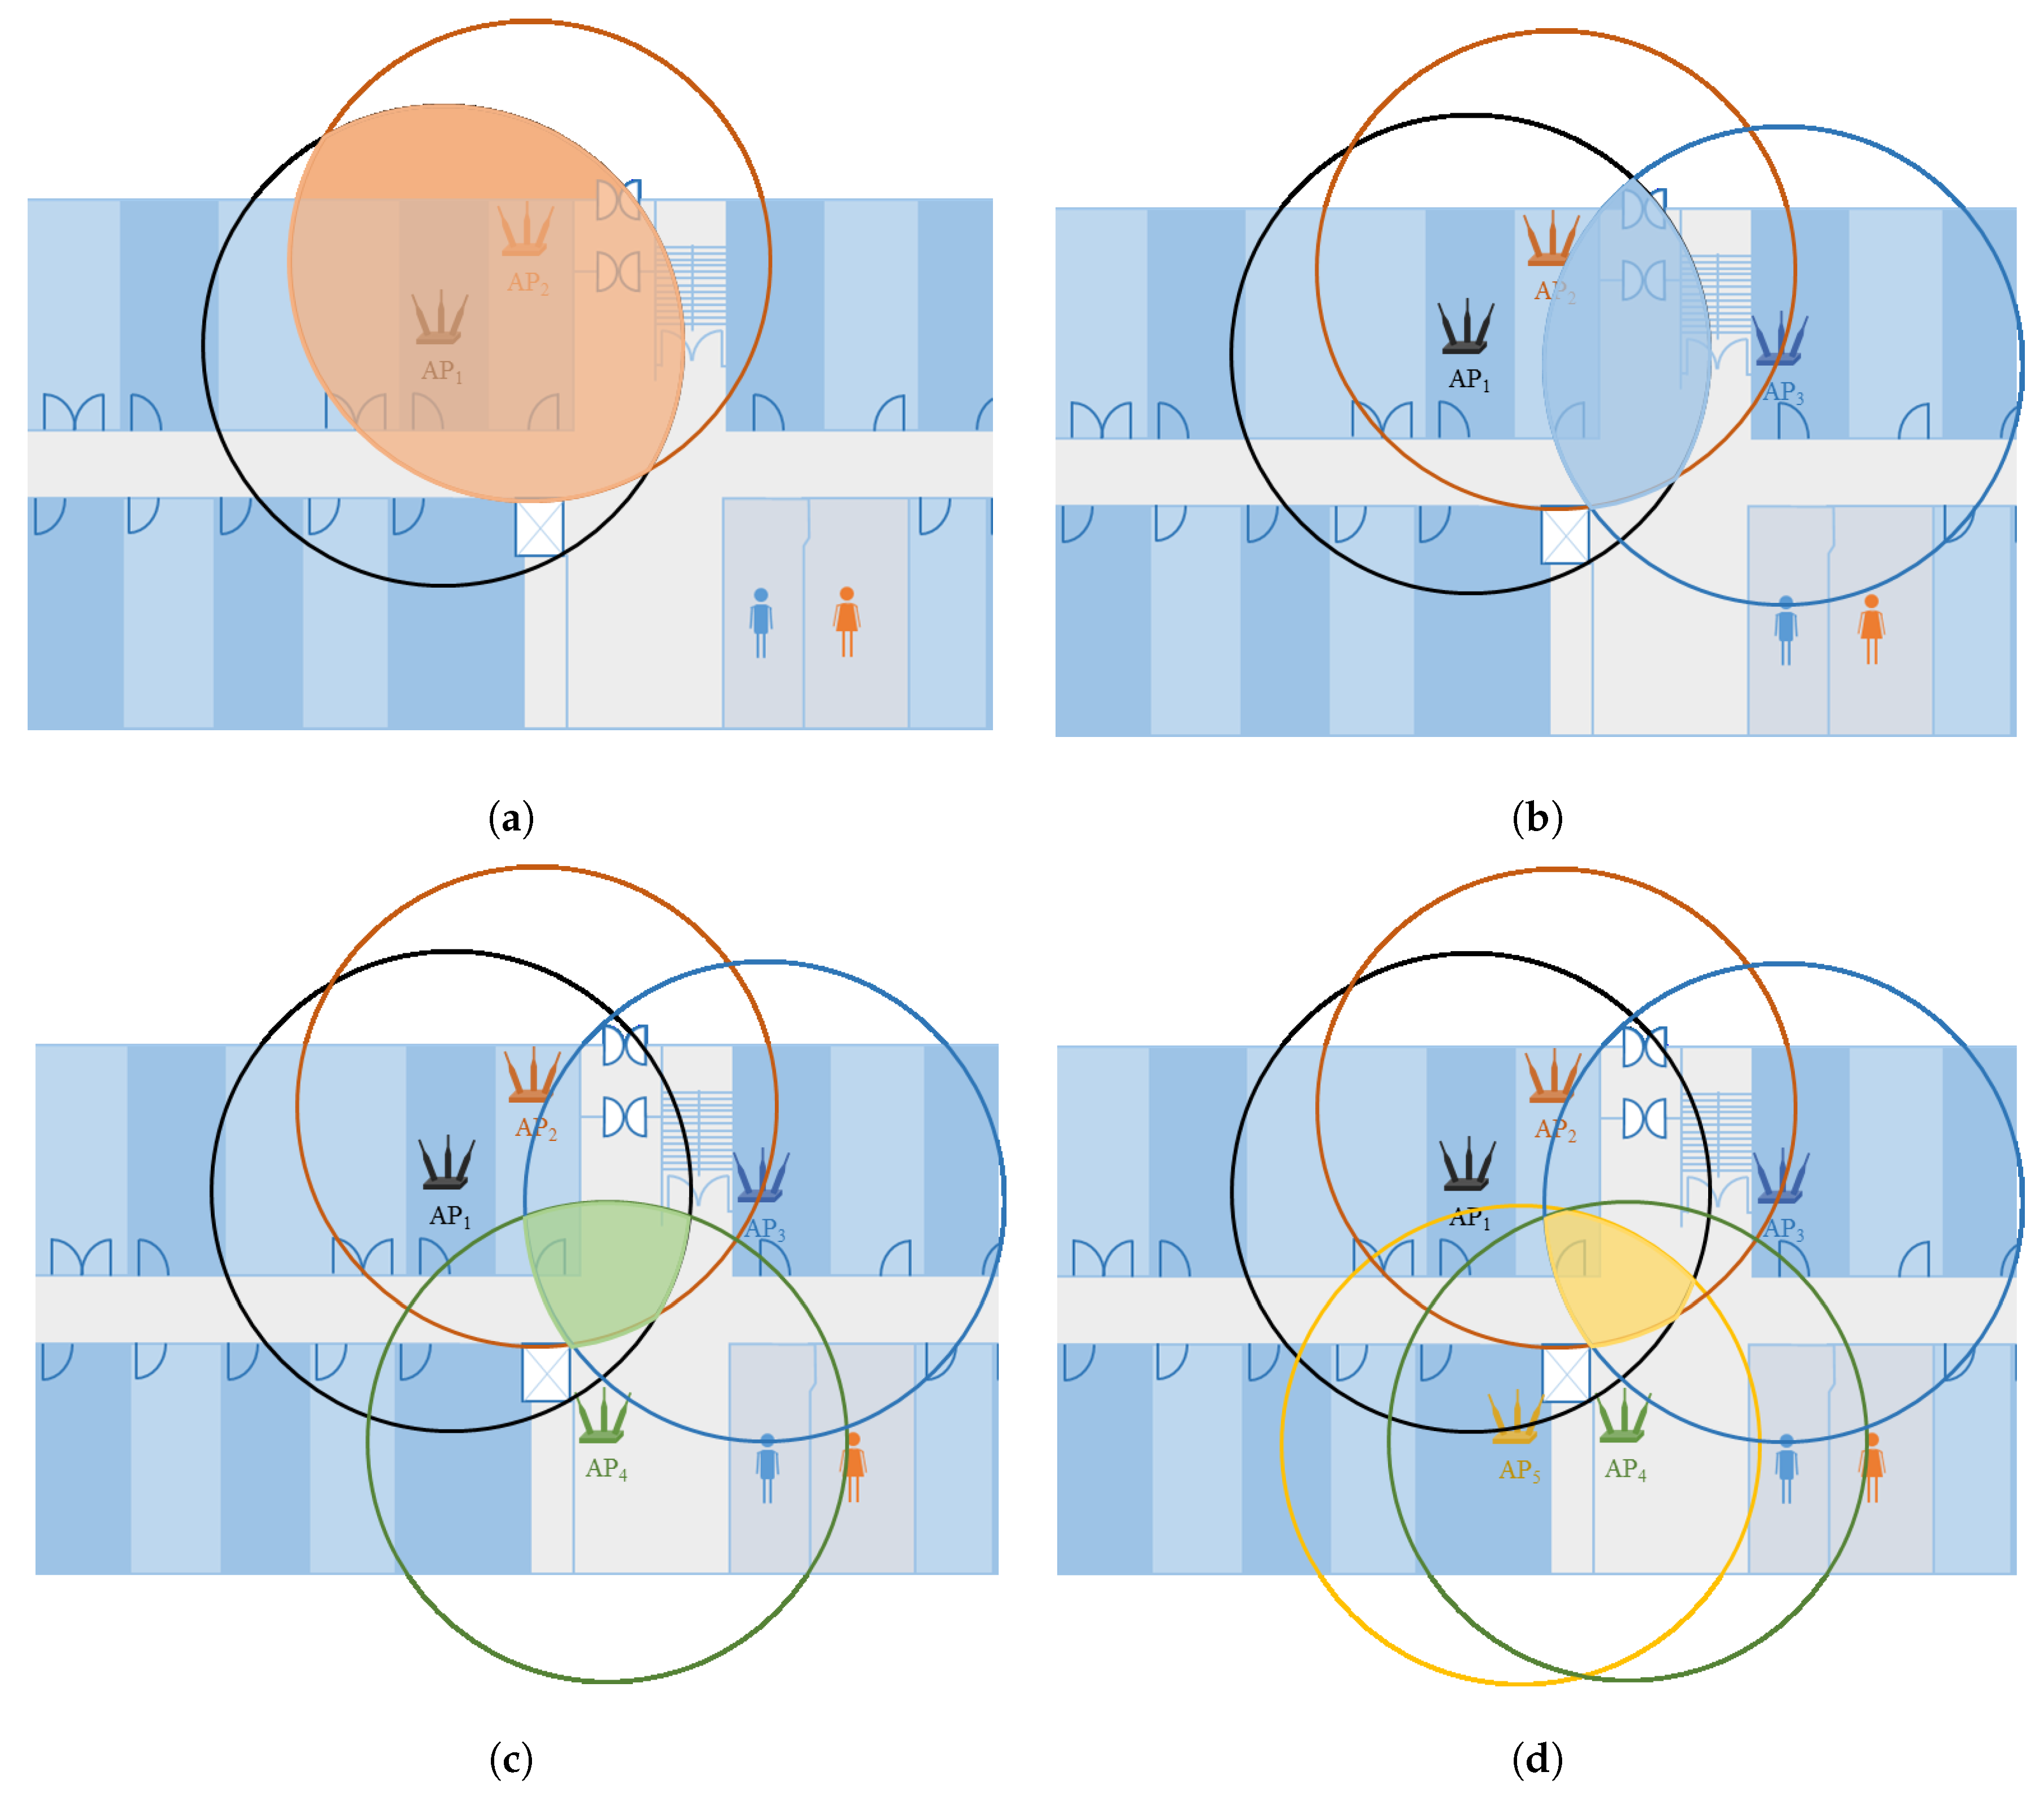
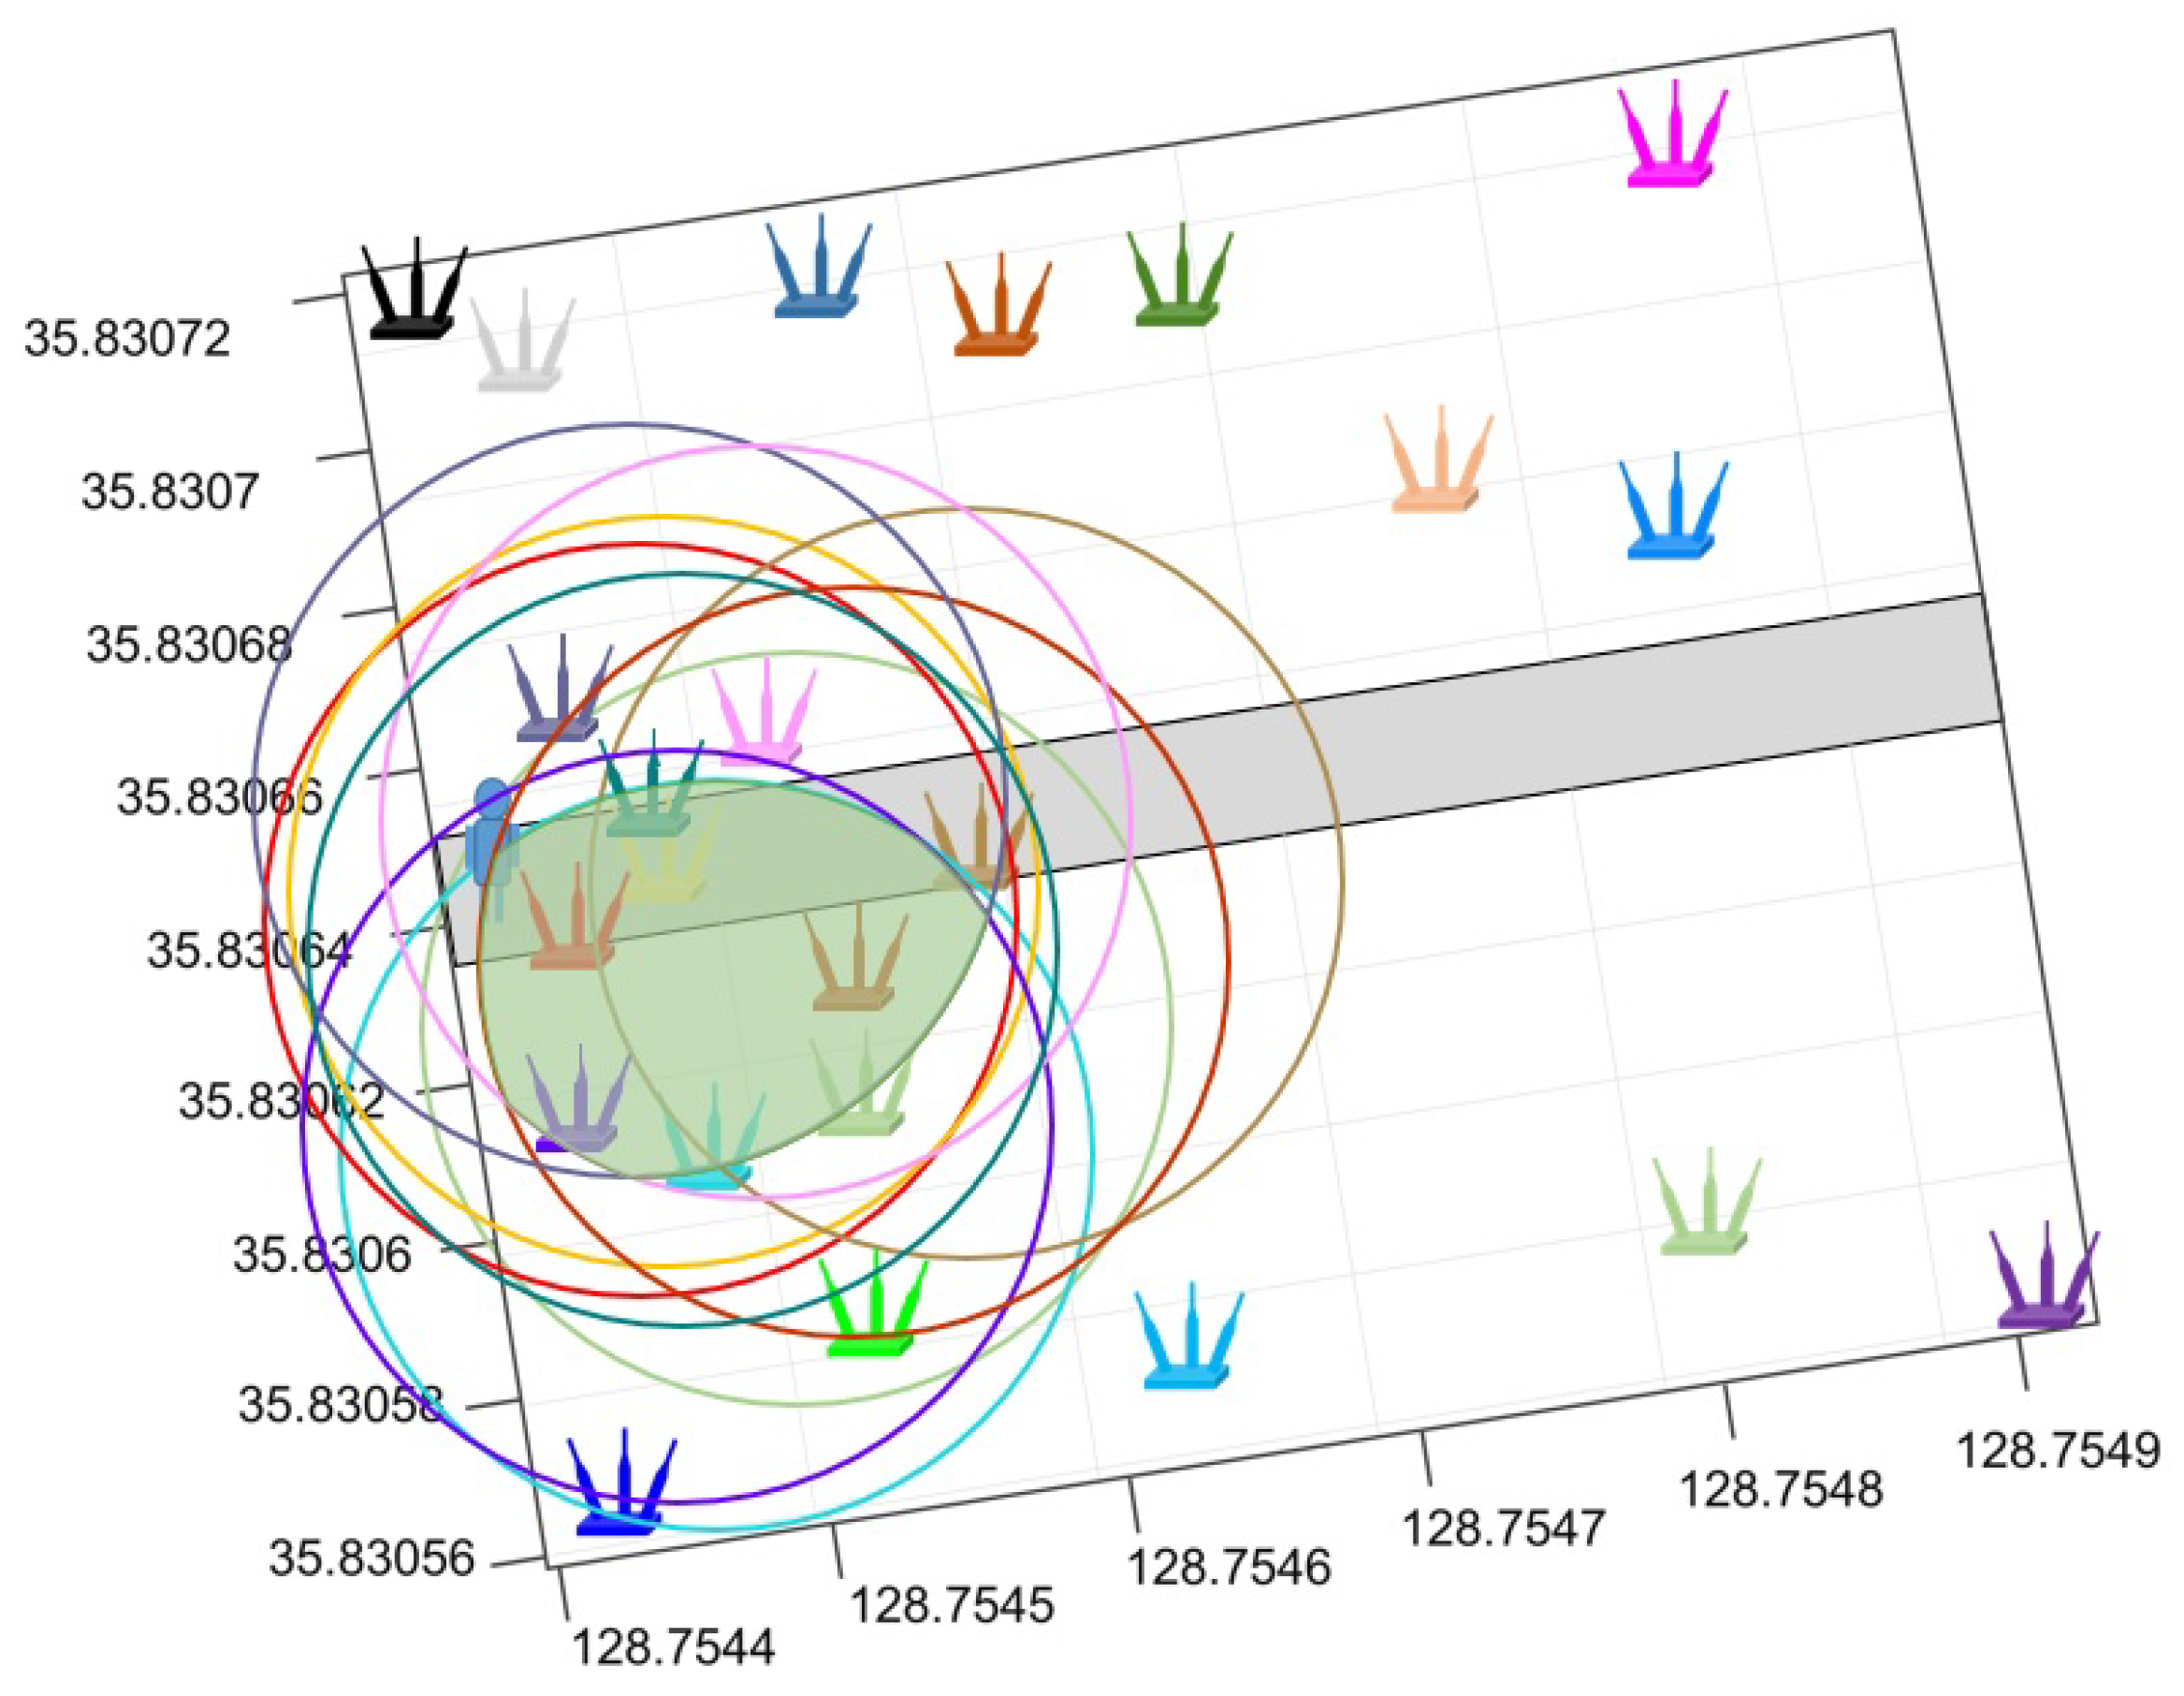
4.2.2. AP Coverage Overlapping
4.3. Fingerprinting Process
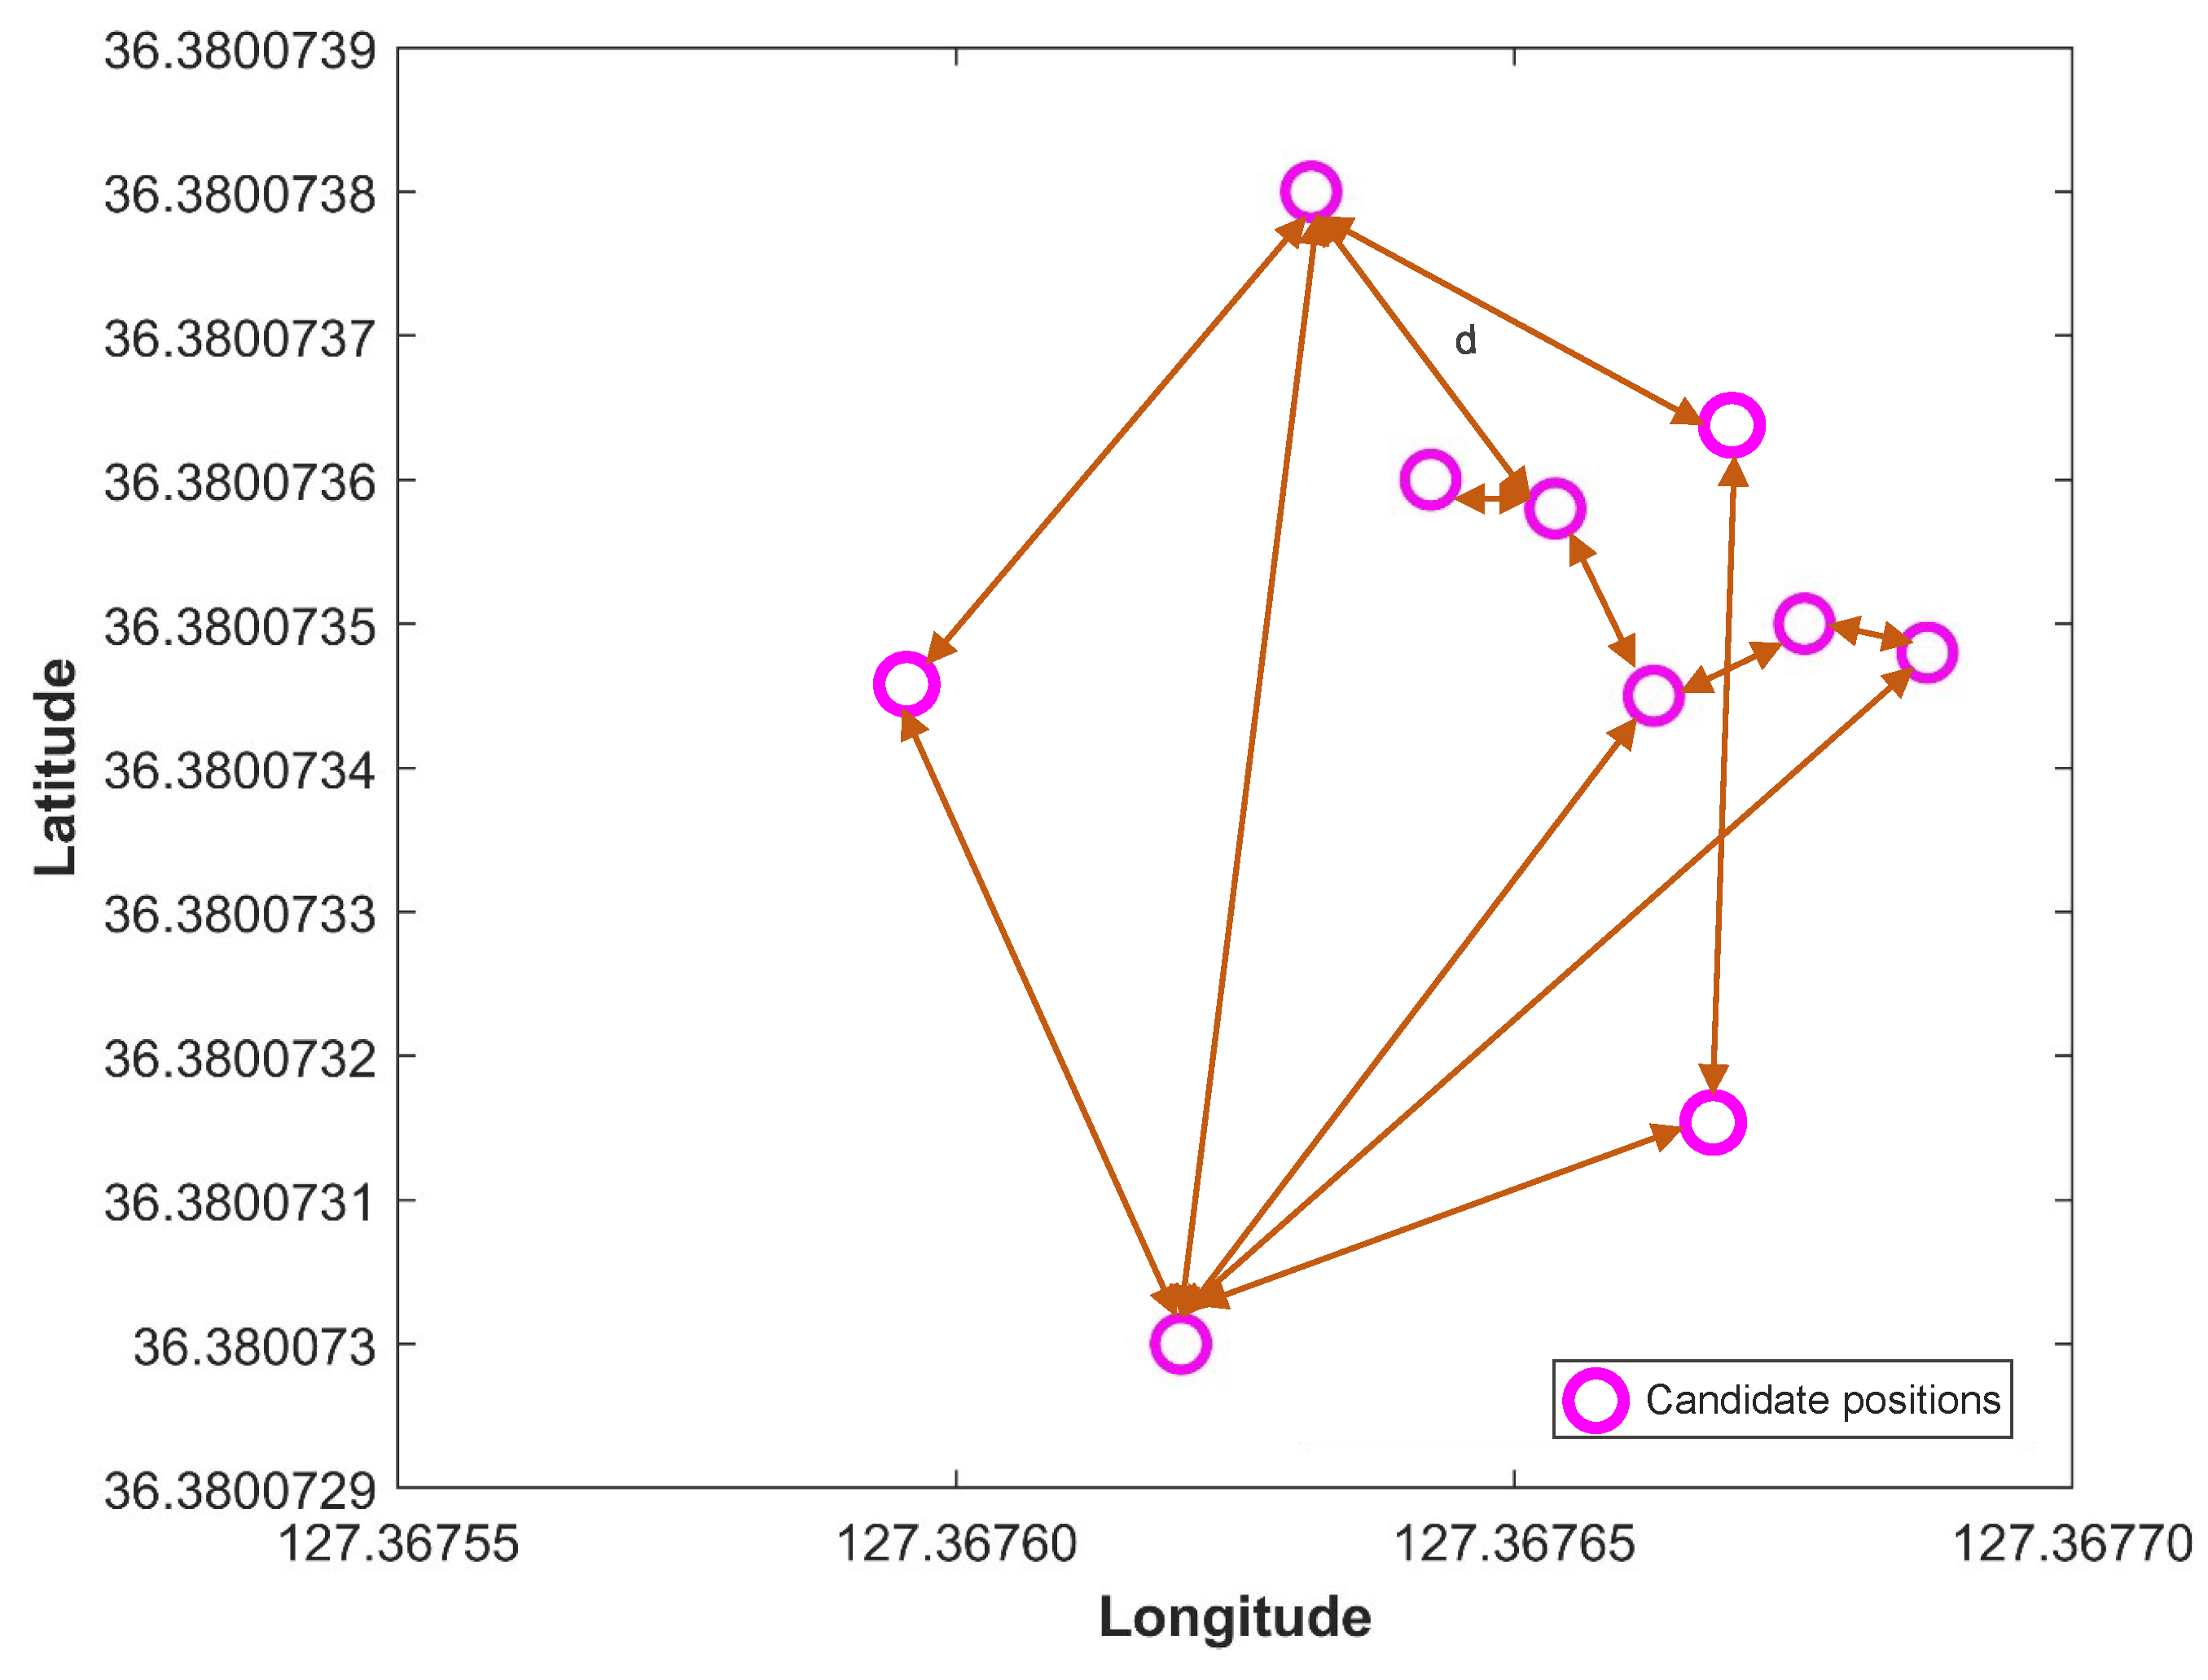
4.4. Positioning Process
| Algorithm 1 Algorithm for position estimation |
| Input: User scan |
| Output: Position P(longitude, latitude) |
Initialisation:
|
|
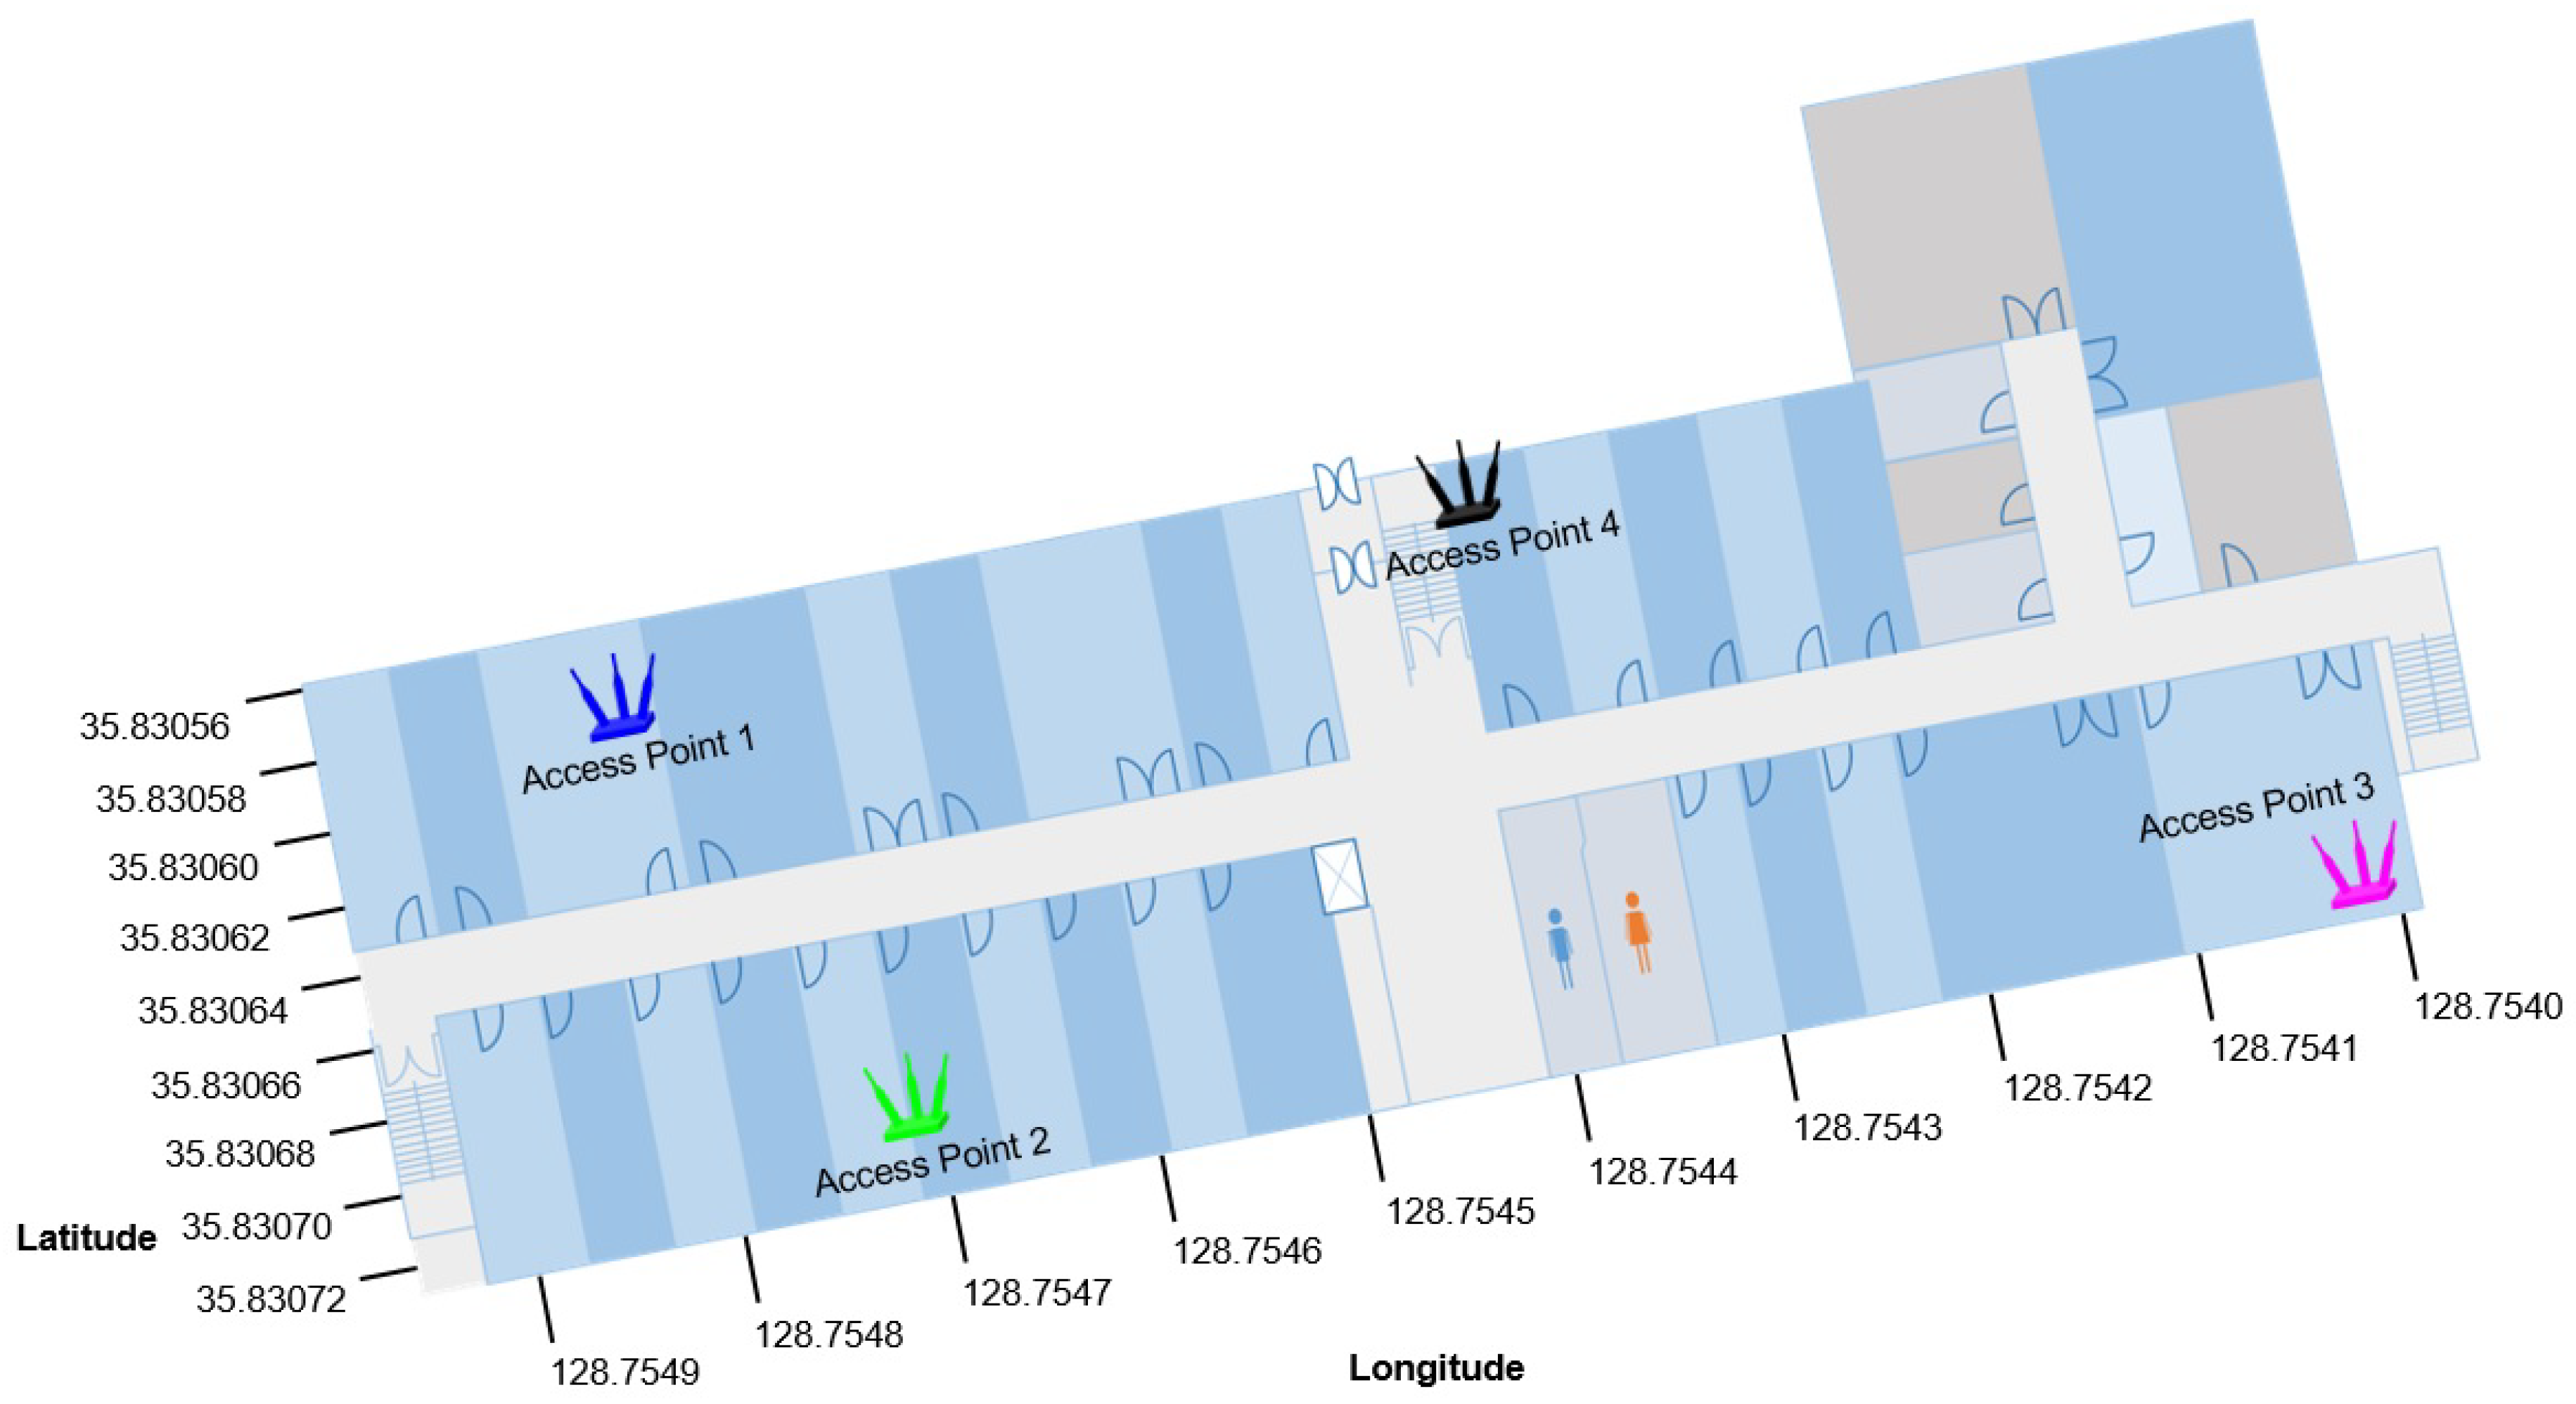
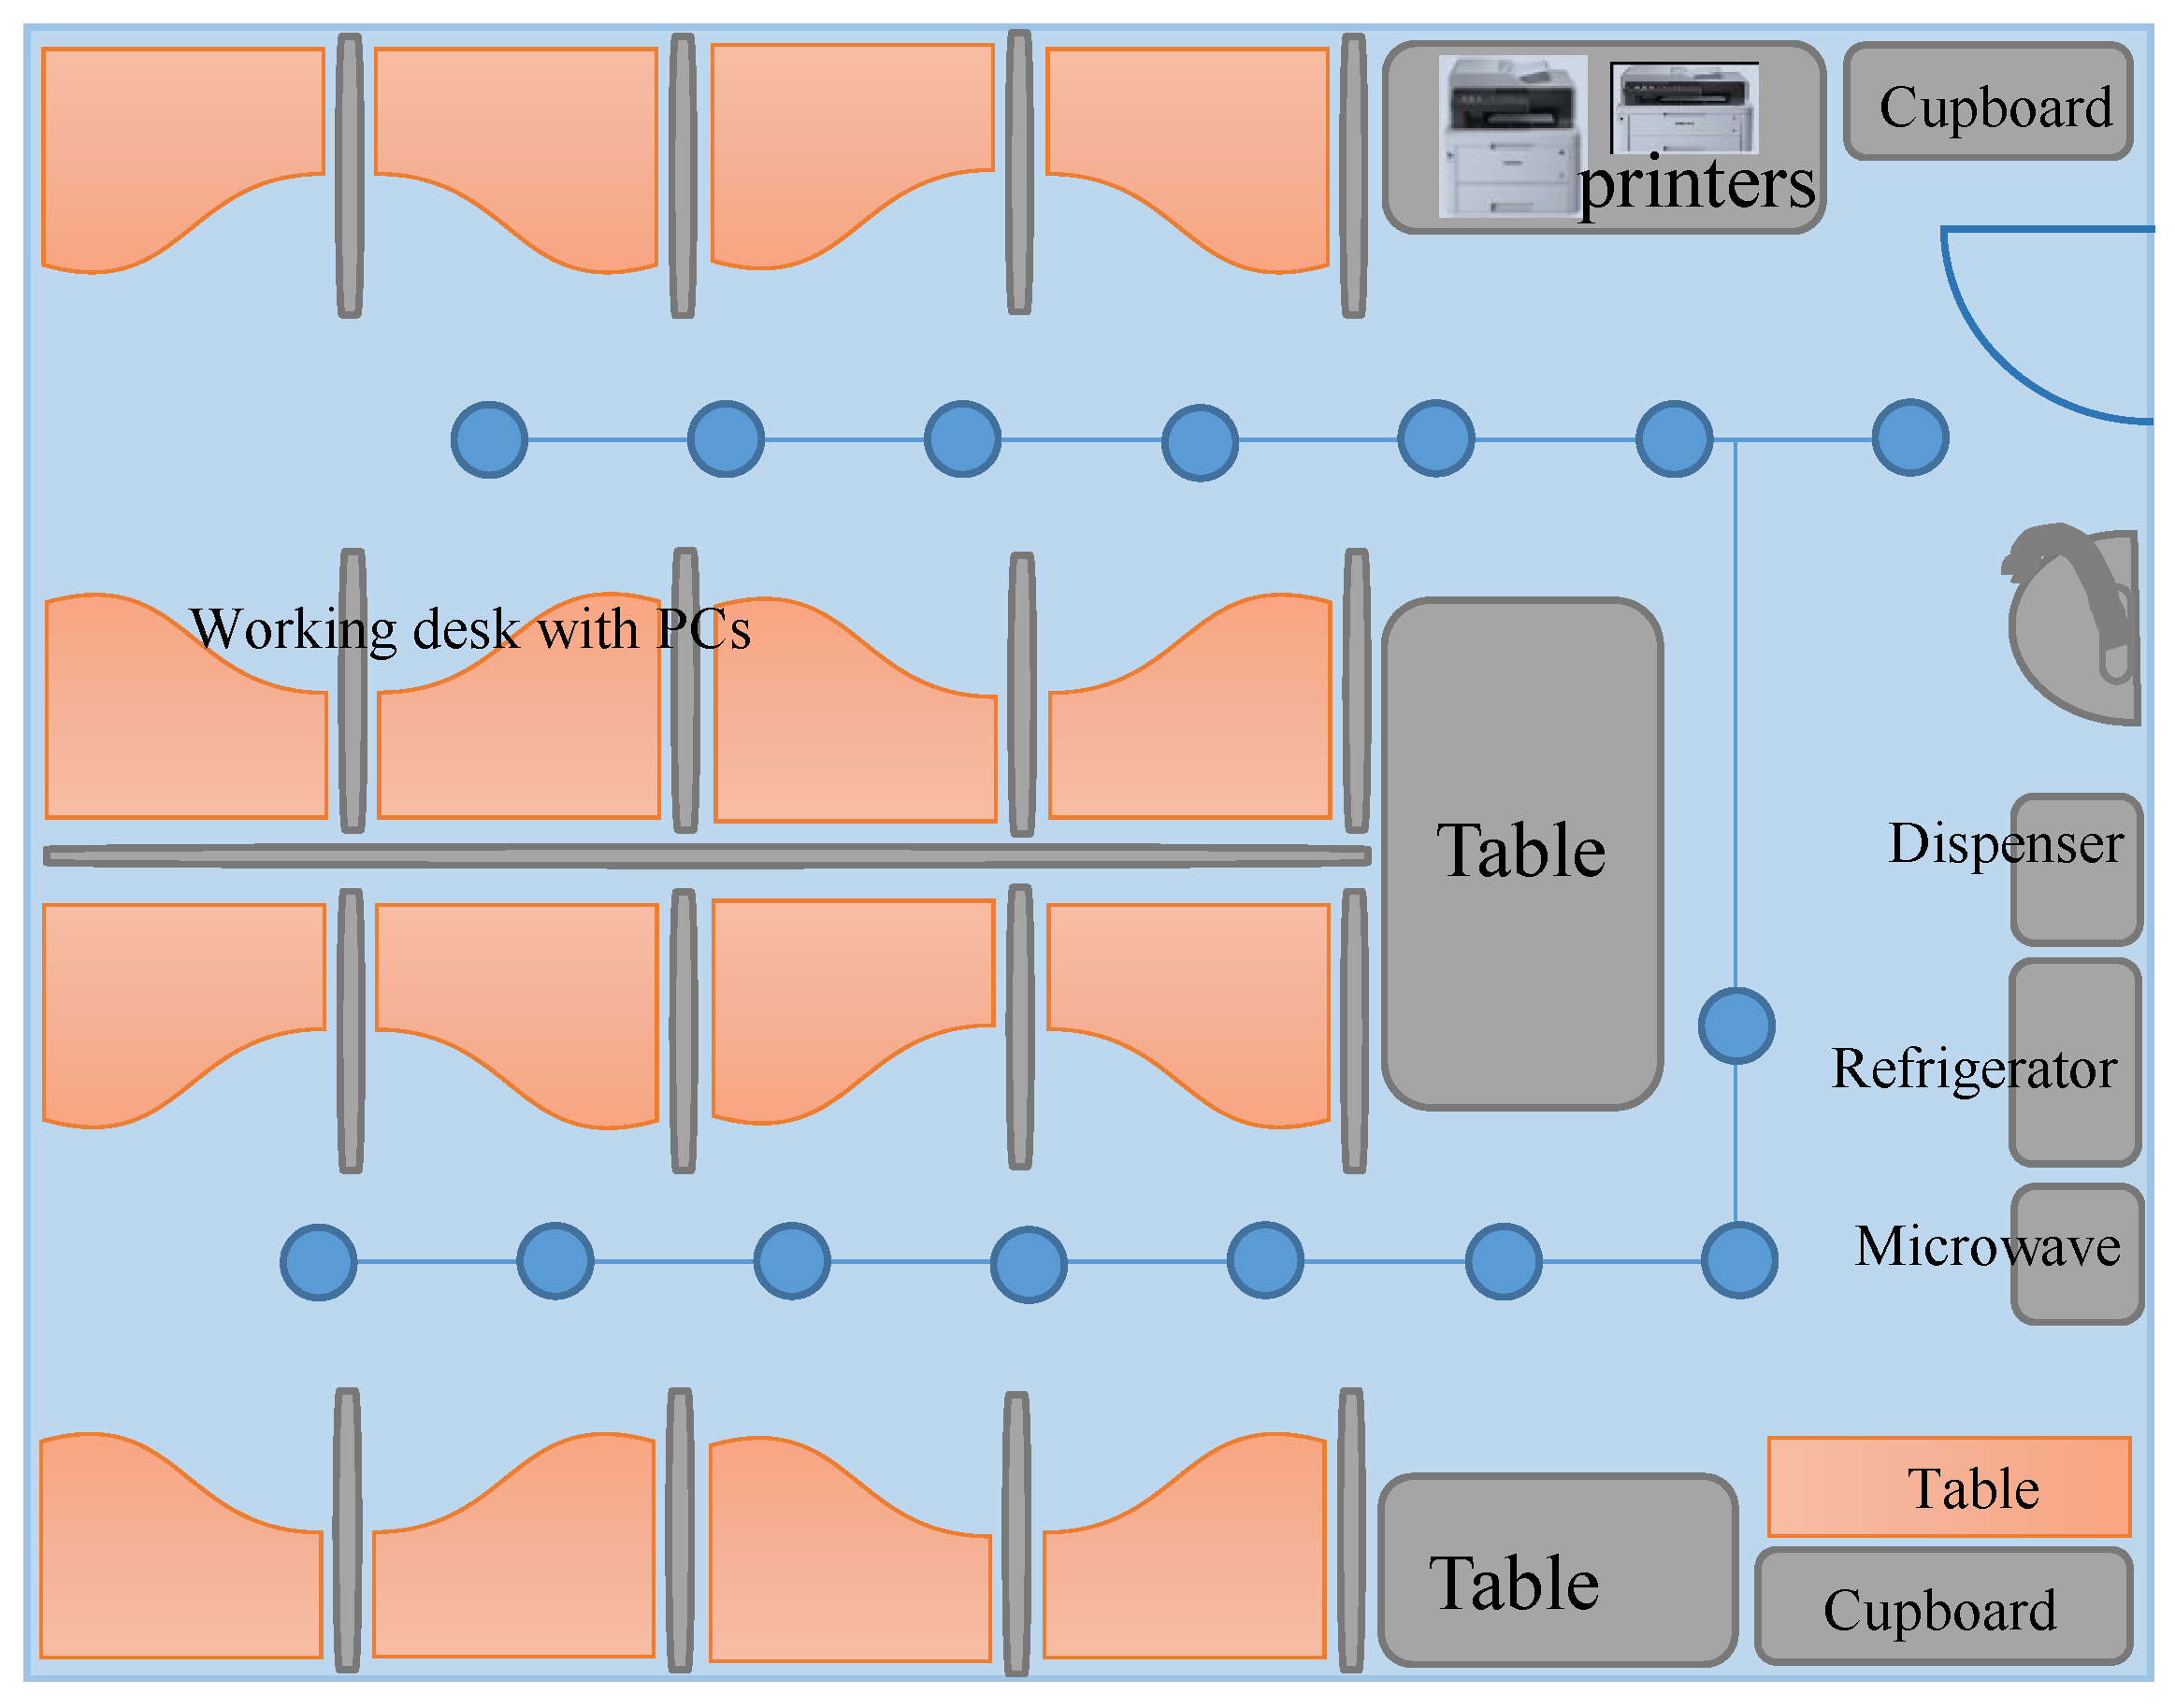
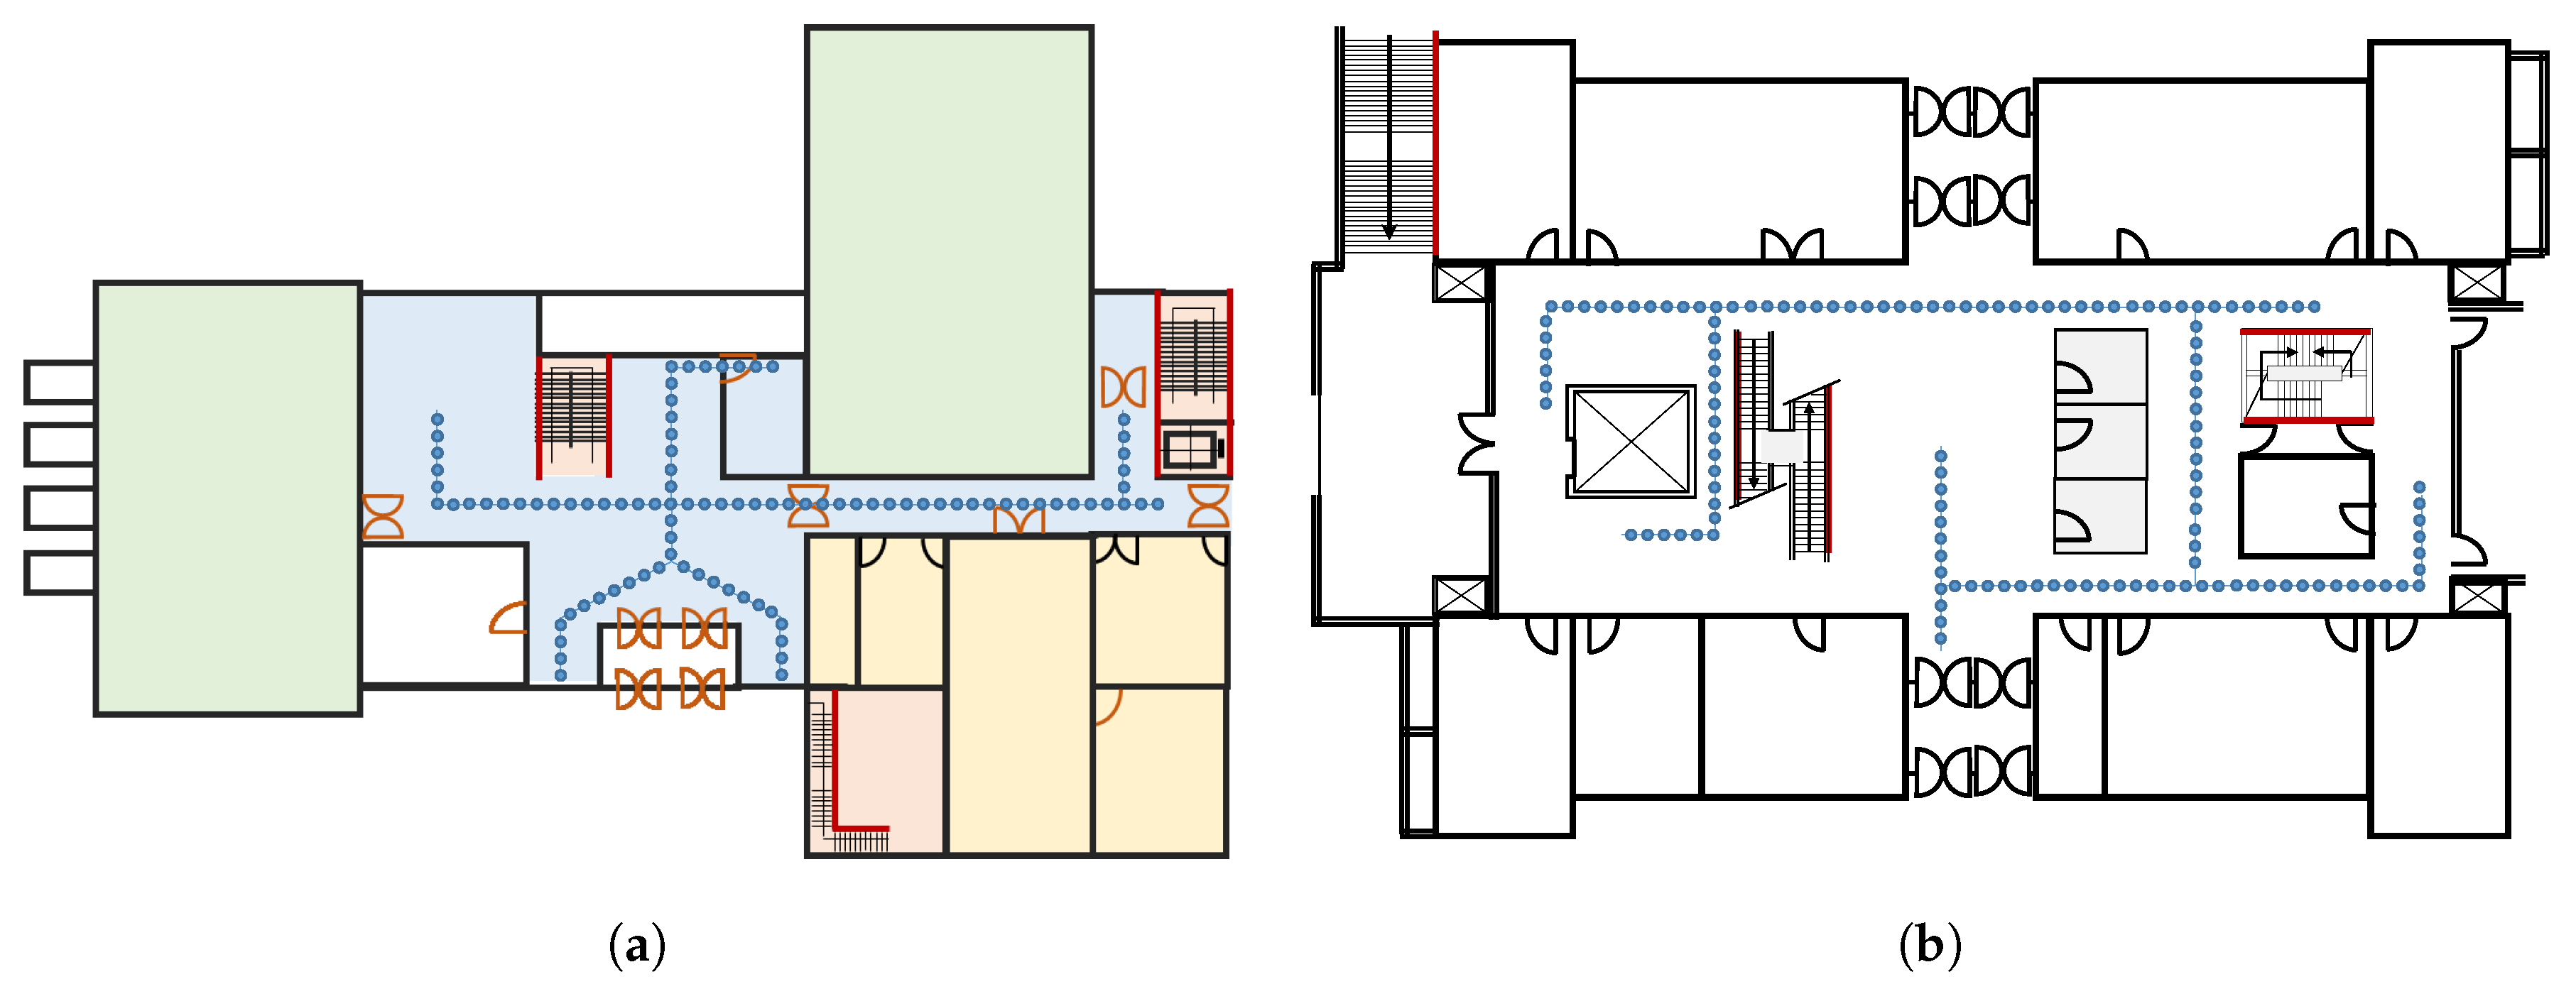
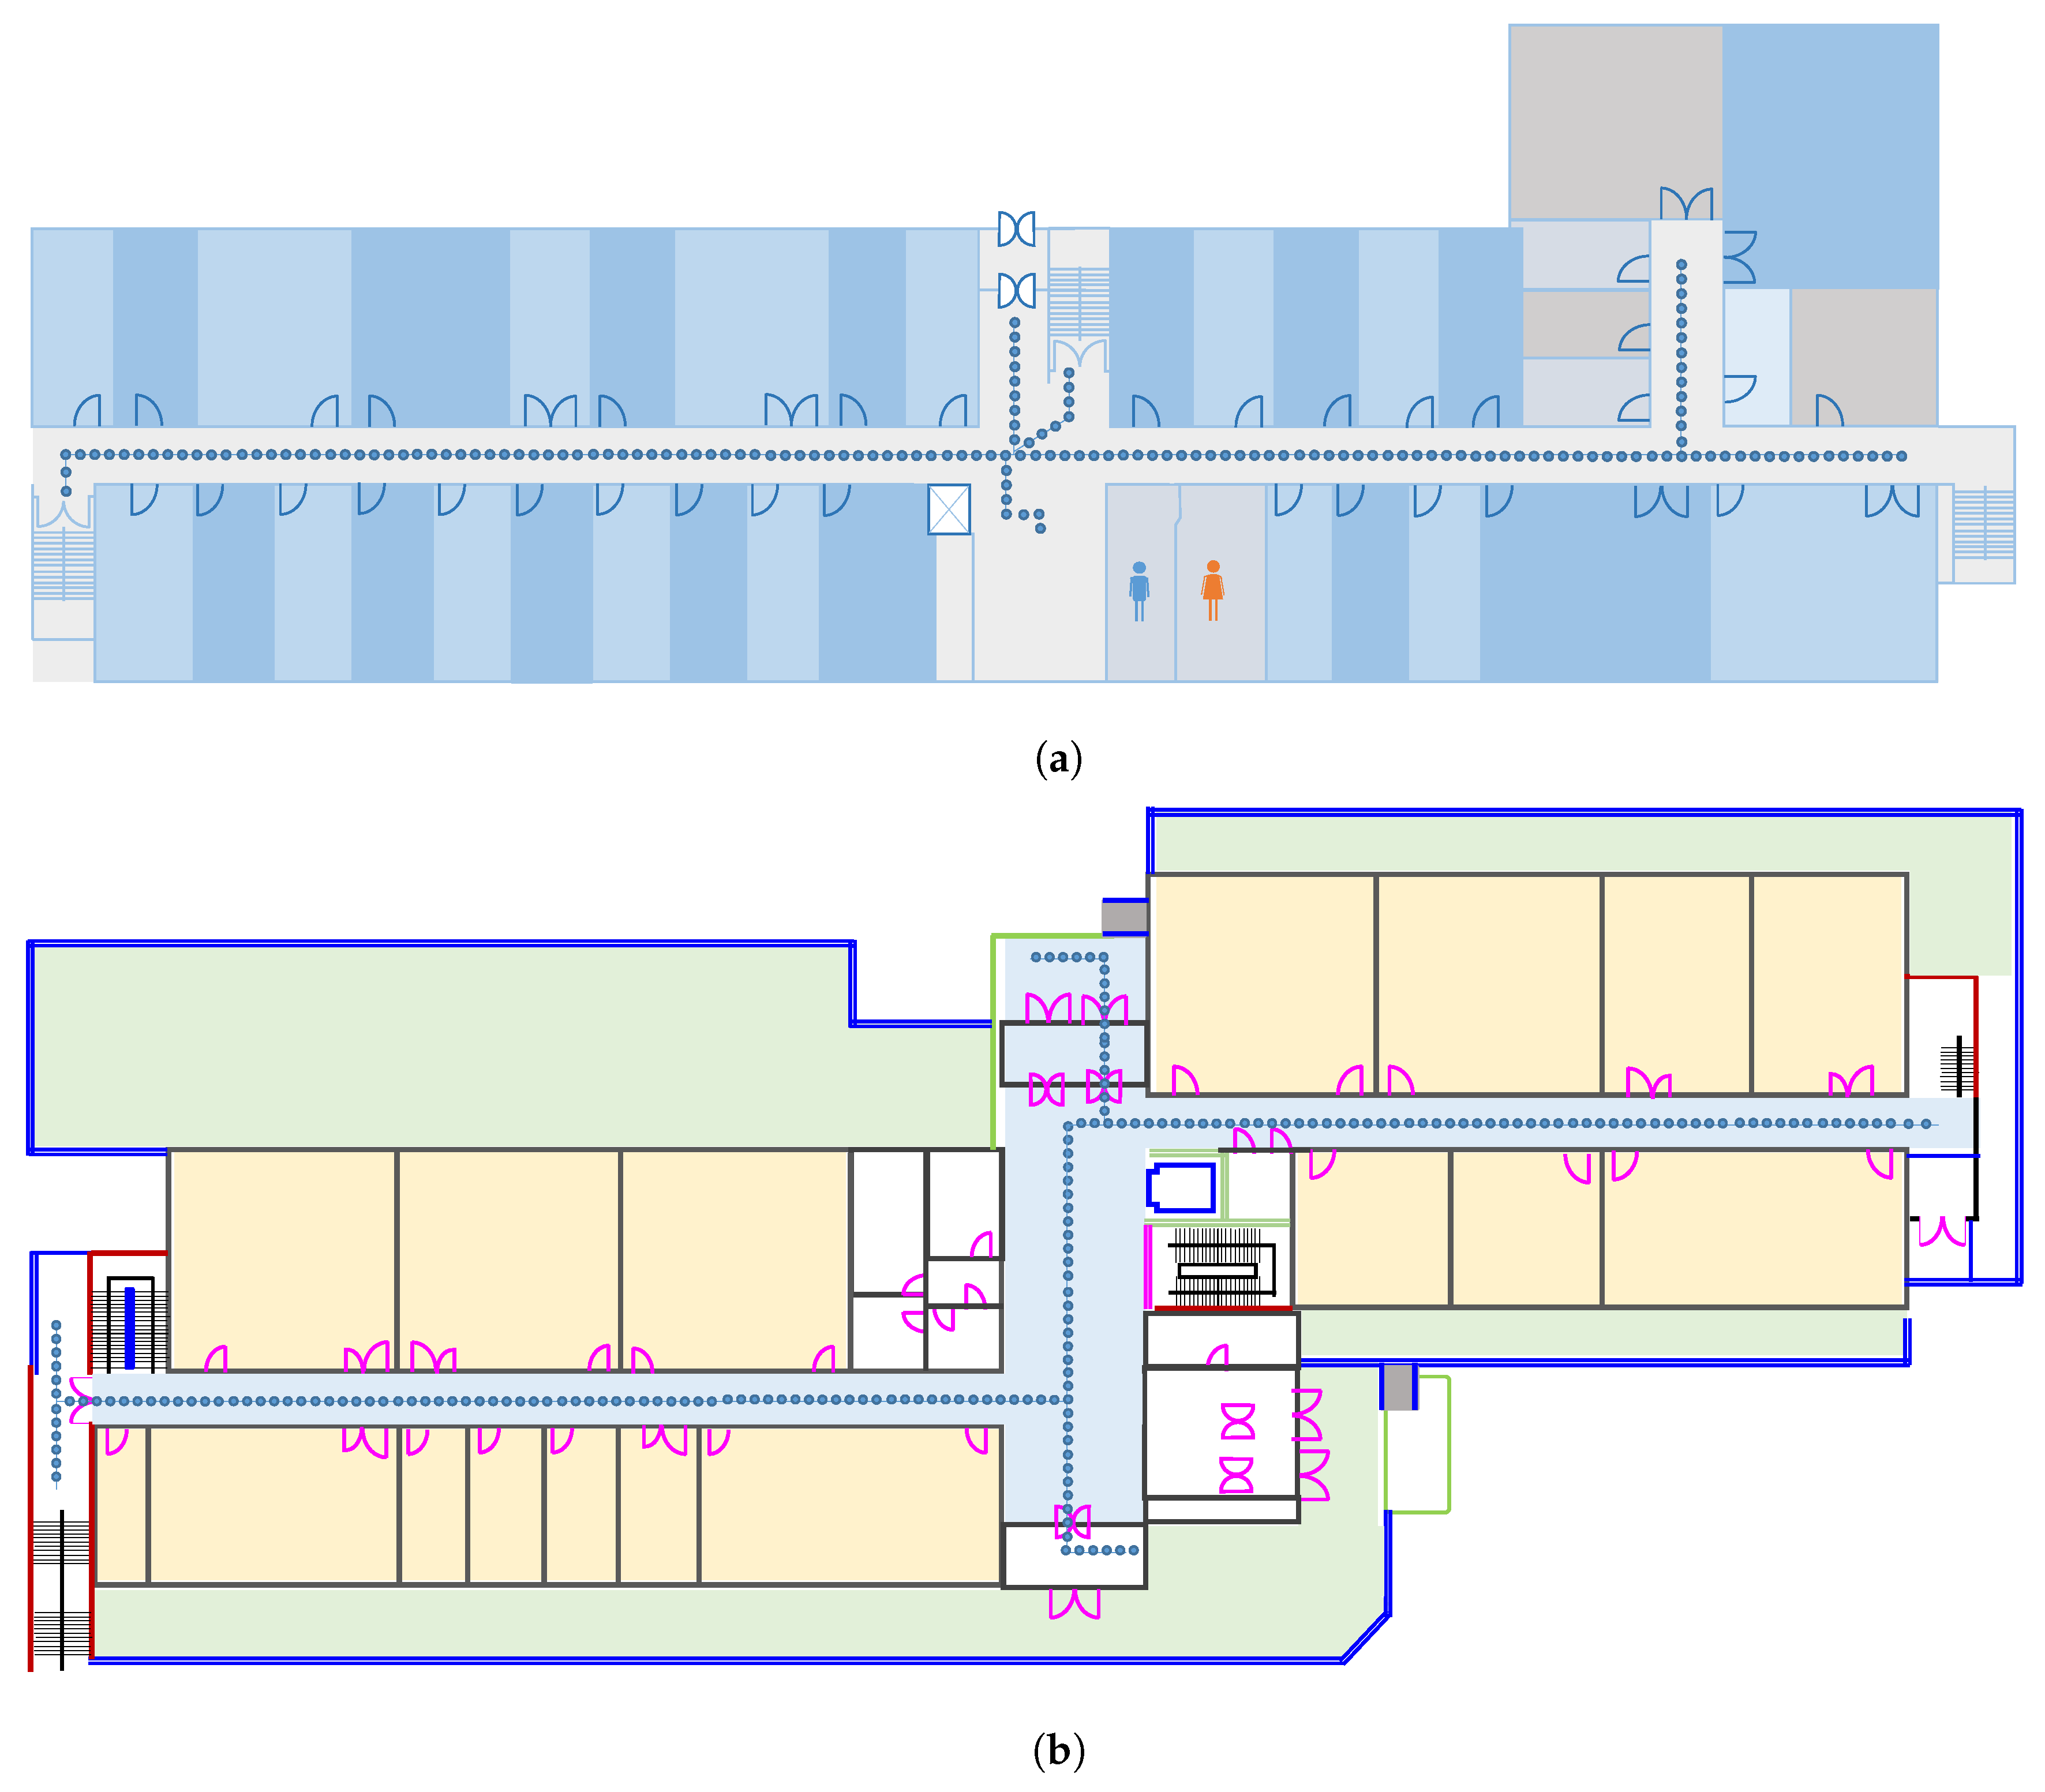
5. Experiment Setup
6. Results and Discussion
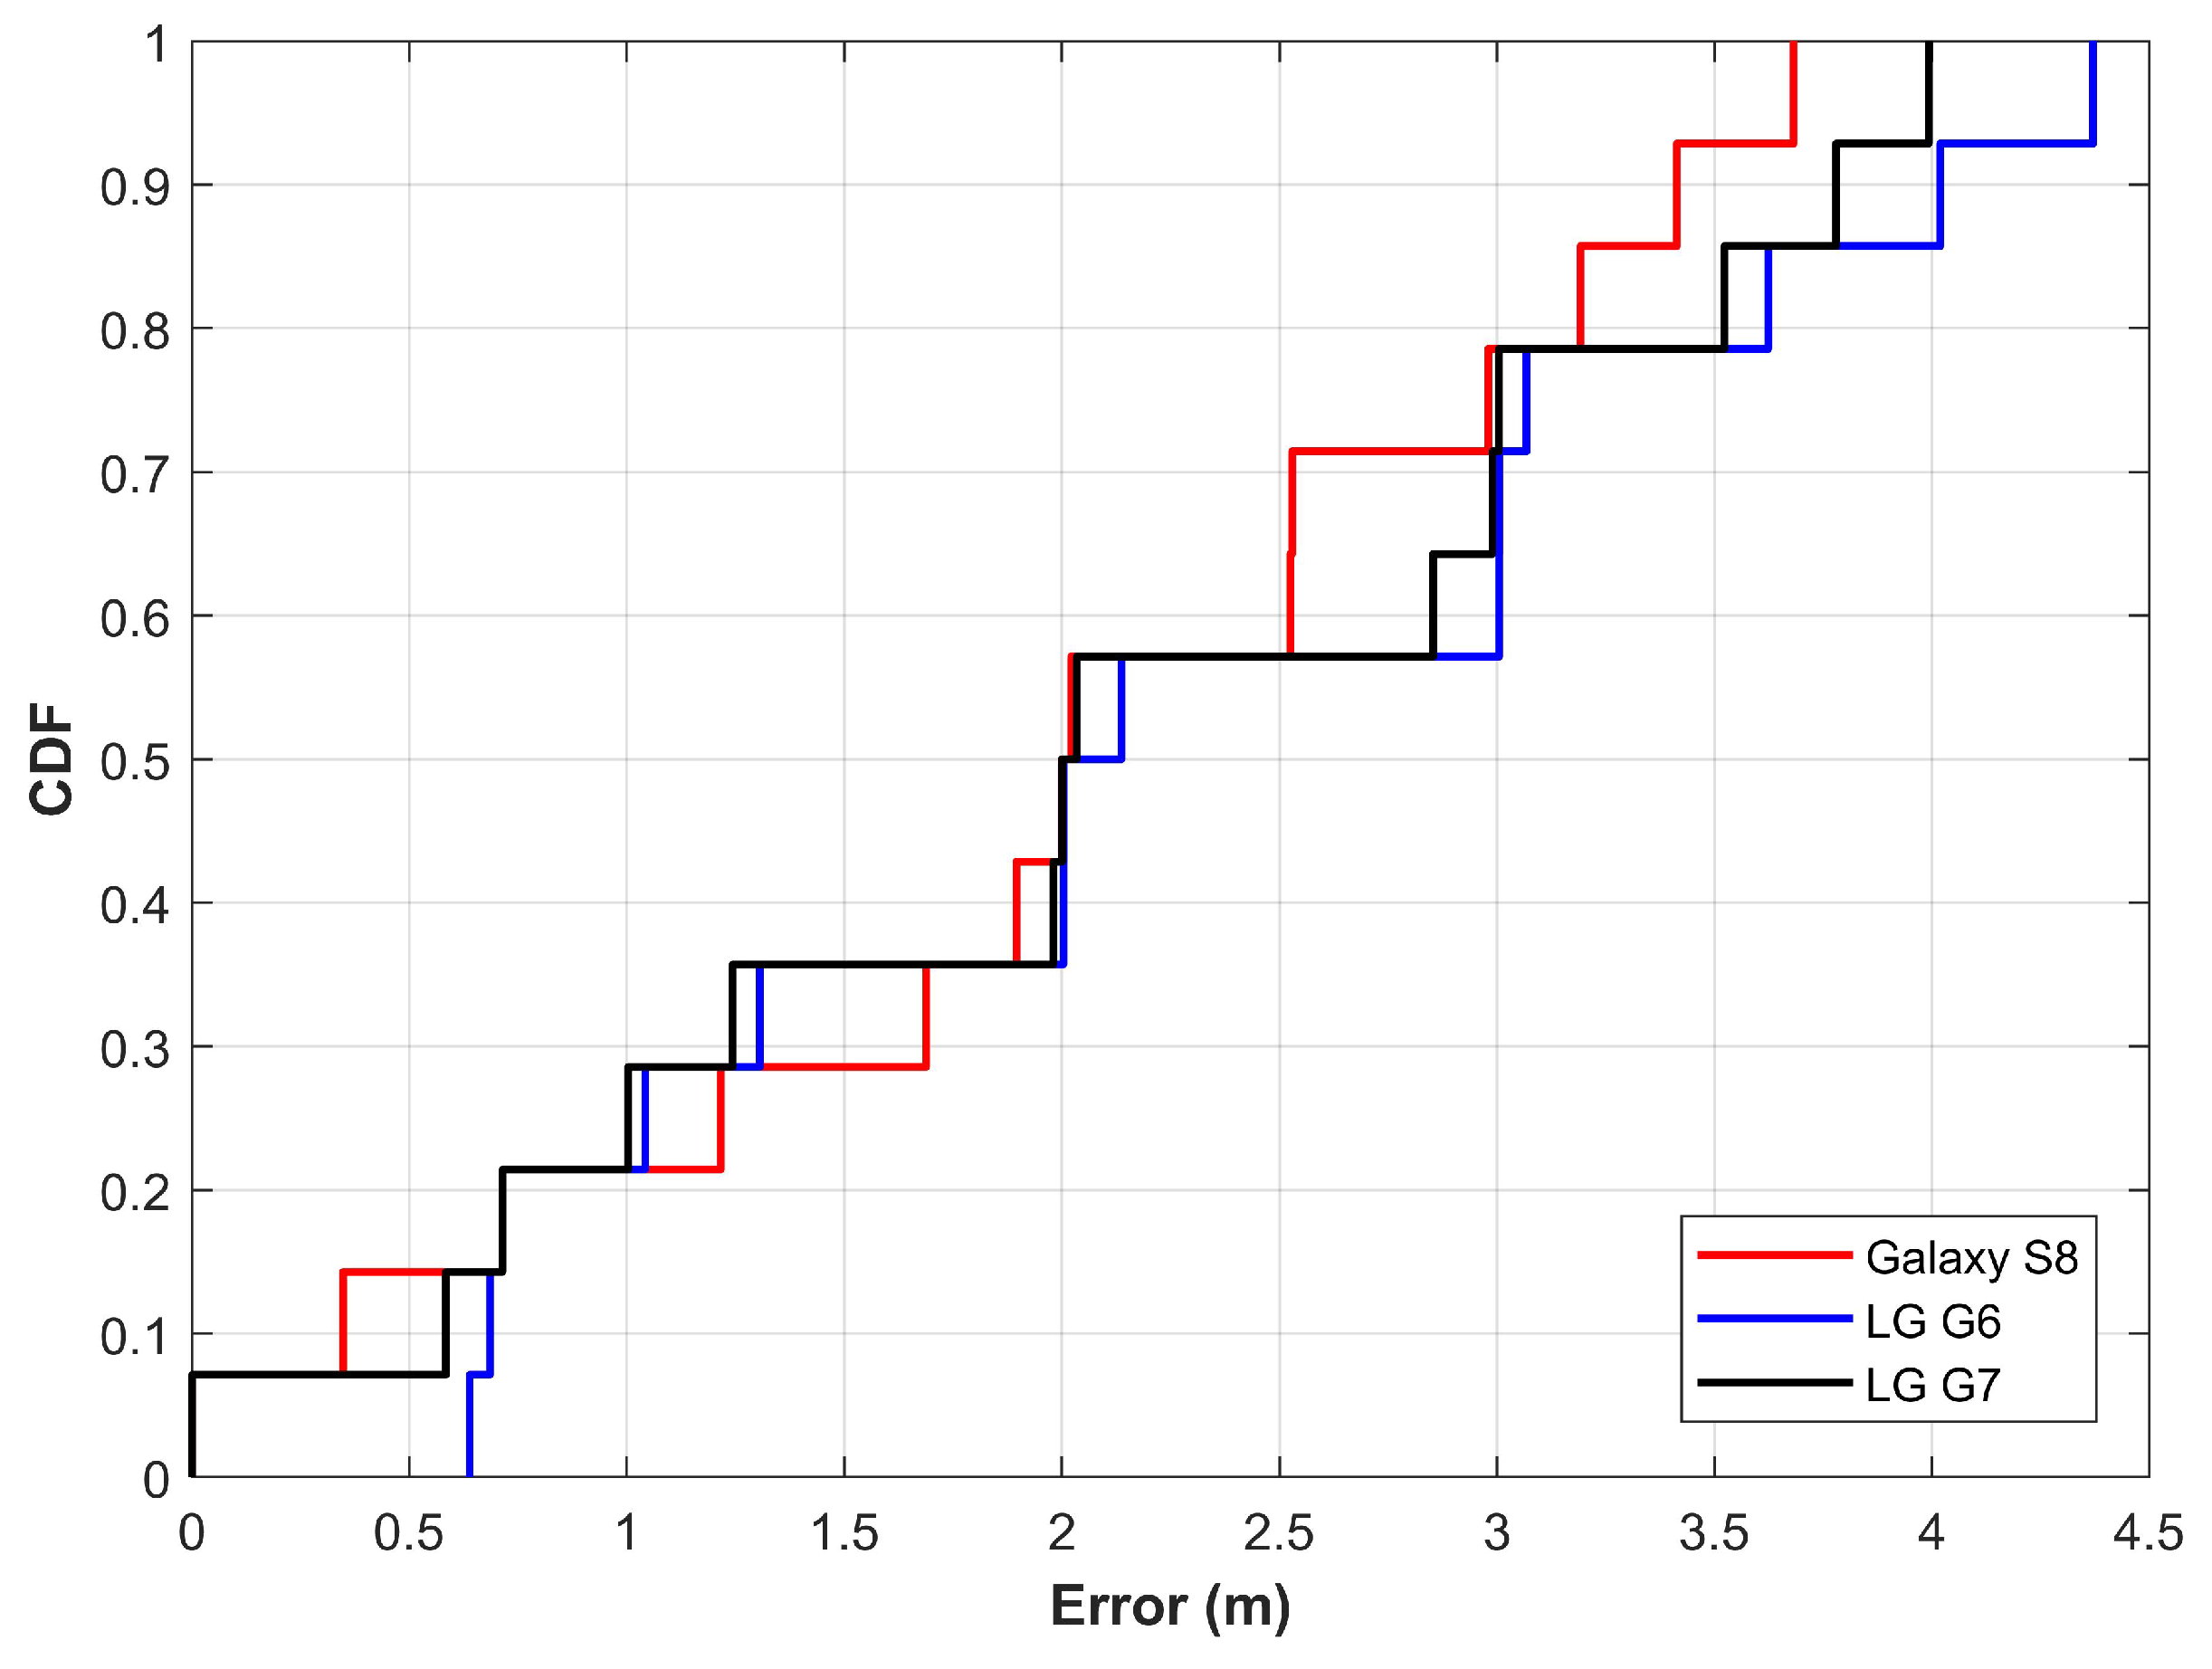
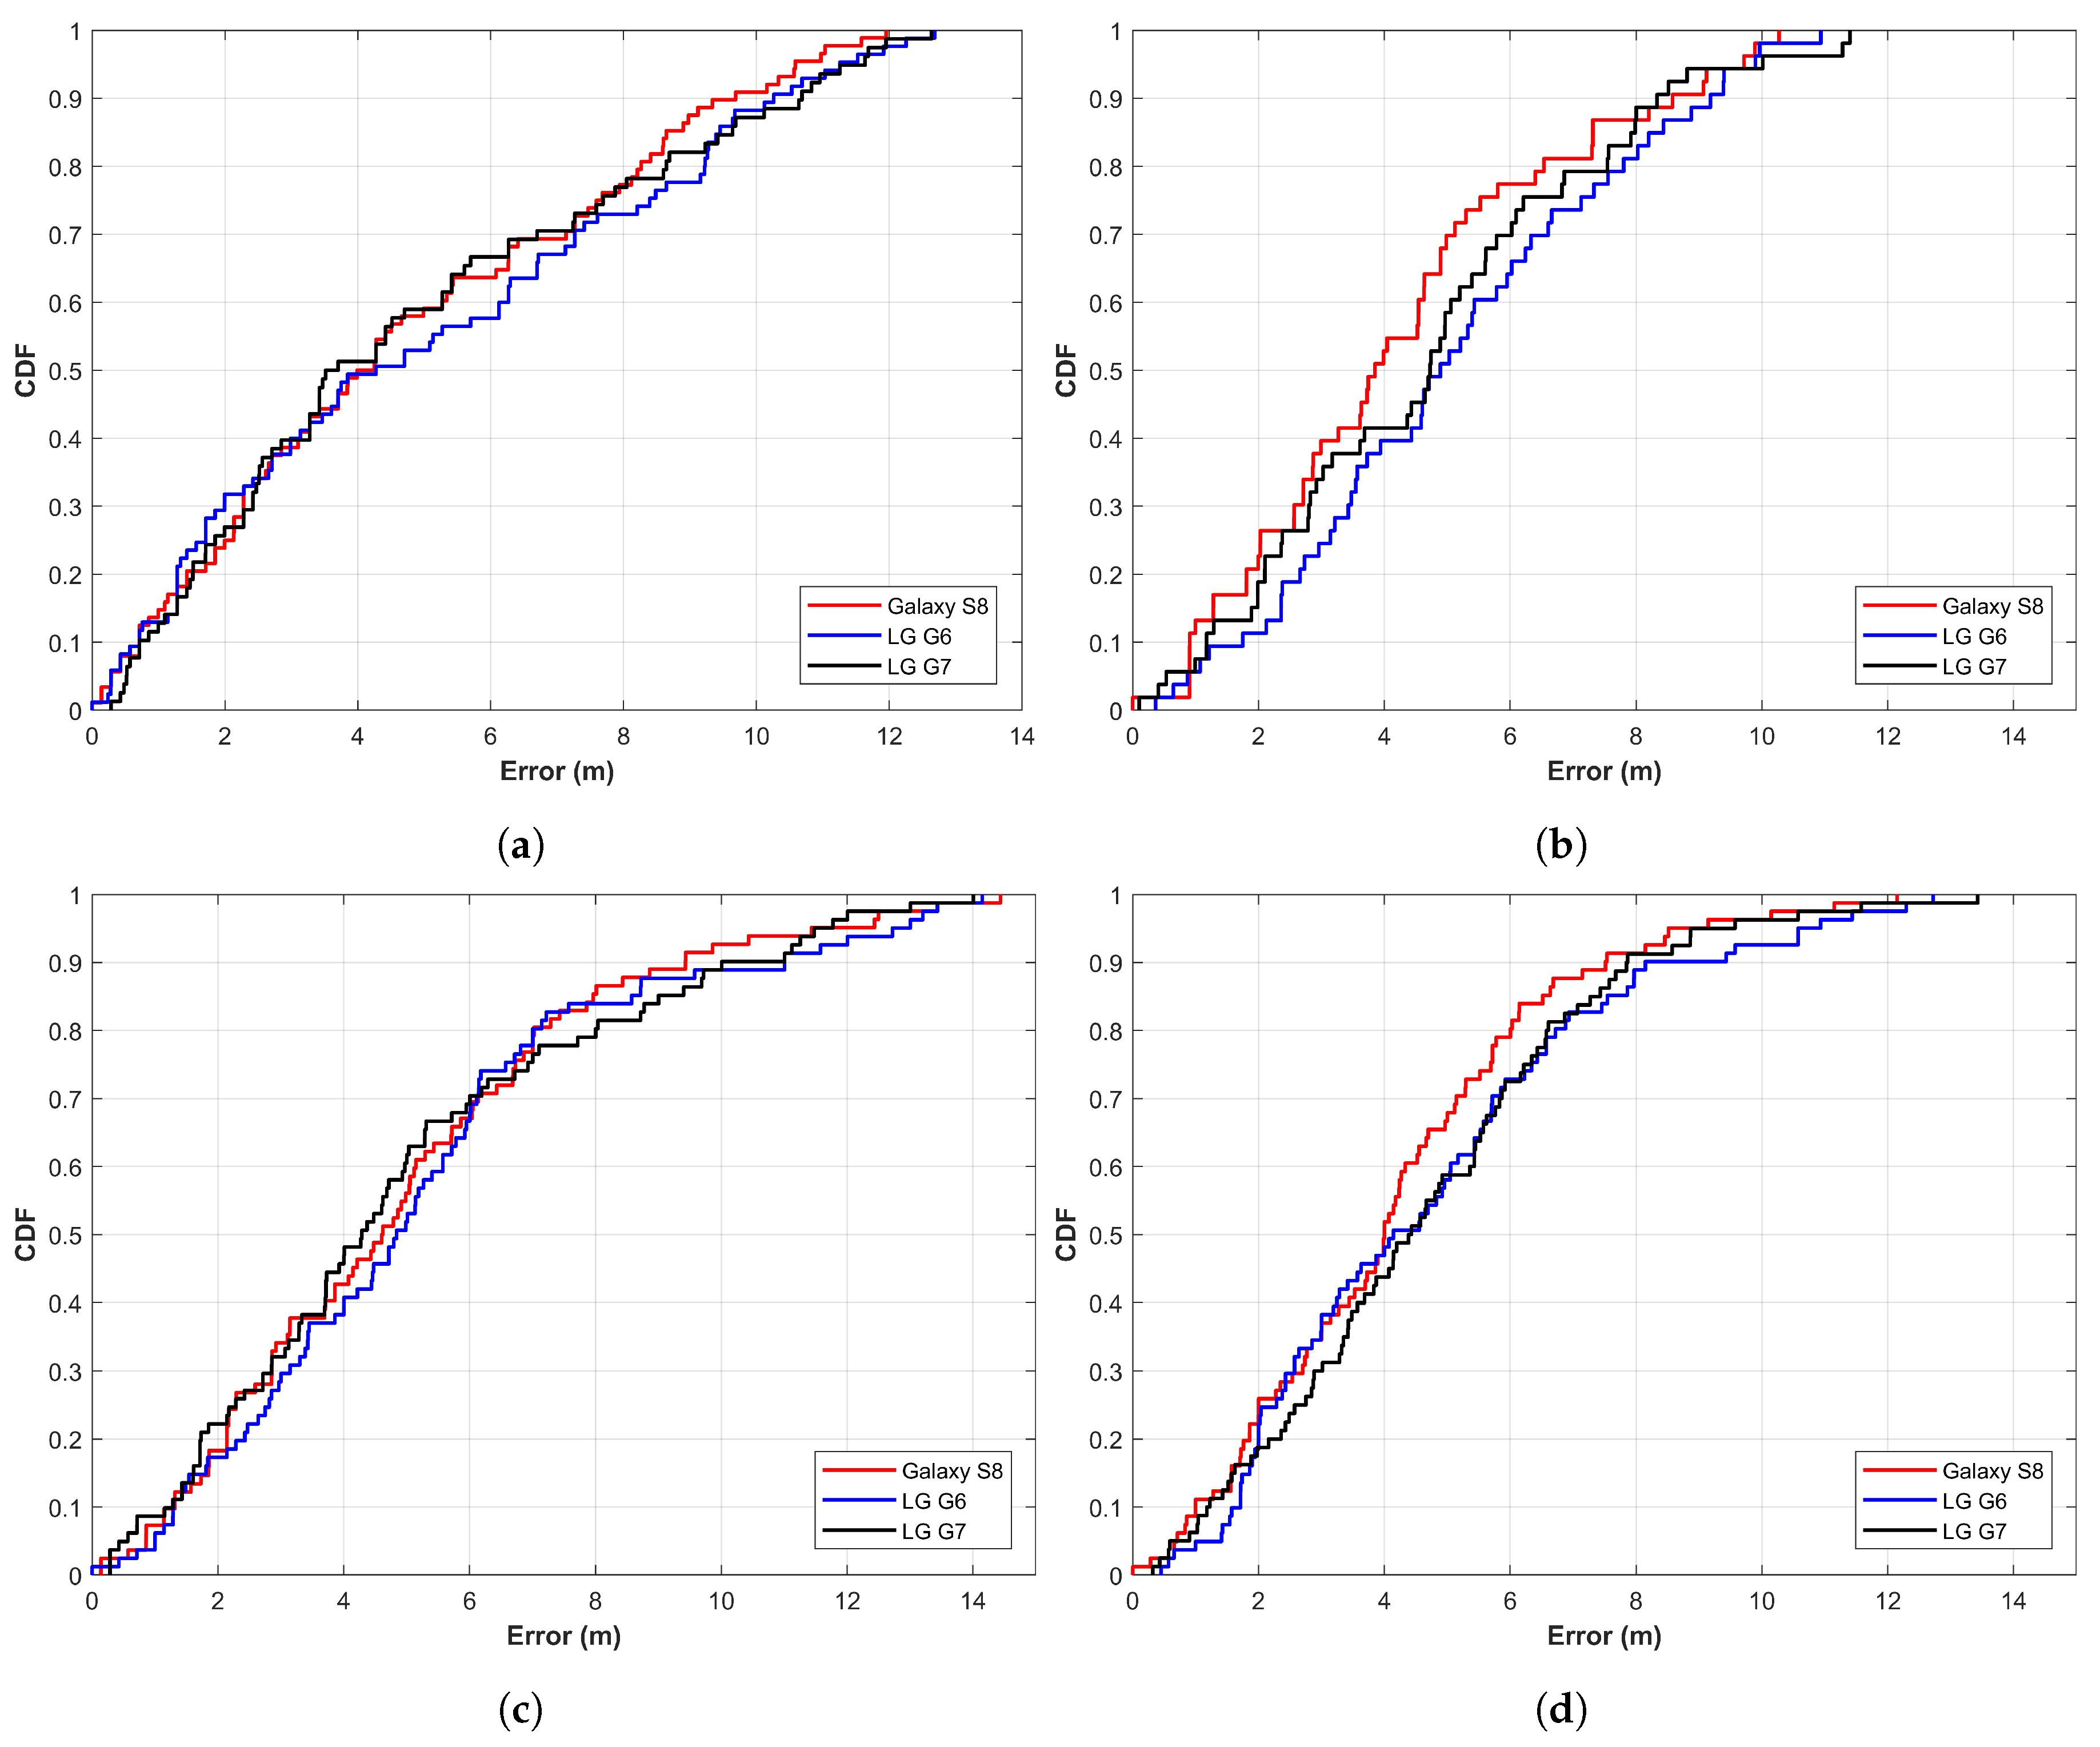
6.1. Results for Static Environment
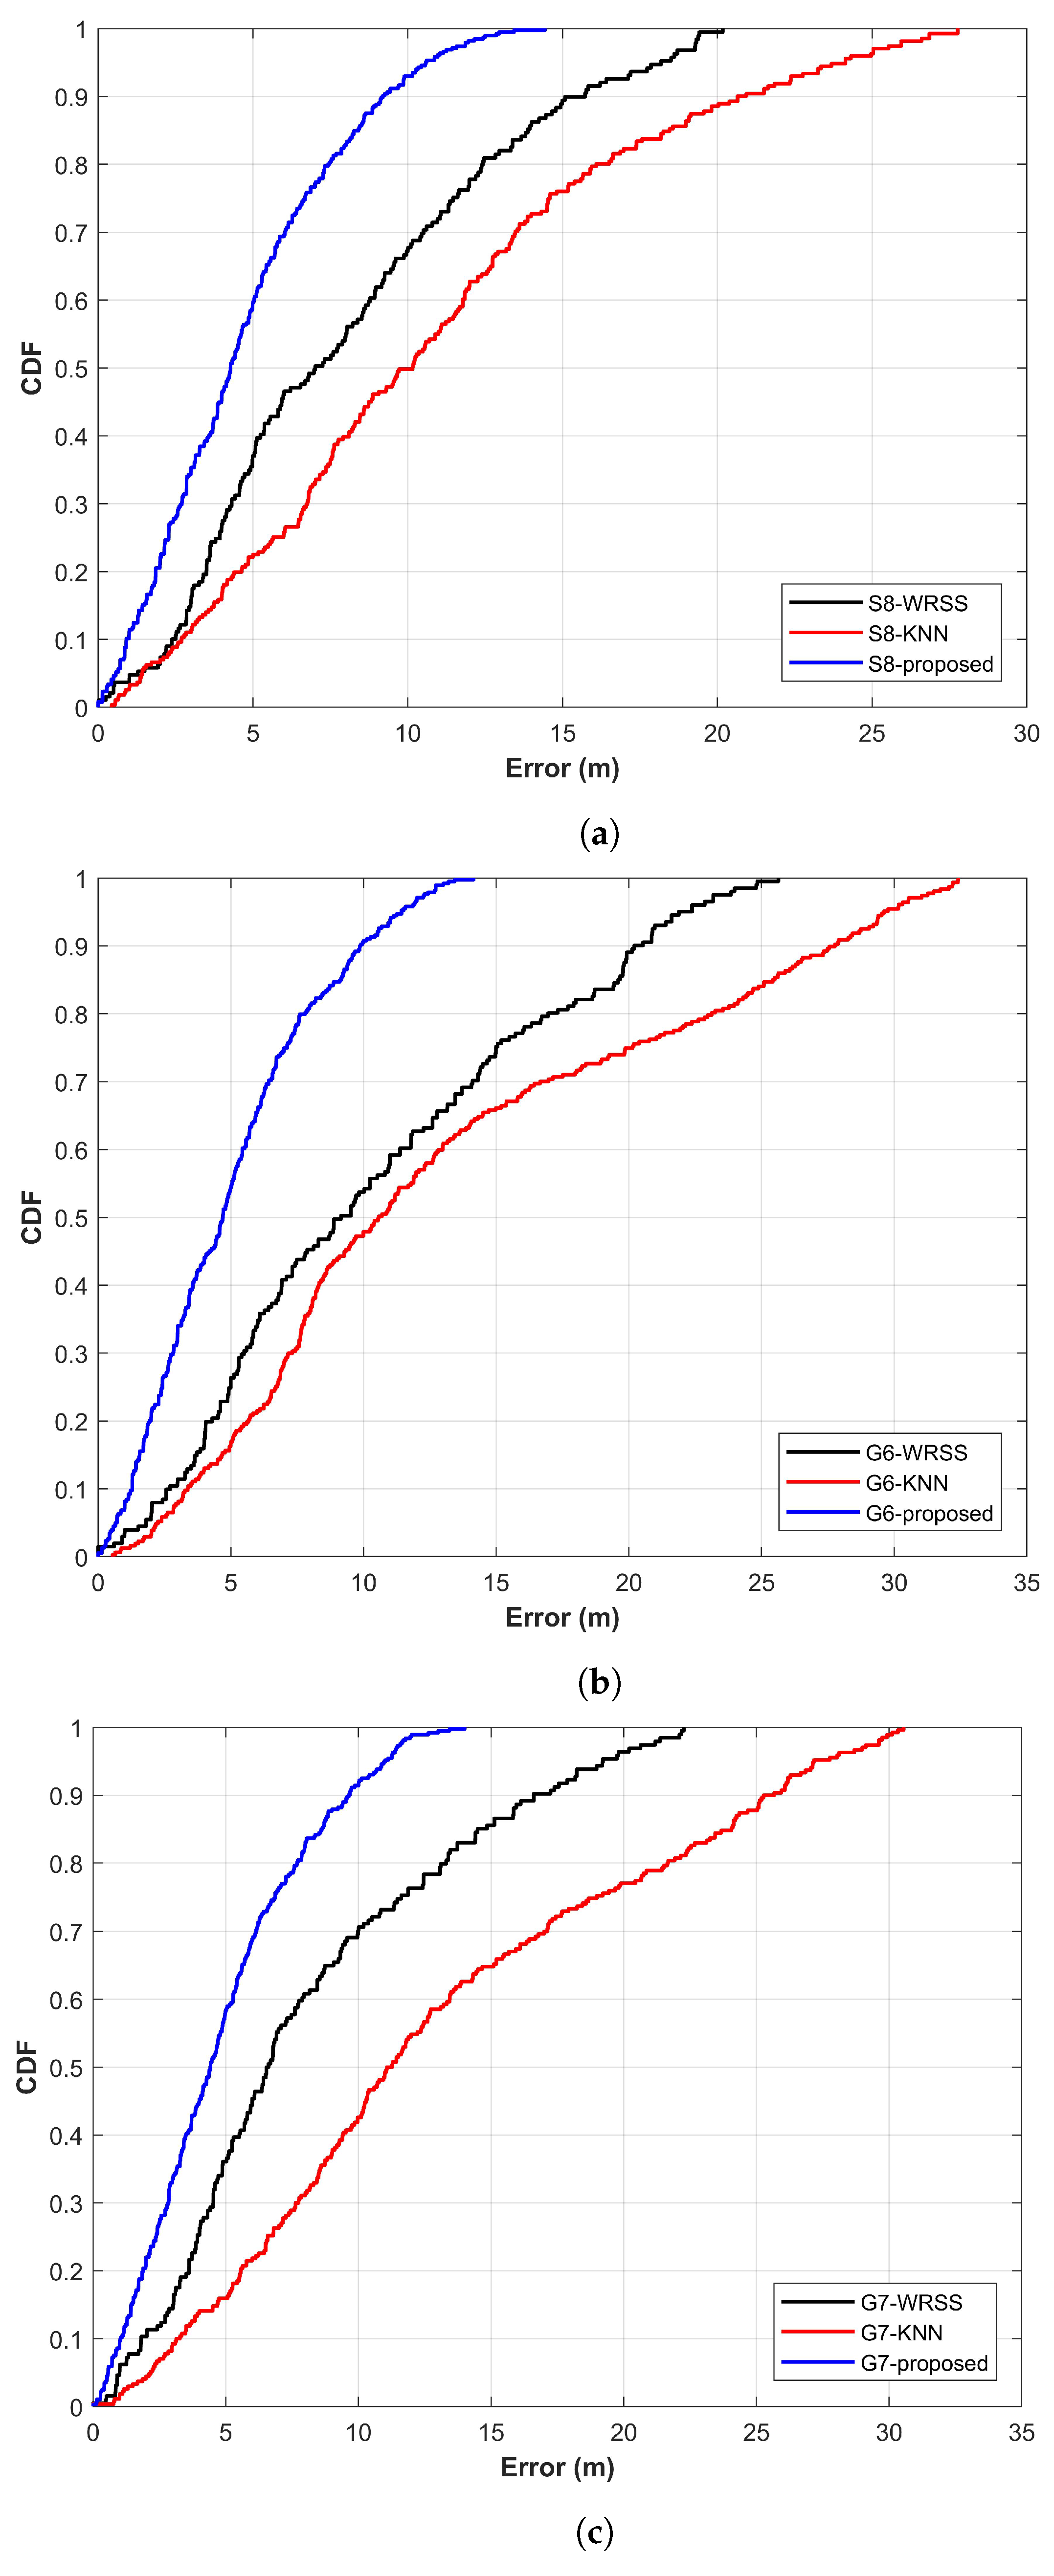
6.2. Performance Appraisal
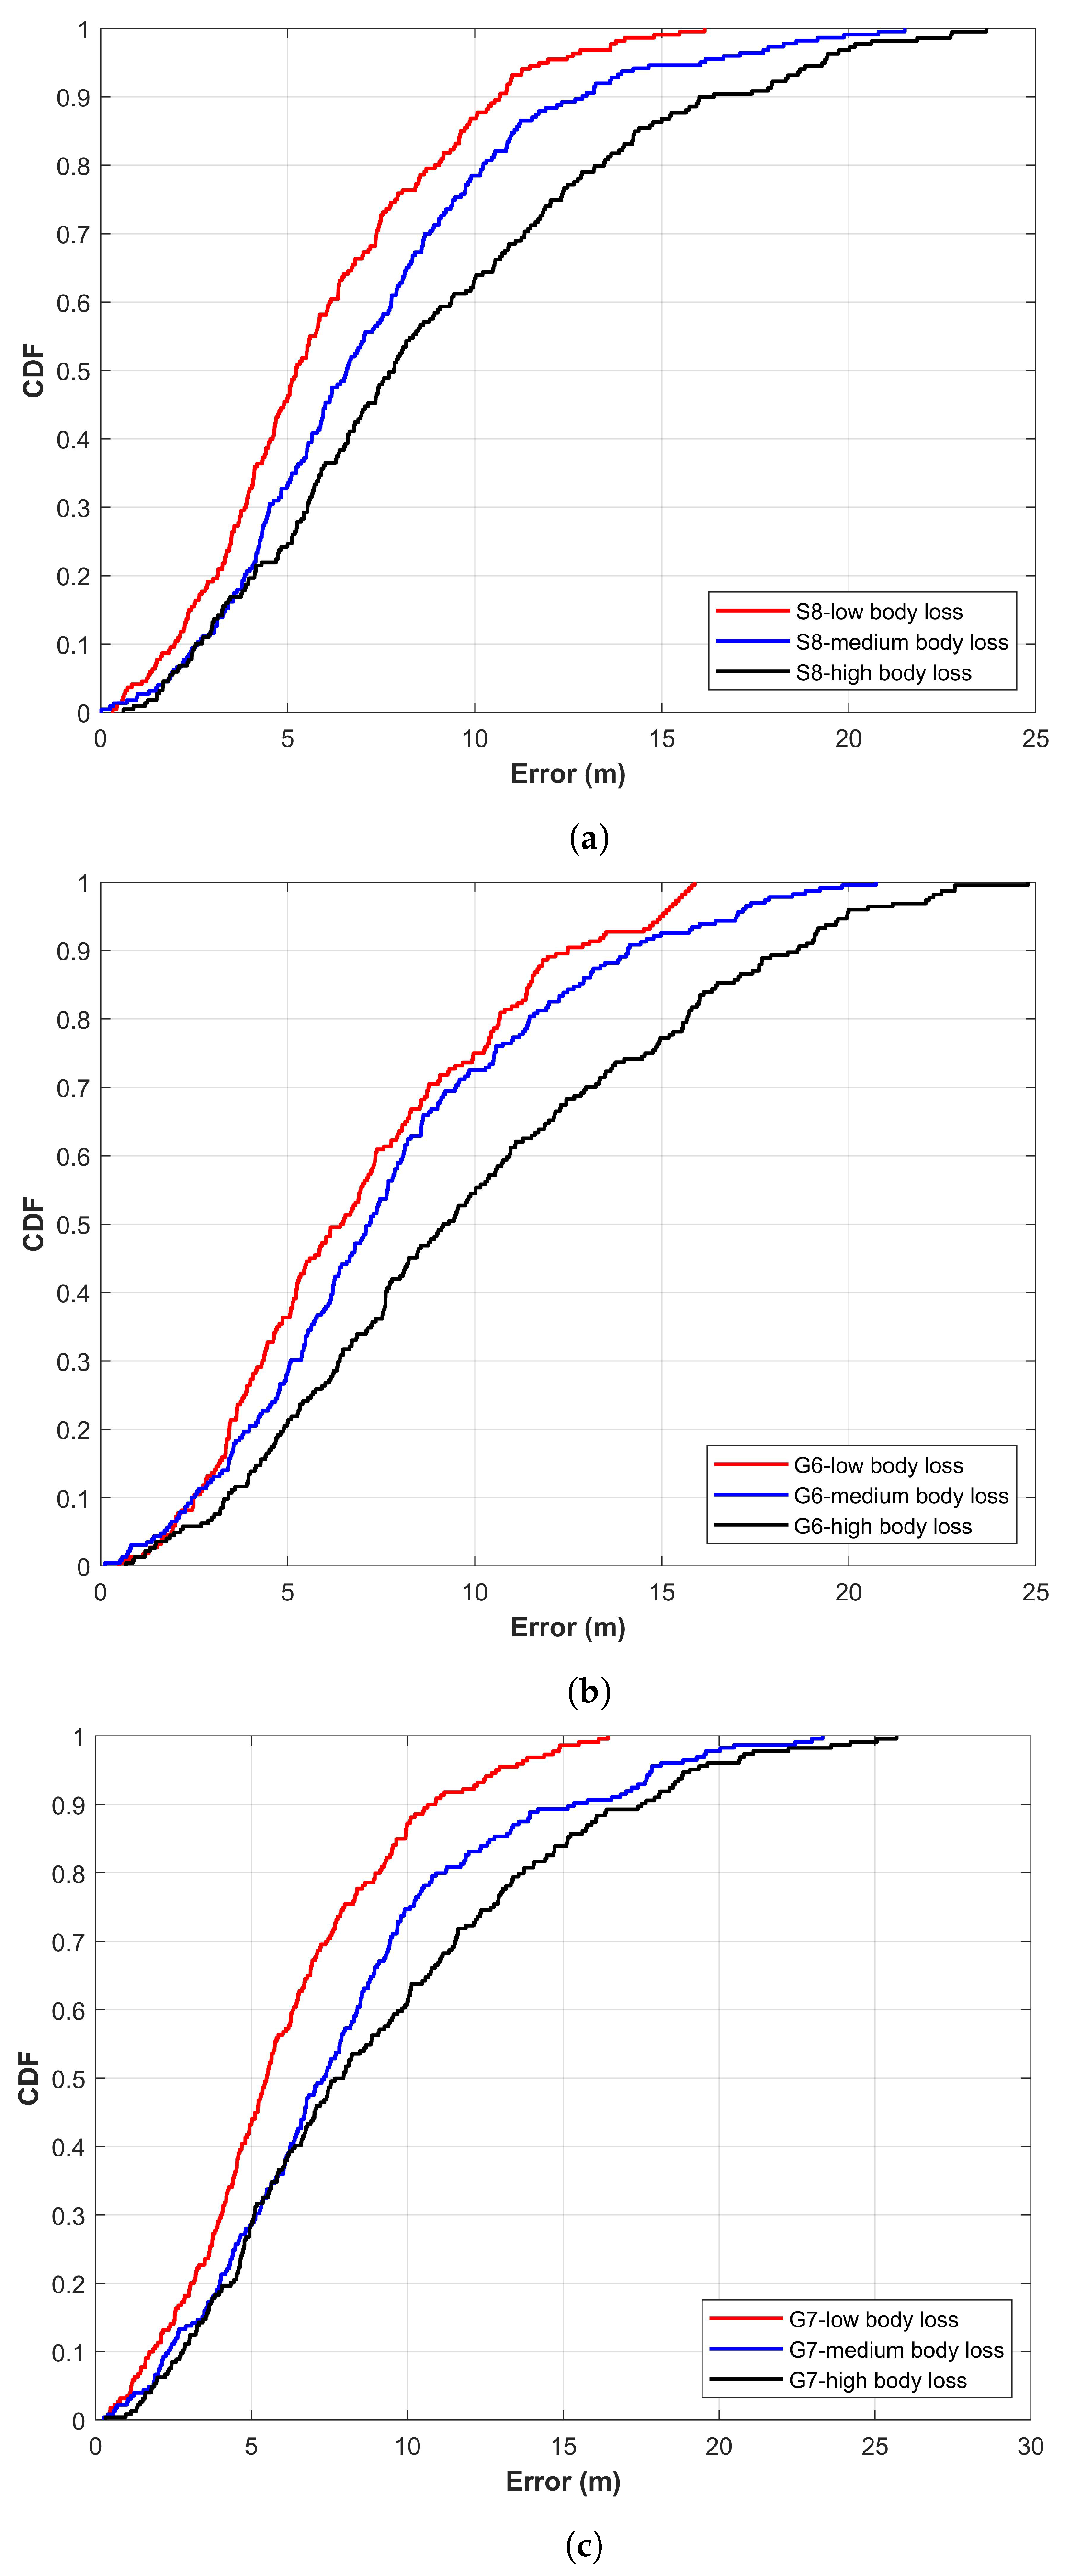
6.3. Results in a Dynamic Environment with Human Presence
- Low body loss: 50 to 200 people are present.
- Medium body loss: 201 to 350 people are present.
- High body loss: More than 350 people are present in the area.
6.4. Constraints and Limitations of the Proposed Approach
7. Conclusions
Author Contributions
Funding
Conflicts of Interest
References
- Karimi, H.A. Advanced Location-Based Technologies and Services; CRC Press: Boca Raton, FL, USA, 2016. [Google Scholar]
- Ni, L.M.; Liu, Y.; Lau, Y.C.; Patil, A.P. LANDMARC: Indoor location sensing using active RFID. In Proceedings of the First IEEE International Conference on Pervasive Computing and Communications, Fort Worth, TX, USA, 23–26 March 2003. [Google Scholar]
- Wolf, J.; Burgard, W.; Burkhardt, H. Robust vision-based localization by combining an image-retrieval system with Monte Carlo localization. IEEE Trans. Rob. 2005, 21, 208–216. [Google Scholar] [CrossRef]
- Ashraf, I.; Hur, S.; Park, Y. mPILOT-magnetic field strength based pedestrian indoor localization. Sensors 2018, 18, 2283. [Google Scholar] [CrossRef] [PubMed]
- Ashraf, I.; Hur, S.; Park, Y. MagIO: Magnetic Field Strength Based Indoor-Outdoor Detection with a Commercial Smartphone. Micromachines 2018, 9, 534. [Google Scholar] [CrossRef] [PubMed]
- Ashraf, I.; Hur, S.; Park, Y. BLocate: A building identification scheme in GPS denied environments using smartphone sensors. Sensors 2018, 18, 3862. [Google Scholar] [CrossRef] [PubMed]
- Ashraf, I.; Hur, S.; Park, Y. Floor identification using magnetic field data with smartphone sensors. Sensors 2019, 19, 2538. [Google Scholar] [CrossRef] [PubMed]
- Nur, K.; Morenza-Cinos, M.; Carreras, A.; Pous, R. Projection of RFID-Obtained product information on a retail stores indoor panoramas. IEEE Intell. Syst. 2015, 30, 30–37. [Google Scholar] [CrossRef]
- Son, J.; Kim, S.; Sohn, K. A multi-vision sensor-based fast localization system with image matching for challenging outdoor environments. Expert Syst. Appl. 2015, 42, 8830–8839. [Google Scholar] [CrossRef]
- Ojeda, L.; Borenstein, J. Personal dead-reckoning system for GPS-denied environments. In Proceedings of the IEEE International Workshop on Safety, Security and Rescue Robotics, Rome, Italy, 27–29 September 2007. [Google Scholar]
- Ashraf, I.; Hur, S.; Park, Y. Application of Deep Convolutional Neural Networks and Smartphone Sensors for Indoor Localization. Appl. Sci. 2019, 9, 2337. [Google Scholar] [CrossRef]
- Ashraf, I.; Hur, S.; Park, Y. MDIRECT-Magnetic field strength and peDestrIan dead RECkoning based indoor localizaTion. In Proceedings of the 2018 International Conference on Indoor Positioning and Indoor Navigation (IPIN), Nantes, France, 24–27 September 2018. [Google Scholar]
- Shu, Y.; Bo, C.; Shen, G.; Zhao, C.; Li, L.; Zhao, F. Magicol: Indoor localization using pervasive magnetic field and opportunistic WiFi sensing. IEEE J. Sel. Areas Commun. 2015, 33, 1443–1457. [Google Scholar] [CrossRef]
- Ashraf, I.; Hur, S.; Shafiq, M.; Kumari, S.; Park, Y. GUIDE: Smartphone sensors-based pedestrian indoor localization with heterogeneous devices. Int. J. Commun. Syst. 2019, e4062. [Google Scholar] [CrossRef]
- Bekkelien, A.; Deriaz, M.; Marchand-Maillet, S. Bluetooth Indoor Positioning. Master’s Thesis, University of Geneva, Geneva, Switzerland, March 2012. [Google Scholar]
- Hossain, A.M.; Soh, W.S. A comprehensive study of bluetooth signal parameters for localization. In Proceedings of the IEEE 18th International Symposium on Personal, Indoor and Mobile Radio Communications, Athens, Greece, 3–7 September 2007. [Google Scholar]
- Gu, Y.; Lo, A.; Niemegeers, I. A survey of indoor positioning systems for wireless personal networks. IEEE Commun. Surv. Tutor. 2009, 11, 13–32. [Google Scholar] [CrossRef] [Green Version]
- Bahl, P.; Padmanabhan, V.N.; Bahl, V.; Padmanabhan, V. RADAR: An In-Building RF-Based User Location and Tracking System. Available online: https://www.microsoft.com/en-us/research/publication/radar-an-in-building-rf-based-user-location-and-tracking-system/ (accessed on 24 July 2019).
- Liu, H.; Yang, J.; Sidhom, S.; Wang, Y.; Chen, Y.; Ye, F. Accurate WiFi based localization for smartphones using peer assistance. IEEE Trans. Mob. Comput. 2013, 13, 2199–2214. [Google Scholar] [CrossRef]
- Chandrasekaran, G.; Ergin, M.A.; Yang, J.; Liu, S.; Chen, Y.; Gruteser, M.; Martin, R.P. Empirical evaluation of the limits on localization using signal strength. In Proceedings of the 6th Annual IEEE Communications Society Conference on Sensor, Mesh and Ad Hoc Communications and Networks, Rome, Italy, 22–26 June 2009. [Google Scholar]
- Park, J.; Curtis, D.; Teller, S.; Ledlie, J. Implications of device diversity for organic localization. In Proceedings of the IEEE INFOCOM, Shanghai, China, 10–15 April 2011. [Google Scholar]
- Yuan, K. Wifi Analyzer. Available online: https://play.google.com/store/apps/details?-id=com.farproc.wifi.analyzer&hl=en (accessed on 14 August 2019).
- Bitew, M.A.; Hsiao, R.S.; Lin, H.P.; Lin, D.B. Hybrid indoor human localization system for addressing the issue of RSS variation in fingerprinting. Int. J. Distrib. Sens. Netw. 2015, 11, 831423. [Google Scholar] [CrossRef]
- Zheng, Z.; Chen, Y.; He, T.; Li, F.; Chen, D. Weight-RSS: A calibration-free and robust method for WLAN-Based indoor positioning. Int. J. Distrib. Sens. Netw. 2015, 11, 573582. [Google Scholar] [CrossRef]
- Torres-Sospedra, J.; Jiménez, A.; Moreira, A.; Lungenstrass, T.; Lu, W.C.; Knauth, S.; Mendoza-Silva, G.; Seco, F.; Pérez-Navarro, A.; Nicolau, M.; et al. Off-line evaluation of mobile-centric indoor positioning systems: The experiences from the 2017 IPIN competition. Sensors 2018, 18, 487. [Google Scholar] [CrossRef] [PubMed]
- Xu, L.; Feng, C.; Wang, Y.; Yao, Y.; Meng, M.Q.H. Variation of exterior telemetry links of capsule antenna ingested in human body. In Proceedings of the 8th World Congress on Intelligent Control and Automation, Jinan, China, 7–9 July 2010. [Google Scholar]
- Subaashini, K.; Dhivya, G.; Pitchiah, R. ZigBee RF signal strength for indoor location sensing-Experiments and results. In Proceedings of the 15th International Conference on Advanced Communications Technology (ICACT), Pyeongchang, Korea, 27–30 January 2013. [Google Scholar]
- Xu, L.; Yang, F.; Jiang, Y.; Zhang, L.; Feng, C.; Bao, N. Variation of received signal strength in wireless sensor network. In Proceedings of the 3rd International Conference on Advanced Computer Control, Harbin, China, 18–20 January 2011. [Google Scholar]
- Laitinen, H.; Juurakko, S.; Lahti, T.; Korhonen, R.; Lahteenmaki, J. Experimental evaluation of location methods based on signal-strength measurements. IEEE Trans. Veh. Technol. 2007, 56, 287–296. [Google Scholar] [CrossRef]
- Pivato, P.; Palopoli, L.; Petri, D. Accuracy of RSS-based centroid localization algorithms in an indoor environment. IEEE Trans. Instrum. Meas. 2011, 60, 3451–3460. [Google Scholar] [CrossRef]
- Haeberlen, A.; Flannery, E.; Ladd, A.M.; Rudys, A.; Wallach, D.S.; Kavraki, L.E. Practical robust localization over large-scale 802.11 wireless networks. In Proceedings of the 10th Annual International Conference on Mobile Computing and Networking, Philadelphia, PA, USA, 26 September–1 October 2004. [Google Scholar]
- Tarzia, S.P.; Dinda, P.A.; Dick, R.P.; Memik, G. Indoor localization without infrastructure using the acoustic background spectrum. In Proceedings of the 9th International Conference on Mobile Systems, Applications, and Services, Washington, DC, USA, 28 June–1 July 2011. [Google Scholar]
- Fang, S.H.; Cheng, Y.C.; Chien, Y.R. Exploiting sensed radio strength and precipitation for improved distance estimation. IEEE Sens. J. 2018, 18, 6863–6873. [Google Scholar] [CrossRef]
- Zheng, Z.; Chen, Y.; He, T.; Sun, L.; Chen, D. Feature learning for fingerprint-based positioning in indoor environment. Int. J. Distrib. Sens. Netw. 2015, 11, 452590. [Google Scholar] [CrossRef]
- Zheng, Z.; Chen, Y.; Chen, S.; Sun, L.; Chen, D. Bigloc: A two-stage positioning method for large indoor space. Int. J. Distrib. Sens. Netw. 2016, 12, 1289013. [Google Scholar] [CrossRef]
- Wu, C.; Yang, Z.; Zhou, Z.; Liu, Y.; Liu, M. Mitigating large errors in WiFi-based indoor localization for smartphones. IEEE Trans. Veh. Technol. 2016, 66, 6246–6257. [Google Scholar] [CrossRef]
- Ali, M.U.; Hur, S.; Park, S.; Park, Y. Harvesting Indoor Positioning Accuracy by Exploring Multiple Features From Received Signal Strength Vector. IEEE Access 2019, 7, 52110–52121. [Google Scholar] [CrossRef]
- Yang, F.; Xiong, J.; Liu, J.; Wang, C.; Li, Z.; Tong, P.; Chen, R. A Pairwise SSD Fingerprinting Method of Smartphone Indoor Localization for Enhanced Usability. Remote Sens. 2019, 11, 566. [Google Scholar] [CrossRef]
- He, S.; Shin, K.G. Steering crowdsourced signal map construction via Bayesian compressive sensing. In Proceedings of the IEEE INFOCOM 2018-IEEE Conference on Computer Communications, Honolulu, HI, USA, 15–19 April 2018. [Google Scholar]
- Jun, J.; He, L.; Gu, Y.; Jiang, W.; Kushwaha, G.; Vipin, A.; Cheng, L.; Liu, C.; Zhu, T. Low-overhead wifi fingerprinting. IEEE Trans. Mob. Comput. 2017, 17, 590–603. [Google Scholar] [CrossRef]
- Wang, Y.; Xiu, C.; Zhang, X.; Yang, D. WiFi indoor localization with CSI fingerprinting-based random forest. Sensors 2018, 18, 2869. [Google Scholar] [CrossRef] [PubMed]
- Kaemarungsi, K.; Krishnamurthy, P. Properties of indoor received signal strength for WLAN location fingerprinting. In Proceedings of the The First Annual International Conference on Mobile and Ubiquitous Systems: Networking and Services, Boston, MA, USA, 22–25 August 2004. [Google Scholar]
- Kaemarungs, K.; Krishnamurthy, P. Analysis of WLAN’s received signal strength indication for indoor location fingerprinting. Pervasive Mob. Comput. 2012, 8, 292–316. [Google Scholar] [CrossRef]
- Narzullaev, A.; Park, Y.; Jung, H. Accurate signal strength prediction based positioning for indoor WLAN systems. In Proceedings of the IEEE/ION Position, Location and Navigation Symposium, Monterey, CA, USA, 5–8 May 2008. [Google Scholar]
- Sadiq, A.S.; Bakar, K.A.; Ghafoor, K.Z.; Gonzalez, A.J. Mobility and Signal Strength-Aware Handover Decision in Mobile IPv 6 based Wireless LAN. In Proceedings of the World Congress on Engineering, London, UK, 4–6 July 2010. [Google Scholar]
- Kaemarungsi, K. Distribution of WLAN received signal strength indication for indoor location determination. In Proceedings of the 1st International Symposium on Wireless Pervasive Computing, Phuket, Thailand, 16–18 January 2006. [Google Scholar]
- Machaj, J.; Brida, P.; Tatarova, B. Impact of the number of access points in indoor fingerprinting localization. In Proceedings of the 20th International Conference Radioelektronika, Brno, Czech Republic, 19–21 April 2010. [Google Scholar]
- Della Rosa, F.; Xu, L.; Nurmi, J.; Laoudias, C.; Pelosi, M.; Terrezza, A. Hand-grip and body-loss impact on RSS measurements for localization of mass market devices. In Proceedings of the International Conference on Localization and GNSS (ICL-GNSS), Tampere, Finland, 29–30 June 2011. [Google Scholar]
- Zou, H.; Lu, X.; Jiang, H.; Xie, L. A fast and precise indoor localization algorithm based on an online sequential extreme learning machine. Sensors 2015, 15, 1804–1824. [Google Scholar] [CrossRef]
- Chen, Y.; Lymberopoulos, D.; Liu, J.; Priyantha, B. FM-based indoor localization. In Proceedings of the 10th International Conference on Mobile Systems, Applications, and Services, Low Wood Bay, Lake District, UK, 25–29 June 2012. [Google Scholar]
- Yoon, S.; Lee, K.; Rhee, I. FM-based indoor localization via automatic fingerprint DB construction and matching. In Proceeding of the 11th Annual International Conference on Mobile Systems, Applications, and Services, Taipei, Taiwan, 25–28 June 2013. [Google Scholar]
- Haque, I.T. A sensor based indoor localization through fingerprinting. J. Netw. Comput. Appl. 2014, 44, 220–229. [Google Scholar] [CrossRef]
- Della Rosa, F.; Pelosi, M.; Nurmi, J. Human-induced effects on rss ranging measurements for cooperative positioning. Int. J. Navig. Obs. 2012, 2012, 1–13. [Google Scholar] [CrossRef]
- Yoo, S.; Shin, Y.; Kim, S.; Choi, S. Toward realistic WiFi simulation with smartphone “Physics”. In Proceedings of the IEEE International Symposium on a World of Wireless, Mobile and Multimedia Networks, Sydney, Australia, 16–19 June 2014. [Google Scholar]
- Pessin, G.; Osório, F.S.; Ueyama, J.; Souza, J.R.; Wolf, D.F.; Braun, T.; Vargas, P.A. Evaluating the impact of the number of access points in mobile robots localization using artificial neural networks. In Proceedings of the 5th International Conference on Communication System Software and Middleware, Verona, Italy, 4–7 July 2011. [Google Scholar]


| Building-Device | Mean Error | Std. Dev | Max. Error | 75% Error |
|---|---|---|---|---|
| IT-S8 | 4.11 | 3.35 | 11.95 | 7.59 |
| IT-G6 | 4.27 | 3.68 | 12.68 | 7.69 |
| IT-G7 | 3.61 | 3.56 | 12.63 | 8.39 |
| RIC-S8 | 3.85 | 2.67 | 10.27 | 5.54 |
| RIC-G6 | 4.89 | 2.71 | 10.93 | 7.29 |
| RIC-G7 | 4.72 | 2.78 | 11.40 | 6.21 |
| TE-S8 | 4.61 | 3.20 | 14.43 | 6.57 |
| TE-G6 | 4.84 | 3.35 | 14.14 | 6.72 |
| TE-G7 | 4.28 | 3.40 | 14.00 | 7.00 |
| CRC-S8 | 4.00 | 2.53 | 12.14 | 5.69 |
| CRC-G6 | 4.14 | 2.91 | 12.72 | 6.34 |
| CRC-G7 | 4.40 | 2.69 | 13.43 | 6.21 |
| Building-Technique | Mean Error | Std. Dev | Max. Error | 75% Error |
|---|---|---|---|---|
| S8-WRSS | 7.01 | 5.06 | 20.17 | 11.47 |
| S8-KNN | 10.16 | 6.65 | 27.76 | 14.59 |
| S8-proposed | 4.27 | 3.10 | 14.43 | 6.68 |
| G6-WRSS | 9.15 | 6.61 | 25.63 | 14.99 |
| G6-KNN | 10.57 | 8.82 | 32.42 | 19.69 |
| G6-proposed | 4.79 | 3.31 | 14.13 | 7.21 |
| G7-WRSS | 6.57 | 5.52 | 22.25 | 11.62 |
| G7-KNN | 11.17 | 8.04 | 30.54 | 18.99 |
| G7-proposed | 4.43 | 3.19 | 14.01 | 6.90 |
| Human Body-Loss | Mean Error | Std. Dev | Max. Error | 75% Error |
|---|---|---|---|---|
| Galaxy S8 | ||||
| Low | 5.62 | 3.59 | 17.39 | 7.87 |
| Medium | 6.57 | 4.15 | 21.50 | 9.47 |
| High | 8.04 | 5.13 | 23.68 | 12.31 |
| LG G6 | ||||
| Low | 6.45 | 3.89 | 15.88 | 9.96 |
| Medium | 7.19 | 4.42 | 20.72 | 10.57 |
| High | 9.23 | 5.59 | 24.79 | 14.55 |
| LG G7 | ||||
| Low | 5.90 | 3.75 | 17.70 | 8.50 |
| Medium | 7.33 | 4.83 | 23.32 | 10.09 |
| High | 7.81 | 5.51 | 25.69 | 12.68 |
© 2019 by the authors. Licensee MDPI, Basel, Switzerland. This article is an open access article distributed under the terms and conditions of the Creative Commons Attribution (CC BY) license (http://creativecommons.org/licenses/by/4.0/).
Share and Cite
Ashraf, I.; Hur, S.; Park, Y. Indoor Positioning on Disparate Commercial Smartphones Using Wi-Fi Access Points Coverage Area. Sensors 2019, 19, 4351. https://doi.org/10.3390/s19194351
Ashraf I, Hur S, Park Y. Indoor Positioning on Disparate Commercial Smartphones Using Wi-Fi Access Points Coverage Area. Sensors. 2019; 19(19):4351. https://doi.org/10.3390/s19194351
Chicago/Turabian StyleAshraf, Imran, Soojung Hur, and Yongwan Park. 2019. "Indoor Positioning on Disparate Commercial Smartphones Using Wi-Fi Access Points Coverage Area" Sensors 19, no. 19: 4351. https://doi.org/10.3390/s19194351
APA StyleAshraf, I., Hur, S., & Park, Y. (2019). Indoor Positioning on Disparate Commercial Smartphones Using Wi-Fi Access Points Coverage Area. Sensors, 19(19), 4351. https://doi.org/10.3390/s19194351