Indoor Air-Quality Data-Monitoring System: Long-Term Monitoring Benefits


Abstract
:
1. Introduction
2. Materials and Methods
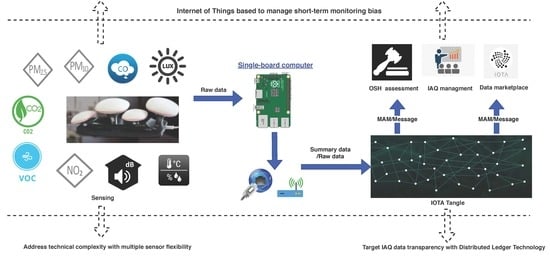
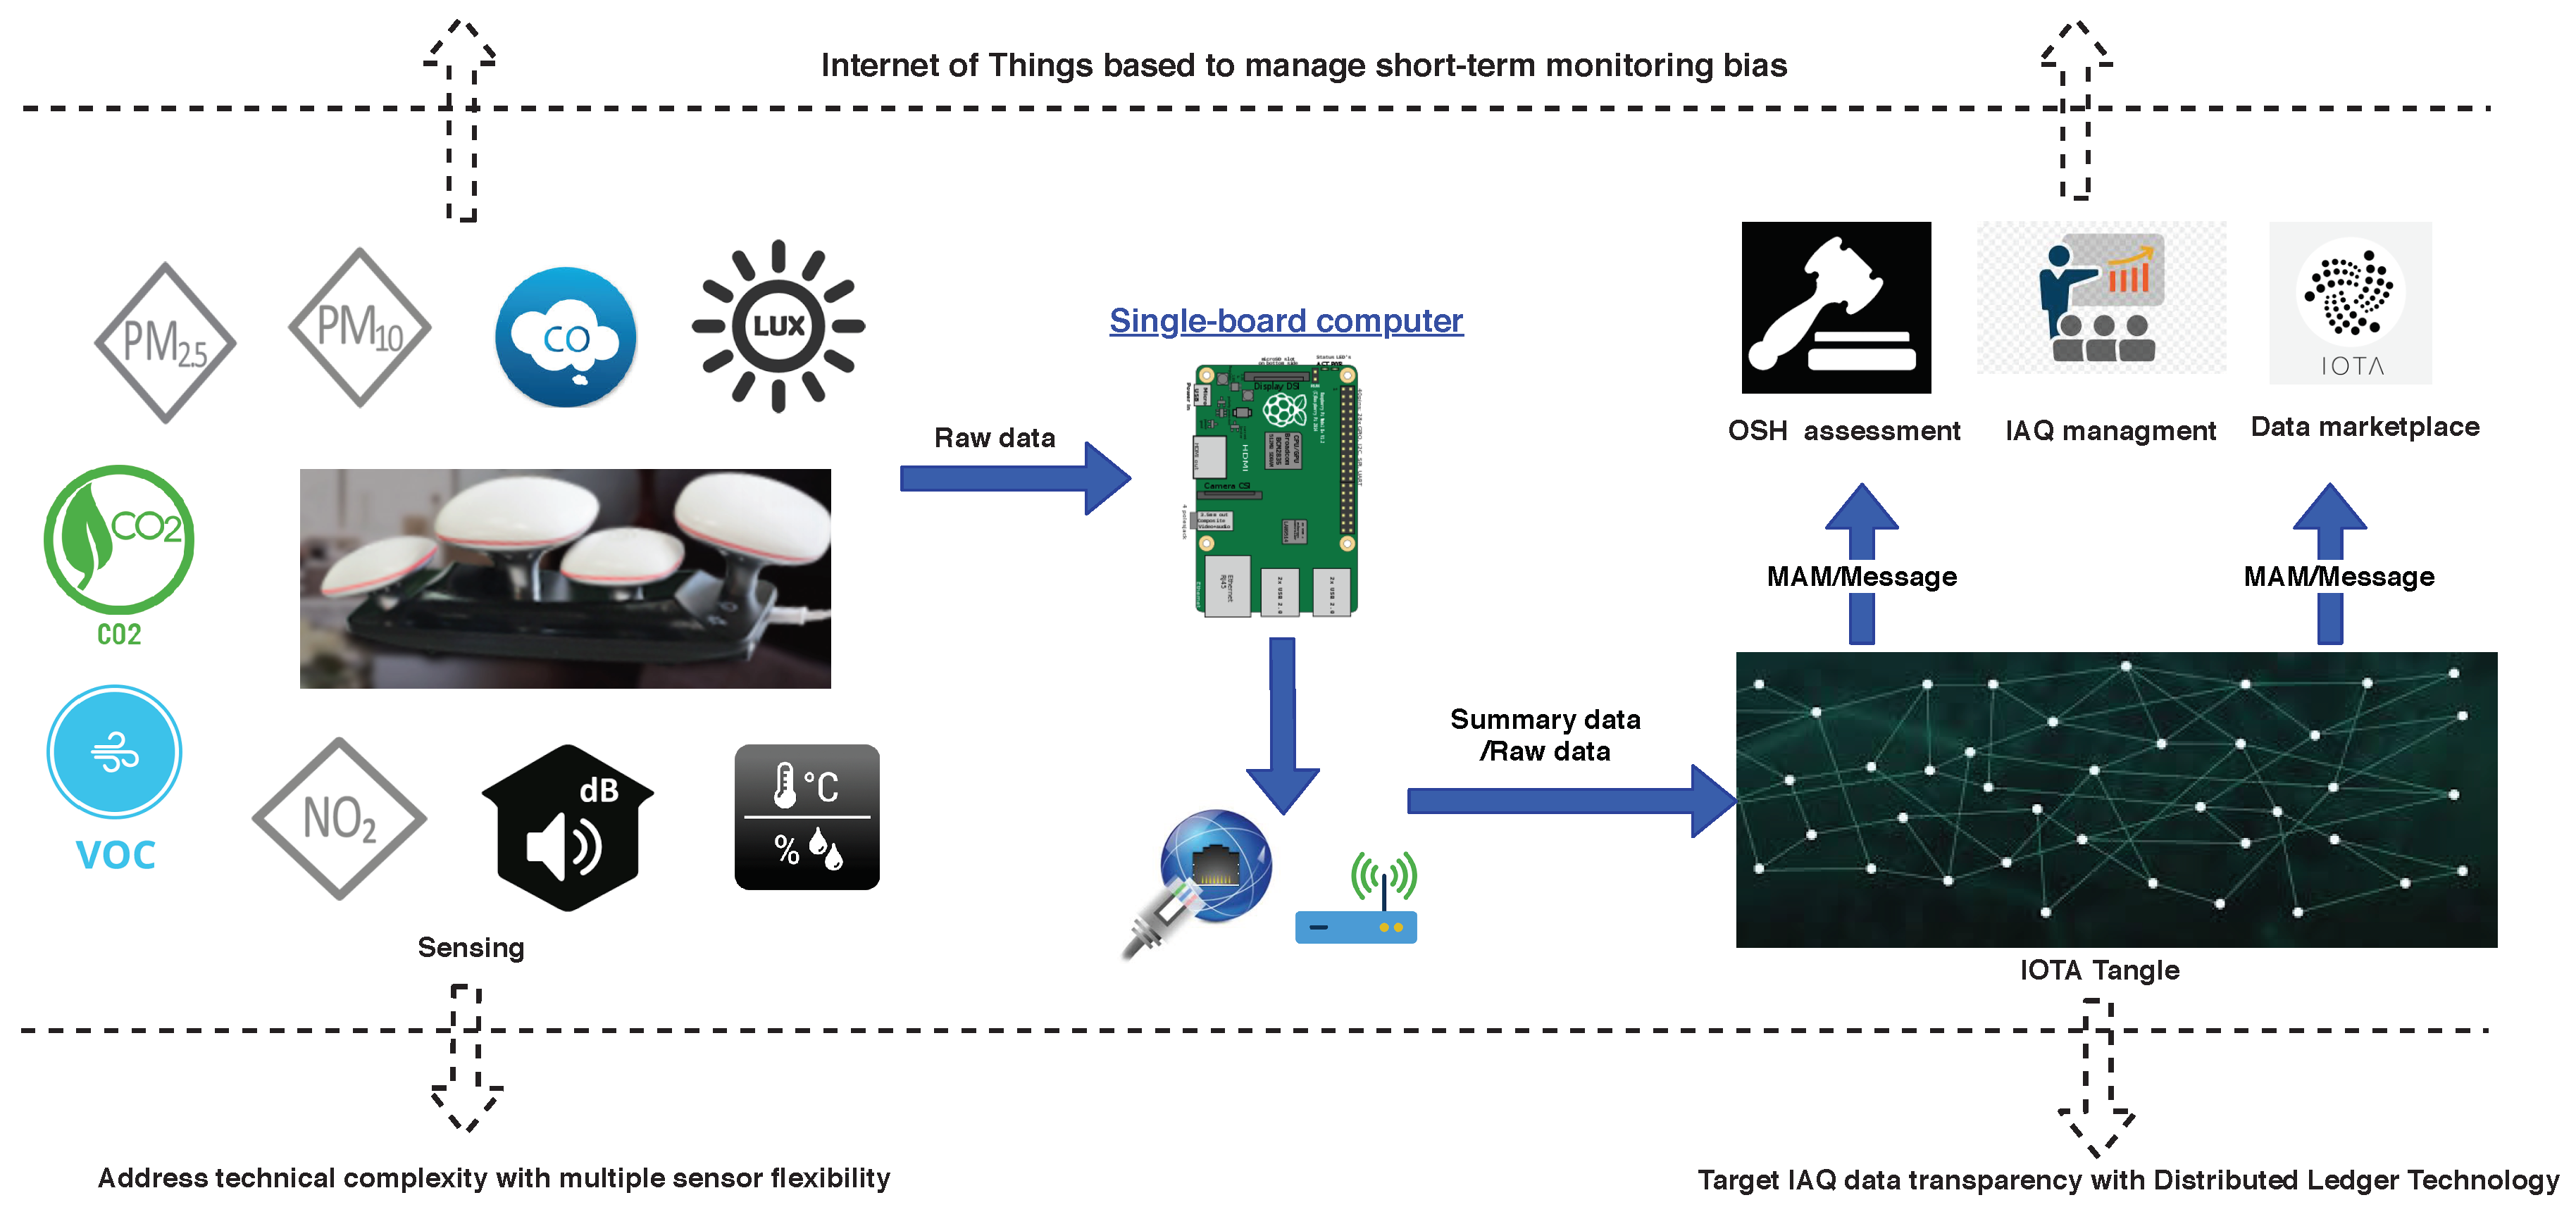
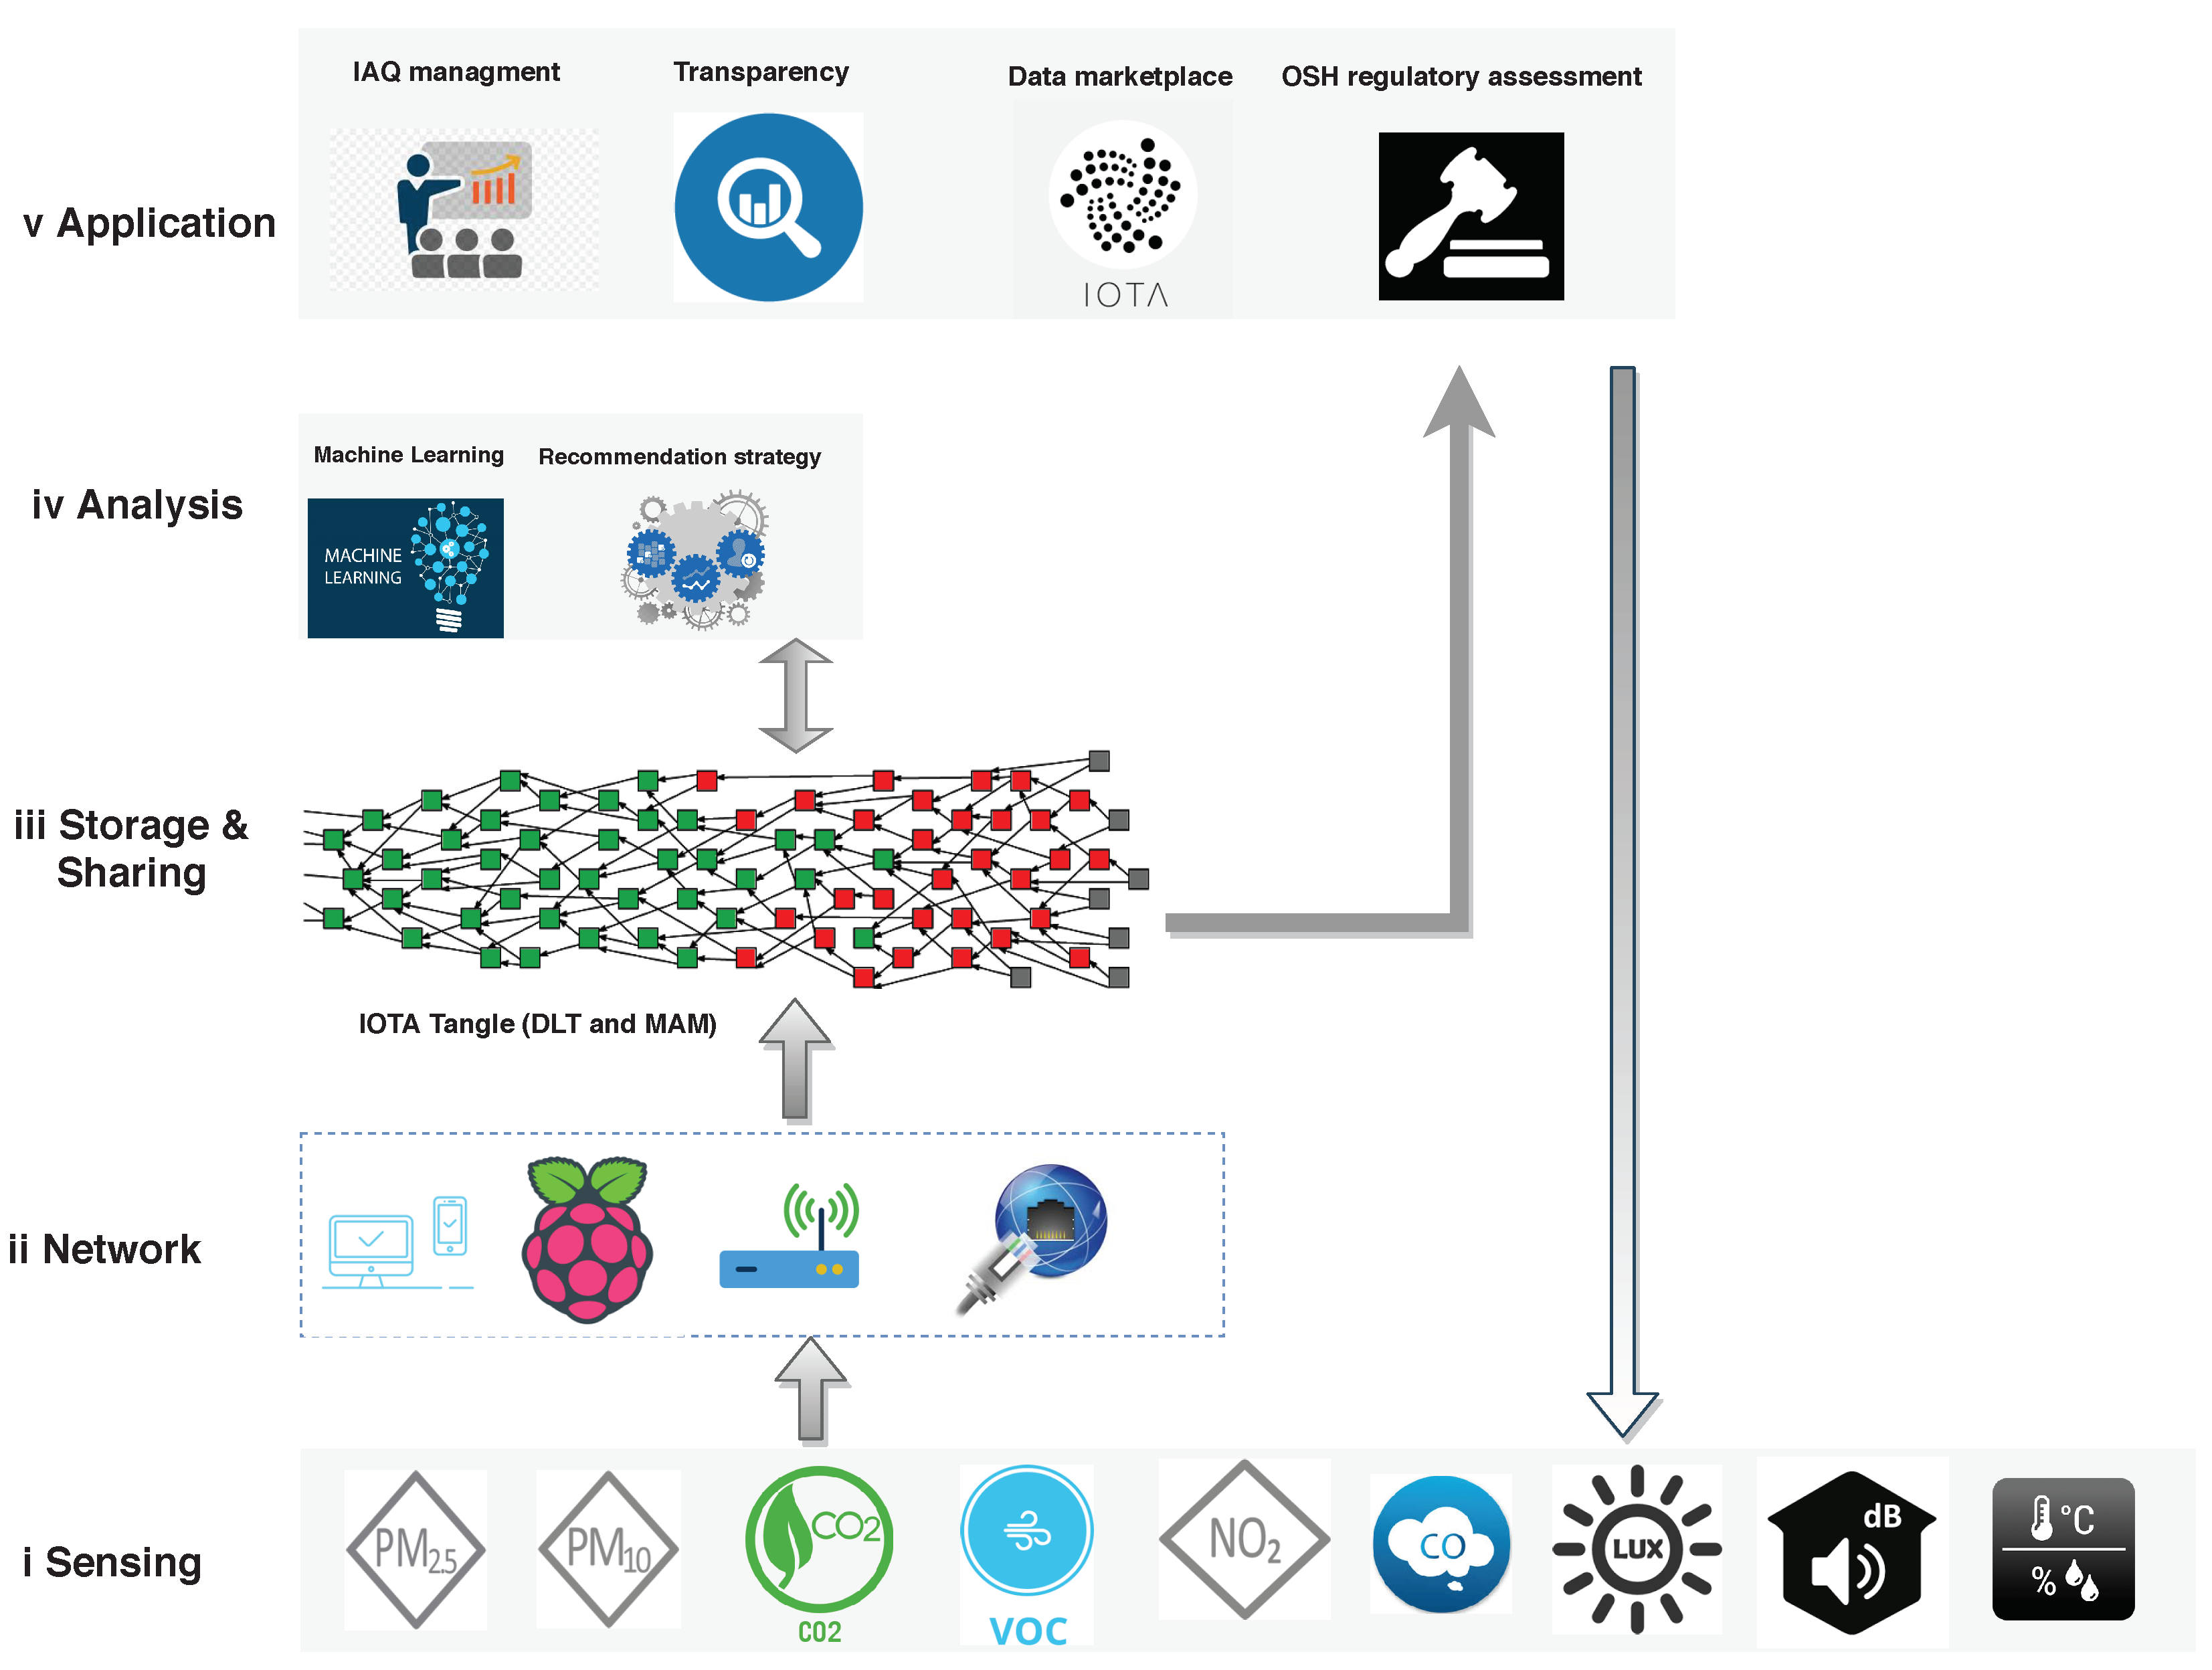
2.1. Framework
- IoT. The term "Internet of things" was coined by Kevin Ashton of Procter & Gamble in 1999, when he viewed Radio-frequency identification (RFID) as essential to the IoT, allowing computers to manage all individual things (all existing things). Presently, the IoT concept is that the pervasive presence of a variety of things or objects—such as RFID tags, sensors, actuators, mobile phones, etc.
- Low-cost IoT-based sensing. The low-cost IoT sensors enable the use of wireless communications and computing for interacting with the physical world. The relevant sensors could sense indoor environmental parameters such as IAQ, comfort, lighting, and acoustic conditions. Several systems [17,18,19] have been developed for monitoring indoor environmental conditions with low-cost sensors. The data quality generated by these sensors are often of questionable. The performance of different low-cost air-quality sensors vary from unit to unit, spatially and temporally, as it relies on different algorithms, the meteorological conditions and atmospheric composition [20]. The IAQ data-monitoring platform implemented in this study is low-cost sensor-based considering that high accuracy is not the top requirement for the targeted applications of this study. Instead, this platform is developed for purposes such as awareness raising and recommendation of sampling period selection for OSH legal compliance, which only demand the pollution level on a coarse scale. In addition, as shown in Figure 2, the accuracy of the proposed platform can be improved through data adjustment with professional instrument at each OSH regulatory spot-check in long periods, just by observing potential bias or sensor saturation.
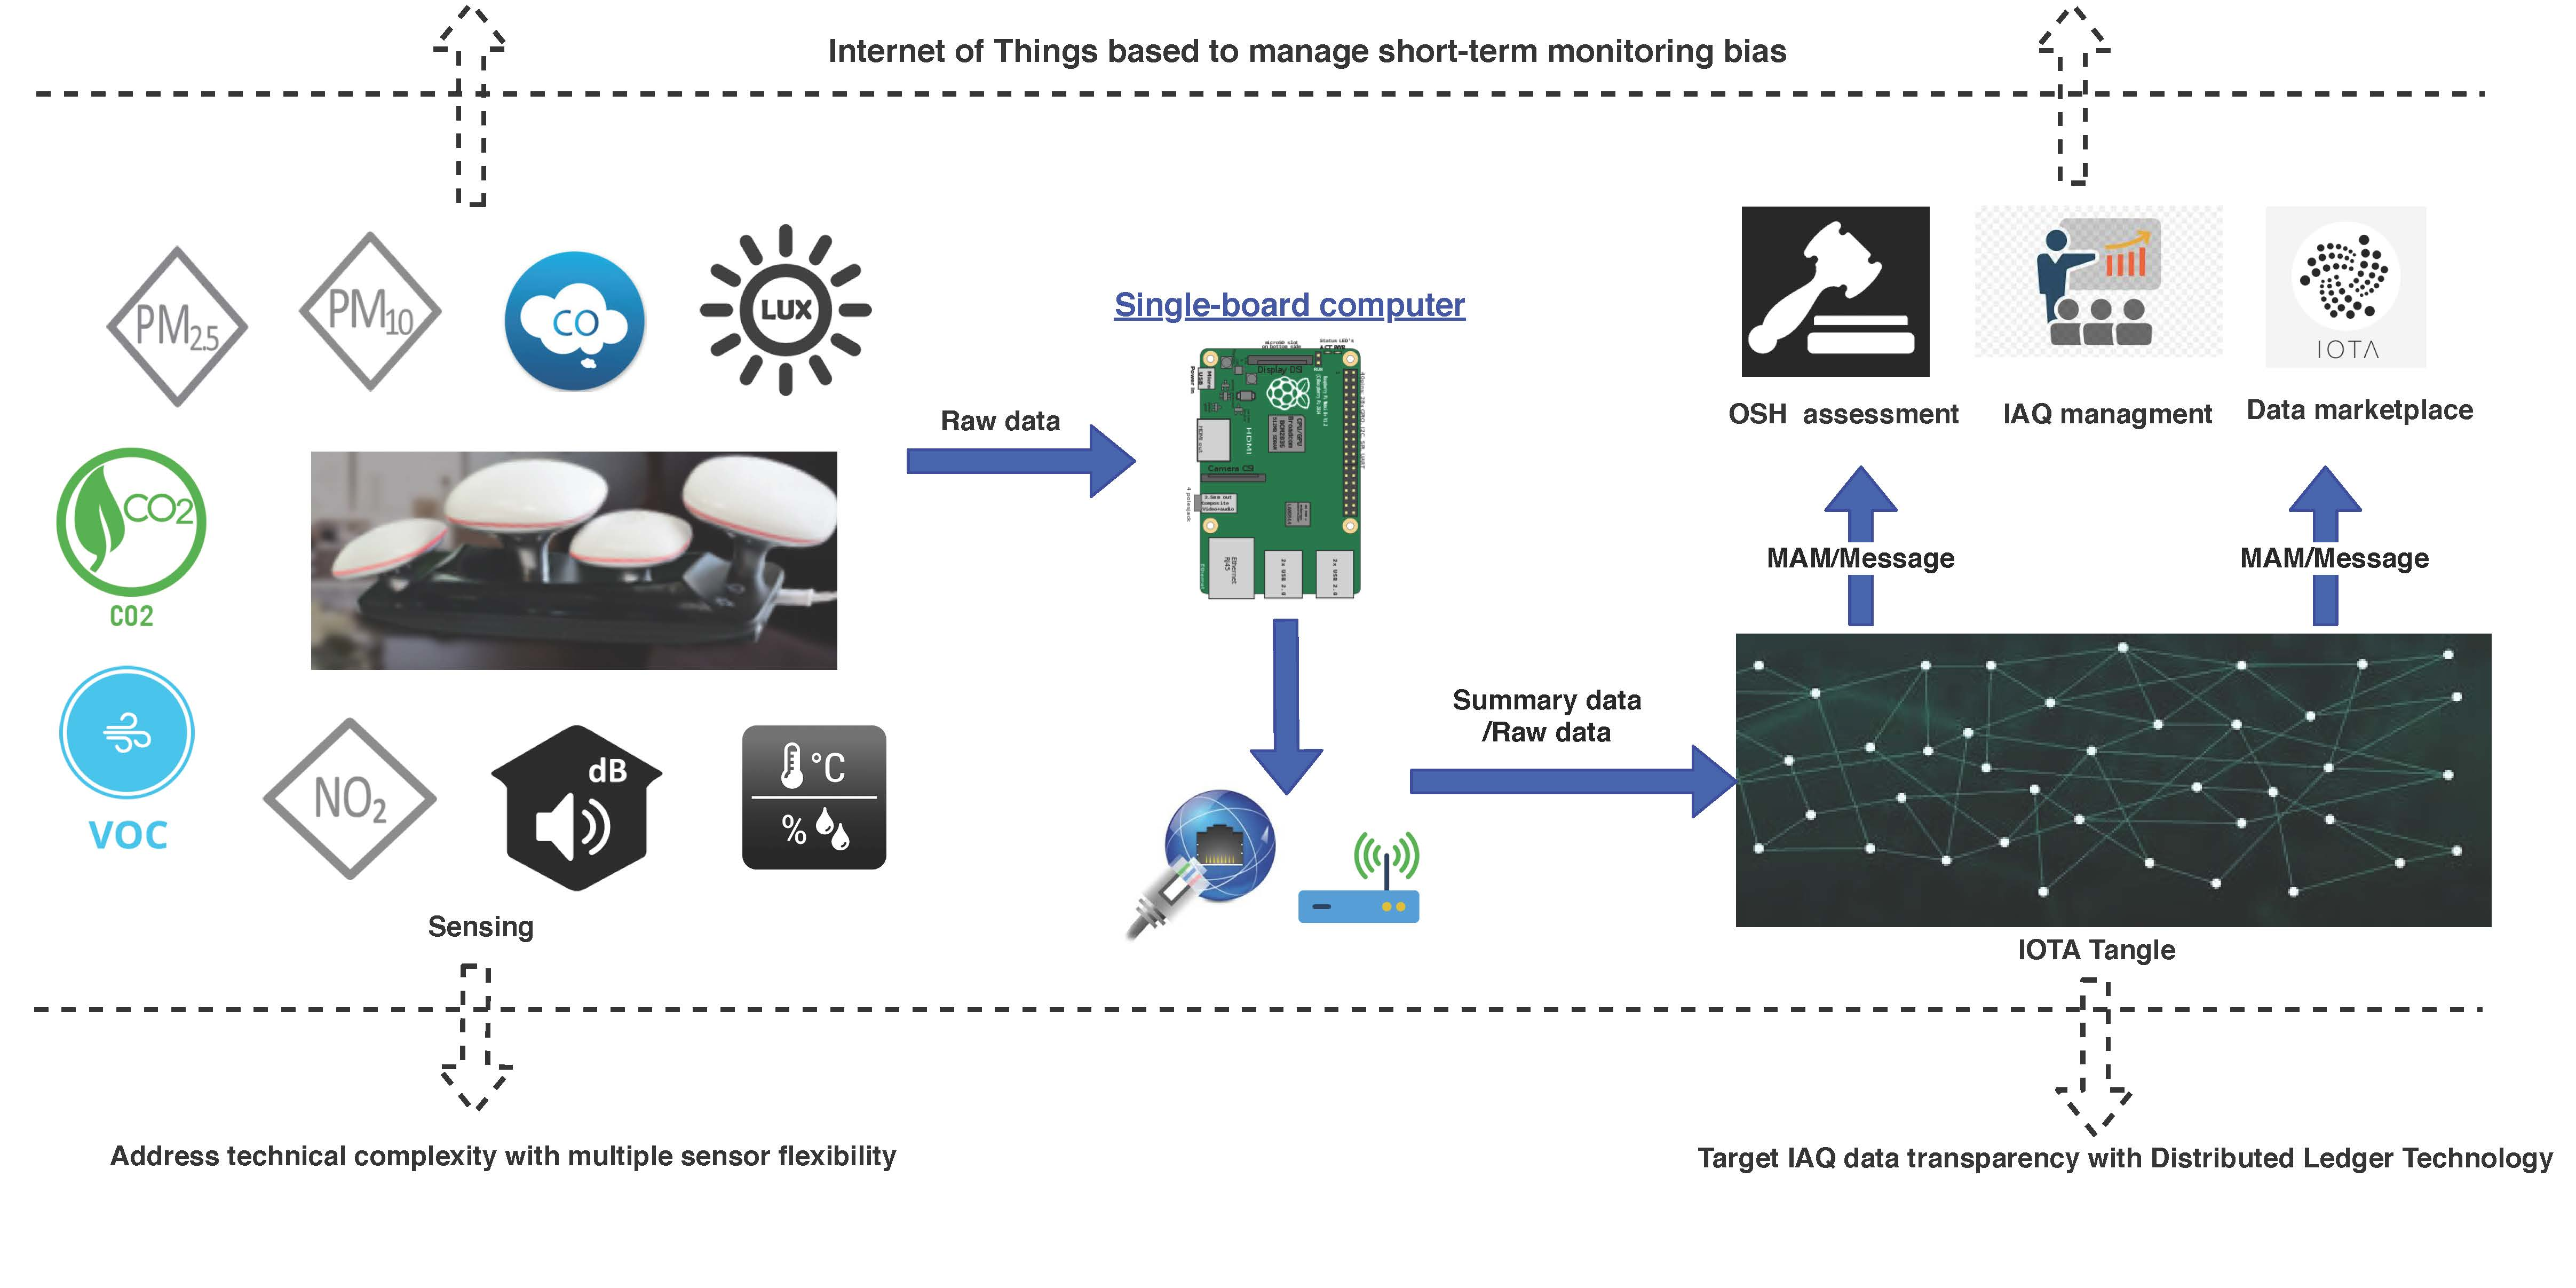
- Network. The network e.g., IoT gateway, bridges sensor networks with the traditional communication networks. It settles the heterogeneity between various sensor networks, mobile communication networks, and the Internet (all computer networks) [21,22]. A single-board computer (SBC), such as Raspberry Pi, could provide low-cost and efficient gateway services based on emerging IoT standards.
- DLT. Blockchain, as the first DLT, was invented by Satoshi Nakamoto in 2008 to serve as the public transaction ledger of the cryptocurrency Bitcoin [23]. The main component of DLT is a distributed ledger, which is used as a distributed database maintained by a consensus protocol run by nodes in a peer-to-peer network. This consensus protocol replaces a central administrator, since all peers contribute to maintaining the integrity of the database [24]. With a decentralized and consensus-driven nature, DLT could provide reliable solutions, such as blockchain [23], Ethereum [25] and IOTA Tangle [26], to enable secure and tamper-resistant data storage and sharing.
- IOTA and the Tangle. IOTA is a tangle-based cryptocurrency designed specifically for the IoT industry. The IOTA tangle naturally succeeds the blockchain as its next evolutionary step by overcoming some of its fundamental limitations, such as scalability, high transaction fees, and vulnerability to quantum attack [26]. The main feature of the tangle is that it uses a Directed Acyclic Graph (DAG) for storing transactions instead of sequential blocks. In the Tangle, users need to perform a small amount of computational work to approve two previous transactions to issue a new transaction. This new transaction will be validated by subsequent transactions [27].
- Masked Authenticated Messaging (MAM). The main data communication protocol used for data sharing in IOTA is MAM. It enables clients to emit and access an encrypted data streams over the IOTA Tangle, regardless of the size or cost of a device [28]. MAM uses channels (Public/Private/Restricted) for message spreading. IOTA users can create a channel and publish a message of any size, at any time. A small amount of proof-of-work is required to allow the data to propagate through the network and to prevent spamming. Other users can subscribe to this channel through its address, and receive a message that is published by the channel owner.
2.2. Standards and Guidelines for OSH Assessment
2.3. IoT and DLT-Based Data-Monitoring System
2.4. Case Studies
3. Results and Discussion
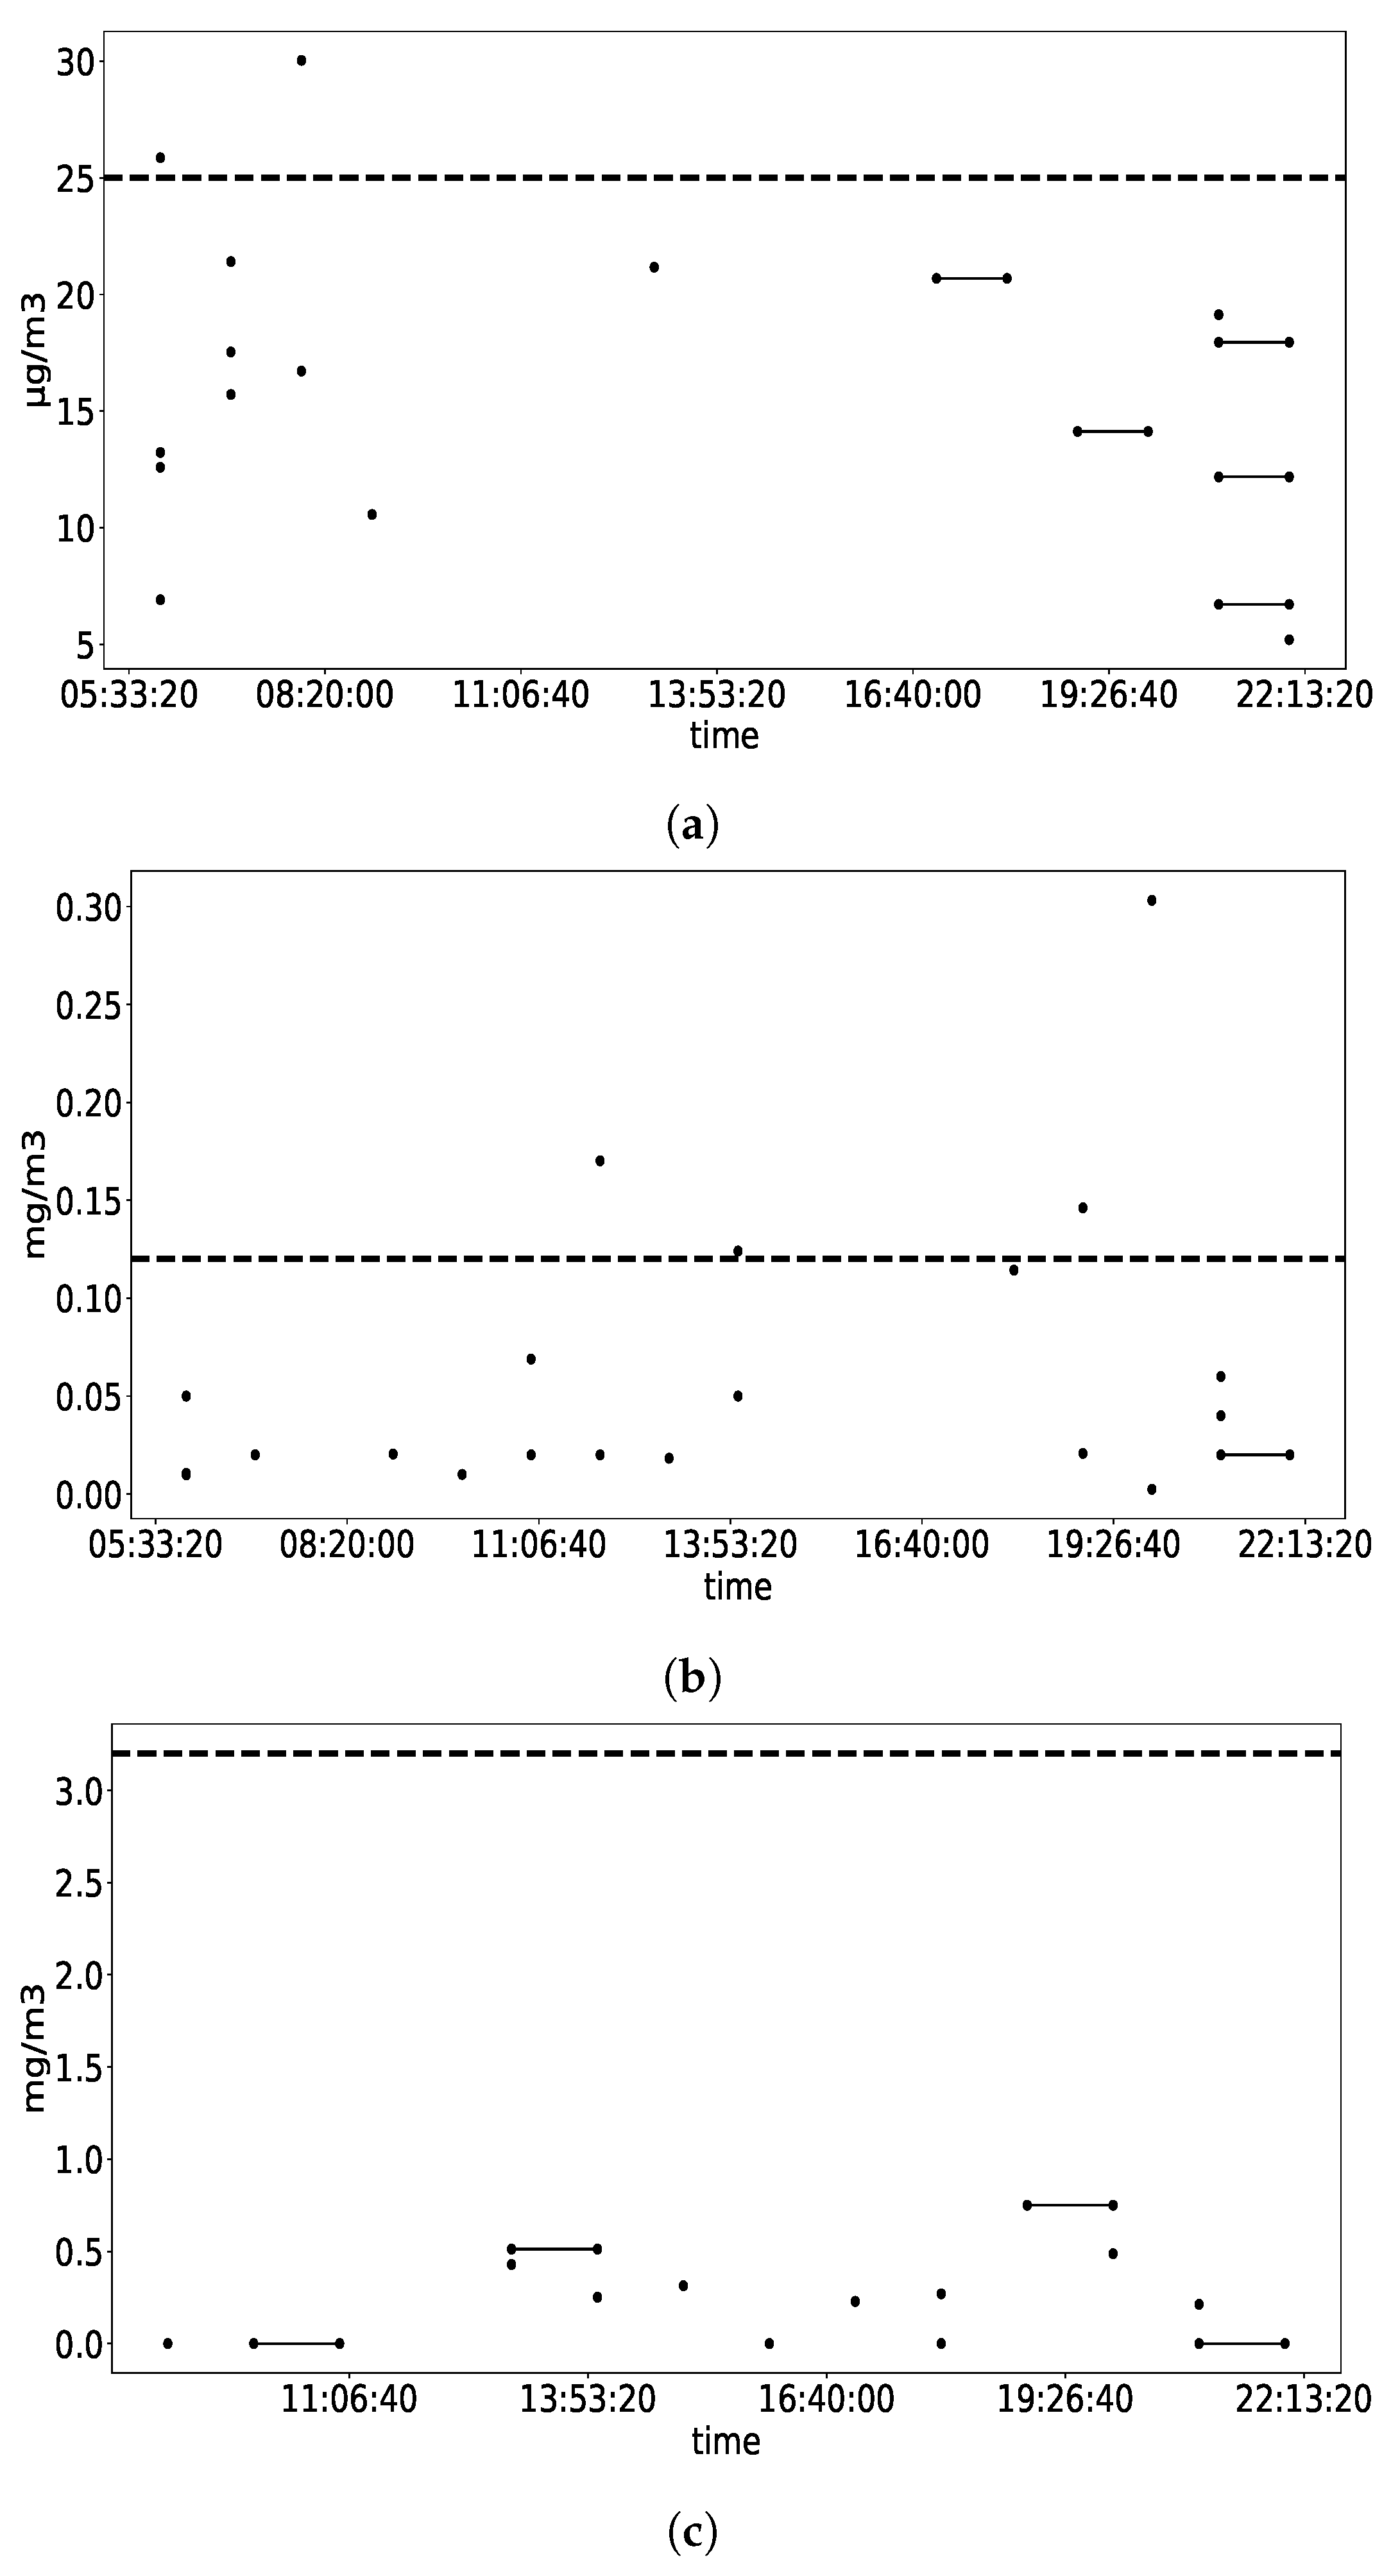
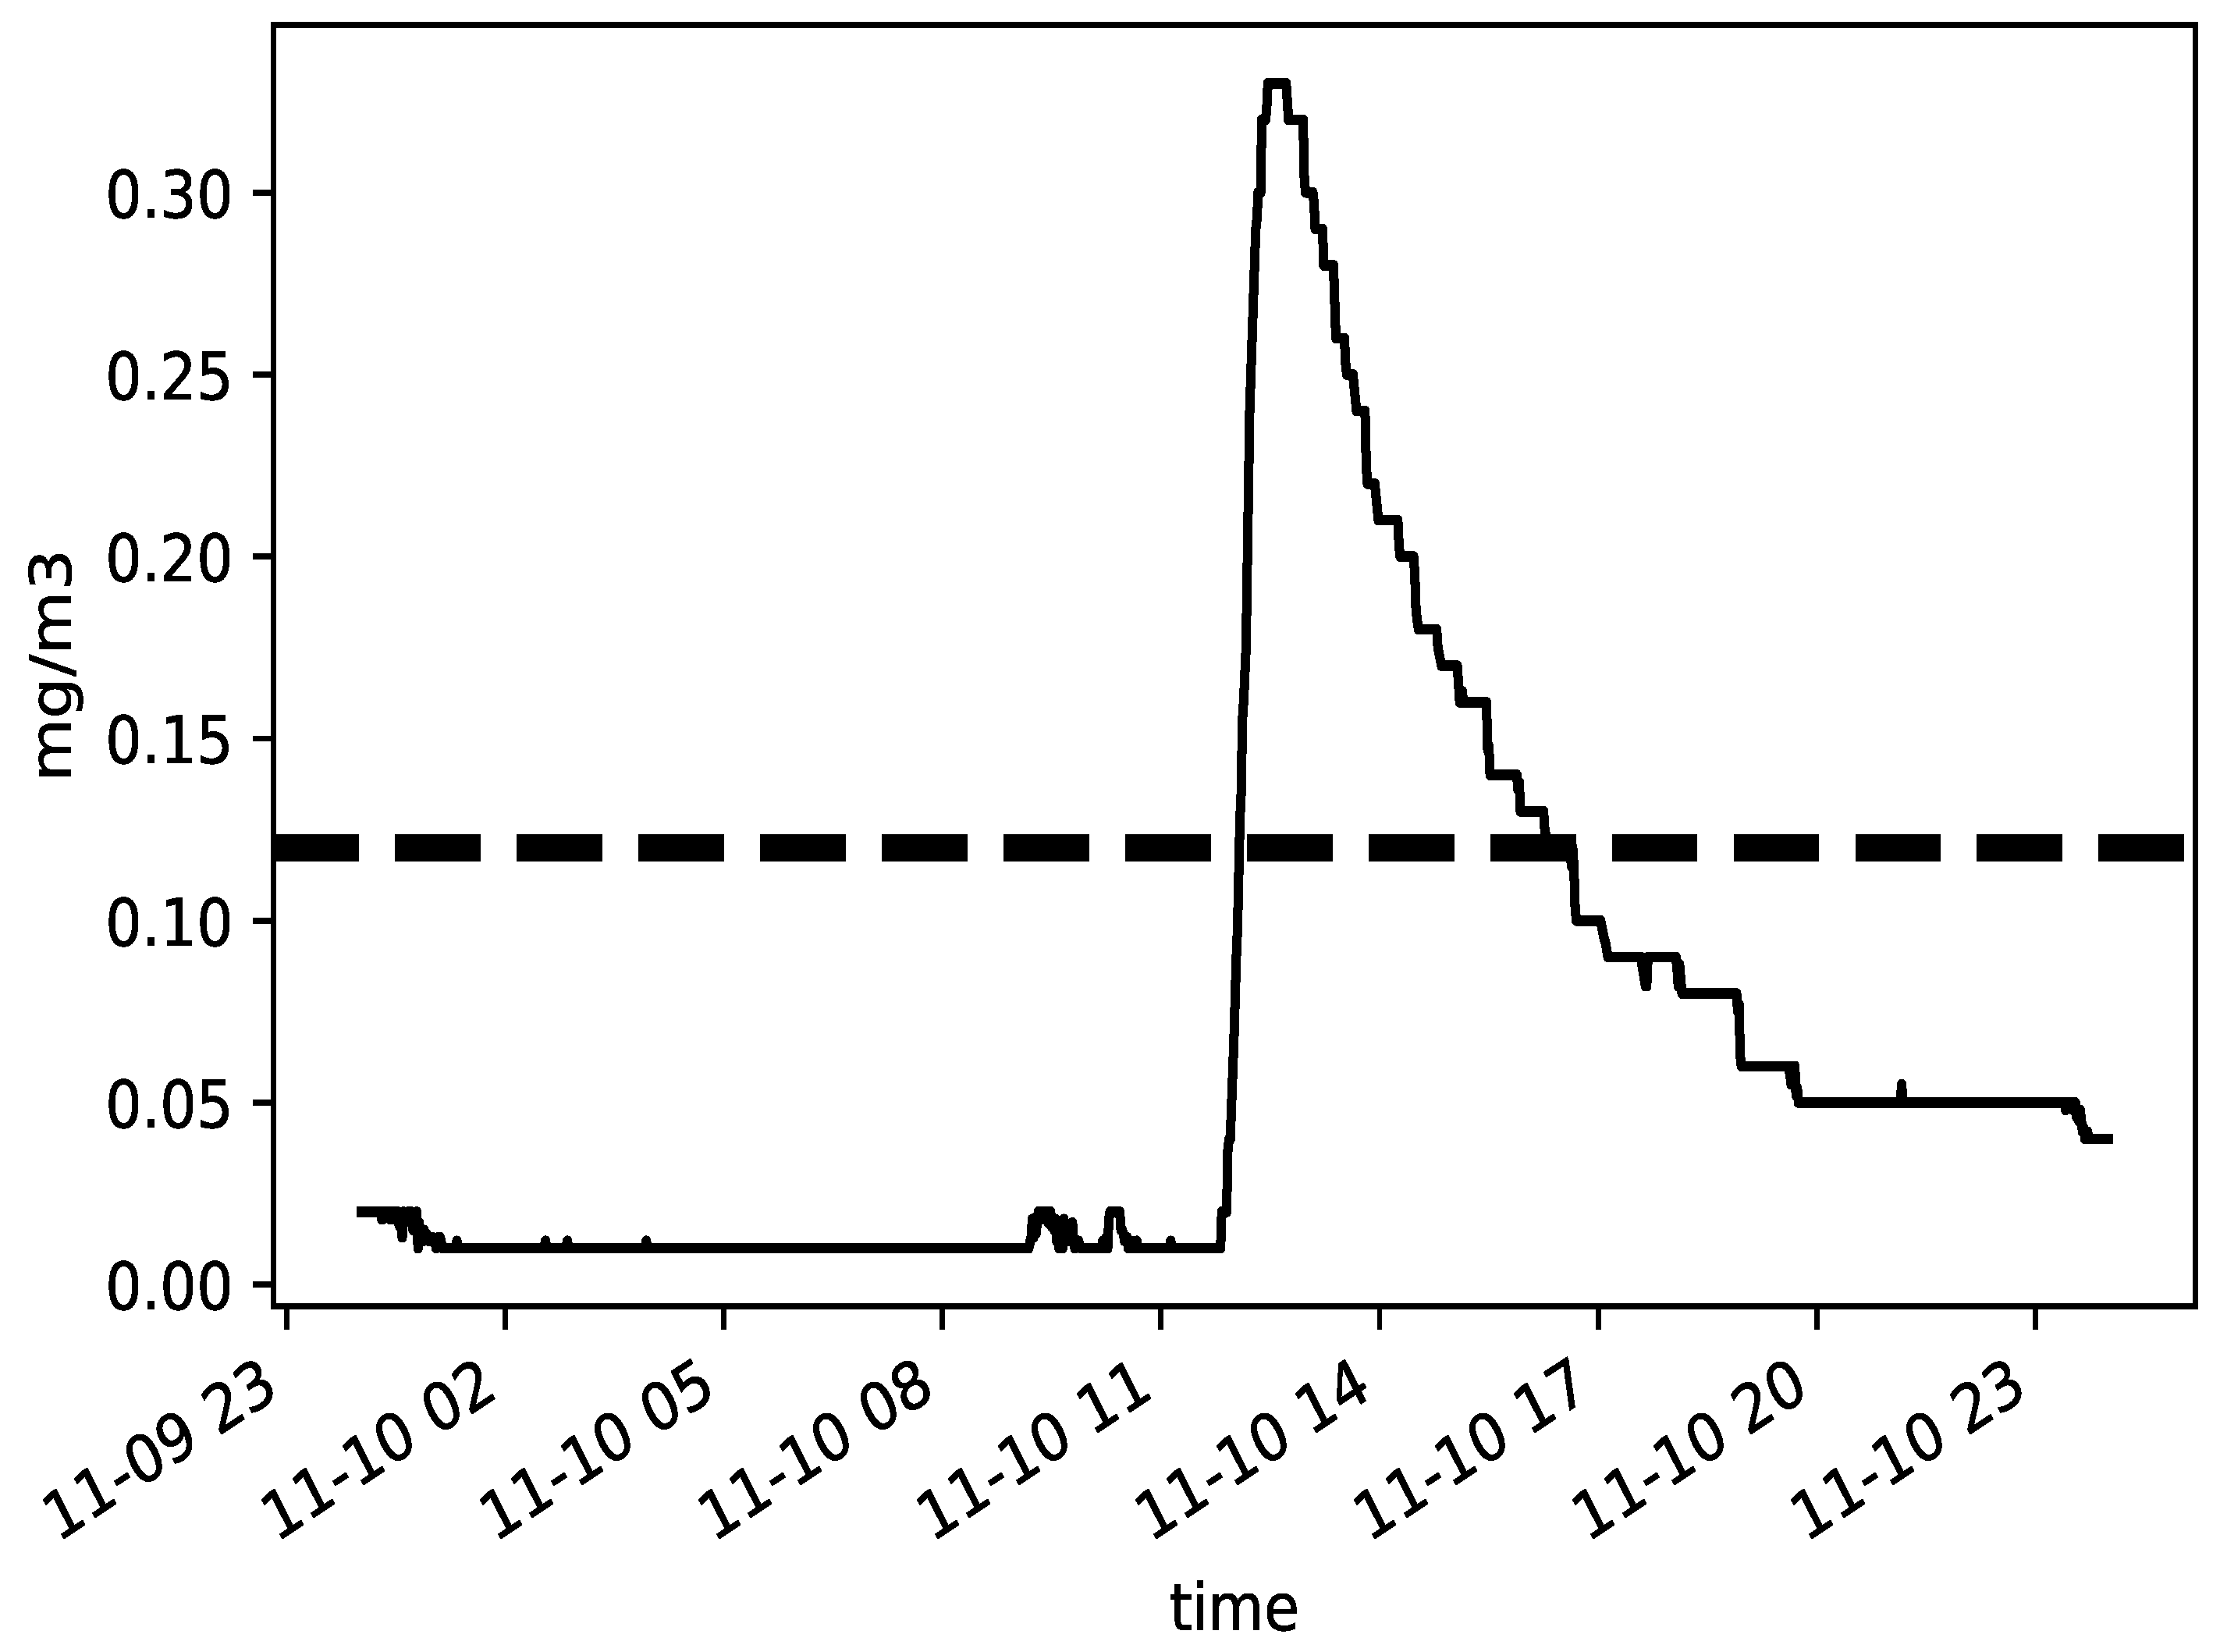
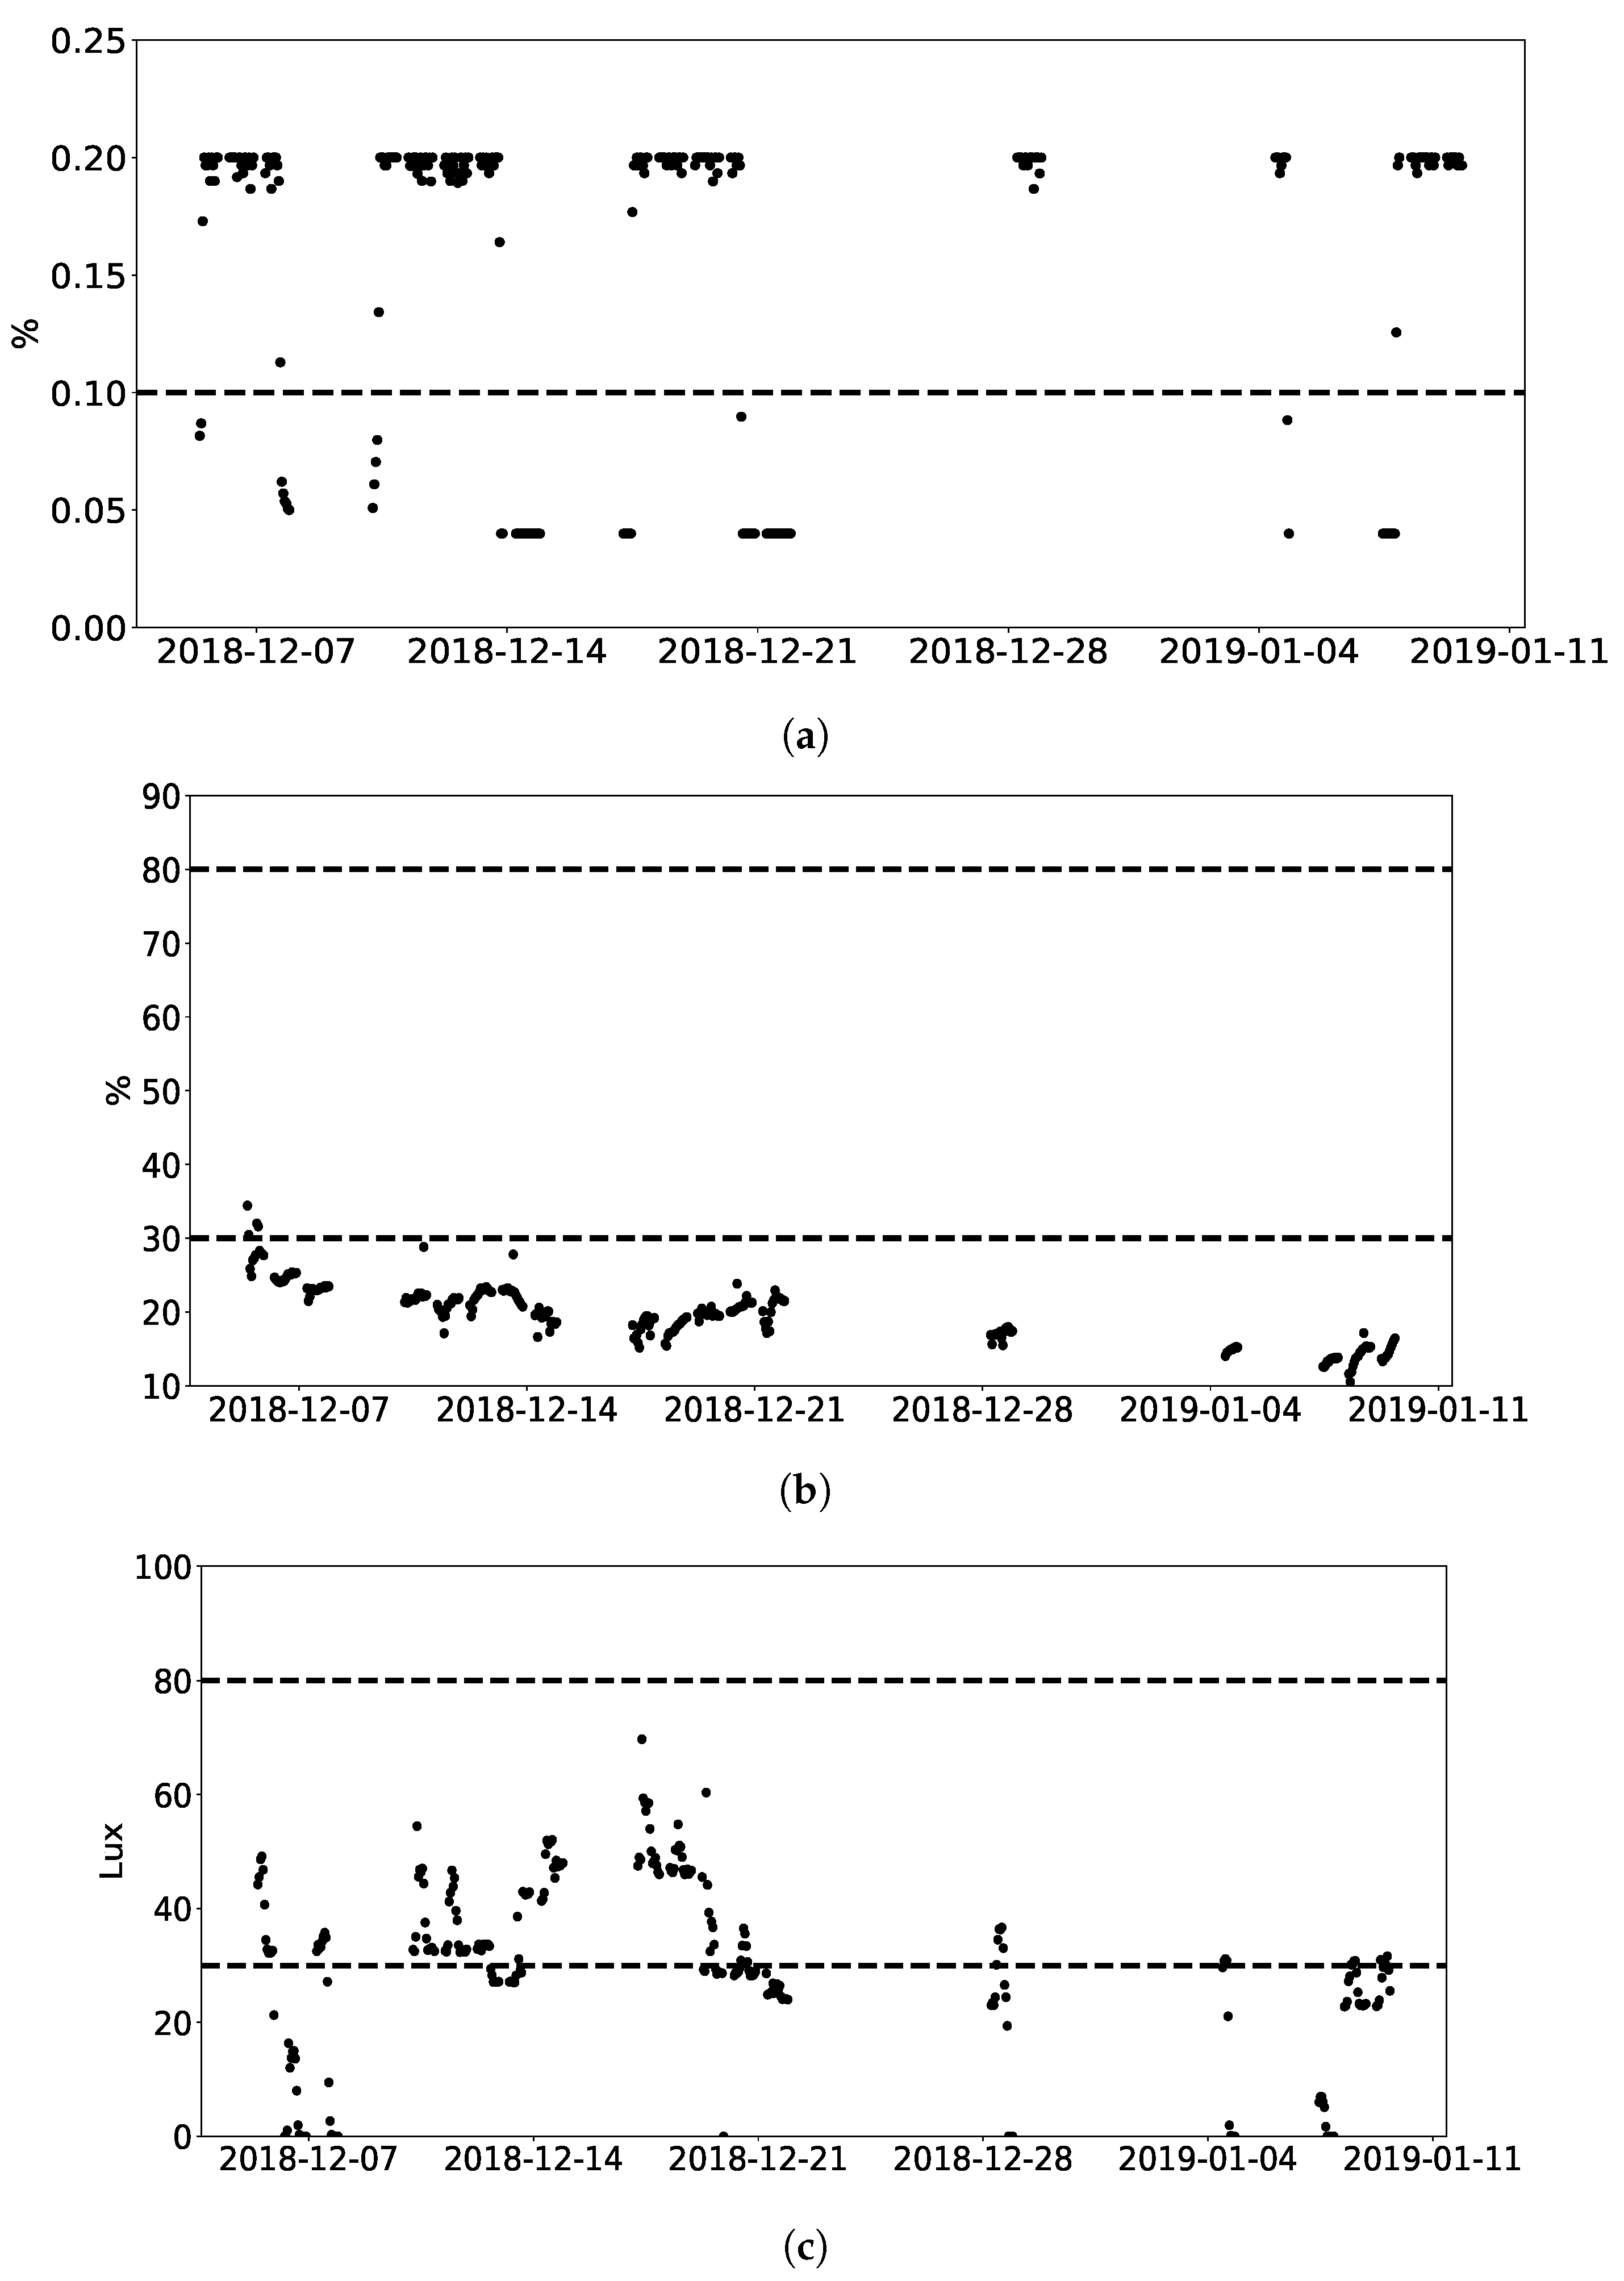
3.1. Long-term Monitoring Benefits for OHS Assessment
3.2. Long-Term Monitoring Benefits for Regulating Working Conditions
3.3. Long-Term Monitoring Benefits for OSH Transparency
3.4. Long-Term Monitoring Benefits for Data Sharing by IOTA
4. Conclusions
Author Contributions
Funding
Acknowledgments
Conflicts of Interest
Abbreviations
| DLT | Distributed Ledger Technologies |
| GDPR | General Data Protection Regulation |
| IAQ | Indoor Air Quality |
| IoT | Internet of Things |
| IIoT | Industrial Internet of Things |
| OSH | Occupational Safety Health |
| TLV | Threshold Limit Value |
| TVOC | Total Volatile Organic Components |
Appendix A

| Study | P | T | S | D | Tr |
|---|---|---|---|---|---|
| [3] | NO2, TVOC, PM0.3-10 | 8h working time in five working days, September 2015 | No | Aeroqual 200 (NO2, TVOC), Extech VPC300 (PM0.3-10) | No |
| [10] | PM2.5, HCHO, CO2 | PM2.5 and CO2 entire year, HCHO in four seasons (sampling time: 20 min) | Yes | A: on-line monitoring system with Ikair ( CO2) and Yun (PM2.5) sensors B: on-site measurement for HCHO by spectrophotometry | No |
| [43] | HCHO, CO2 | 4 h between 08:00 AM and 12:00 AM | No | A real-time occupational exposure monitoring system with Grove-HCHO and T6613C (CO2) | No |
| [8] | NO2, O3 and 29 VOCs | One week between 20 and 27 December 2012 | No | Diffusive samplers | No |
| [11] | 34 VOCs, NO2,O3 | Summer: 24 and 28 May 2010; Winter: February 21 and 25, 2011 | Yes | Passive samplers | No |
| [12] | Temperature, humidity, HCHO, C6H6, C2HCL3, Pinene, Limonene, NO2, CO2, CO, PM2.5, VOCs, Radon, O3 | Monday to Friday, in both non-heating (26/09/2011-14/10/2011) and heating (23/01/2012-10/02/2012) | Yes | Diffusive samplers (HCHO, C6H6, C2HCl3, Pinene, Limonene, NO2, O3); Telair 7001 (CO2), aeroQUAL (CO), PM2.5 (Derenda LVS3.1/PMS3.1-15) | No |
| [9] | PM2.5, PM10, CO2, CO, HCHO, and VOCs, O3 | 1 h | No | Lighthouse handheld 3016 (PM, temperature, humidity), WolfSense (CO2, CO, VOC and O3), htV-M (HCHO) | No |
| [44] | PAHs | One month in April | No | Passive sampler | No |
| [45] | VOCs, HCHO, acetone and O3 | During 4 h with a 40-m frequency | No | PRO-EKOS AT. 401X (HCHO, O3), gas chromatograph Voyager (VOCs and acetone) | No |
| [46] | temperature, humidity, CO, CO2, PM10, NO2, HCHO, C6H6 and toluene, bacteria and fungi | 3–10 December | No | Passive bubblers (HCHO), passive bubbler (NO2), SKC passive sampler (VOCs) | No |
| [47] | PM, noise, temperature, humidity | May 2009 (hot season) and February 2010 (cold season) | Yes | – | No |
| [48] | Bacteria, fungi, dust, ammonia, and HCHO | 2 h | No | Passive sampler | No |
| [49] | Eighteen PAHs | 28 days (May–June 2014) | No | Passive sampler | No |
| [50] | PM | Pre-winter (November and early December 2013) and winter season (January and early February 2014) | Yes | MOUDI | No |
| [51] | 17 VOCs | May 2015 | No | Passive sampler | No |
| [52] | TVOC, 13 VOCs, PM2.5, NOx, O3 | Two weeks (working and non-working days) which starts from early morning (08:00 a.m.) to late evening (20:00 p.m.)during winter season of 2014 | No | Model EC 9810 series (O3), Model Ecotech Sernious 40 (NOx), Micro IV Single Gas Detector (CO), MiniVol™ TAS (PM2.5), PhoCheck 5000 photo-ionization detector (PID) (TVOC), NIOSH method (VOCs) | No |
| [53] | benzene, toluene, ethylbenzene m,p-xylene and o-xylene (BTEX) | Winter (from 9 December 2013 to 17 January 2014) and Spring (from 24 March to 17 April 2014 | Yes | Passive sampler | No |
| [54] | PM | Three weeks during the summer, autumn, and winter in 2014 and 2015 | Yes | OPS; TSI model 3330 | No |
| [55] | HCHO and C6H6 | 45 min | No | Passive samplers | No |
| [56] | HCHO | Second semester of 2010 and first semester of 2011 | No | Passive samplers | No |
| [57] | VOCs | 24 h | No | Passive sampling | No |
| [58] | Temperature, humidity, fungi, dust, endotoxins, CHO, VOCs, CO2, NO2 | Two seasons: October–Match; April–September | Yes | Radiello passive sampler (CHO and VOCs), Passam Ag passive sampler (NO2), Q-Trak (Temperature, humidity, CO2) | No |
| [59] | PM2.5, PM10 | During rush hours (8:00 a.m.–12:00 p.m.) for one week per each season from June 2015–June 2016 | Yes | Dust-Trak | No |
References
- Ana, G.R.; Alli, A.S.; Uhiara, D.C.; Shendell, D.G. Indoor air quality and reported health symptoms among hair dressers in salons in Ibadan, Nigeria. J. Chem. Health Saf. 2019, 26, 23–30. [Google Scholar] [CrossRef]
- Tham, K.W. Indoor air quality and its effects on humans—A review of challenges and developments in the last 30 years. Energy Build. 2016, 130, 637–650. [Google Scholar] [CrossRef]
- Kiurski, J.S.; Aksentijević, S.M.; Mandarić, S.D. Statistical approach for characterization of photocopying indoor pollution. Air Qual. Atmos. Health 2018, 11, 867–881. [Google Scholar] [CrossRef]
- EPA. Why Indoor Air Quality is Important to Schools. Available online: https://www.epa.gov/iaq-schools/why-indoor-air-quality-important-schools (accessed on 24 September 2019).
- Fisk, W.J.; Rosenfeld, A.H. Estimates of Improved Productivity and Health from Better Indoor Environments. Indoor Air 1997, 7, 158–172. [Google Scholar] [CrossRef]
- Hadei, M.; Hopke, P.K.; Rafiee, M.; Rastkari, N.; Yarahmadi, M.; Kermani, M.; Shahsavani, A. Indoor and outdoor concentrations of BTEX and formaldehyde in Tehran, Iran: Effects of building characteristics and health risk assessment. Environ. Sci. Pollut. Res. 2018, 25, 27423–27437. [Google Scholar] [CrossRef] [PubMed]
- WHO. Air Pollution and Health. Available online: https://www.who.int/airpollution/en/ (accessed on 24 September 2019).
- Can, E.; Üzmez, Ö.Ö.; Döğeroğlu, T.; Gaga, E.O. Indoor air quality assessment in painting and printmaking department of a fine arts faculty building. Atmos. Pollut. Res. 2015, 6, 1035–1045. [Google Scholar] [CrossRef]
- Ramos, C.A.; Wolterbeek, H.T.; Almeida, S.M. Exposure to indoor air pollutants during physical activity in fitness centers. Build. Environ. 2014, 82, 349–360. [Google Scholar] [CrossRef]
- Liu, J.; Dai, X.; Li, X.; Jia, S.; Pei, J.; Sun, Y.; Lai, D.; Shen, X.; Sun, H.; Yin, H.; et al. Indoor air quality and occupants’ ventilation habits in China: Seasonal measurement and long-term monitoring. Build. Environ. 2018, 142, 119–129. [Google Scholar] [CrossRef]
- Yurdakul, S.; Civan, M.; Özden, Ö.; Gaga, E.; Döğeroğlu, T.; Tuncel, G. Spatial variation of VOCs and inorganic pollutants in a university building. Atmos. Pollut. Res. 2017, 8, 1–12. [Google Scholar] [CrossRef]
- Kalimeri, K.K.; Saraga, D.E.; Lazaridis, V.D.; Legkas, N.A.; Missia, D.A.; Tolis, E.I.; Bartzis, J.G. Indoor air quality investigation of the school environment and estimated health risks: Two-season measurements in primary schools in Kozani, Greece. Atmos. Pollut. Res. 2016, 7, 1128–1142. [Google Scholar] [CrossRef]
- EPA. Compendium of Methods for the Determination of Air Pollutants in Indoor Air; Project Summary; EPA: Washington, DC, USA, 1990.
- Ishizaka, T.D.; Kawashima, A.; Hishida, N.; Hamada, N. Measurement of total volatile organic compound (TVOC) in indoor air using passive solvent extraction method. Air Qual. Atmos. Health 2019, 12, 173–187. [Google Scholar] [CrossRef]
- SKC. IP-10A Method Update. Available online: https://www.skcinc.com/catalog/pdf/instructions/1660.pdf (accessed on 24 September 2019).
- Mardonova, M.; Choi, Y. Toward Open-Source Hardware and Software for the Mining Industry: A Case Study of Low-Cost Environmental Monitoring System for Non-Metallic Underground Mines. Min. Metall. Explor. 2019, 36, 657–674. [Google Scholar] [CrossRef]
- Zanni, S.; Lalli, F.; Foschi, E.; Bonoli, A.; Mantecchini, L. Indoor Air Quality Real-Time Monitoring in Airport Terminal Areas: An Opportunity for Sustainable Management of Micro-Climatic Parameters. Sensors 2018, 18, 3798. [Google Scholar] [CrossRef] [PubMed]
- Zakaria, N.A.; Abidin, Z.Z.; Harum, N.; Hau, L.C.; Ali, N.S.; Jafar, F.A. Wireless Internet of Things-Based Air Quality Device for Smart Pollution Monitoring. Int. J. Adv. Comput. Sci. Appl. 2018, 9. [Google Scholar] [CrossRef] [Green Version]
- Benammar, M.; Abdaoui, A.; Ahmad, S.H.; Touati, F.; Kadri, A. A Modular IoT Platform for Real-Time Indoor Air Quality Monitoring. Sensors 2018, 18, 581. [Google Scholar] [CrossRef] [PubMed]
- Castell, N.; Dauge, F.R.; Schneider, P.; Vogt, M.; Lerner, U.; Fishbain, B.; Broday, D.; Bartonova, A. Can commercial low-cost sensor platforms contribute to air quality monitoring and exposure estimates? Environ. Int. 2017, 99, 293–302. [Google Scholar] [CrossRef] [PubMed]
- Zhu, Q.; Wang, R.; Chen, Q.; Liu, Y.; Qin, W. Iot gateway: Bridgingwireless sensor networks into internet of things. In Proceedings of the 8th International Conference on Embedded and Ubiquitous Computing (EUC), Hong Kong, China, 11–13 December 2010; pp. 347–352. [Google Scholar]
- Chen, H.; Jia, X.; Li, H. A brief introduction to IoT gateway. In Proceedings of the ET International Conference on Communication Technology and Application (ICCTA 2011), Beijing, China, 14–16 October 2011; pp. 610–613. [Google Scholar]
- Nakamoto, S. Bitcoin: A Peer-to-Peer Electronic Cash System. Available online: https://bitcoin.org/bitcoin.pdf (accessed on 24 September 2019).
- Brogan, J.; Baskaran, I.; Ramachandran, N. Authenticating health activity data using distributed ledger technologies. Comput. Struct. Biotechnol. J. 2018, 16, 257–266. [Google Scholar] [CrossRef] [PubMed]
- Ethereum Foundation. Ethereum Blockchain App Platform. Available online: https://www.ethereum.org/ (accessed on 24 September 2019).
- IOTA. What Is IOTA? Available online: https://www.iota.org/get-started/what-is-iota (accessed on 24 September 2019).
- Popov, S.; Saa, O.; Finardi, P. Equilibria in the Tangle. Comput. Ind. Eng. 2019, 136, 160–172. [Google Scholar]
- Handy, P. Introducing Masked Authenticated Messaging; IOTA: Berlin, Germany, 2017. [Google Scholar]
- NIOSH. NIOSH Pocket Guide to Chemical Hazards; U.S. Department of Health Human Services: Atlanta, GA, USA, 2016.
- EPA. EPA Air Quality Standards. Available online: https://www.epa.gov/criteria-air-pollutants/naaqs-table (accessed on 24 September 2019).
- EEA. European Union Air Quality Standards. 2019. Available online: https://ec.europa.eu/environment/air/quality/standards.htm (accessed on 24 September 2019).
- Moreno-Rangel, A.; Sharpe, T.; Musau, F.; McGill, G. Field evaluation of a low-cost indoor air quality monitor to quantify exposure to pollutants in residential environments. J. Sens. Sens. Syst. 2018, 7, 373–388. [Google Scholar] [CrossRef] [Green Version]
- AirVisual. How Often Does the AirVisual Pro’s Sensor Take Measurements? What Is the Difference between “Continuous” and “Default” Mode? Available online: https://support.airvisual.com/en/articles/3029368-how-often-does-the-airvisual-pro-s-sensor-take-measurements-what-is-the-difference-between-continuous-and-default-mode (accessed on 24 September 2019).
- Sun, S. Indoor Air Quality. Available online: https://gitlab.com/sunshengjing/iaq (accessed on 24 September 2019).
- Circulate. EnvCon App. Available online: https://apps.apple.com/ca/app/envcon/id1045648840 (accessed on 24 September 2019).
- Gubb, C.; Blanusa, T.; Griffiths, A.; Pfrang, C. Can houseplants improve indoor air quality by removing CO2 and increasing relative humidity? Air Qual. Atmos. Health 2018, 11, 1191–1201. [Google Scholar] [CrossRef]
- Meattle, K. Green Buildings: A Step Towards Sustainable Development. Available online: https://www.nbmcw.com/tech-articles/tall-construction/30066-green-buildings-a-step-towards-sustainable-development.html (accessed on 24 September 2019).
- Sulewska, M.J.; Gładyszewska-Fiedoruk, K.; Sztulc, P. Analysis of the results of empirical research and surveys of perceived indoor temperature depending on gender and seasons. Environ. Sci. Pollut. Res. 2018, 25, 31205–31218. [Google Scholar] [CrossRef] [PubMed] [Green Version]
- CBRE. Spain Occupier Report. Available online: https://www.cbre.es/en/services/business-lines/global-workplace-solutions/workplace-strategy/cbre-lab (accessed on 24 September 2019).
- Yu, F.R.; Liu, J.; He, Y.; Si, P.; Zhang, Y. Virtualization for Distributed Ledger Technology (vDLT). IEEE Access 2018, 6, 25019–25028. [Google Scholar] [CrossRef]
- Román, V.; Ordieres-Meré, J. [WiP] IoT Blockchain Technologies for Smart Sensors Based on Raspberry Pi. In Proceedings of the 11th Conference on Service-Oriented Computing and Applications (SOCA), Paris, France, 20–22 November 2018; pp. 216–220. [Google Scholar] [CrossRef]
- Kitchenham, B.A.; Charters, S. Guidelines for performing Systematic Literature Reviews in Software Engineering; Technical Report EBSE-2007-01; Keele University: Keele, UK, 2007. [Google Scholar]
- Fathallah, H.; Lecuire, V.; Rondeau, E.; Le Calvé, S. Development of an IoT-based system for real time occupational exposure monitoring. In Proceedings of the Tenth International Conference on Systems and Networks Communications, Barcelona, Spain, 15–20 November 2015. [Google Scholar]
- Maragkidou, A.; Arar, S.; Al-Hunaiti, A.; Ma, Y.; Harrad, S.; Jaghbeir, O.; Faouri, D.; Hämeri, K.; Hussein, T. Occupational health risk assessment and exposure to floor dust PAHs inside an educational building. Sci. Total Environ. 2017, 579, 1050–1056. [Google Scholar] [CrossRef]
- Kiurski, J.S.; Marić, B.B.; Aksentijević, S.M.; Oros, I.B.; Kecić, V.S.; Kovačević, I.M. Indoor air quality investigation from screen printing industry. Renew. Sustain. Energy Rev. 2013, 28, 224–231. [Google Scholar] [CrossRef]
- Chiang, C.M.; Su, H.J.; Lai, C.M.; Chou, P.C.; Li, Y.Y.; Tu, Y.F. Indoor Air Quality Assessment in an Office Building in an Industrial Park in Taiwan. In Proceedings of the Asia-Pacific Conference on the Built Environment, Taipei, Taiwan, 1999; Available online: http://citeseerx.ist.psu.edu/viewdoc/download?doi=10.1.1.614.2821&rep=rep1&type=pdf (accessed on 24 September 2019).
- Loupa, G. Case study. Health hazards of automotive repair mechanics: Thermal and lighting comfort, particulate matter and noise. J. Occup. Environ. Hyg. 2013, 10, 35–46. [Google Scholar] [CrossRef] [PubMed]
- Abdel Hameed, A.A.; Khoder, M.I.; Farag, S.A. Organic dust and gaseous contaminants at wood working shops. J. Environ. Monit. 2000, 2, 73–76. [Google Scholar] [CrossRef] [PubMed]
- Keskin, S.S.; Sinan Keskin, S.; Dilmac, E. Indoor air particulate matter exposure of commuter bus passengers in Istanbul, Turkey. Indoor Built Environ. 2016, 26, 337–346. [Google Scholar] [CrossRef]
- Goel, A.; Wathore, R.; Chakraborty, T.; Agrawal, M. Characteristics of Exposure to Particles due to Incense Burning inside Temples in Kanpur, India. Aerosol Air Qual. Res. 2017, 17, 608–615. [Google Scholar] [CrossRef] [Green Version]
- Dai, H.; Jing, S.; Wang, H.; Ma, Y.; Li, L.; Song, W.; Kan, H. VOC characteristics and inhalation health risks in newly renovated residences in Shanghai, China. Sci. Total Environ. 2017, 577, 73–83. [Google Scholar] [CrossRef]
- Singh, D.; Kumar, A.; Kumar, K.; Singh, B.; Mina, U.; Singh, B.B.; Jain, V.K. Statistical modeling of O3, NOx, CO, PM2.5, VOCs and noise levels in commercial complex and associated health risk assessment in an academic institution. Sci. Total Environ. 2016, 572, 586–594. [Google Scholar]
- Mainka, A.; Kozielska, B. Assessment of the BTEX concentrations and health risk in urban nursery schools in Gliwice, Poland. AIMS Environ. Sci. 2016, 3, 858–870. [Google Scholar] [CrossRef]
- Kwon, S.B.; Jeong, W.; Park, D.; Kim, K.T.; Cho, K.H. A multivariate study for characterizing particulate matter (PM(10), PM(2.5), and PM(1)) in Seoul metropolitan subway stations, Korea. J. Hazard. Mater. 2015, 297, 295–303. [Google Scholar] [CrossRef] [PubMed]
- Huang, L.; Mo, J.; Sundell, J.; Fan, Z.; Zhang, Y. Health risk assessment of inhalation exposure to formaldehyde and benzene in newly remodeled buildings, Beijing. PLoS ONE 2013, 8, e79553. [Google Scholar] [CrossRef] [PubMed]
- de M.Ochs, S.; de O. Grotz, L.; Factorine, L.S.; Rodrigues, M.R.; Pereira Netto, A.D. Occupational exposure to formaldehyde in an institute of morphology in Brazil: A comparison of area and personal sampling. Environ. Sci. Pollut. Res. 2012, 19, 2813–2819. [Google Scholar]
- Guo, H.; Lee, S.C.; Chan, L.Y.; Li, W.M. Risk assessment of exposure to volatile organic compounds in different indoor environments. Environ. Res. 2004, 94, 57–66. [Google Scholar] [CrossRef]
- Roda, C.; Barral, S.; Ravelomanantsoa, H.; Dusséaux, M.; Tribout, M.; Le Moullec, Y.; Momas, I. Assessment of indoor environment in Paris child day care centers. Environ. Res. 2011, 111, 1010–1017. [Google Scholar] [CrossRef] [PubMed]
- Bolourchi, A.; Atabi, F.; Moattar, F.; Ehyaei, M.A. Experimental and numerical analyses of particulate matter concentrations in underground subway station. Int. J. Environ. Sci. Technol. 2017, 15, 2569–2580. [Google Scholar] [CrossRef]


| Pollutant | STEL (15 min) | Average over 24 h |
|---|---|---|
| CO2 | 30,000 ppm (54,000 mg/m3) STEL | |
| CO | 200 pm (229 mg/m3) ceiling | |
| Benzene | 1 ppm (3.2 mg/m3) ceiling (15 min) | |
| Formaldehyde | 0.1 ppm (0.12 mg/m3) ceiling (15 min) | |
| NO2 | 1 ppm (0.18 mg/m3) STEL | |
| O3 | 0.1 ppm (0.2 mg/m3) ceiling | |
| PM2.5 | 50 μg/m3 (EPA) | |
| PM10 | 50 μg/m3 from EU air-quality standards |
| Sampling Duration Time | Number of Samples |
|---|---|
| 10 s | 30 |
| 1 min | 20 |
| 5 min | 12 |
| 15 min | 4 |
| 30 min | 3 |
| 1 h | 2 |
| 2 h | 1 |
| No. | Sensor Name | Model | Functions | Range |
|---|---|---|---|---|
| 1 | PM | KG-PM2 | PM2.5, PM10 Concentration Monitor | 0–1000 μg/m3 |
| 2 | HCHO | KG-HO2 | HCHO Concentration Monitor | 0–7 mg/m3 |
| 3 | TVOC | KG-TV2 | TVOC Concentration Monitor | 0–3 mg/m3 |
| 4 | C6H6 | KG-C62 | C6H6 Concentration Monitor | 0–320 mg/m3 |
| 5 | CO2 | KG-C22 | CO2 Concentration Monitor | 0–0.5% |
| 6 | CO | KG-C12 | CO Concentration Monitor | 0–500 ppm |
| 7 | NO2 | KG-N22 | NO2 Concentration Monitor | 0–20 ppm |
| 8 | O3 | KG-O32 | O3 Concentration Monitor | 0–20 ppm |
| 9 | T.H.I.N | KG-TN2 | Comfort Monitor (Temperature, humidity, illumination and noise) | T: −40–80°; H: 0–99.0% RH; I: 0–2000 Lux; N: 0–120 dB |
| Characteristic | Site 1 | Site 2 |
|---|---|---|
| Section | workshop section | office section |
| Year of construction | 35 | 46 |
| Floor | 1 | 1 |
| Number of occupants | 12 | 8 |
| Total area (m2) | 200 | 100 |
| Heating | No | Yes |
| Ventilation | Natural | Ventilation System |
| Windows | Single Glazing | Single Glazing |
| Floor covering | Coating | Coating |
| Facilities | One solvent printing machine, two caving machine, computers, furniture | Computers, furniture |
| Cleaning schedule | Once a week | Everyday |
| Working schedule | Flexible, 24 h, including weekends | Two shifts: 06:00–14:00; 14:00–22:00, only business days |
| Smoking | Yes | No |
| Nearby potential pollutant sources | No | No |
© 2019 by the authors. Licensee MDPI, Basel, Switzerland. This article is an open access article distributed under the terms and conditions of the Creative Commons Attribution (CC BY) license (http://creativecommons.org/licenses/by/4.0/).
Share and Cite
Sun, S.; Zheng, X.; Villalba-Díez, J.; Ordieres-Meré, J. Indoor Air-Quality Data-Monitoring System: Long-Term Monitoring Benefits. Sensors 2019, 19, 4157. https://doi.org/10.3390/s19194157
Sun S, Zheng X, Villalba-Díez J, Ordieres-Meré J. Indoor Air-Quality Data-Monitoring System: Long-Term Monitoring Benefits. Sensors. 2019; 19(19):4157. https://doi.org/10.3390/s19194157
Chicago/Turabian StyleSun, Shengjing, Xiaochen Zheng, Javier Villalba-Díez, and Joaquín Ordieres-Meré. 2019. "Indoor Air-Quality Data-Monitoring System: Long-Term Monitoring Benefits" Sensors 19, no. 19: 4157. https://doi.org/10.3390/s19194157