Article

Potential of Virtual Earth Observation Constellations in Archaeological Research

by
Athos Agapiou
1,*,
Dimitrios D. Alexakis
2 and
Diofantos G. Hadjimitsis
1
1
Eratosthenes Research Center, Department of Civil Engineering and Geomatics, Cyprus University of Technology, Saripolou 2-8, Limassol 3036, Cyprus
2
Laboratory of Geophysical-Satellite Remote Sensing and Archaeo-Environment, Foundation for Research and Technology, Hellas (F.O.R.T.H.), 74100 Rethymno, Greece
*
Author to whom correspondence should be addressed.
Sensors 2019, 19(19), 4066; https://doi.org/10.3390/s19194066
Submission received: 13 August 2019 / Revised: 10 September 2019 / Accepted: 19 September 2019 / Published: 20 September 2019
(This article belongs to the Special Issue Geophysics and Remote Sensing in Archaeology and Monumental Heritage)

Abstract

:
Earth observation sensors continually provide datasets with different spectral and spatial characteristics, while a series of pre- and postprocessing techniques are needed for calibration purposes. Nowadays, a variety of satellite images have become accessible to researchers, while big data cloud platforms allow them to deal with an extensive number of datasets. However, there is still difficulty related to these sensors meeting specific needs and challenges such as those of cultural heritage and supporting archaeological research world-wide. The harmonization and synergistic use of different sensors can be used in order to maximize the impact of earth observation sensors and enhance their benefit to the scientific community. In this direction, the Committee on Earth Observation Satellites (CEOS) has proposed the concept of virtual constellations, which is defined as “a coordinated set of space and/or ground segment capabilities from different partners that focuses on observing a particular parameter or set of parameters of the Earth system”. This paper provides an overview of existing and future earth observation sensors, the various levels of interoperability as proposed by Wulder et al., and presents some preliminary results from the Thessalian plain in Greece using integrated optical and radar Sentinel images. The potential for archaeolandscape studies using virtual constellations is discussed here.

1. Introduction

Nowadays, a variety of satellite images with different spatial, temporal, and radiometric resolutions are available due to the recent advancements of earth observation [1]. However, despite the increasing availability of space-borne sensors, research is sometimes restricted by the mismatch observed between the individual sensors’ characteristics in regards to their resolutions. Since each sensor operates in a specific wavelength range, and it is sensitive to specific environmental conditions, the acquisition of all the required information cannot be performed by a single sensor [2].
Optical and radar satellite sensors have been widely applied to support archaeological investigations all around the world. Optical images are used to detect archaeological proxies of subsurface remains [3,4] and to monitor landscapes from natural [5] and anthropogenic hazards, including looting marks [6,7]. Optical image analysis takes advantage of the visible (400–700 nm) and near-infrared part of the spectrum (750–900 nm), while recent studies in the short wavelength infrared part of the spectrum (1500–2300 nm) can also be found [8]. The use of radar spaceborne imagery has shown a significant increase in the last decade, mainly due to the advancement of the spatial and temporal resolution of sensors such as those provided via COSMO-SkyMed, TerraSAR-X, and Sentinel-1 missions [9,10]. Radar images are currently exploited for detecting land movements and landslides in the vicinity of archaeological sites and monuments [11], while the potential use of high-resolution radar sensors for detecting looting areas has been reported in the past [12]. Few publications in regards to the detection of archaeological proxies can be also found [13]. A general overview of the trend observed in the last years in the field of earth observation for archaeological research can be found in the works of [14] and [15].
While it is essential to capitalize on the capacity of existing sensors and to understand potential synergies between them, the concurrent exploitation of radar and spaceborne optical sensors for archaeological research is still limited. In an attempt to expand the scope of space-based Earth system science so as to meet the needs of particular research domains [16], the Committee on Earth Observation Satellites (CEOS) has proposed the concept of virtual, space-based constellations [17]. Virtual constellations are a set of actions aiming to coordinate space and/or ground segment capabilities from different partners related to the Earth system. As [16] argue, “[virtual constellations] are formalized systems, designed to address specific scientific and operational information needs. They involve not only sensors and measurements, but also data policies and archives”. Virtual constellations of planned and existing satellite sensors can help to overcome current limitations in research by combining existing space observations [16].
The integration of space sensors in various research studies can maximize the outcomes and support future research, going thus a step further than the processing of individual datasets. This paper aims to present the concept of virtual earth observation constellations for cultural heritage and archaeological research. The proposed concept is built upon the original work carried out by the Committee on Earth Observation Satellites (CEOS), which formulated the concept of virtual constellations, which was then extended by Wulder et al. [16]. Although fusion and integration analysis of various remote sensing datasets have been reported in the past for archaeological research (see for instance [2,18,19,20,21,22,23], the concept of virtual constellations, proposed by CEOS is more than complementary observations. It is a framework for synergistic and coordinated use of earth observation sensors to increase the data availability, minimizing “unnecessary redundancy and costs” [16]. The opportunities raised by such an approach are discussed in this paper.

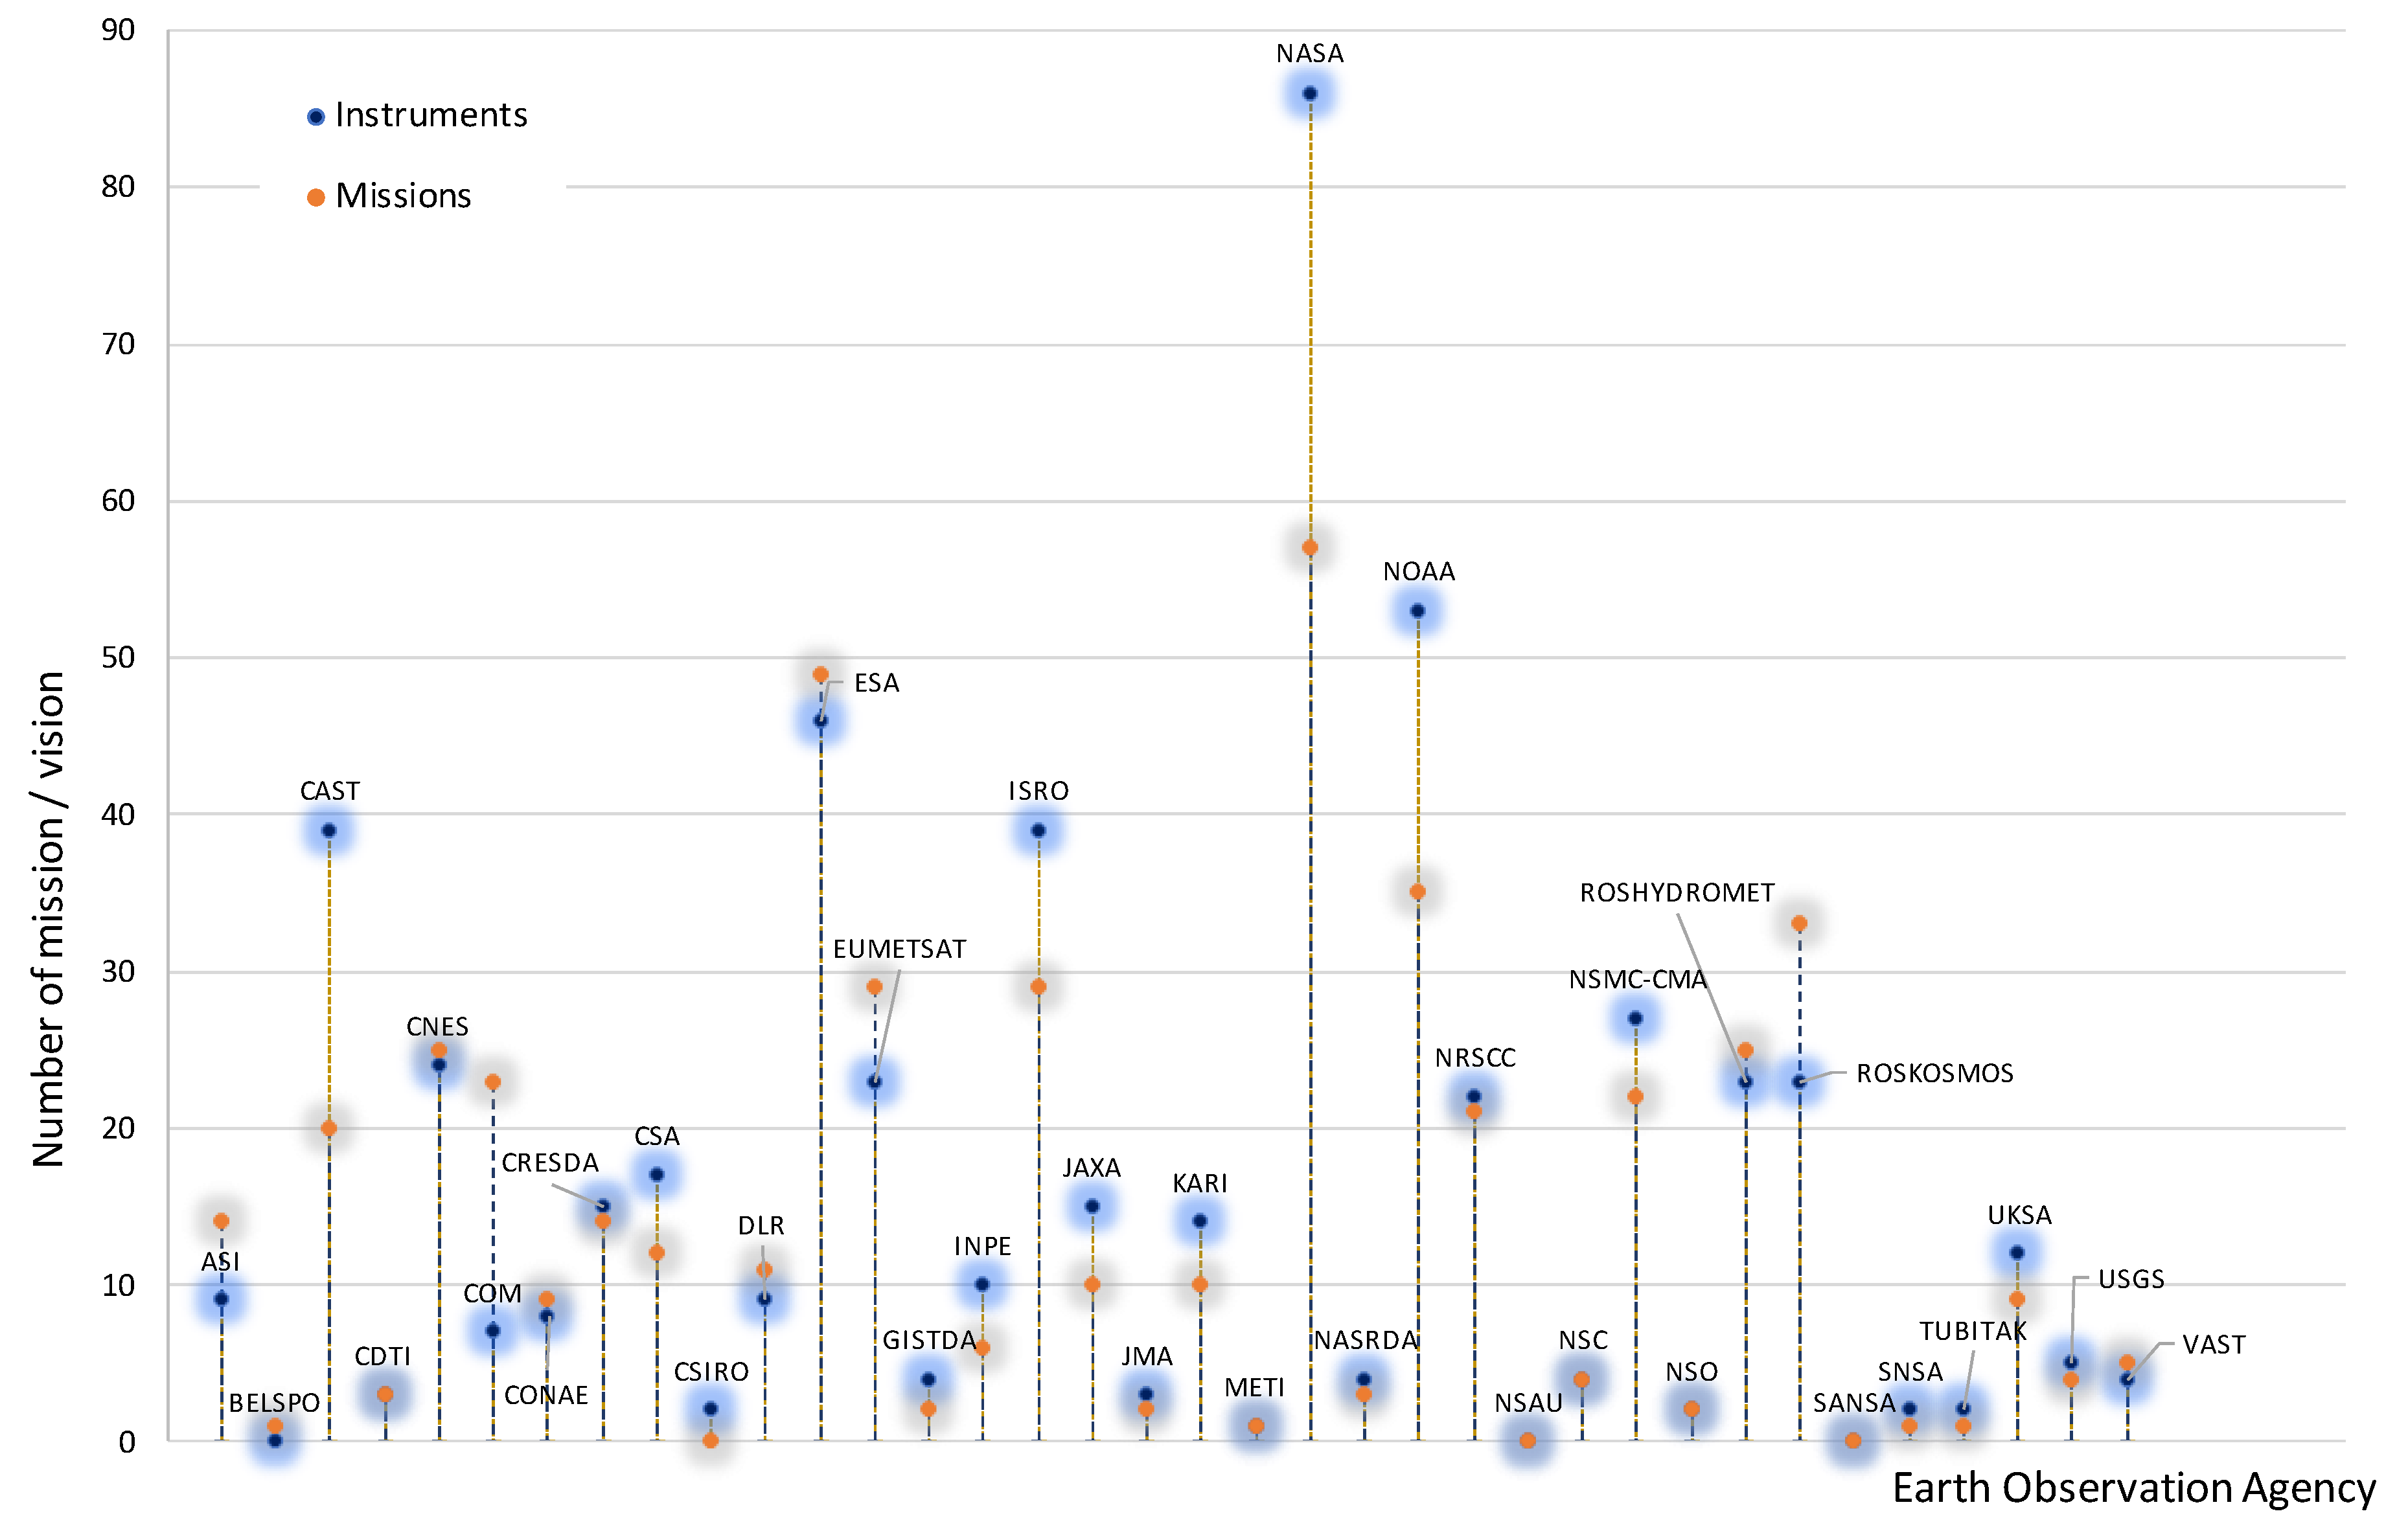
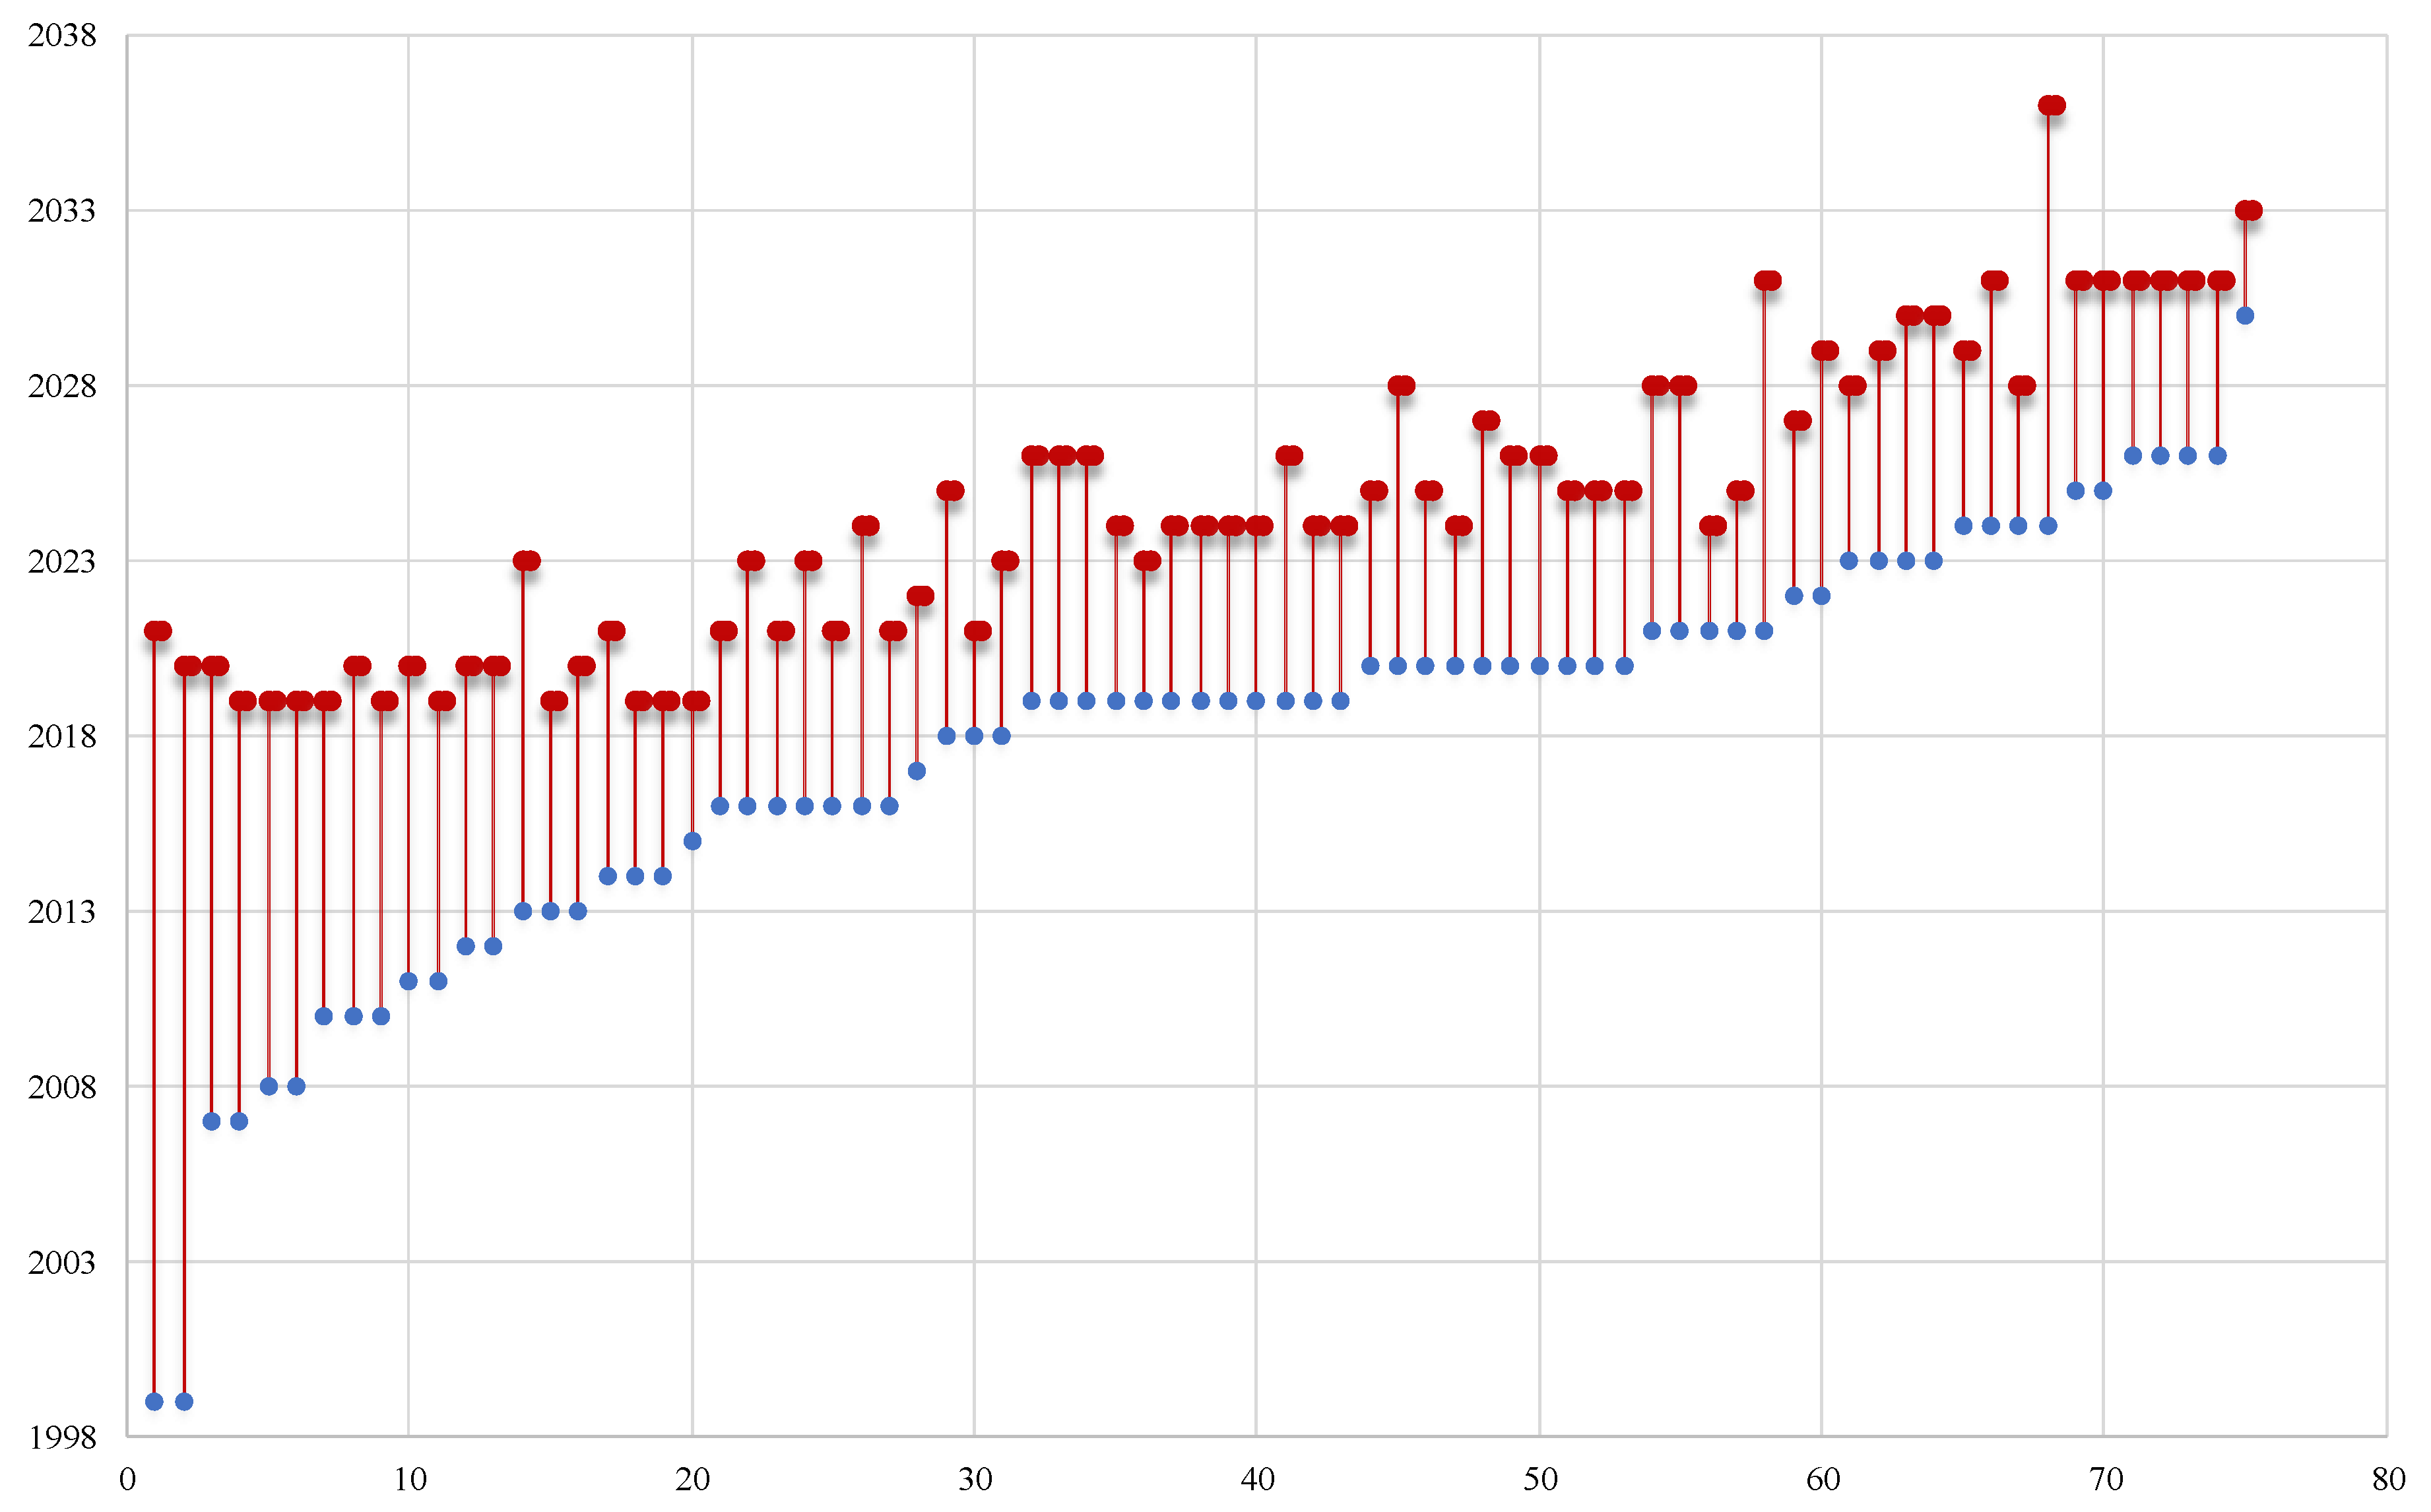
2. CEOS Virtual Constellations Concept

Virtual constellations are defined as “a coordinated set of space and/or ground segment capabilities from different partners that focus on observing a particular parameter or set of parameters of the Earth system” [17]. Virtual constellations are built upon interagency collaboration and partnerships aiming to “address observational gaps, sustain the routine collection of critical observations, and minimize duplication/overlaps…” [17]. The mission of virtual constellations is to promote the efficient, effective, and comprehensive collection, distribution, improve monitoring, assessment, predictive capabilities, and application of space-based image data of specific domains. Until now, seven virtual constellations have been formed, namely the Atmospheric Composition (AC-VC); the Land Surface Imaging (LSI-VC); the Ocean Colour Radiometry (OCR-VC); the Ocean Surface Topography (OST-VC); the Ocean Surface Vector Wind (OSVW-VC); the Precipitation (P-VC), and the Sea Surface Temperature (SST-VC). Each of these VCs are dealing with a specific area of interest, aiming to implement novel strategies and data collection methods. It should be mentioned that these virtual constellations are based on the close collaboration of the various space agencies dealing with various aspects such as data calibration and validation, merging of satellite and in-situ data, product generation, as well as development and demonstration of new and improved applications.
The need for such collaborations is evident by the variety of missions and instruments available today in the domain of earth observation. Based on the statistics of the CEOS Database [24], more than 35 earth observation agencies are active around the world in more than 25 different countries/regions. These agencies are responsible for nearly 500 earth observation operated or approved missions and up to 560 earth observation instruments (Figure 1).
Although the CEOS dataset is indicative, a closer look into the dataset and putting aside observation missions that are usually out of the scope of the archaeological science (e.g., meteorological sensors), indicates a variety of existing and forthcoming sensors which can provide valuable information for heritage applications, such as those providing optical high-resolution multispectral and hyperspectral images. These high-resolution sensors can acquire submeter resolution optical data. However, the spectral resolution of these sensors is limited to the visible and near-infrared part of the spectrum (see Table 1). A critical attribute of these datasets is access rights and availability of the images. Some high spatial resolution optical and hyperspectral images are currently characterized as “Constrained Access” or “Very Constrained Access”, which prohibits and constrains the scientific exploitation of these datasets. These restrictions, which result in the nonavailability of the satellite images for scientific applications, may limit the potential of exploiting space sensors for better understanding of the environment. Under the prism of data restrictions, the concept of Virtual Constellations is becoming even more imperative: instead of waiting for any future declassification of restricted datasets, the scientific community may focus on the development of new strategies regarding integration of satellite spaceborne datasets. The virtual constellation concept involves the accessibility not only of future datasets, but also for imagery archives.
As recorded in the CEOS Database [24], the variety of existing and forthcoming sensors for specific categories will continue to grow in the future. For instance, for the domain of landscape topography (for supporting land surface heights measurements, e.g., DEMs), 75 different sensors will provide continuous satellite data until 2036. The list includes 31 active sensors and 44 new sensors which have already been approved (Figure 2). Given these numbers and the trend observed regarding space growth, supported by various national and international space agencies, the concept of the virtual constellation is timely. Synergies between the various space-borne sensors can be developed, including also future earth observation sensors. This close collaboration can eventually fill gaps in terms of the spectral, spatial, and temporal windows.
Even if initially the concept of virtual constellations was focused on earth observation sensors that share similar spatial, spectral, temporal, and radiometric characteristics, this was later extended by Wulder et al. [16]. In that study [16] virtual constellations “include sensors that are principally incompatible, because they are fundamentally different (for instance active versus passive remote sensing systems), but their combination is necessary and beneficial to achieve a specific monitoring goal.” Additionally, Wulder et al. [16] proposed three application readiness levels (ARL), based on the levels of interoperability of the various datasets, as follow (for more details see [16]):
(a) the first level (ARL-1) combines earth observation sensors whose data are incompatible because the measurements are based on different principles, such as the case of optical and radar sensors;
(b) the second level (ARL-2) aims to combine earth observation sensors that share the same principle (e.g., optical sensors) but the sensors have different characteristics (e.g., different spatial/spectral resolutions), and
(c) the third level (ARL-3) aims to combine sensors that share the same principle and share similar spatial and spectral characteristics (e.g., the case of Landsat 5 TM and Landsat 7 ETM+).
It is evident from the above that the combination of sensors at level 1 (ARL-1) is more complicated and difficult, while processing datasets of level 3 (ARL-3) requires minimal efforts. Examples of the various Application Readiness Levels (ARL-1 to 3) for environmental applications and terrestrial-monitoring can be found in the work of Wulder et al. [16].

3. Virtual Constellations in Archaeological Research

As mentioned before, in the domain of cultural heritage, earth observation has made a significant contribution, especially towards heritage preservation and management. While the exploitation of single or multisource earth observation datasets has been presented in the past (see for instance [25,26,27]), the synergistic use of such datasets is still limited. Given the spatial, spectral, and temporal resolution limitations of single-space sensors, the virtual constellation concept can improve these characteristics [17,28] to provide more information in a systematic way for monitoring archaeological sites and landscapes.
The free of charge and open access policy followed by NASA and ESA is a unique opportunity for researchers to explore in depth the synergistic use of space-borne datasets. The high temporal resolution revisits of Sentinel-1 and Sentinel-2 images—provided by the ESA—give the opportunity for researchers to process almost concurrent optical and radar images taken over archaeological areas of interest. In the following section, we present some potential benefits of level ARL-1 at the archaeological landscape of the Thessalian plain in Greece.

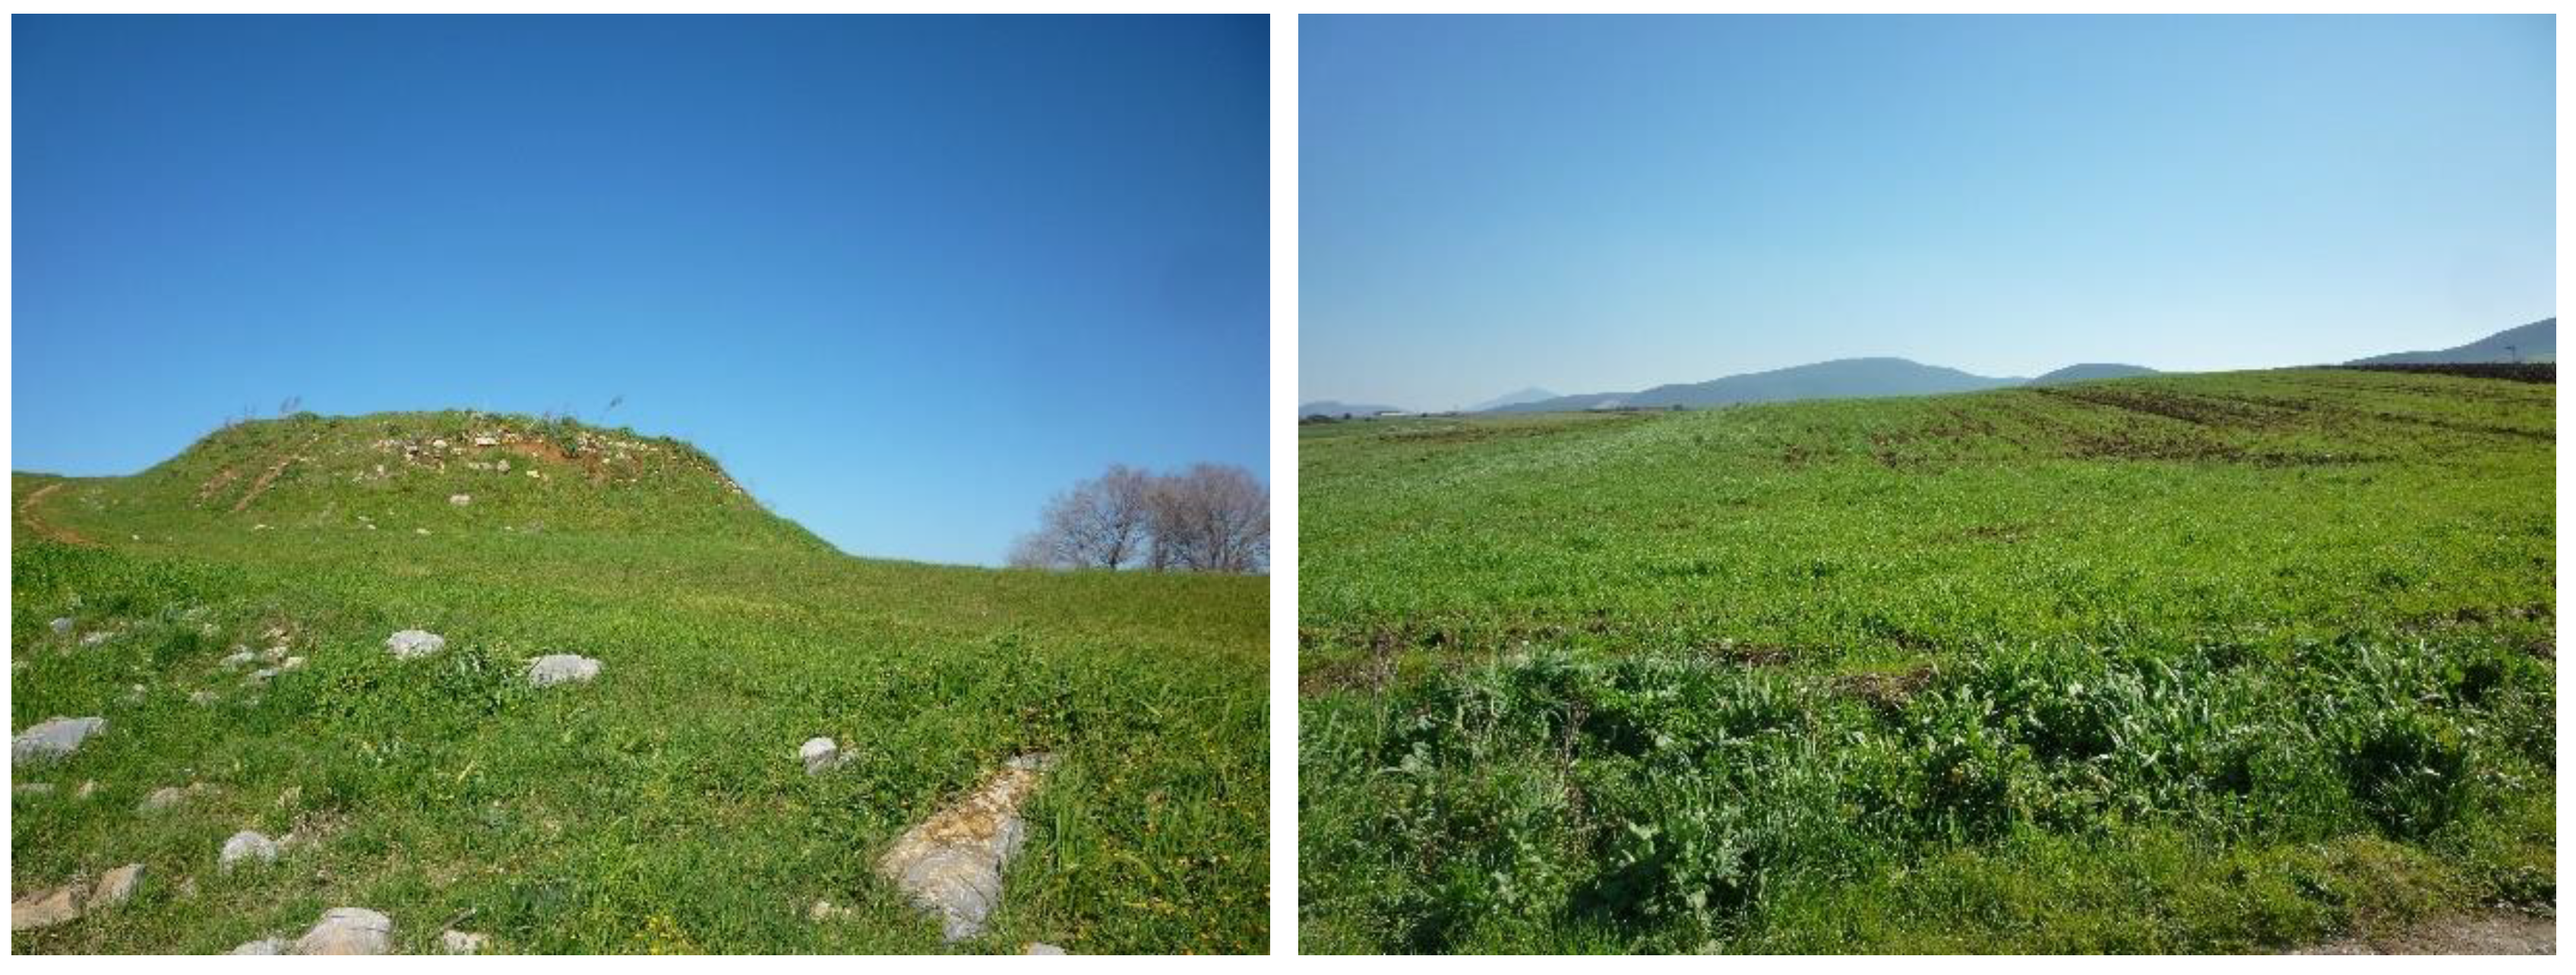
3.1. Area of Interest

The Thessalian plain comprises a distinct geographical region in central Greece. At the northern part of the plain, there are the Antihasia and Olympus mountains while Orthis and Pindos mountain ranges can be found in the southern and western part of the plain. On the east, the plain ends up towards the Aegean sea. The specific area has attracted the interest of archaeologists since the beginning of the twentieth century. At this region, several Neolithic settlements/tells called magoules were established from the Early Neolithic period until the Bronze Age (6000–3000 BC) (Figure 3).
The first systematic archaeological studies of the area were performed in 1906, while the first report regarding field surveys results was only published in 1980 [29]. More recently, through the study of Vouzaxakis [29] and Alexakis et al. [30,31], several magoules have been geolocated using global navigation satellite systems (GNSS) and documented with in-situ observations and foot surveys. The overall synthesis of these studies, which cover an area approximately of 13,500 square kilometers, has reported more than 320 archaeological sites. Some of the Neolithic settlements are nowadays visible in the Thessalian plain as low mounds a few meters high, and they mainly consist of loam and mud-based materials. However, due to the agricultural pressure in the area (the Thessalian plain is considered the primary agricultural region of Greece), and the use of heavy agricultural machinery, most the magoules have been flattened, thus making their in-situ detection difficult.
The discovery of these magoules can, however, be achieved using remote sensing technologies. Indeed, the use of spaceborne optical sensors has been investigated in the past with relative success, indicating cropmarks which are considered as archaeological proxies of these Neolithic settlements of the area [32,33]. These archaeological proxies tend to give a different spectral signature of the crops cultivated on top of the magoules, compared to the rest surrounding the agricultural area as a result of the subsurface remains.

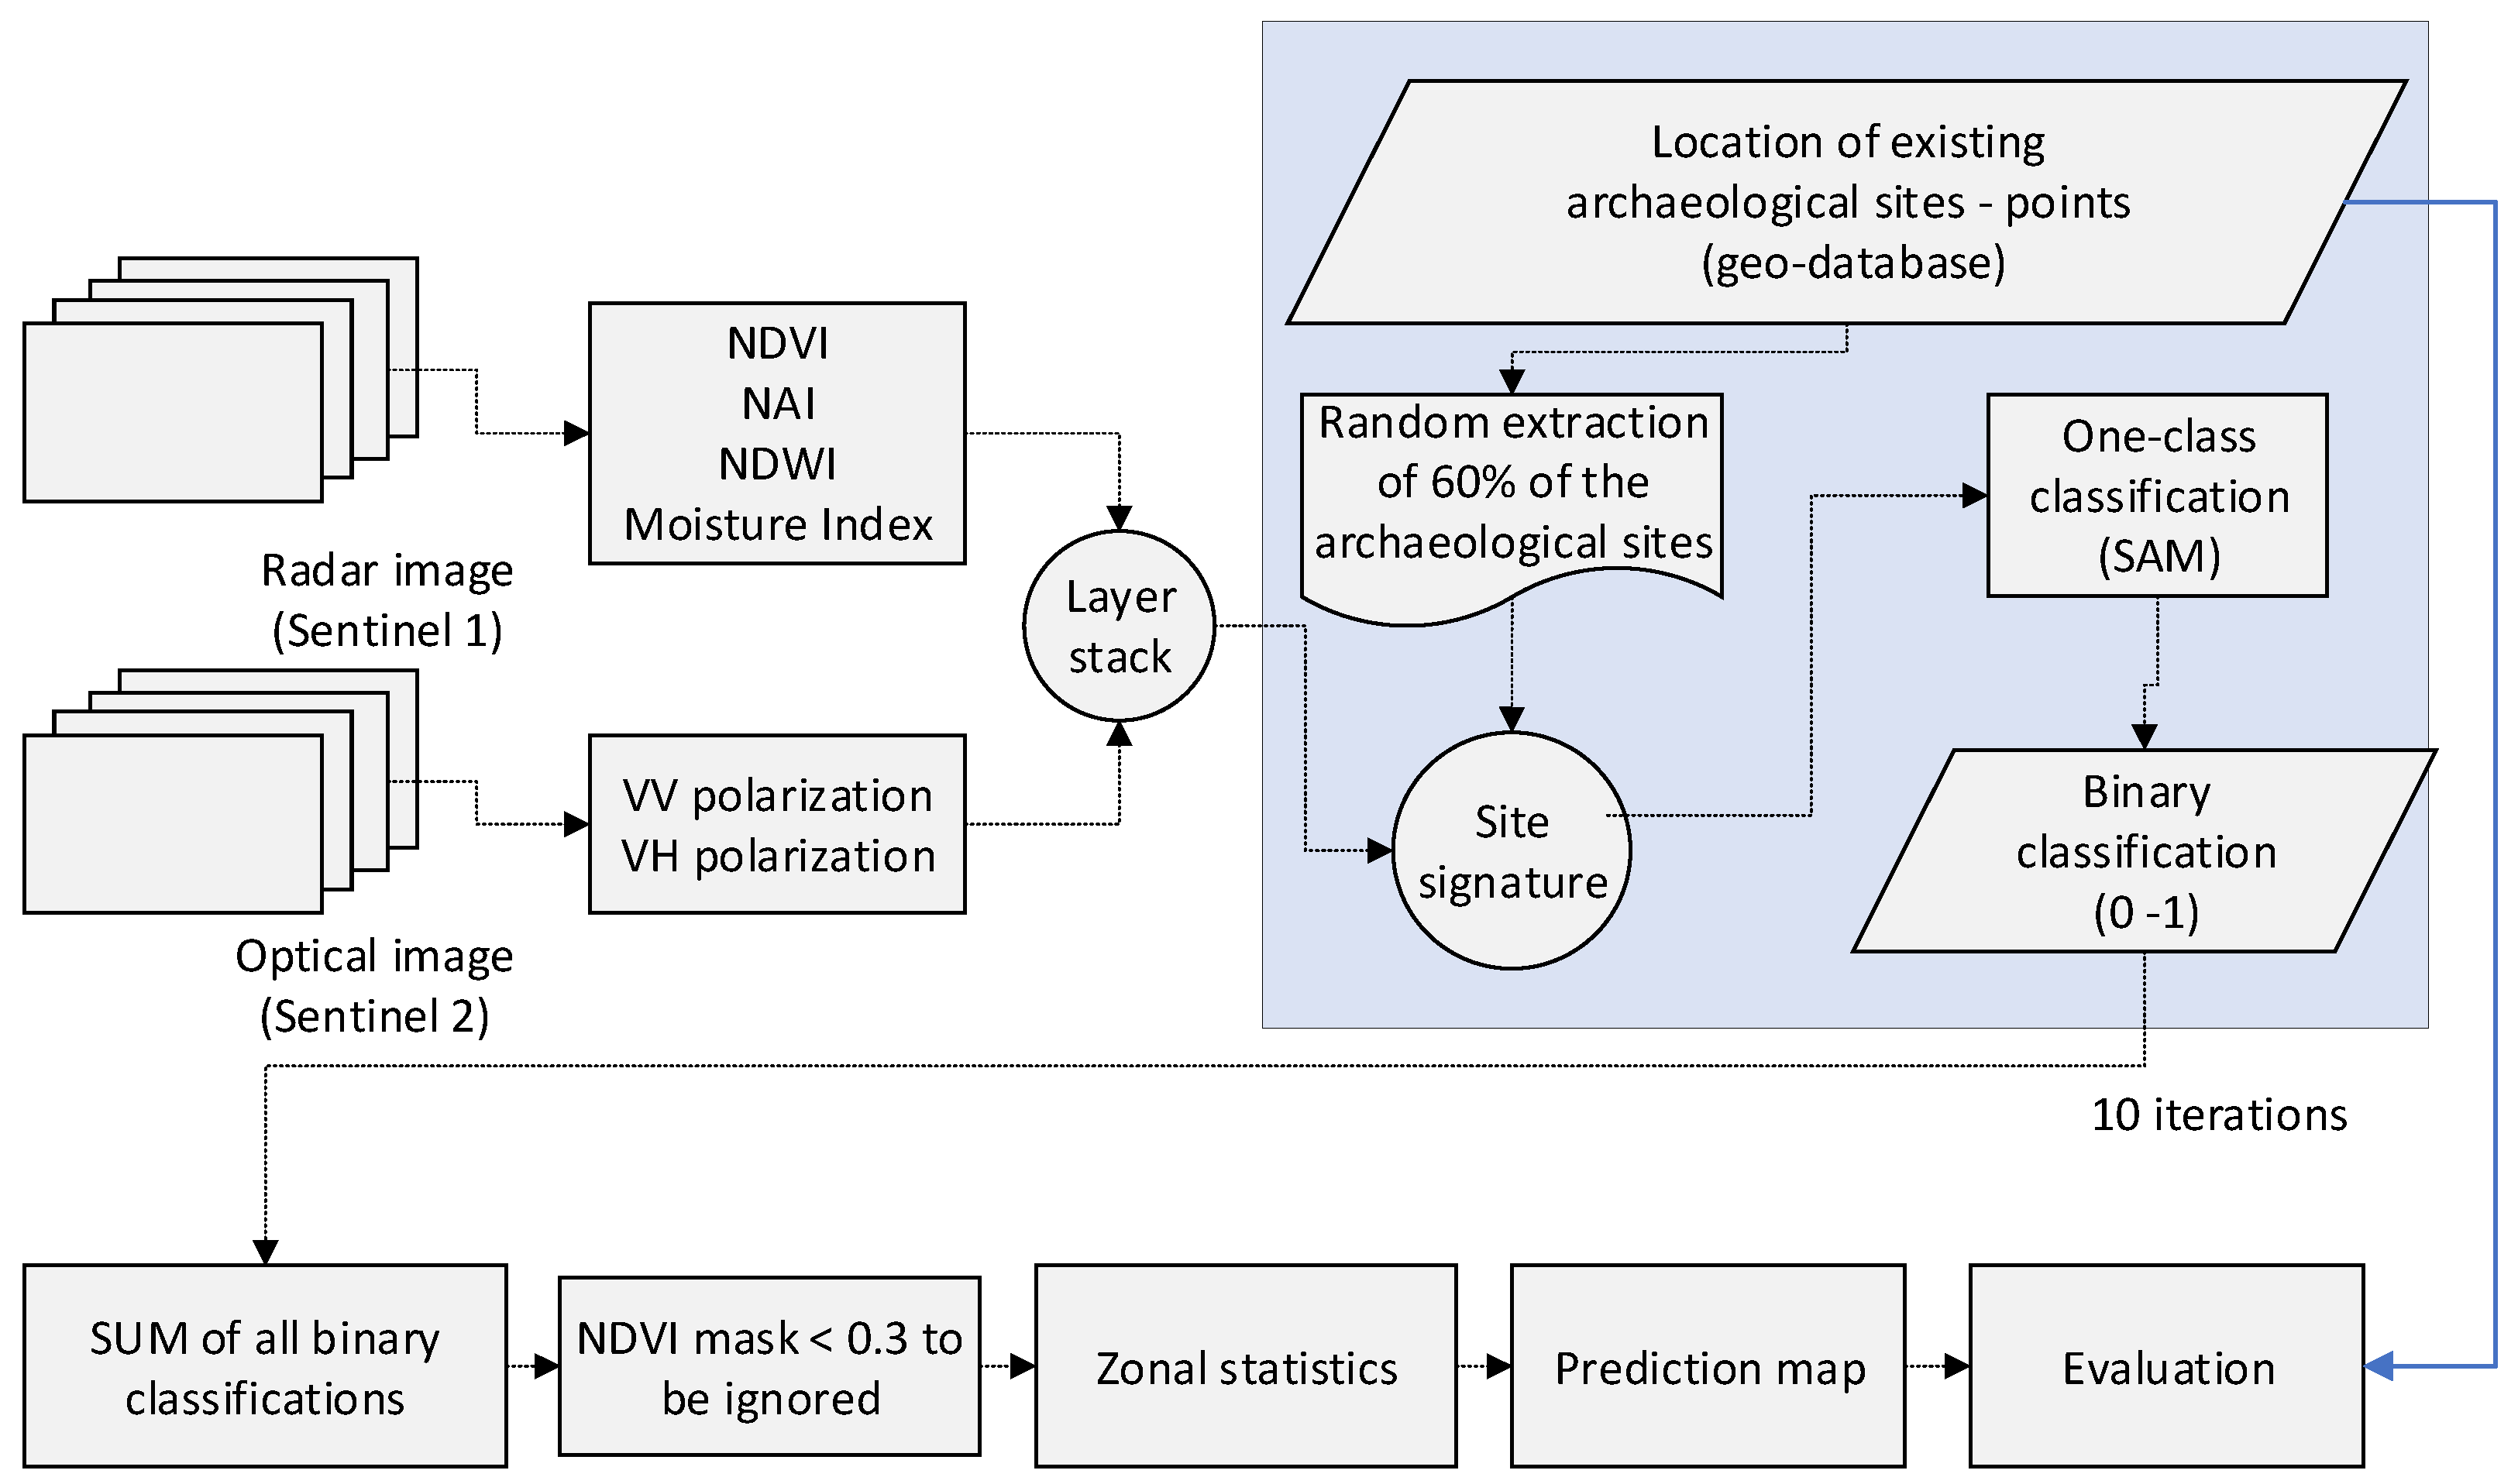
3.2. Data Description and Methodology
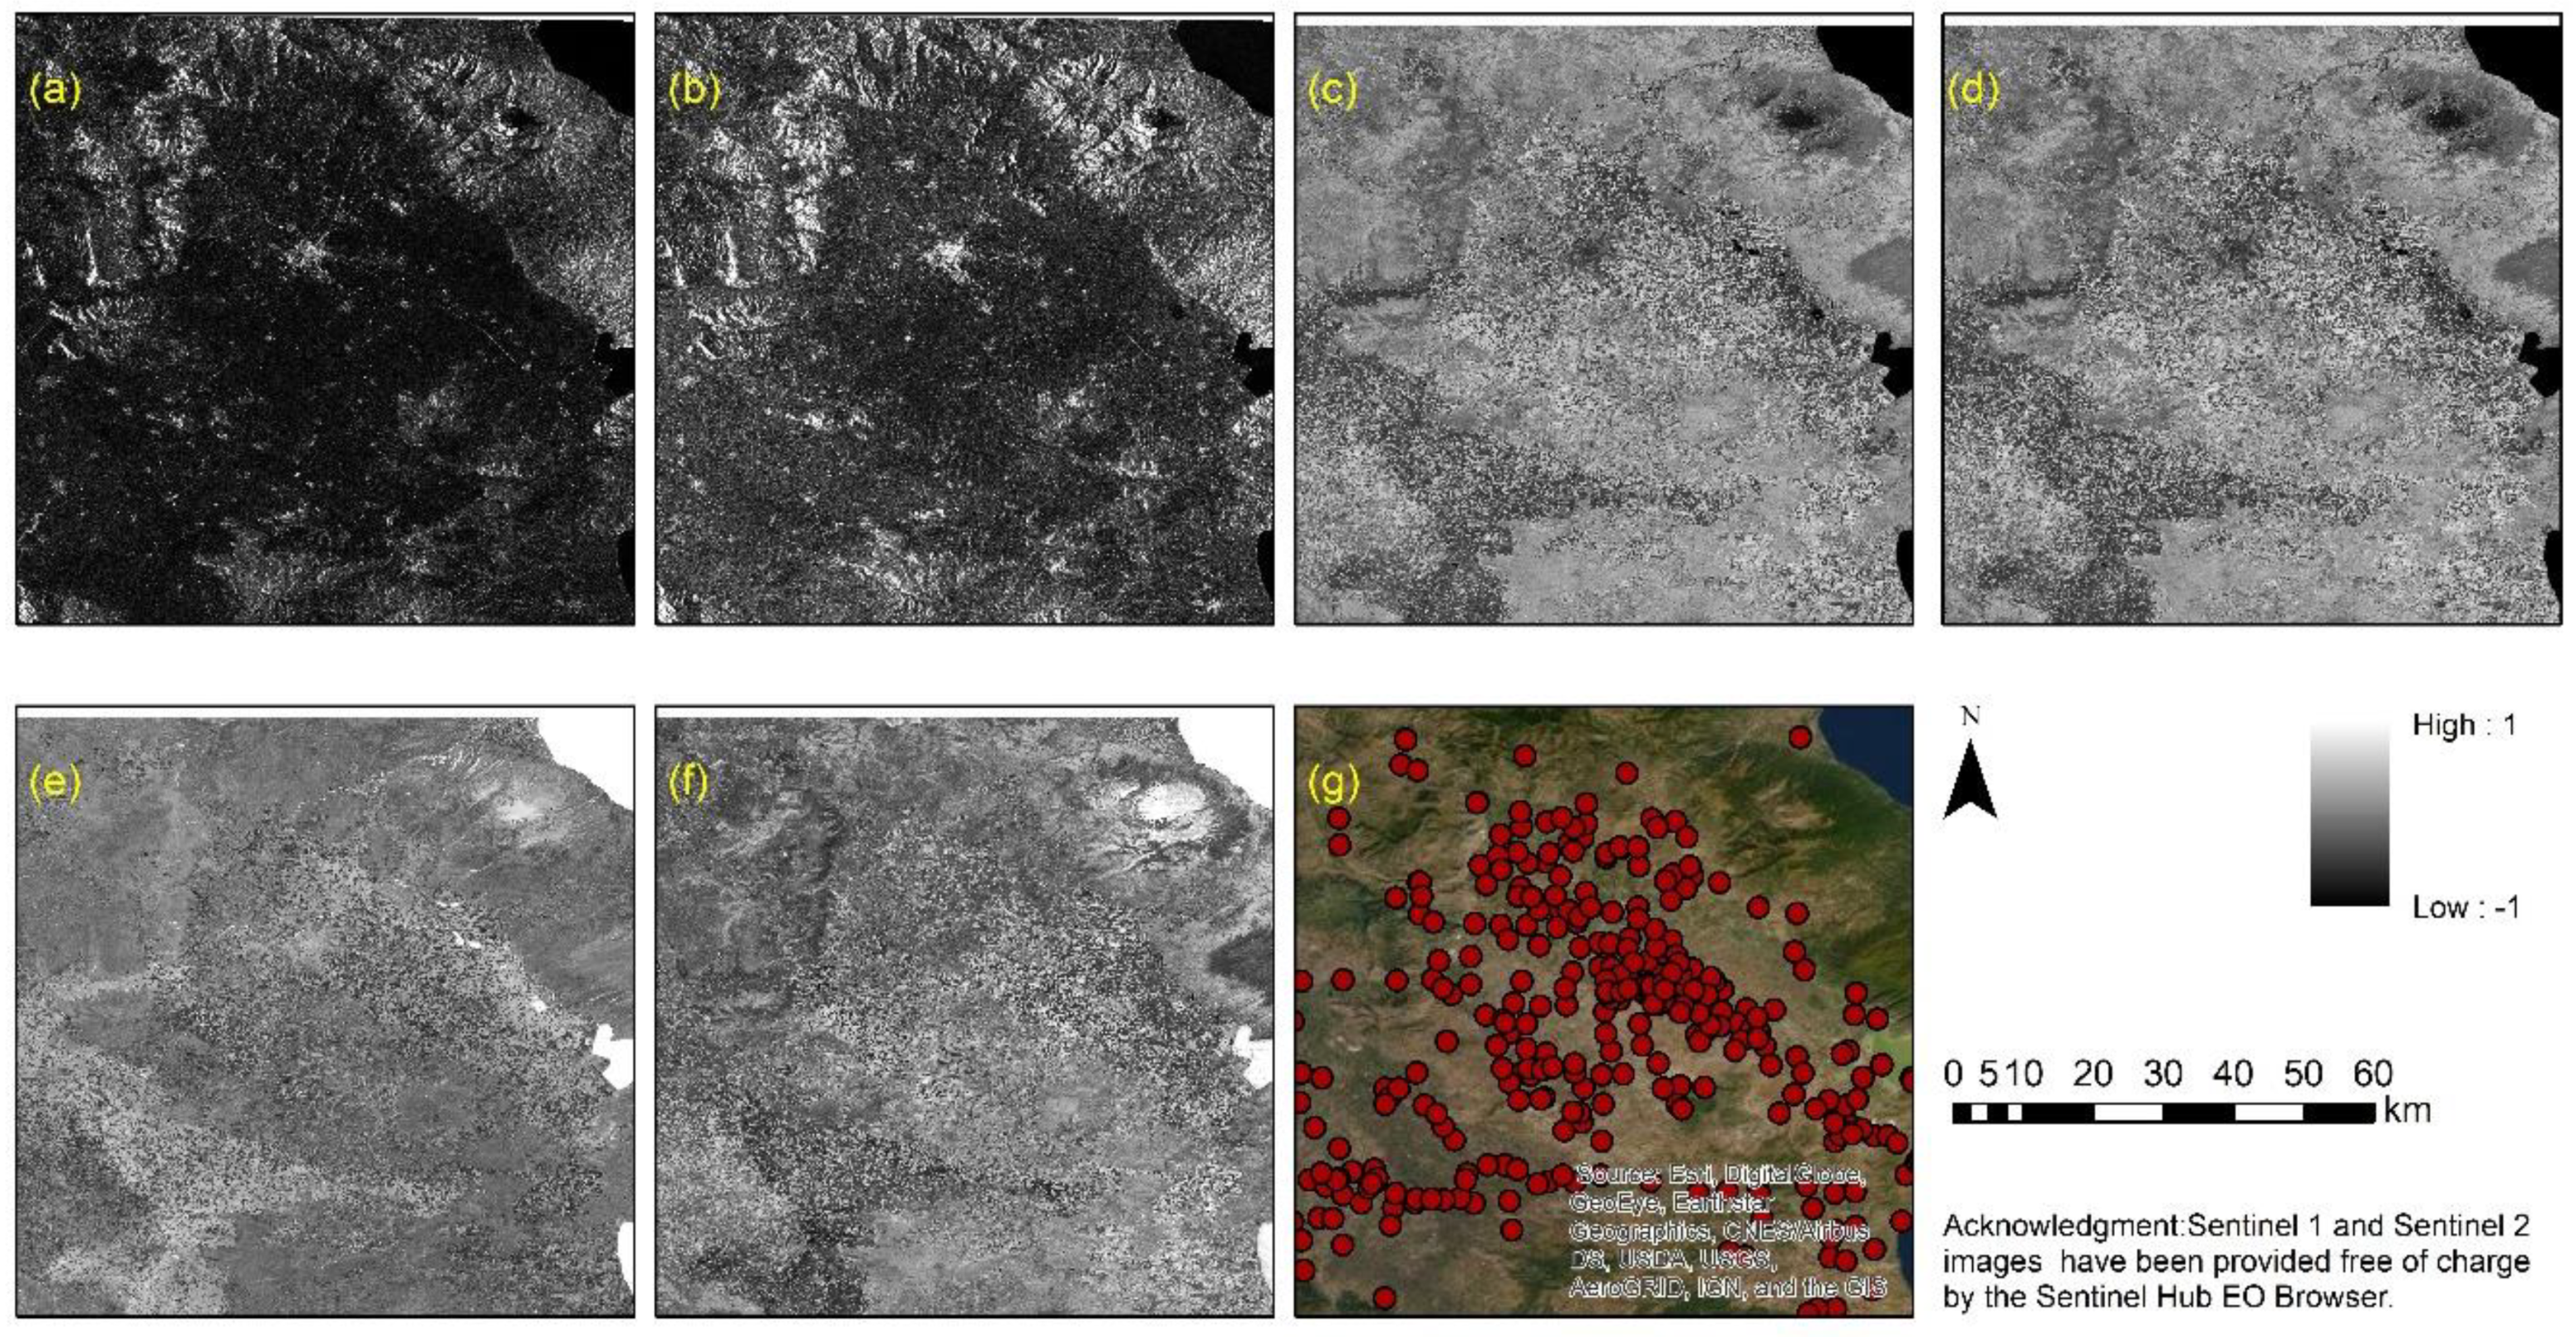
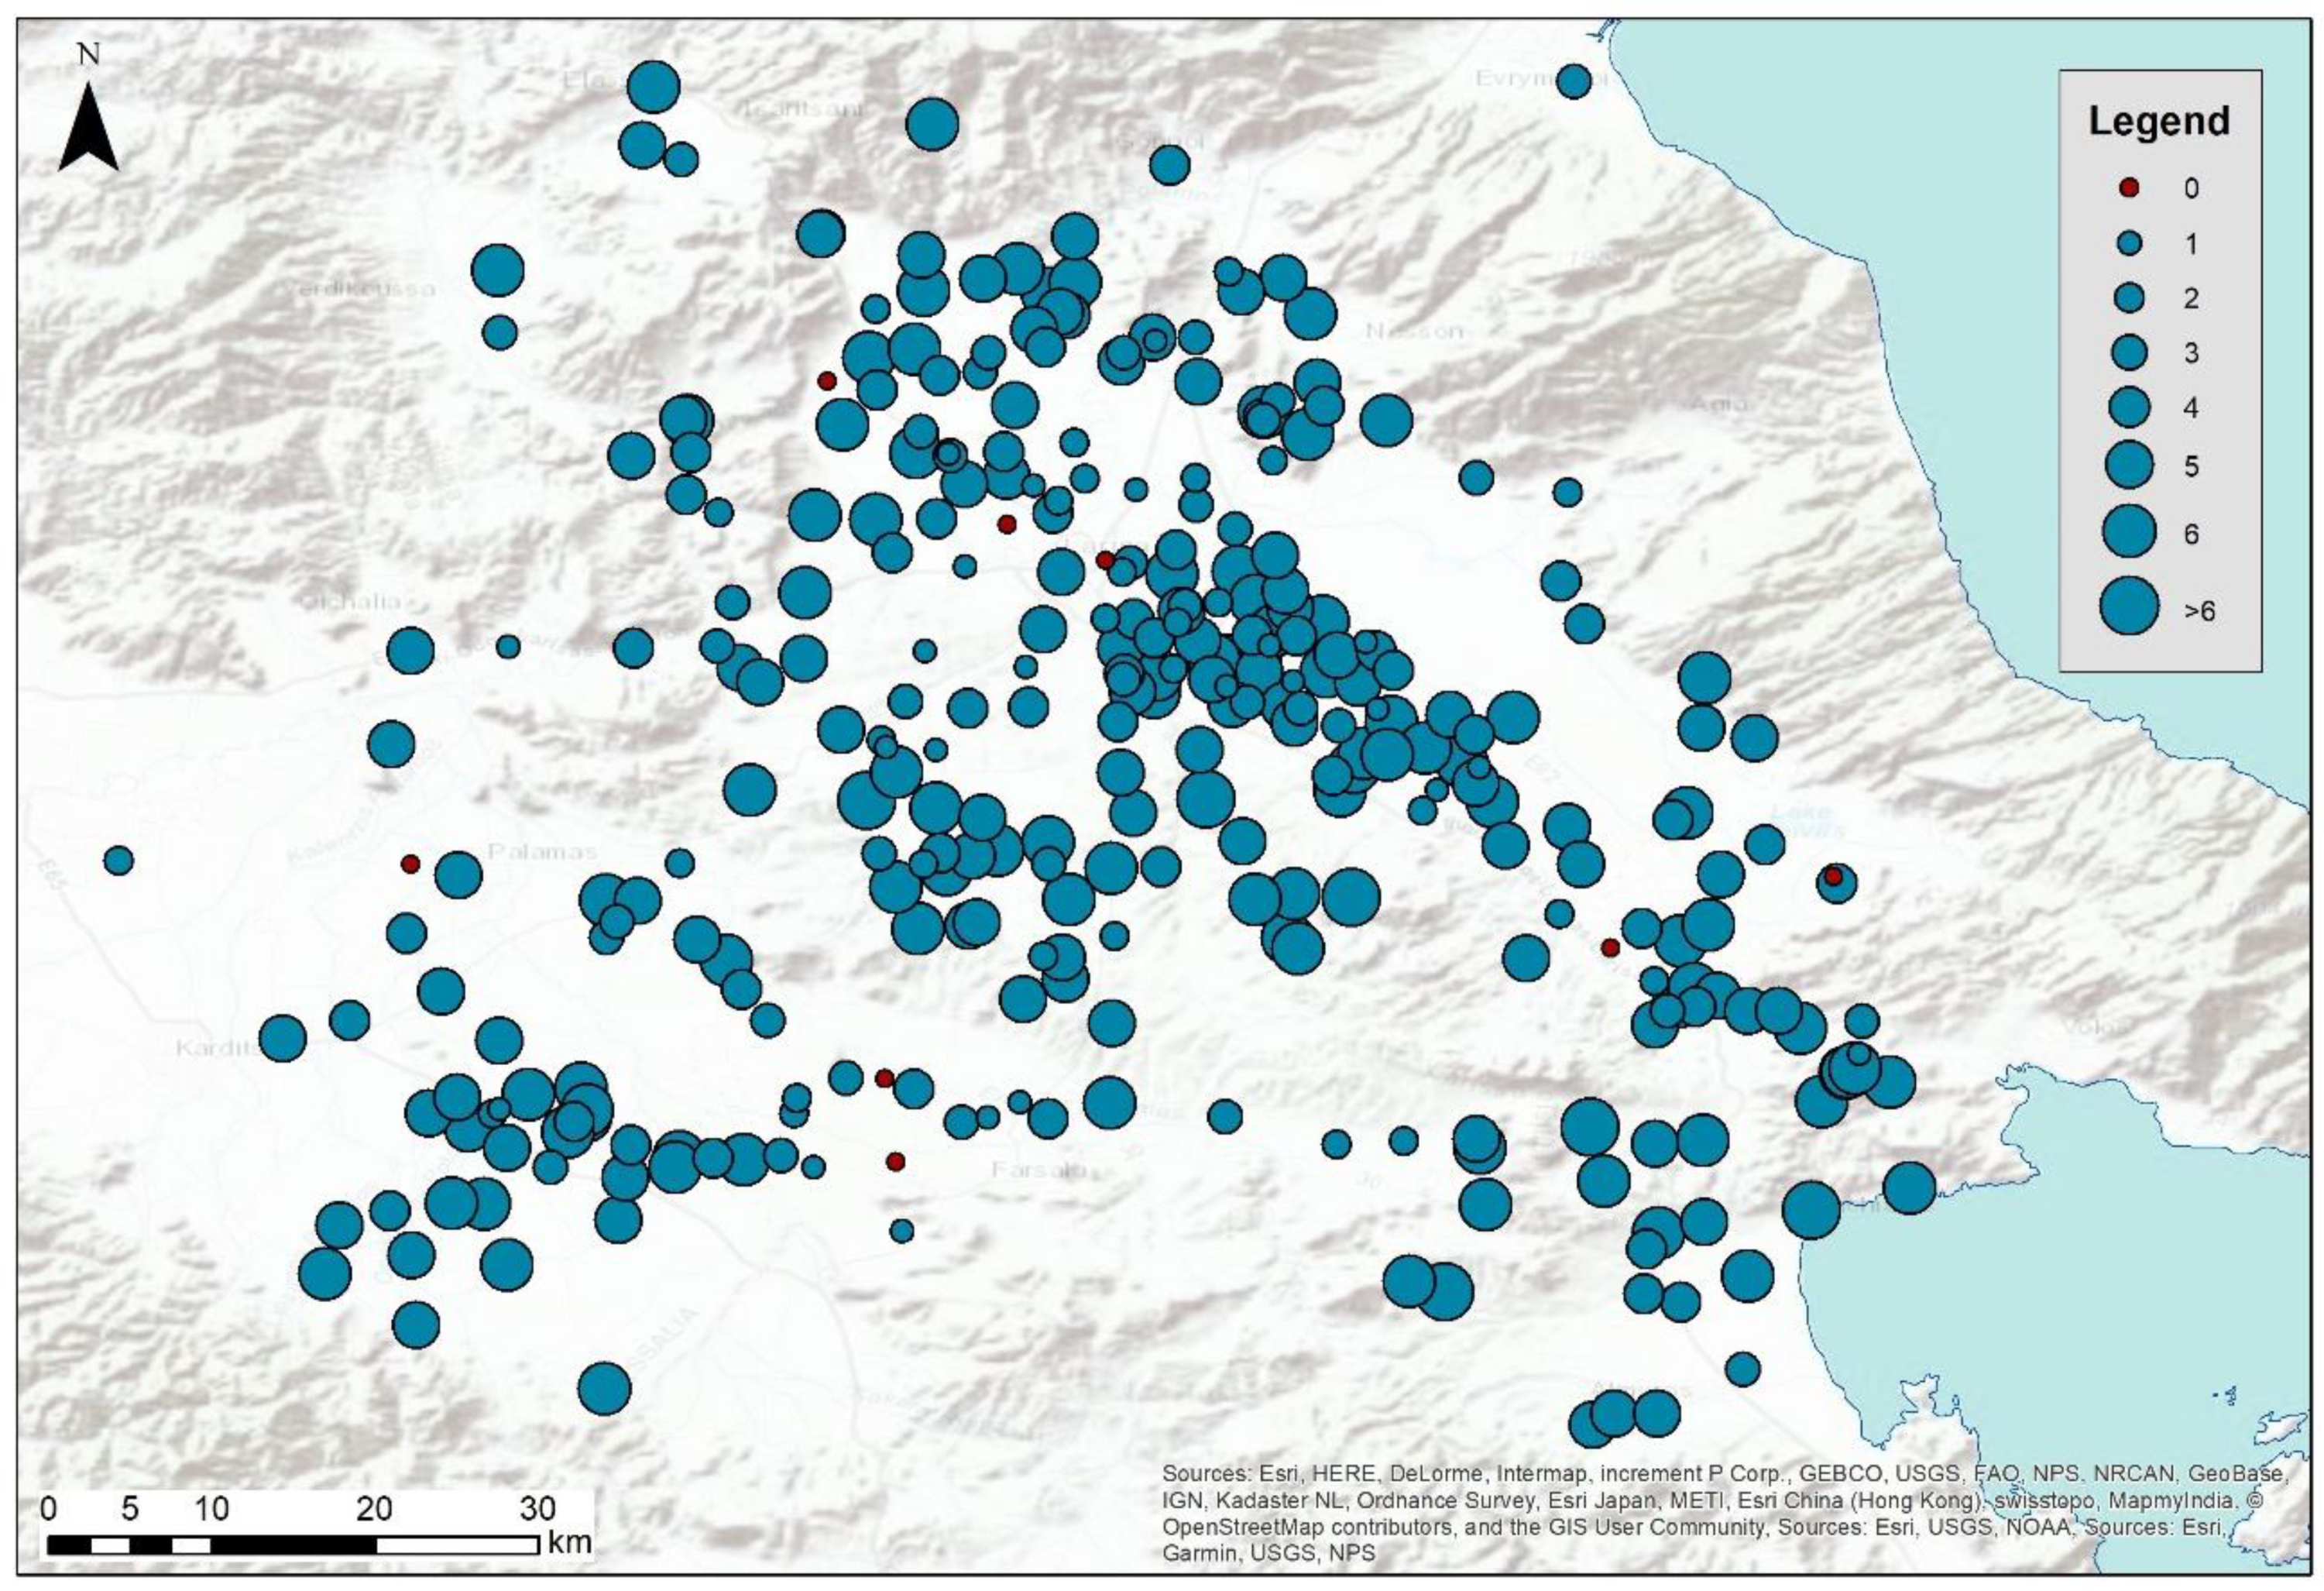
For the needs of the study, we obtained Sentinel-1 and Sentinel-2 images over the area of interest. The Sentinel images were downloaded using the Sentinel Hub [34] cloud platform, which combines a complete archive of the Sentinel-1 and Sentinel-2 sensors. Specifically, a Sentinel-2 image with an acquisition date of 10th of March 2019 and a Sentinel-1 image with an acquisition date of 8th of March 2019 were downloaded from the Sentinel Hub. The specific acquisition period was selected since this was reported in the literature as the optimum time-window for monitoring cropmarks in the Eastern Mediterranean [35].
The Sentinel Hub provides Sentinel-1 data acquired in interferometric wide swath (IW) mode, with a 250 km swath, processed to Level-1 ground range detected (GRD) at resolution of 10 m, orthorectified at VV intensity (vertical transmit and vertical receive) and VH intensity (vertical transmit and horizontal receive) polarization (Figure 4a,b, respectively). Besides, the Sentinel Hub provides optical Sentinel-2 data processed to two levels: L1C (orthorectified Top-Of-Atmosphere reflectance) and L2A (orthorectified Bottom-Of-Atmosphere reflectance) with spatial resolution of 10 m, 20 m, and 60 m, depending on the wavelength. The spatial resolution of these datasets is considered adequate for the needs of the current study, as the average diameter of the magoules is approximately 100 m.
Based on the reflectance values of the optical Sentinel-2 image, the normalized difference vegetation index (NDVI) [36], the normalized archaeological index (NAI) [37], the normalized difference water index (NDWI) [38], and the normalized difference moisture index (NDMI) [39] have been calculated following Equations (1)–(4). The optical products of Sentinel-2 are shown in Figure 4c–f.
N D V I = ( ρ B a n d   8 ρ B a n d   4 ) ( ρ B a n d   8   + ρ B a n d   4 )
N A I = ( ρ B a n d   7 ρ B a n d   4 ) ( ρ B a n d   7 + ρ B a n d   4 )
N D W I = ( ρ B a n d   3 ρ B a n d   8 ) ( ρ B a n d   3 + ρ B a n d   8 )
N D M I = ( ρ B a n d   8 ρ B a n d   11 ) ( ρ B a n d   8 + ρ B a n d   11 )
The two optical and four radar products, namely the VV and VH intensity polarization and the optical indices NDVI, NAI, NDWI, and NDMI, were grouped into a new multiband image for further processing. It should be mentioned that the radiometric range of all bands was within a range scale from −1 to + 1. Then, a random selection of 60% of the geolocated magoules was extracted from the archaeological geo-database. Based on this subset and the multiband image, the properties of each site were estimated, providing the distinctive signature of the site in regards to the VV, VH, NDVI, NAI, NDWI, and NDMI bands. Afterward, a one-class classification processing was followed based on the mean signature of all sites and spectral angle mapper (SAM) as the classifier algorithm. A threshold of 0.05 of the SAM angle was defined. The outcome of this process was a binary classification image with values of 0 and 1. Value 1 indicated areas (pixels) that share similar signature properties as those of the selected sites, while the 0 value indicated unclassified areas.
The random 60% extraction and classification analysis was repeated ten times to examine the robustness of the overall analysis. All binary classifications results were summed up and masked using the NDVI index. The latest was used so as to exclude nonvegetated areas such as urban areas and water bodies (threshold value >0.3). The overall outcomes of the analysis were evaluated and compared using the existing geodatabase (known magoules). The results were quantified using zonal statistics (mean values), while a prediction map was also produced. The methodology diagram is depicted in Figure 5.

3.3. Data Analysis

The overall one-class classification rate detection results after the ten iterations are shown in Table 2. The minimum number of detections is zero (nondetected in any of the iterations carried out) while the maximum number of detections is ten (equal to all number of iterations). As shown in the table, only eight sites out of 329 (equal to 2.43%) were nondetected from the classification process. Approximately 15% (52 sites) were detected less than two times, and another 25% of sites (84 sites) were detected less than four times. In total, approximately 44% of the sites were detected less than four times out of the ten of the classification process. In contrast, the rest of the sites (56%) were detected more than six times. The geographical distribution of the detection rate is shown in Figure 6. Red dots indicate the nondetected sites after the ten iterations of the SAM classification process, while the radius of the rest of sites is related to the total number of detections.
Based on the outcomes of the one-class classification analysis, a prediction map was generated, as shown in Figure 7. Areas sharing a similar profile with the randomly selected sites were considered as areas with a high likelihood of archaeological evidence more than six times out of ten in the classification process, while grey areas share moderated likelihood values. Given the limited numbers of satellite images used in the study, as well as the extensive area of interest, this prediction map should be taken with great caution and be compared with the existing archaeological visibility of the area. However, like any prediction map in archaeological science, this kind of analysis can support initial steps of landscape research, aiming to visualize the context of an area before any other targeted investigation (e.g., acquisition of high-resolution images, foot surveys, and geophysical prospections) is conducted.

4. Discussion

Previous results have demonstrated the potential use of integrated optical and radar satellite images for remote sensing archaeological investigations in the area of Thessaly. While the analysis is based on a limited number of images (one optical and one radar), the overall results show that more of the half-sites (>50%) could be detected following a supervised one-class classification analysis. Of course, difficulties still occur since some sites were not detected, and others were detected only in some of the classification results, which can be explained due to the heterogeneous individual characteristics of the sites.
Although the use of medium resolution freely distributed datasets has the potential to assist towards the detection of new archaeological sites, critical aspects need to be taken into consideration, for instance, the spatial resolution of such datasets. In the case of the Thessalian plain, the use of such images was feasible mainly due to the vast extent of the magoules (100 m diameter). However, the medium resolution does not provide the highest level of accuracy compared to the high-resolution sensors.
However, while high-resolution images with submeter spatial analysis can provide more detail regarding the archaeological area of interest as shown in several examples in the past [40,41], the use of medium freely distributed datasets should not be overlooked. On the contrary, the exploitation of these datasets should be seen as a complementary source of information for supporting large scale archaeological investigations, such as the case of the Thessalian Plain, and are possibly able to unlock new research avenues of future multitemporal archaeological investigations. While the synergistic use of optical and radar images is still in its infancy, it is considered promising [4]. Of course, the virtual constellation concept is not restricted to freely distributed images such as those of Sentinel 1 and Sentinel 2, but it also includes commercial images (either optical or radar), which in combination can support archaeological investigations. Big data earth processing cloud platforms which can support large scale and extensive datasets of observations are considered as essential aspects to support similar future investigations [42,43].

5. Conclusions

New developments of earth observation sensors and the development of advanced image processing are some fundamental changes observed in the last years in the field. Due to the variety of sensors available today as well as the variety of space agencies dealing with satellite missions and instruments, the CEOS has proposed a conceptual framework where these could be used together for the benefit of the scientific community by providing harmonized data, filling observation gaps, and improving monitoring, etc. This concept has been lately extended by [16], aiming to include other types of sensors which are incompatible between them as in the case of active and passive space-based sensors.
This framework allows researchers to explore new ways of fusion, better integration, and understanding of the environment that is essential for various scientific domains. This framework could also support heritage management and archaeological prospection, thus maximizing the benefit of space sensors in specific domains. This integration is not an easy task, but it could fill gaps observed using established methods. As the results have shown, difficulties still exist and thus further research is needed. At the same time, efforts for integrating historical data (satellite and aerial), which are essential to better understand landscape changes, are also needed.
Virtual constellation requires the systematic efforts of the scientific community as well as space agency authorities towards the integration of various types of sensors for archaeological research. Therefore, the virtual constellation concept can be the framework for this effort as this has been already implemented with success in other scientific fields. From the experience and work of other ongoing constellations [16], it is clear that the cultural heritage section needs to investigate various approaches for gap analyses and requirement assessments, building upon the existing VCs. The authors will continue to investigate how the synergistic use of radar and optical datasets (level ARL-1) can be further exploited in a more systematic way.

Author Contributions

Conceptualization, A.A.; methodology, A.A. and D.D.A.; investigation, A.A. and D.D.A.; writing—original draft preparation, A.A.; writing—review and editing, A.A., D.D.A. and D.G.H.; visualization, A.A.; project administration, A.A.; funding acquisition, A.A.

Funding

The results are part of the project “Synergistic Use of Optical and Radar data for cultural heritage applications“, (PLACES), with grant number CULTURE/AWARD-YR/0418/0007 funded by the Republic of Cyprus.

Acknowledgments

This study contains modified Copernicus Sentinel data 2019 processed by Sentinel Hub. Acknowledgment is also given to NASA GSFC as data source acquired through the Sentinel Hub services. The authors would like to thank the Eratosthenes Research Centre of the Department of Civil Engineering and Geomatics at the Cyprus University of Technology (www.cut.ac.cy) for its support. The authors would also like to thank the Cyprus University of Technology Open Access Author Fund that covered the open access publication fees.

Conflicts of Interest

The authors declare no conflict of interest.

References

  1. Xia, J.; Yang, C.; Li, Q. Building a spatiotemporal index for Earth Observation Big Data. Int. J. Appl. Earth Obs. Geoinf. 2018, 73, 245–252. [Google Scholar] [CrossRef]
  2. Agapiou, A.; Sarris, A. Beyond GIS Layering: Challenging the (Re)use and Fusion of Archaeological Prospection Data Based on Bayesian Neural Networks (BNN). Remote Sens. 2018, 10, 1762. [Google Scholar] [CrossRef]
  3. González, J.J.F.; Hernández, F.R.V. NDVI Identification and Survey of a Roman Road in the Northern Spanish Province of Álava. Remote Sens. 2019, 11, 725. [Google Scholar] [CrossRef]
  4. Luo, L.; Wang, X.; Lasaponara, R.; Xiang, B.; Zhen, J.; Zhu, L.; Yang, R.; Liu, D.; Liu, C. Auto-Extraction of Linear Archaeological Traces of Tuntian Irrigation Canals in Miran Site (China) from Gaofen-1 Satellite Imagery. Remote Sens. 2018, 10, 718. [Google Scholar] [CrossRef]
  5. Mineo, S.; Pappalardo, G.; Mangiameli, M.; Campolo, S.; Mussumeci, G. Rockfall Analysis for Preliminary Hazard Assessment of the Cliff of Taormina Saracen Castle (Sicily). Sustainability 2018, 10, 417. [Google Scholar] [CrossRef]
  6. Caspari, G. Assessing Looting from Space: The Destruction of Early Iron Age Burials in Northern Xinjiang. Heritage 2018, 1, 320–327. [Google Scholar] [CrossRef] [Green Version]
  7. Agapiou, A.; Lysandrou, V.; Hadjimitsis, D.G. Optical Remote Sensing Potentials for Looting Detection. Geosciences 2017, 7, 98. [Google Scholar] [CrossRef]
  8. Borie, C.; Parcero-Oubiña, C.; Kwon, Y.; Salazar, D.; Flores, C.; Olguín, L.; Andrade, P. Beyond Site Detection: The Role of Satellite Remote Sensing in Analysing Archaeological Problems. A Case Study in Lithic Resource Procurement in the Atacama Desert, Northern Chile. Remote Sens. 2019, 11, 869. [Google Scholar] [CrossRef]
  9. Cigna, F.; Tapete, D. Tracking Human-Induced Landscape Disturbance at the Nasca Lines UNESCO World Heritage Site in Peru with COSMO-SkyMed InSAR. Remote Sens. 2018, 10, 572. [Google Scholar] [CrossRef]
  10. Tapete, D.; Cigna, F. COSMO-SkyMed SAR for Detection and Monitoring of Archaeological and Cultural Heritage Sites. Remote Sens. 2019, 11, 1326. [Google Scholar] [CrossRef]
  11. Cigna, F.; Lasaponara, R.; Masini, N.; Milillo, P.; Tapete, D. Persistent Scatterer Interferometry Processing of COSMO-SkyMed StripMap HIMAGE Time Series to Depict Deformation of the Historic Centre of Rome, Italy. Remote Sens. 2014, 6, 12593–12618. [Google Scholar] [CrossRef] [Green Version]
  12. Tapete, D.; Cigna, F.; Donoghue, D.N. ‘Looting marks’ in space-borne SAR imagery: Measuring rates of archaeological looting in Apamea (Syria) with TerraSAR-X Staring Spotlight. Remote Sens. Environ. 2016, 178, 42–58. [Google Scholar] [CrossRef]
  13. Stewart, C. Detection of Archaeological Residues in Vegetated Areas Using Satellite Synthetic Aperture Radar. Remote Sens. 2017, 9, 118. [Google Scholar] [CrossRef]
  14. Luo, L.; Wang, X.; Guo, H.; Lasaponara, R.; Zong, X.; Masini, N.; Wang, G.; Shi, P.; Khatteli, H.; Chen, F.; et al. Airborne and spaceborne remote sensing for archaeological and cultural heritage applications: A review of the century (1907–2017). Remote Sens. Environ. 2019, 232, 111280. [Google Scholar] [CrossRef]
  15. Agapiou, A.; Lysandrou, V. Remote Sensing Archaeology: Tracking and mapping evolution in scientific literature from 1999–2015. J. Archaeol. Sci. Rep. 2015, 4, 192–200. [Google Scholar] [CrossRef]
  16. Wulder, M.A.; Hilker, T.; White, J.C.; Coops, N.C.; Masek, J.G.; Pflugmacher, D.; Crevier, Y. Virtual constellations for global terrestrial monitoring. Remote Sens. Environ. 2015, 170, 62–76. [Google Scholar] [CrossRef] [Green Version]
  17. CEOS—Committee on Earth Observation Satellites. Available online: http://ceos.org/ourwork/virtual-constellations/ (accessed on 8 January 2019).
  18. Kvamme, K.L. Geophysical correlation: Global versus local perspectives. Archaeol. Prospect. 2018, 25, 111–120. [Google Scholar] [CrossRef]
  19. Agapiou, A.; Lysandrou, V.; Sarris, A.; Papadopoulos, N.; Hadjimitsis, D.G. Fusion of Satellite Multispectral Images Based on Ground-Penetrating Radar (GPR) Data for the Investigation of Buried Concealed Archaeological Remains. Geosciences 2018, 7, 40. [Google Scholar] [CrossRef]
  20. Malfitana, D.; Leucci, G.; Fragalà, G.; Masini, N.; Scardozzi, G.; Cacciaguerra, G.; Santagati, C.; Shehi, E. The potential of integrated GPR survey and aerial photographic analysis of historic urban areas: A case study and digital reconstruction of a Late Roman villa in Durrës (Albania). J. Archaeol. Sci. Rep. 2015, 4, 276–284. [Google Scholar] [CrossRef]
  21. Sarris, A.; Papadopoulos, N.; Agapiou, A.; Salvi, M.C.; Hadjimitsis, D.G.; Parkinson, A.; Yerkes, R.W.; Gyucha, A.; Duffy, R.P. Integration of geophysical surveys, ground hyperspectral measurements, aerial and satellite imagery for archaeological prospection of prehistoric sites: The case study of Vészt˝o-Mágor Tell, Hungary. J. Archaeol. Sci. 2013, 40, 1454–1470. [Google Scholar] [CrossRef]
  22. Kvamme, K.L. Integrating multidimensional geophysical data. Archaeol. Prospect. 2006, 13, 57–72. [Google Scholar] [CrossRef]
  23. Traviglia, A.; Cottica, D. Remote sensing applications and archaeological research in the Northern Lagoon of Venice: The case of the lost settlement of Constanciacus. J. Archaeol. Sci. 2011, 38, 2040–2050. [Google Scholar] [CrossRef]
  24. CEOS Database. Available online: http://database.eohandbook.com/database/agencytable.aspx (accessed on 8 January 2019).
  25. Luo, L.; Wang, X.; Guo, H.; Lasaponara, R.; Shi, P.; Bachagha, N.; Li, L.; Yao, Y.; Masini, N.; Chen, F.; et al. Google Earth as a Powerful Tool for Archaeological and Cultural Heritage Applications: A Review. Remote Sens. 2018, 10, 1558. [Google Scholar] [CrossRef]
  26. Tapete, D.; Cigna, F. Trends and perspectives of SAR remote sensing for landscape archaeology and cultural heritage applications. J. Archaeol. Sci. Rep. 2017, 14, 716–726. [Google Scholar]
  27. Engelsk, H. Space Time Place Third International Conference on Remote Sensing in Archaeology 17th-21st August 2009 Tiruchirappalli Tamil Nadu India; BAR International Series 2118; Campana, S., Forte, M., Liuzza, C., Eds.; BAR Publishing: Oxford, UK, 2010; p. 451. [Google Scholar]
  28. Claverie, M.; Ju, J.; Masek, J.G.; Dungan, J.L.; Vermote, E.F.; Roger, J.-C.; Skakun, S.V.; Justice, C. The Harmonized Landsat and Sentinel-2 surface reflectance data set. Remote Sens. Environ. 2018, 219, 145–161. [Google Scholar] [CrossRef]
  29. Vouzaxakis, Κ. Geographical Patterns and Theories of the Inter-settlement Space at Neolithic Thessaly. Ph.D. Thesis, Aristotle University of Thessaloniki, Thessaloniki, Greece, 2009. Unpublished Doctoral Dissertation (In Greek). [Google Scholar]
  30. Alexakis, D.; Sarris, A.; Astaras, T.; Albanakis, K. Integrated GIS, remote sensing and geomorphologic approaches for the reconstruction of the landscape habitation of Thessaly during the neolithic period. J. Archaeol. Sci. 2011, 38, 89–100. [Google Scholar] [CrossRef]
  31. Alexakis, D.; Sarris, A.; Astaras, T.; Albanakis, K. Detection of Neolithic Settlements in Thessaly (Greece) Through Multispectral and Hyperspectral Satellite Imagery. Sensors 2009, 9, 1167–1187. [Google Scholar] [CrossRef] [Green Version]
  32. Kalaycı, T.; Sarris, A. Multi-Sensor Geomagnetic Prospection: A Case Study from Neolithic Thessaly, Greece. Remote Sens. 2016, 8, 966. [Google Scholar] [CrossRef]
  33. Kalayci, T.; Simon, F.-X.; Sarris, A. A Manifold Approach for the Investigation of Early and Middle Neolithic Settlements in Thessaly, Greece. Geosciences 2017, 7, 79. [Google Scholar] [CrossRef]
  34. Sentinel-Hub, EO Browser. Available online: https://www.sentinel-hub.com/explore/eobrowser (accessed on 25 April 2019).
  35. Agapiou, A.; Hadjimitsis, D.G.; Sarris, A.; Georgopoulos, A.; Alexakis, D.D. Optimum temporal and spectral window for monitoring crop marks over archaeological remains in the Mediterranean region. J. Archaeol. Sci. 2013, 40, 1479–1492. [Google Scholar] [CrossRef]
  36. Rouse, J.W.; Haas, R.H.; Schell, J.A.; Deering, D.W.; Harlan, J.C. Monitoring the Vernal Advancements and Retrogradation (Greenwave Effect) of Nature Vegetation; NASA/GSFC Final Report; NASA: Greenbelt, MD, USA, 1974.
  37. Agapiou, A.; Alexakis, D.D.; Sarris, A.; Hadjimitsis, D.G. Evaluating the Potentials of Sentinel-2 for Archaeological Perspective. Remote Sens. 2014, 6, 2176–2194. [Google Scholar] [CrossRef] [Green Version]
  38. Gao, B.-C. NDWI—A normalized difference water index for remote sensing of vegetation liquid water from space. Remote Sens. Environ. 1996, 58, 257–266. [Google Scholar] [CrossRef]
  39. Khanmohammadi, F.; Homaee, M.; Noroozi, A.A. Soil moisture estimating with NDVI and land surface temperature and normalized moisture index using MODIS images. J. Soil Water Resour. Conserv. 2015, 4, 37–45. [Google Scholar]
  40. Keay, J.S.; Parcak, H.S.; Strutt, D.K. High resolution space and ground-based remote sensing and implications for landscape archaeology: The case from Portus, Italy. J. Archaeol. Sci. 2014, 52, 277–292. [Google Scholar] [CrossRef]
  41. Lasaponara, R.; Masini, N. Detection of archaeological crop marks by using satellite QuickBird multispectral imagery. J. Archaeol. Sci. 2007, 34, 214–221. [Google Scholar] [CrossRef]
  42. Orengo, H.A.; Petrie, C.A. Large-Scale, Multi-Temporal Remote Sensing of Palaeo-River Networks: A Case Study from Northwest India and its Implications for the Indus Civilisation. Remote Sens. 2017, 9, 735. [Google Scholar] [CrossRef]
  43. Agapiou, A. Remote Sensing Heritage in a petabyte-scale: Satellite Data and Heritage Earth Engine© applications. Int. J. Digit. Earth 2017, 10, 85–102. [Google Scholar] [CrossRef]
Figure 1. Earth observation operated or approved missions and instruments per agency (data from CEOS Database, [24]).
Sensors 19 04066 g001
Figure 2. Earth observation sensors (current and future) supporting landscape topography studies (data from CEOS Database, [24]).
Sensors 19 04066 g002
Figure 3. Photo from the magoula Zerelia (left) and Almyros II (right) (photos from A. Agapiou).
Sensors 19 04066 g003
Figure 4. Sentinel-1A over the Thessalian plain acquired at 8 March 2019: (a) VH polarization image; (b) VV polarization image. Sentinel-2A L2A over the Thessalian plain acquired at 10 March 2019: (c) NDVI image; (d) NAI image; (e) NDWI image and (f) NDMI image. The distribution of the Neolithic settlements in the area is shown in (g).
Sensors 19 04066 g004
Figure 5. The overall methodology for the prediction map and evaluation at the Thessalian plain.
Sensors 19 04066 g005
Figure 6. Geographical distribution of the total detections from one-class classification (max = 10: total number of iterations, min = 0: nondetected).
Sensors 19 04066 g006
Figure 7. Prediction maps based on the one-class classification.
Sensors 19 04066 g007
Table 1. Details of current and future of earth observation instruments providing high-resolution optical data (source: CEOS Database, [24]).
Instrument Sort and Full Name Agencies/CountryInstrument Status *WavelengthResolution (m)Data Access **
AEISS—Advanced Electronic Image Scanning SystemKARI/Korea
(ASTRIUM/Europe)
OVIS, NIRPan: 0.7 m VNIR: 2.8 mVCA
AEISS-A—Advanced Electronic Image Scanning System-AKARI/Korea
(ASTRIUM/Europe)
OVIS, NIR, MWIRPan: 0.7 m VNIR: 2.8 m
IR: 5.5 m
VCA
AEISS-HR—Advanced Electronic Image Scanning System-High ResolutionKARI/Korea
(KAI)
FVIS, NIRPan: 0.5 m, VNIR: 2 mVCA
APAN—Advanced PANISRO/IndiaFVIS1.25CA
ASTER—Advanced Spaceborne Thermal Emission and Reflection RadiometerMETI/India
(NASA)/USA
OVIS, NIR, SWIR, TIRVNIR: 15 m SWIR: 30 m TIR: 90 mOA
ATCOR—Atmospheric correctionISRO/IndiaFVIS, NIR240 mCA
CARBONITE-1 ImagerUKSA/UKOVIS1.5 mVCA
CARBONITE-2 ImagerUKSA/UKOVIS1.2 mVCA
CCD (HJ)CAST/ChinaOVIS, NIR30 mOA
Event Imaging Spectrometer from GEO (GeoCape)NASA/USAFVIS250 m OA
Geoton-L1ROSKOSMOS/RussiaOVIS, NIR1 m; 3 mCA
High Resolution Optical SensorKARI/KoreaFVIS, NIR1mVCA
HiRI—High-Resolution ImagerCNES/FranceOVIS, NIR0.70 mOA
LISS-III—Linear Imaging Self Scanner III (Resourcesat)ISRO/IndiaOVIS, NIR, SWIR23.5 mOA
LISS-IVISRO/IndiaOVIS, NIR5.8 mCA
LISS-V—Linear Imaging Self Scanner – IVISRO/IndiaFVIS2.5CA
MSC—Multi-Spectral CameraKARI/KoreaOVIS, NIRPan: 1 m
VIS-NIR: 4 m
VCA
MSI—Multi Spectral ImagerDLR/GermanyOVIS, NIR6.5 mOA
MSI (Sentinel-2)—Multi-Spectral InstrumentESA/Europe
(COM/Europe)
OVIS, SWIR10/20 m OA
MSS—Multispectral imaging systemROSKOSMOS/Russia (ROSHYDROMET/Russia)OVIS, NIR12 mCA
MUX (SJ-9A)—Multispectral CCD CameraCRESDA/ChinaOVIS, NIR10 mOA
MX (HRSAT)—Multispectral HR VNIRISRO/IndiaFVIS1.9 mCA
NigeriaSat 2 Remote Sensing—Med and High ResNASRDA/NigeriaOVIS, NIRPan: 2.5 m
MS: 5/32 m
OEK VR—Multispectral optoelectronic high-resolution moduleROSKOSMOS/RussiaFVIS, NIRPan: 0.4 m
MS: 1.6 m
CA
PAN (BJ-2)—Panchromatic ImagerNRSCC/ChinaOVIS1 m
PAN (Cartosat-1)—Panchromatic CameraISRO/IndiaOVIS2.5 mCA
PAN (Cartosat-2)—Panchromatic CameraISRO/IndiaOVIS1 mVCA
PAN (Cartosat-2A/2B)—Panchromatic CameraISRO/IndiaOVIS1 mVCA
PAN (Cartosat-2E)—Panchromatic CameraISRO/IndiaOVIS0.65 mVCA
PAN (Cartosat-3)—Panchromatic sensorISRO/IndiaFVIS0.25 mVCA
PAN (CBERS)—Panchromatic and Multispectral ImagerCAST/ChinaOVIS, NIRPan: 5 m
MS: 10 m
OA
GF-1/PMS -Panchromatic and multispectral imagerCRESDA/ChinaOVIS, NIRPan: 5 m
MS: 10 m
OA
GF-2/PMS—Panchromatic and multispectral imagerCRESDA/ChinaOVIS, NIRPan: 5 m
MS: 10 m
OA
PAN (GISTDA)—Panchromatic imagerGISTDA/ThailandOVIS2 mCA
PAN (HRSAT)—Panchromatic CameraISRO/IndiaFVIS1 mCA
PAN (SJ-9A)—Panchromatic and multispectral imagerCRESDA/ChinaOVIS, NIR2.5 mOA
PAN (ZY-1-02C)—Panchromatic and multispectral imagerCRESDA/ChinaOVIS, NIRPan: 5 m
MS: 10 m
VCA
PAN CAMERA—Panchromatic CameraASI/ItalyFVIS5 mCA
PAN THEOS-2 (GISTDA)—Panchromatic imager THEOS-2GISTDA/ThailandOVIS2 mCA
PAN+MS (RGB+NIR)—Ingenio PAN+MS CDTI/Spain
(ESA/Europe)
FVIS, NIRPan: 2.5 m
MS: 10 m
CA
PSS—Panchromatic imaging systemROSKOSMOS/Russia (ROSHYDROMET/Russia)OVIS, NIR2.5 mCA
VHRI-100—Very High-Resolution Imager 100UKSA/UKOVIS, NIRPan: 1.0 m
MS: 4.0 m
CA
WPM—Wide Swath Panchromatic and Multispectral CameraCAST/ChinaFVIS, NIRPan: 2 m
MS: 8 m
OA
* O: Operational, F: Future
** VCA: Very Constrained Access; CA: Constrained Access; OA: Open Access
Table 2. Overall results from the evaluation report.
DescriptionTotal Number%Cumulative %
Nondetected sites82.432.43
Sites detected less than 2 times5215.8118.24
Sites detected less than 4 times8425.5343.77
Sites detected less than 6 times17954.4198.18
Sites detected more than 6 times61.82100.00

