Addressing Challenges in Fabricating Reflection-Based Fiber Optic Interferometers


Abstract
1. Introduction
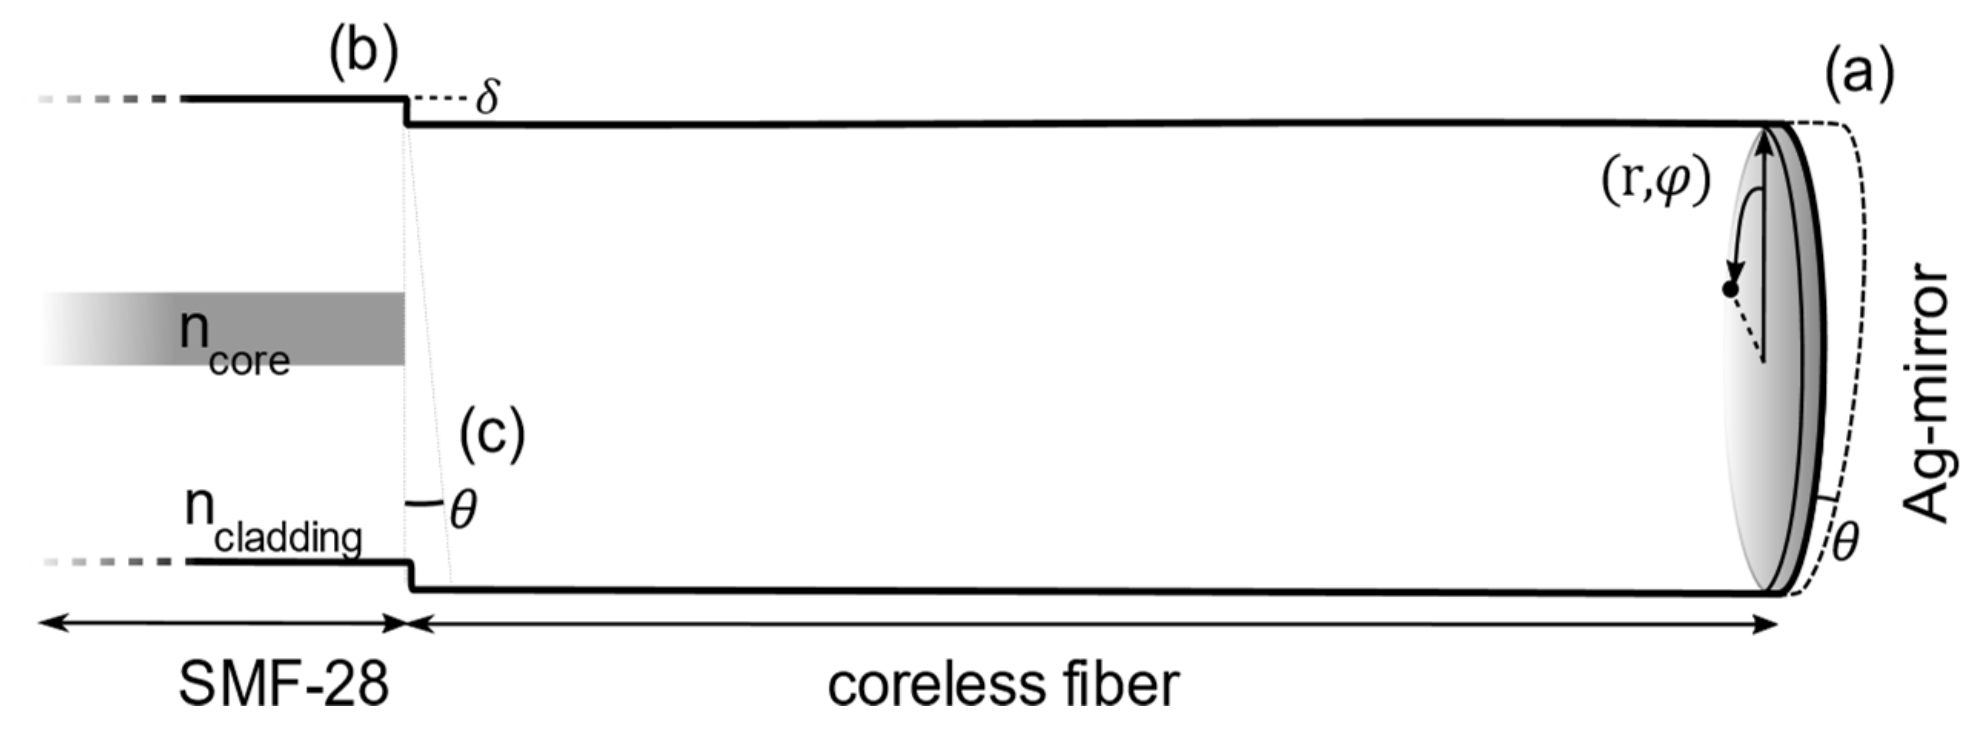
2. Methods
Guided-Mode Propagation Model
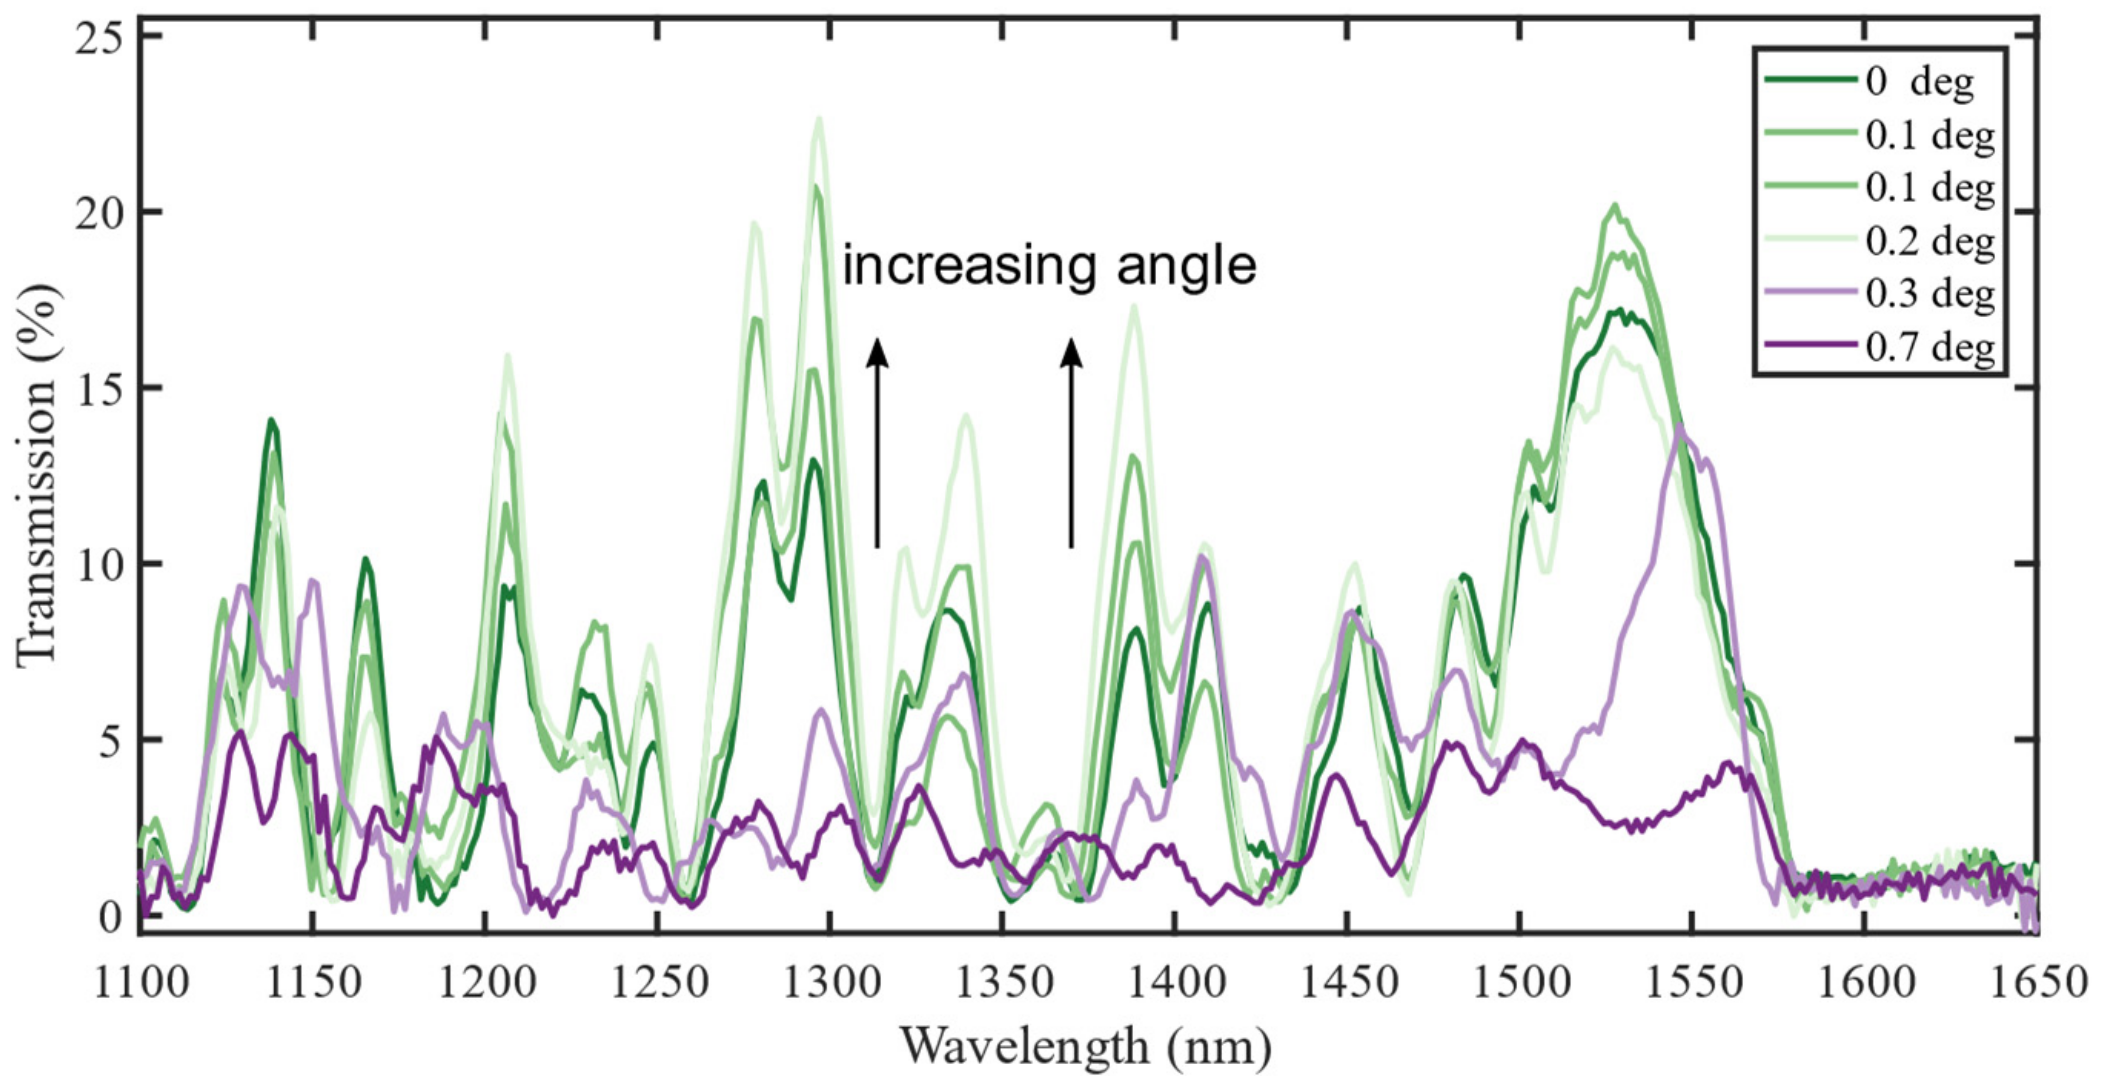
3. Experimental Results
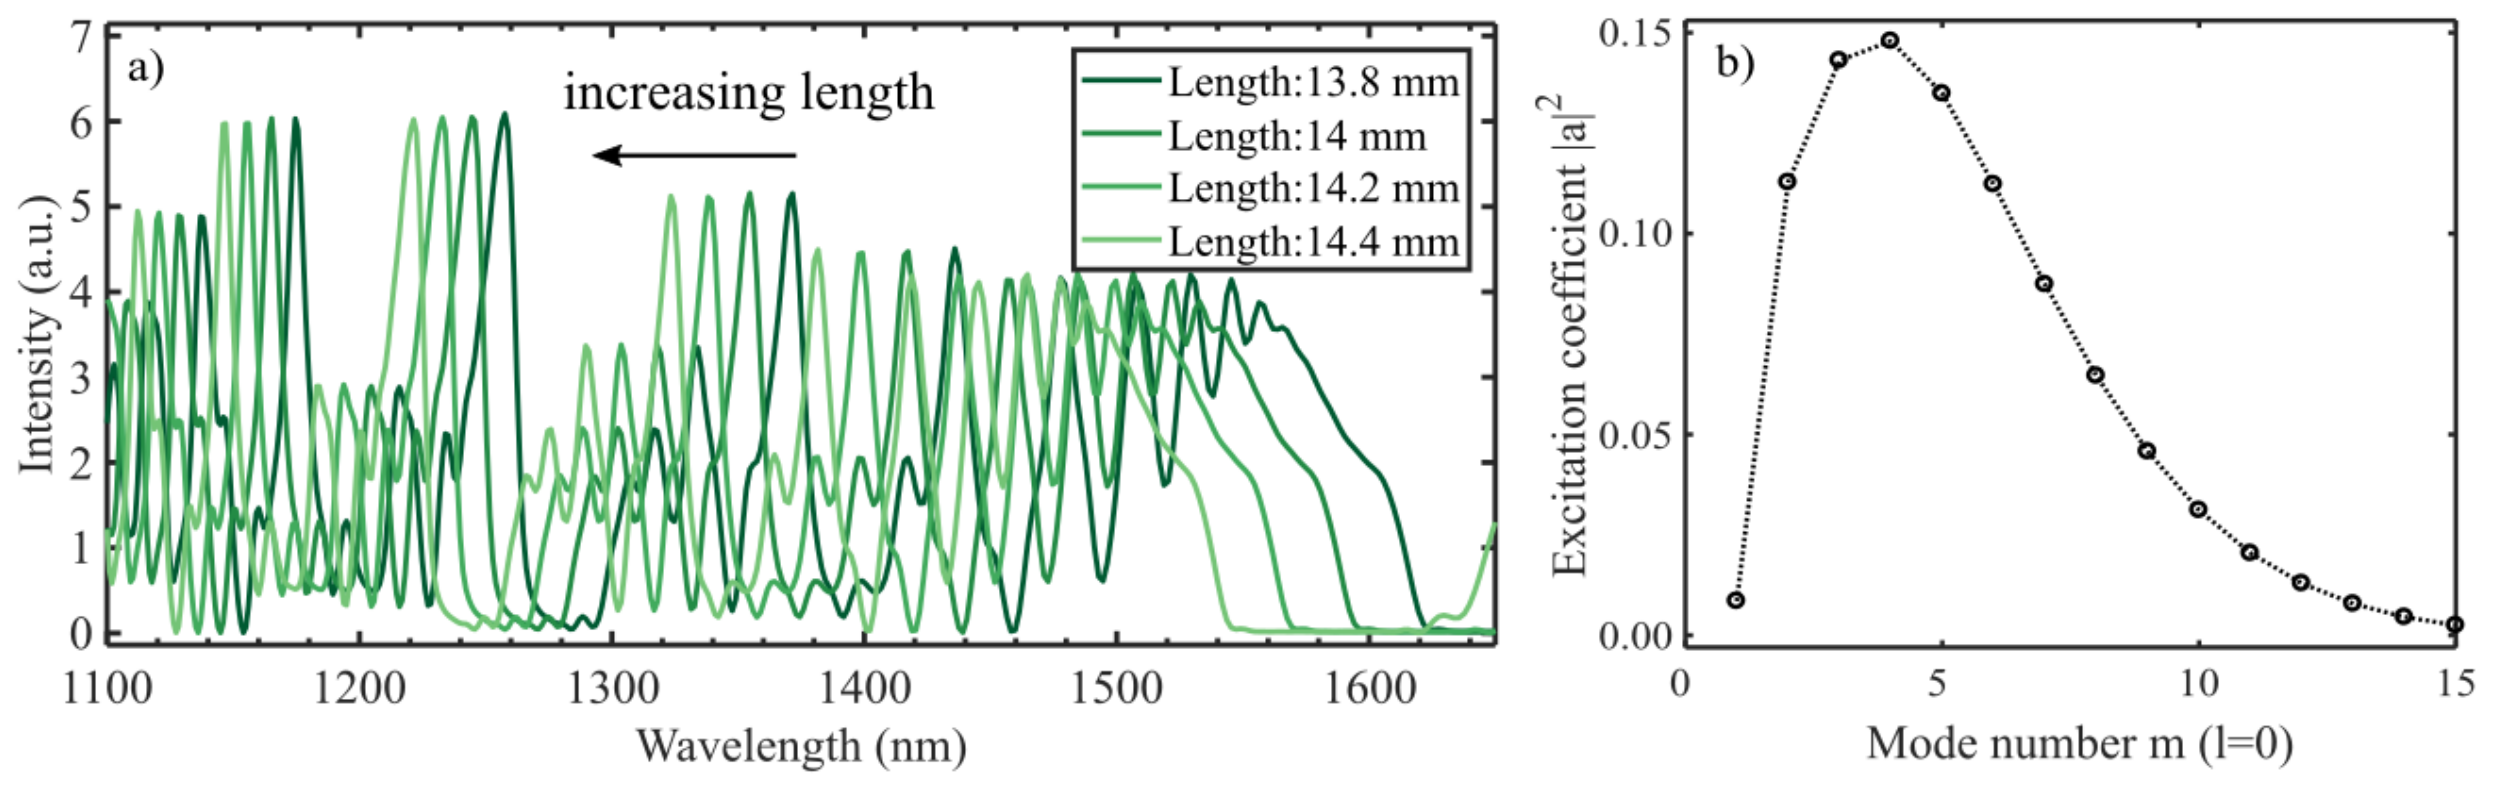
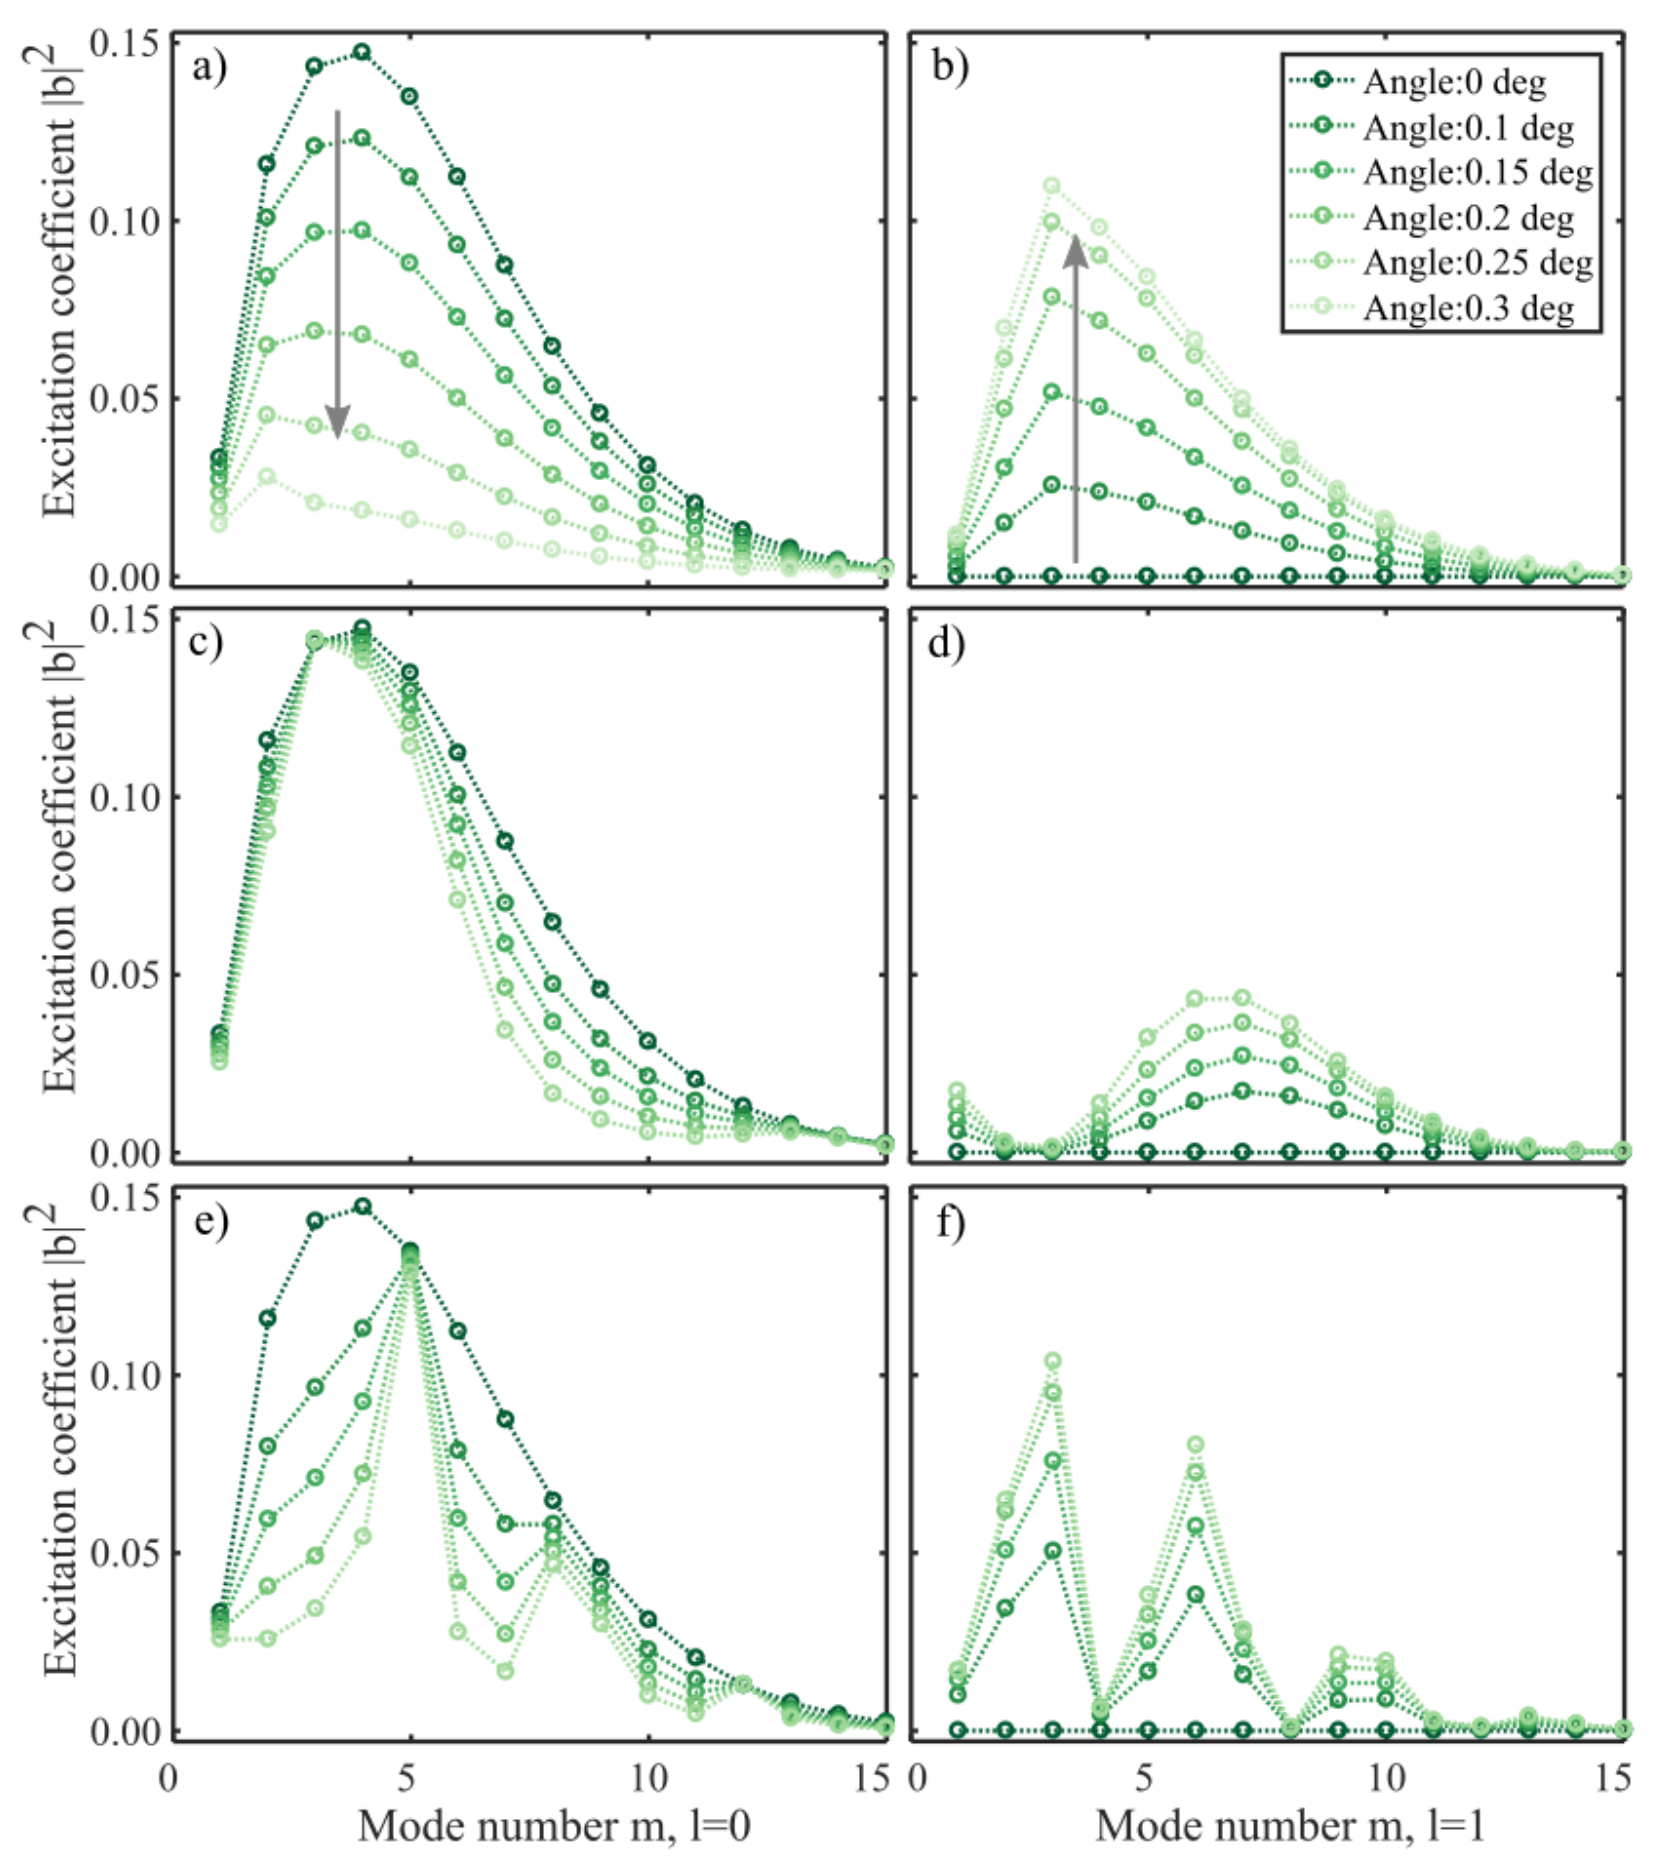
4. Simulation Results
4.1. General Results
4.2. Cleave Angle
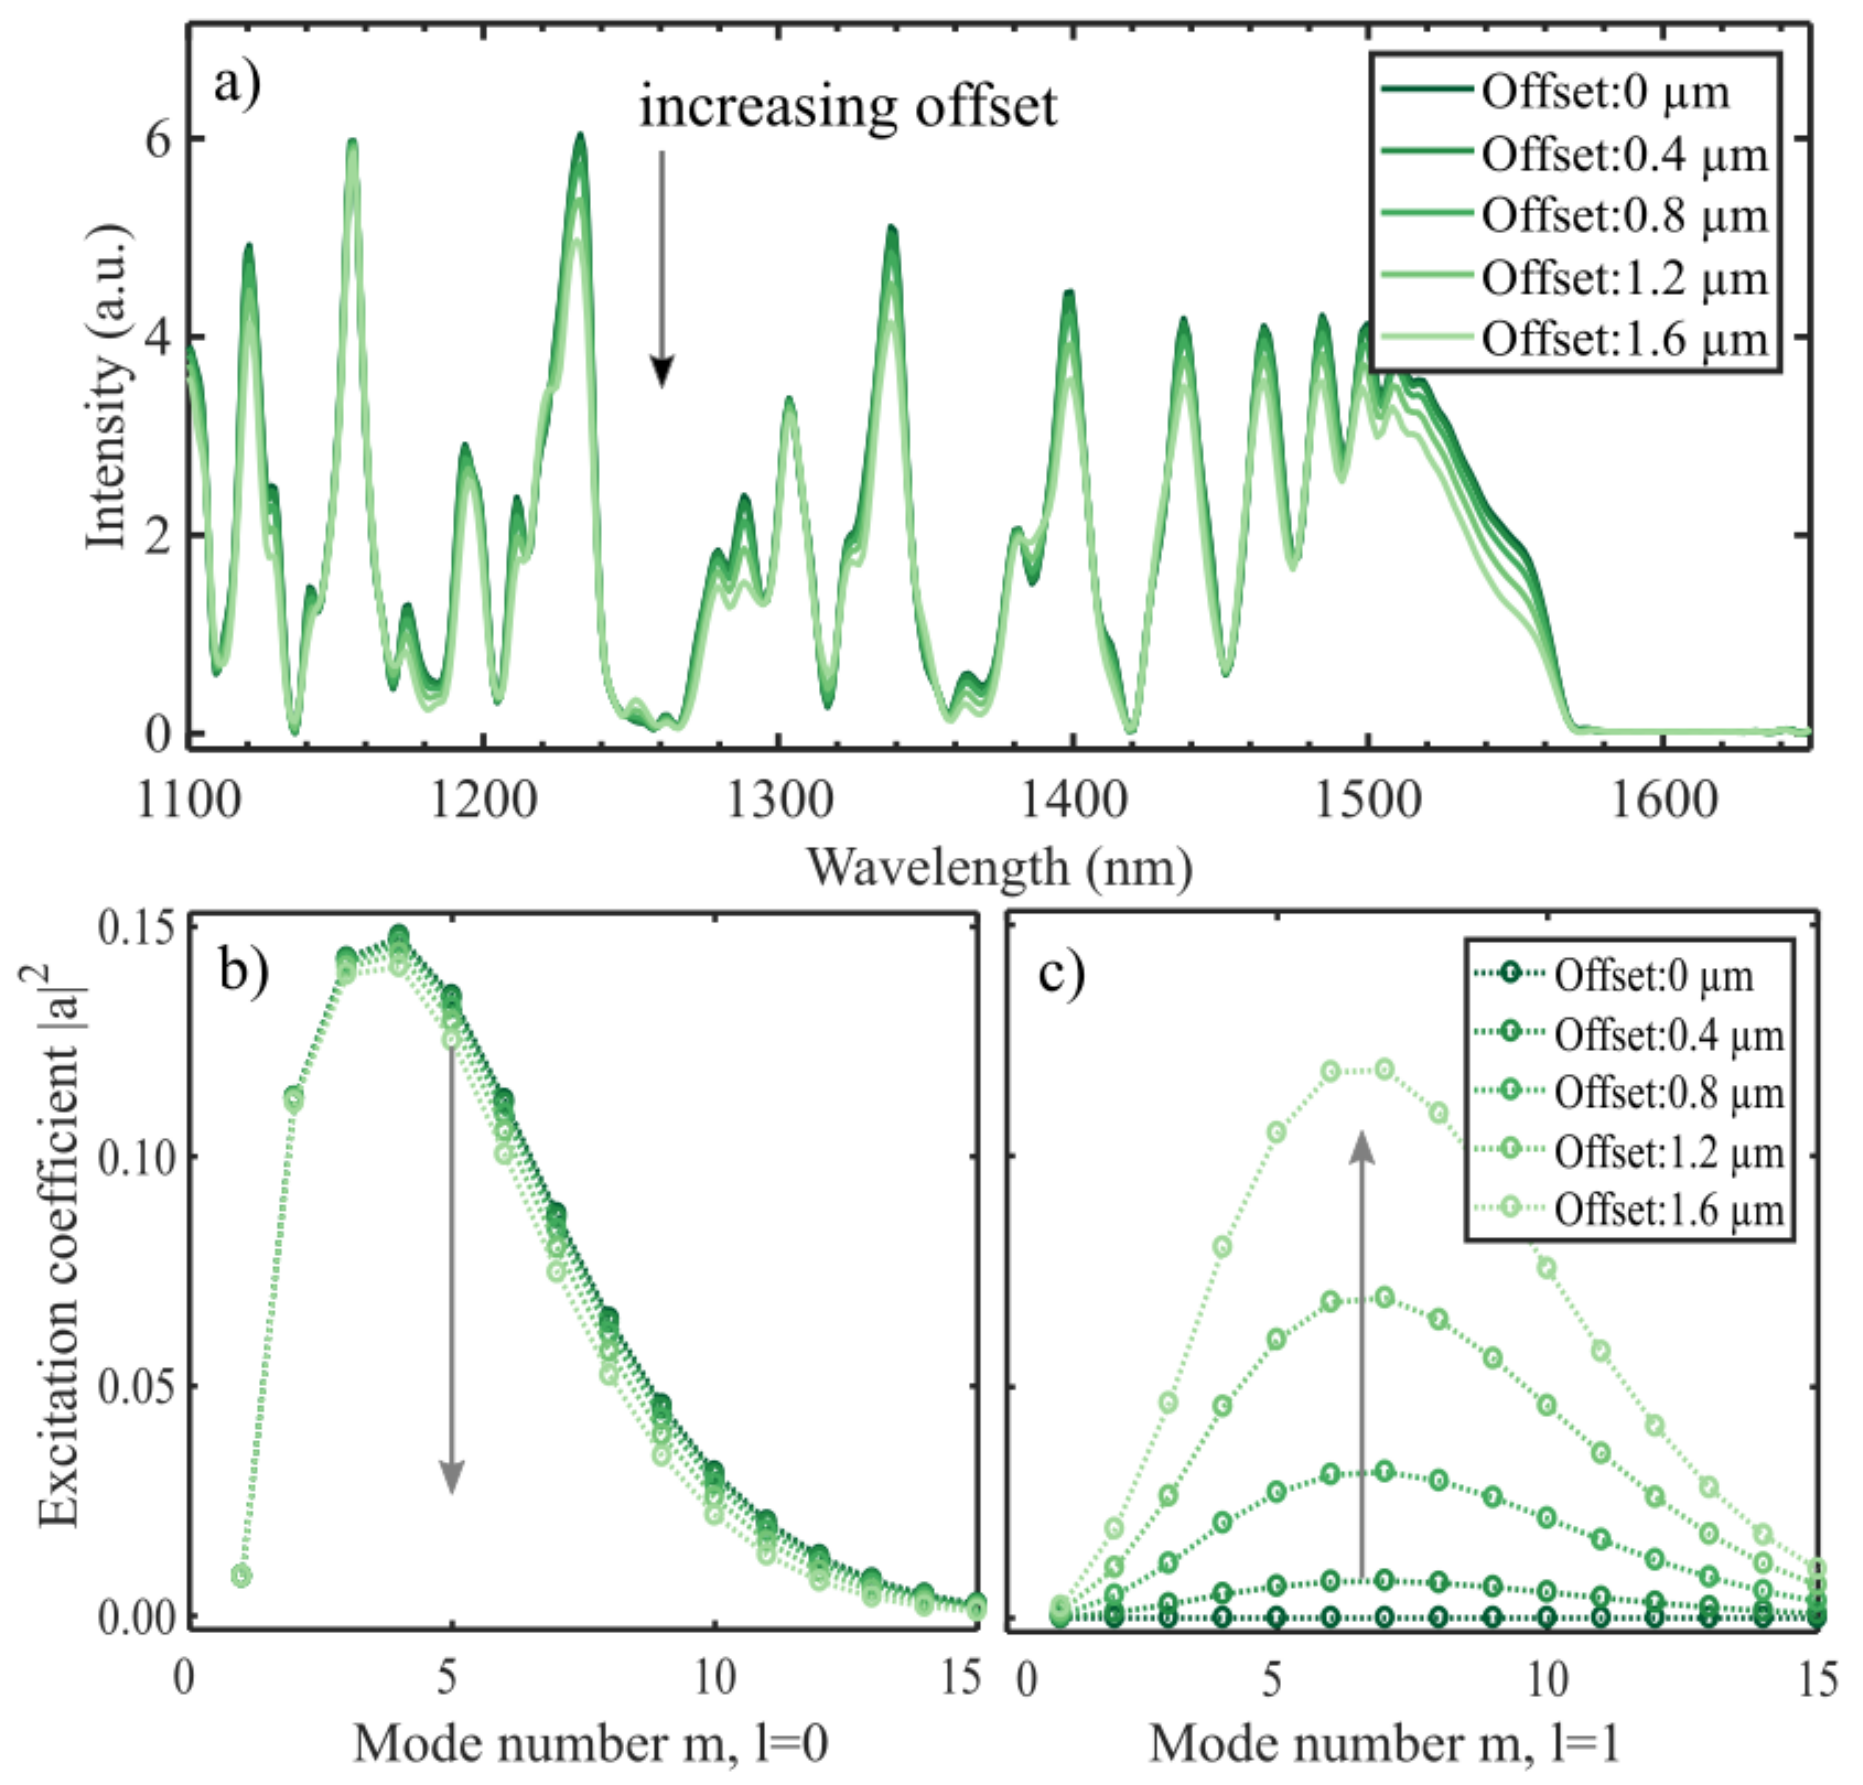
4.3. Splice Offset
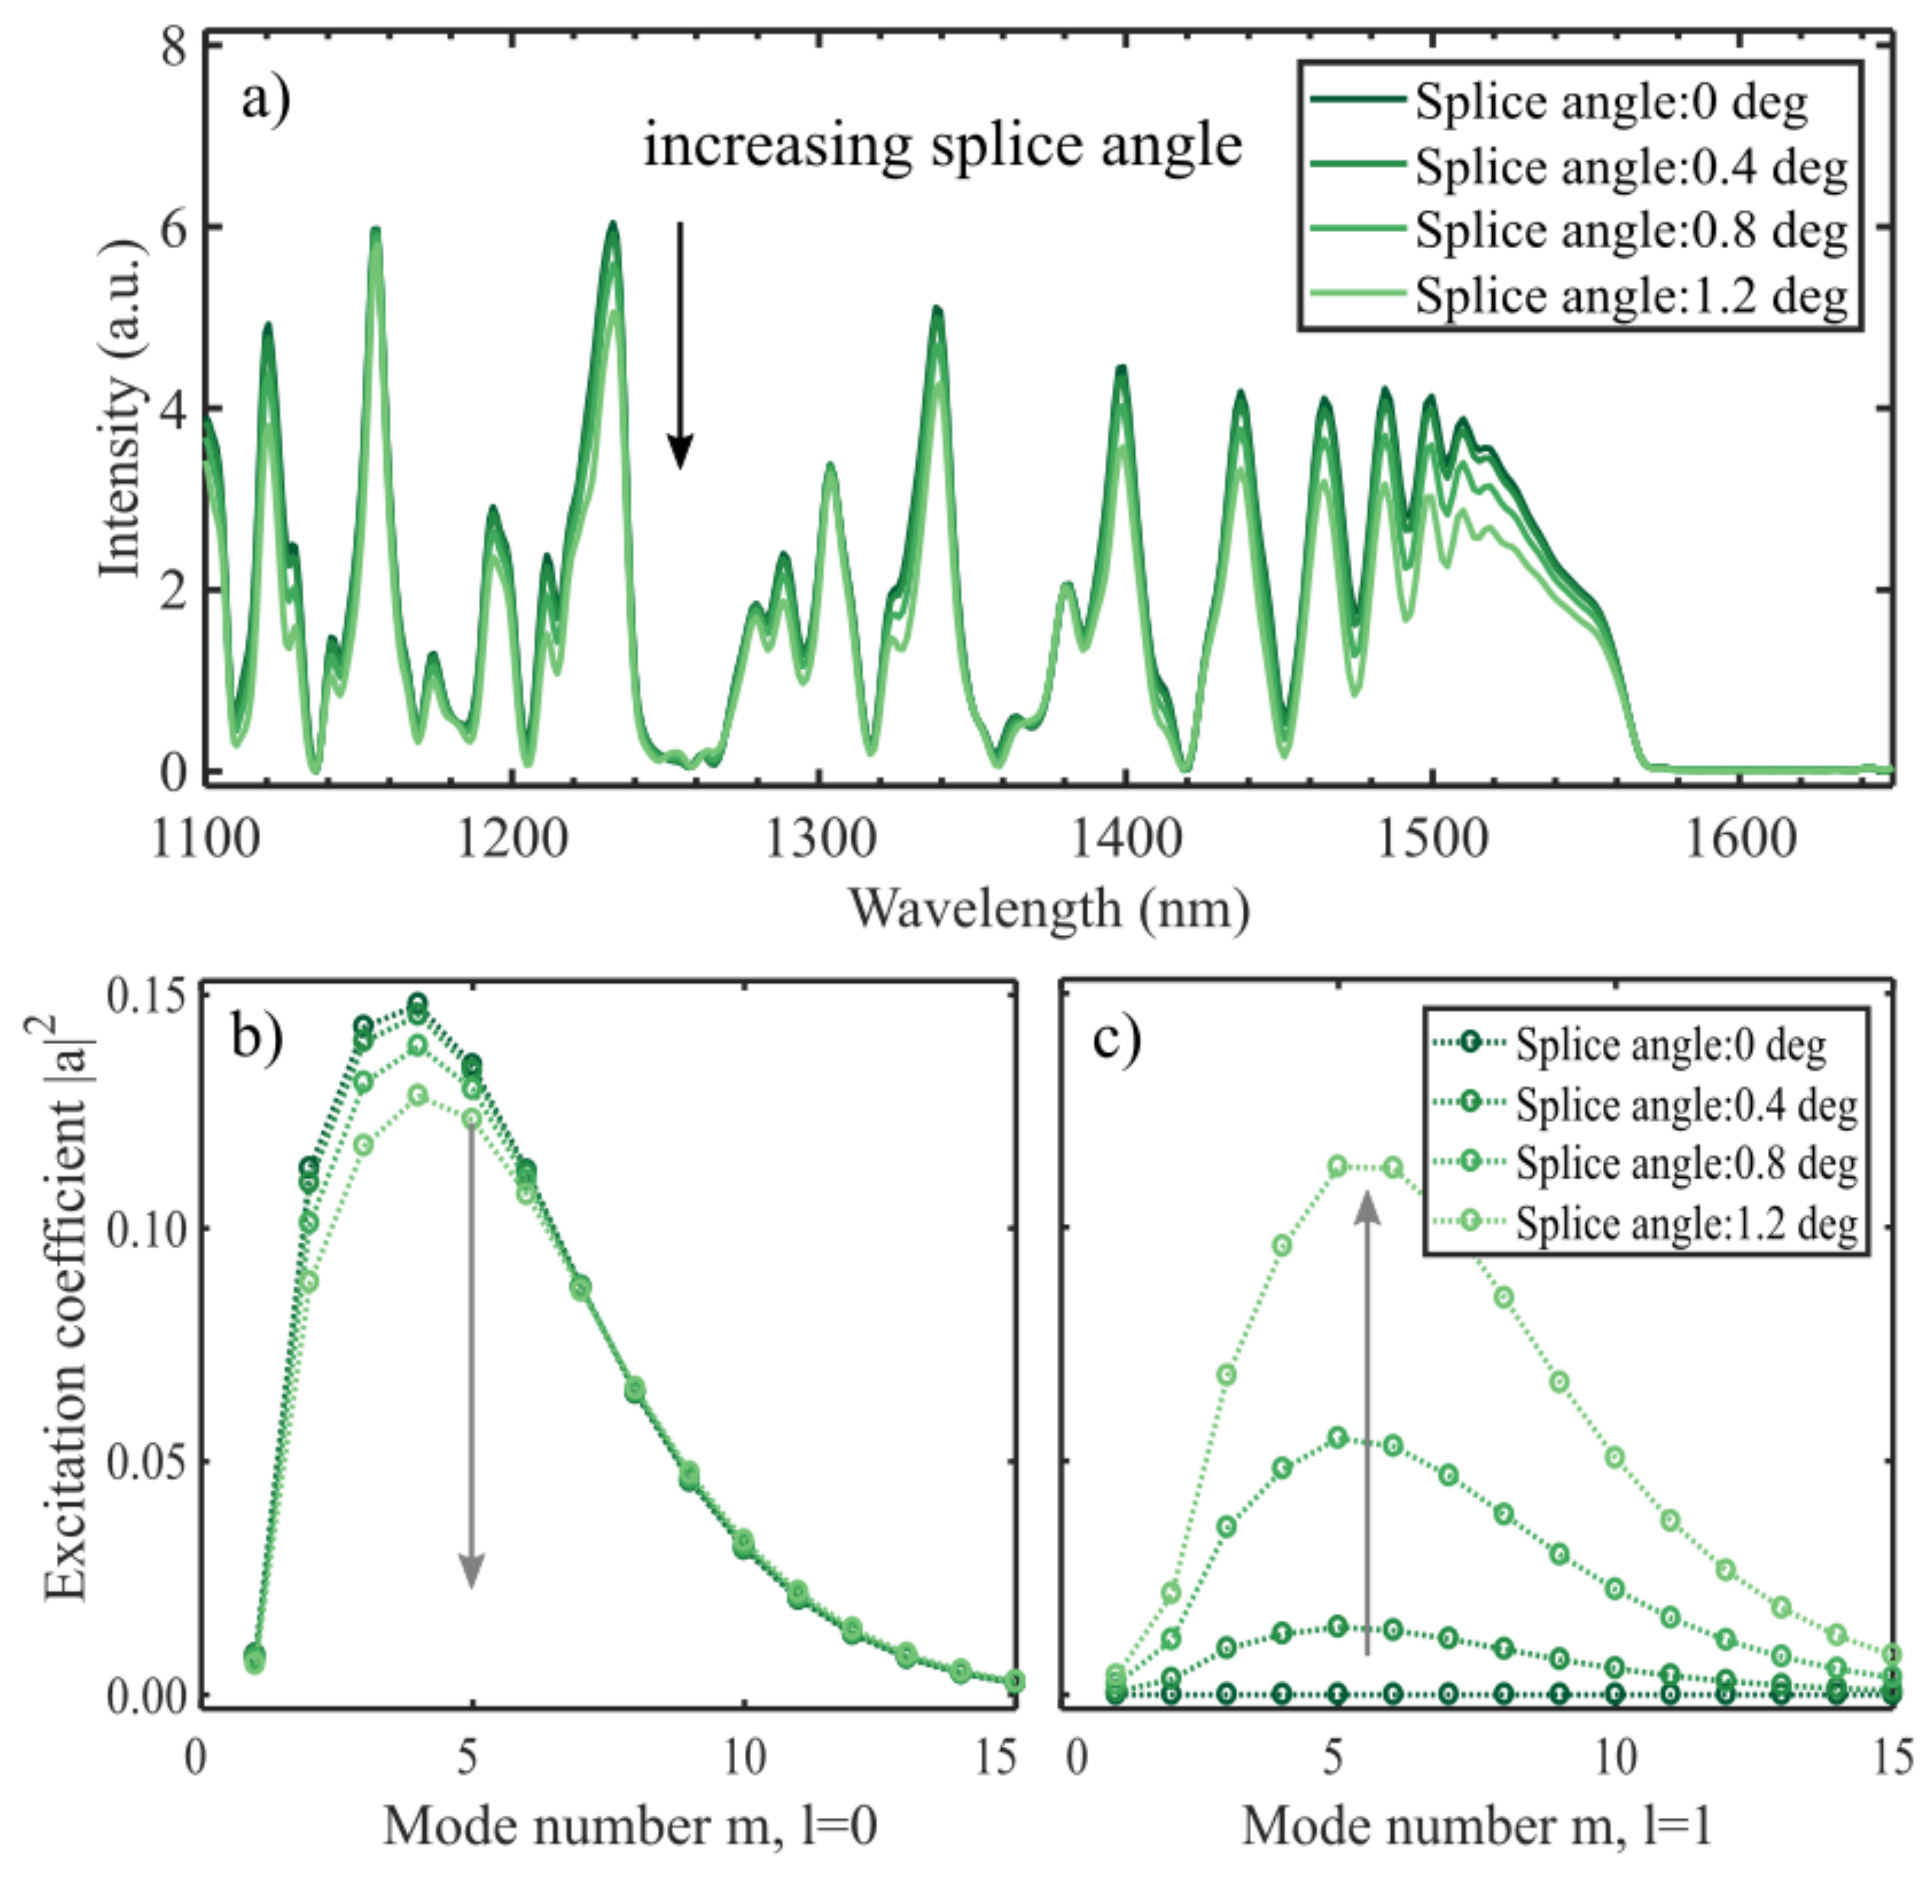
4.4. Splice Angle
5. Discussion
5.1. Comparison of Experiment and Simulations
5.2. The Electromagnetic Vector Model
6. Conclusions
Author Contributions
Funding
Conflicts of Interest
References
- Zhao, N.; Lin, Q.; Jiang, Z.; Yao, K.; Tian, B.; Fang, X.; Shi, P.; Zhang, Z. High Temperature High Sensitivity Multipoint Sensing System Based on Three Cascade Mach–Zehnder Interferometers. Sensors 2018, 18, 2688. [Google Scholar] [CrossRef] [PubMed]
- Tripathi, S.M.; Kumar, A.; Varshney, R.K.; Kumar, Y.B.P.; Marin, E.; Meunier, J.-P. Strain and Temperature Sensing Characteristics of Single-Mode–Multimode–Single-Mode Structures. J. Light. Technol. 2009, 27, 2348–2356. [Google Scholar] [CrossRef]
- Ahsani, V.; Ahmed, F.; Jun, M.; Bradley, C. Tapered Fiber-Optic Mach-Zehnder Interferometer for Ultra-High Sensitivity Measurement of Refractive Index. Sensors 2019, 19, 1652. [Google Scholar] [CrossRef] [PubMed]
- Tian, Z.; Yam, S.S.; Loock, H. Single-Mode Fiber Refractive Index Sensor Based on Core-Offset Attenuators. IEEE Photonics Technol. Lett. 2008, 20, 1387–1389. [Google Scholar] [CrossRef]
- Mohammed, W.S.; Mehta, A.; Johnson, E.G. Wavelength Tunable Fiber Lens Based on Multimode Interference. J. Light. Technol. 2004, 22, 469–477. [Google Scholar] [CrossRef]
- Li, E.; Wang, X.; Zhang, C. Fiber-optic temperature sensor based on interference of selective higher-order modes. Appl. Phys. Lett. 2006, 89, 091119. [Google Scholar] [CrossRef]
- Wang, Y.; Liu, Y.; Zou, F.; Jiang, C.; Mou, C.; Wang, T. Humidity Sensor Based on a Long-Period Fiber Grating Coated with Polymer Composite Film. Sensors 2019, 19, 2263. [Google Scholar] [CrossRef] [PubMed]
- Engholm, M.; Hammarling, K.; Andersson, H.; Sandberg, M.; Nilsson, H.-E. A Bio-Compatible Fiber Optic pH Sensor Based on a Thin Core Interferometric Technique. Photonics 2019, 6, 11. [Google Scholar] [CrossRef]
- Gu, B.; Yin, M.-J.; Zhang, A.P.; Qian, J.-W.; He, S. Low-cost high-performance fiber-optic pH sensor based on thin-core fiber modal interferometer. Opt. Express 2009, 17, 22296. [Google Scholar] [CrossRef]
- Zhu, T.; Wu, D.; Liu, M.; Duan, D.-W. In-Line Fiber Optic Interferometric Sensors in Single-Mode Fibers. Sensors 2012, 12, 10430–10449. [Google Scholar] [CrossRef]
- Lee, B.H.; Kim, Y.H.; Park, K.S.; Eom, J.B.; Kim, M.J.; Rho, B.S.; Choi, H.Y. Interferometric Fiber Optic Sensors. Sensors 2012, 12, 2467–2486. [Google Scholar] [CrossRef] [PubMed]
- Wang, Q.; Farrell, G.; Yan, W. Investigation on Single-Mode–Multimode– Single-Mode Fiber Structure. J. Light. Technol. 2008, 26, 512–519. [Google Scholar] [CrossRef]
- Ivanov, O.V. Fibre-optic interferometer formed by a section of small-core fibre spliced between standard fibres. Opt. Commun. 2009, 282, 3895–3898. [Google Scholar] [CrossRef]
- Zhang, Y.; Zhou, A.; Qin, B.; Deng, H.; Liu, Z.; Yang, J.; Yuan, L. Refractive Index Sensing Characteristics of Single-Mode Fiber-Based Modal Interferometers. J. Light. Technol. 2014, 32, 1734–1740. [Google Scholar] [CrossRef]
- Wu, Q.; Semenova, Y.; Wang, P.; Farrell, G. A comprehensive analysis verified by experiment of a refractometer based on an SMF28–small-core singlemode fiber (SCSMF)–SMF28 fiber structure. J. Opt. 2011, 13, 125401. [Google Scholar] [CrossRef]
- Xiong, R.; Meng, H.; Yao, Q.; Huang, B.; Liu, Y.; Xue, H.; Tan, C.; Huang, X. Simultaneous Measurement of Refractive Index and Temperature Based on Modal Interference. IEEE Sens. J. 2014, 14, 2524–2528. [Google Scholar] [CrossRef]
- Li, L.; Xia, L.; Xie, Z.; Hao, L.; Shuai, B.; Liu, D. In-line fiber Mach–Zehnder interferometer for simultaneous measurement of refractive index and temperature based on thinned fiber. Sens. Actuators A Phys. 2012, 180, 19–24. [Google Scholar] [CrossRef]
- Nguyen, L.V.; Hwang, D.; Moon, S.; Moon, D.S.; Chung, Y. High temperature fiber sensor with high sensitivity based on core diameter mismatch. Opt. Express 2008, 16, 11369. [Google Scholar] [CrossRef]
- Wu, Q.; Semenova, Y.; Wang, P.; Farrell, G. High sensitivity SMS fiber structure based refractometer—Analysis and experiment. Opt. Express 2011, 19, 7937. [Google Scholar] [CrossRef]
- Wei, T.; Lan, X.; Xiao, H. Fiber Inline Core–Cladding-Mode Mach–Zehnder Interferometer Fabricated by Two-Point CO2 Laser Irradiations. IEEE Photonics Technol. Lett. 2009, 21, 669–671. [Google Scholar]
- Liu, Y.; Wei, L. Low-cost high-sensitivity strain and temperature sensing using graded-index multimode fibers. Appl. Opt. 2007, 46, 2516. [Google Scholar] [CrossRef] [PubMed]
- AFL CT-101 and CT-102 Fiber Cleavers. Available online: https://www.aflglobal.com/productlist/Product-Lines/Fusion-Splicing-Systems/CT-101-and-CT-102-Fiber-Cleavers/doc/CT-101-102.aspx (accessed on 21 January 2019).
- Zhou, G.; Wu, Q.; Kumar, R.; Ng, W.P.; Liu, H.; Niu, L.; Lalam, N.; Yuan, X.; Semenova, Y.; Farrell, G.; et al. High Sensitivity Refractometer Based on Reflective Smf-Small Diameter No Core Fiber Structure. Sensors 2017, 17, 1415. [Google Scholar] [CrossRef]
- Zhou, X.; Chen, K.; Mao, X.; Peng, W.; Yu, Q. A reflective fiber-optic refractive index sensor based on multimode interference in a coreless silica fiber. Opt. Commun. 2015, 340, 50–55. [Google Scholar] [CrossRef]
- Saito, Y.; Wang, J.J.; Smith, D.A.; Batchelder, D.N. A Simple Chemical Method for the Preparation of Silver Surfaces for Efficient SERS. Langmuir 2002, 18, 2959–2961. [Google Scholar] [CrossRef]
- Malitson, I.H. Interspecimen Comparison of the Refractive Index of Fused Silica. J. Opt. Soc. Am. 1965, 55, 1205. [Google Scholar] [CrossRef]
- Snyder, A.W.; Love, J.D. Optical Waveguide Theory; Chapman and Hall: London, UK, 1983; ISBN 0-412-24250-8. [Google Scholar]
- Adler, R. Waves on inhomogeneous cylindrical structures. Proc. IRE 1952, 40, 339–348. [Google Scholar] [CrossRef]
- Xia, T.-H.; Zhang, A.P.; Gu, B.; Zhu, J.-J. Fiber-optic refractive-index sensors based on transmissive and reflective thin-core fiber modal interferometers. Opt. Commun. 2010, 283, 2136–2139. [Google Scholar] [CrossRef]


| SMF | Coreless | |
|---|---|---|
| Core diameter (µm) | 8.2 | |
| Cladding diameter (µm) | 125 | 125 |
| 1.4504 | ||
| 1.4447 | 1.4447 | |
| 1.33 | 1.33 |
| 0 Deg. Angle | 0.2 Deg. Angle | 0.3 Deg. Angle | 1.6 µm Offset |
|---|---|---|---|
| 65.5 nm/RIU | 65.6 nm/RIU | 65.7 nm/RIU | 65.6 nm/RIU |
© 2019 by the authors. Licensee MDPI, Basel, Switzerland. This article is an open access article distributed under the terms and conditions of the Creative Commons Attribution (CC BY) license (http://creativecommons.org/licenses/by/4.0/).
Share and Cite
Wahl, M.S.; Wilhelmsen, Ø.; Hjelme, D.R. Addressing Challenges in Fabricating Reflection-Based Fiber Optic Interferometers. Sensors 2019, 19, 4030. https://doi.org/10.3390/s19184030
Wahl MS, Wilhelmsen Ø, Hjelme DR. Addressing Challenges in Fabricating Reflection-Based Fiber Optic Interferometers. Sensors. 2019; 19(18):4030. https://doi.org/10.3390/s19184030
Chicago/Turabian StyleWahl, Markus Solberg, Øivind Wilhelmsen, and Dag Roar Hjelme. 2019. "Addressing Challenges in Fabricating Reflection-Based Fiber Optic Interferometers" Sensors 19, no. 18: 4030. https://doi.org/10.3390/s19184030
APA StyleWahl, M. S., Wilhelmsen, Ø., & Hjelme, D. R. (2019). Addressing Challenges in Fabricating Reflection-Based Fiber Optic Interferometers. Sensors, 19(18), 4030. https://doi.org/10.3390/s19184030