Parallel Computing for Quantitative Blood Flow Imaging in Photoacoustic Microscopy


Abstract
1. Introduction
2. Blood Flow Measurement Principle
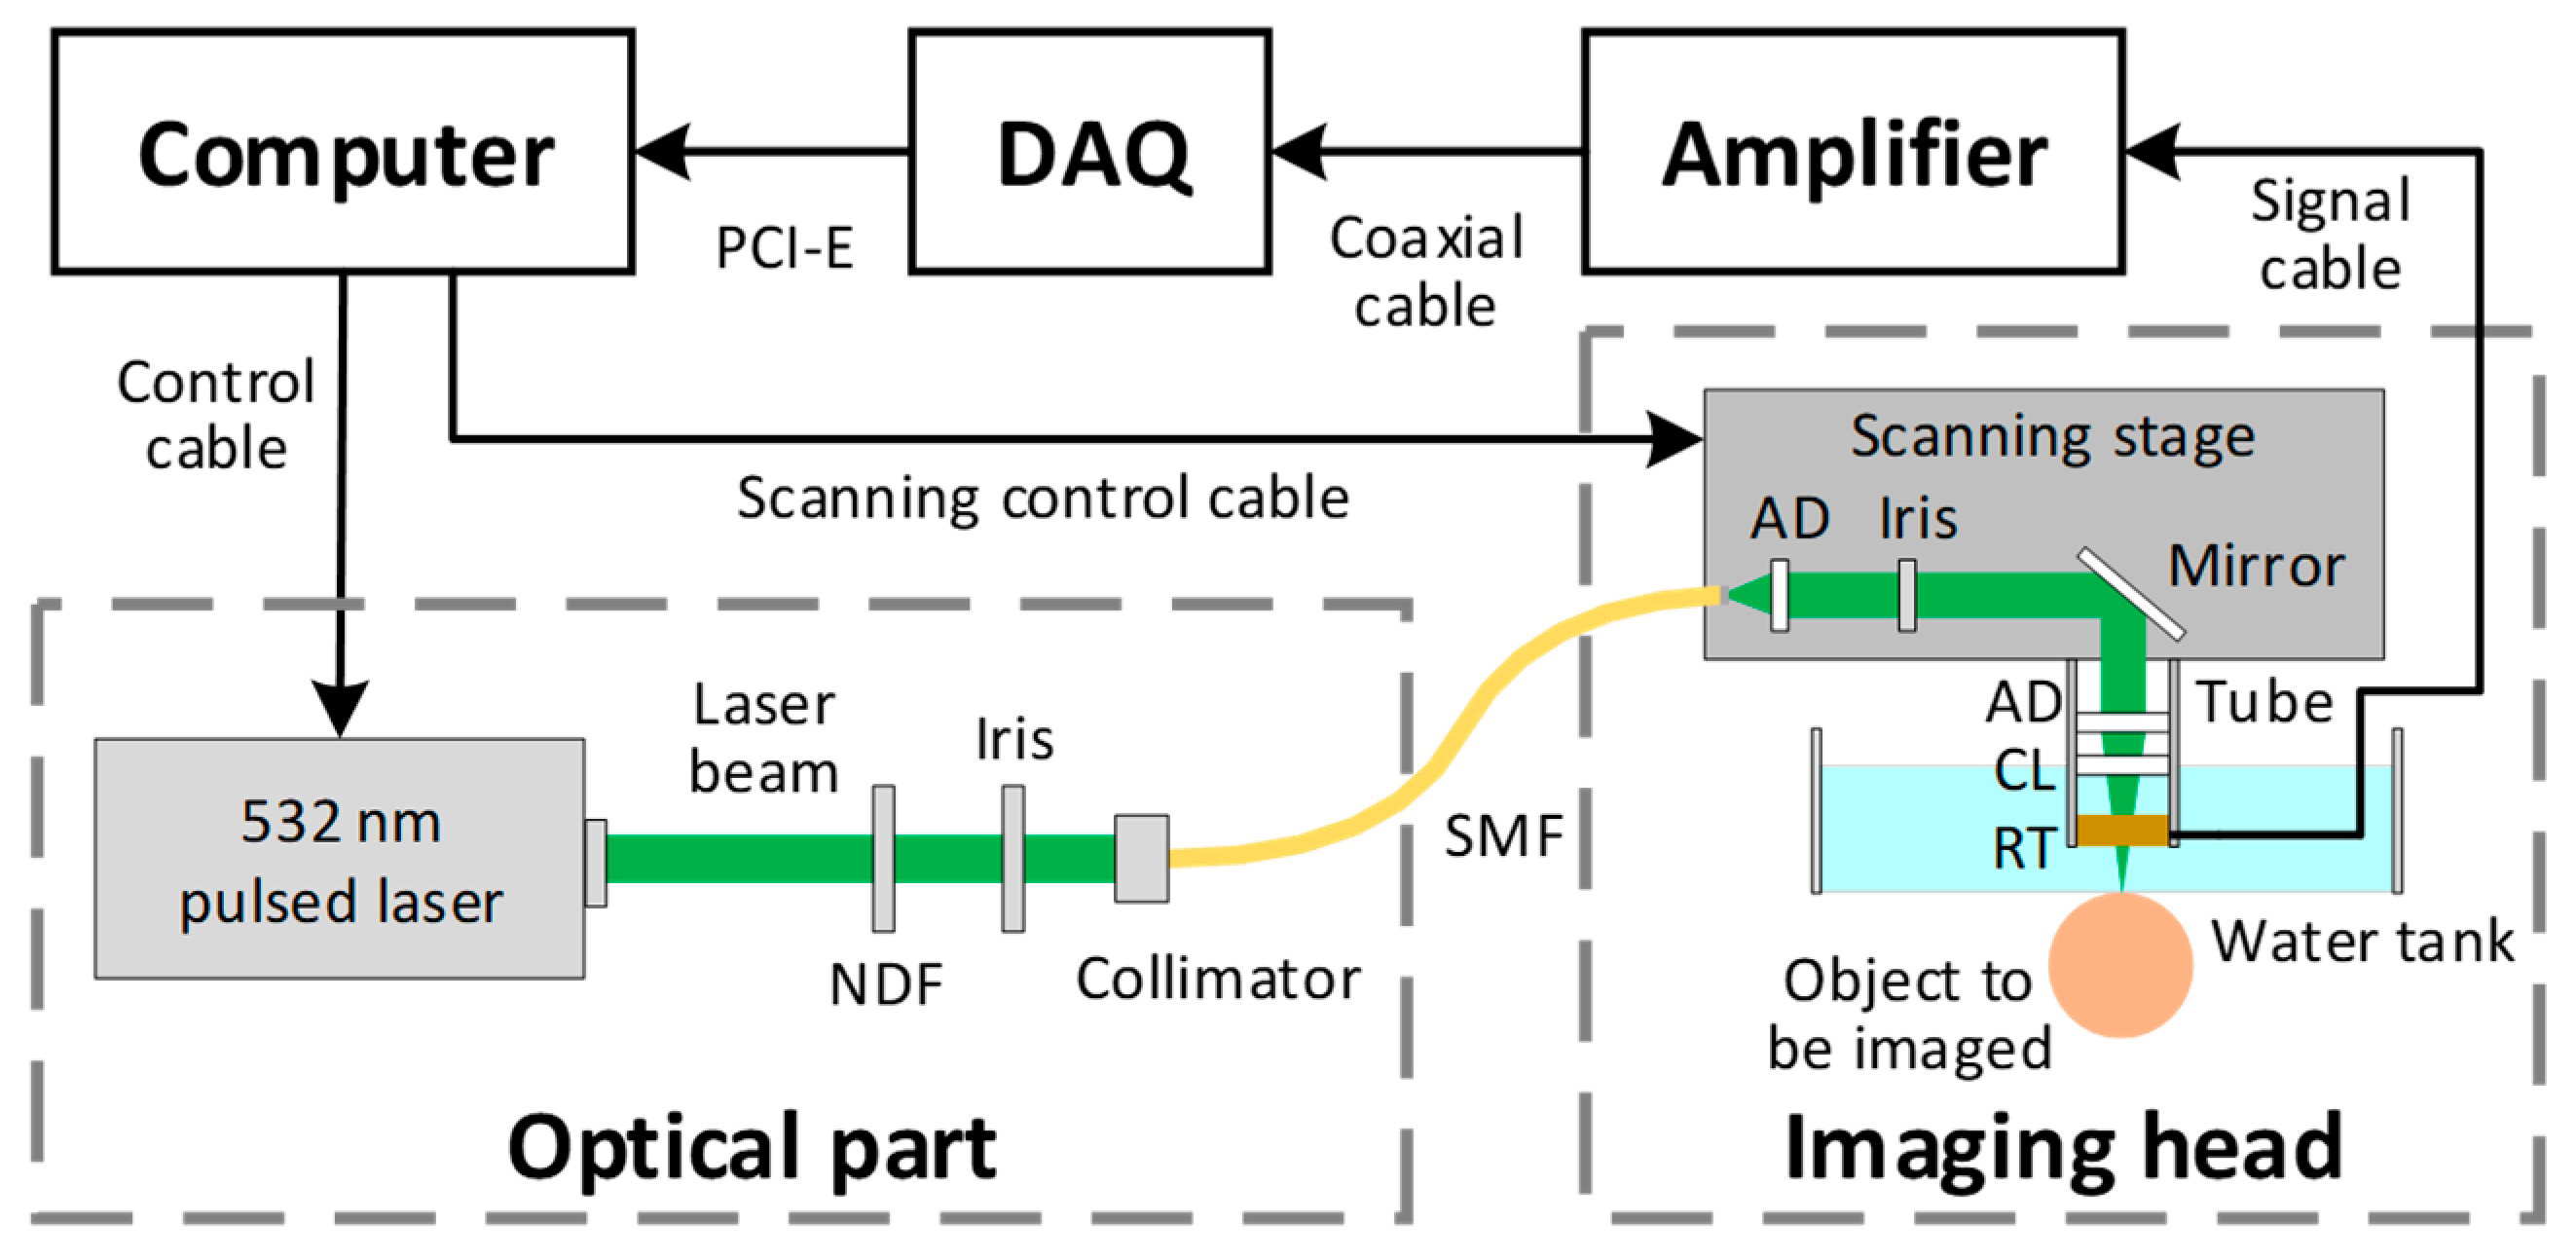
2.1. Imaging System
2.2. Measurement Principle
2.3. Animal Experiment
3. Algorithm Analysis and Parallel Design
3.1. Algorithm Analysis
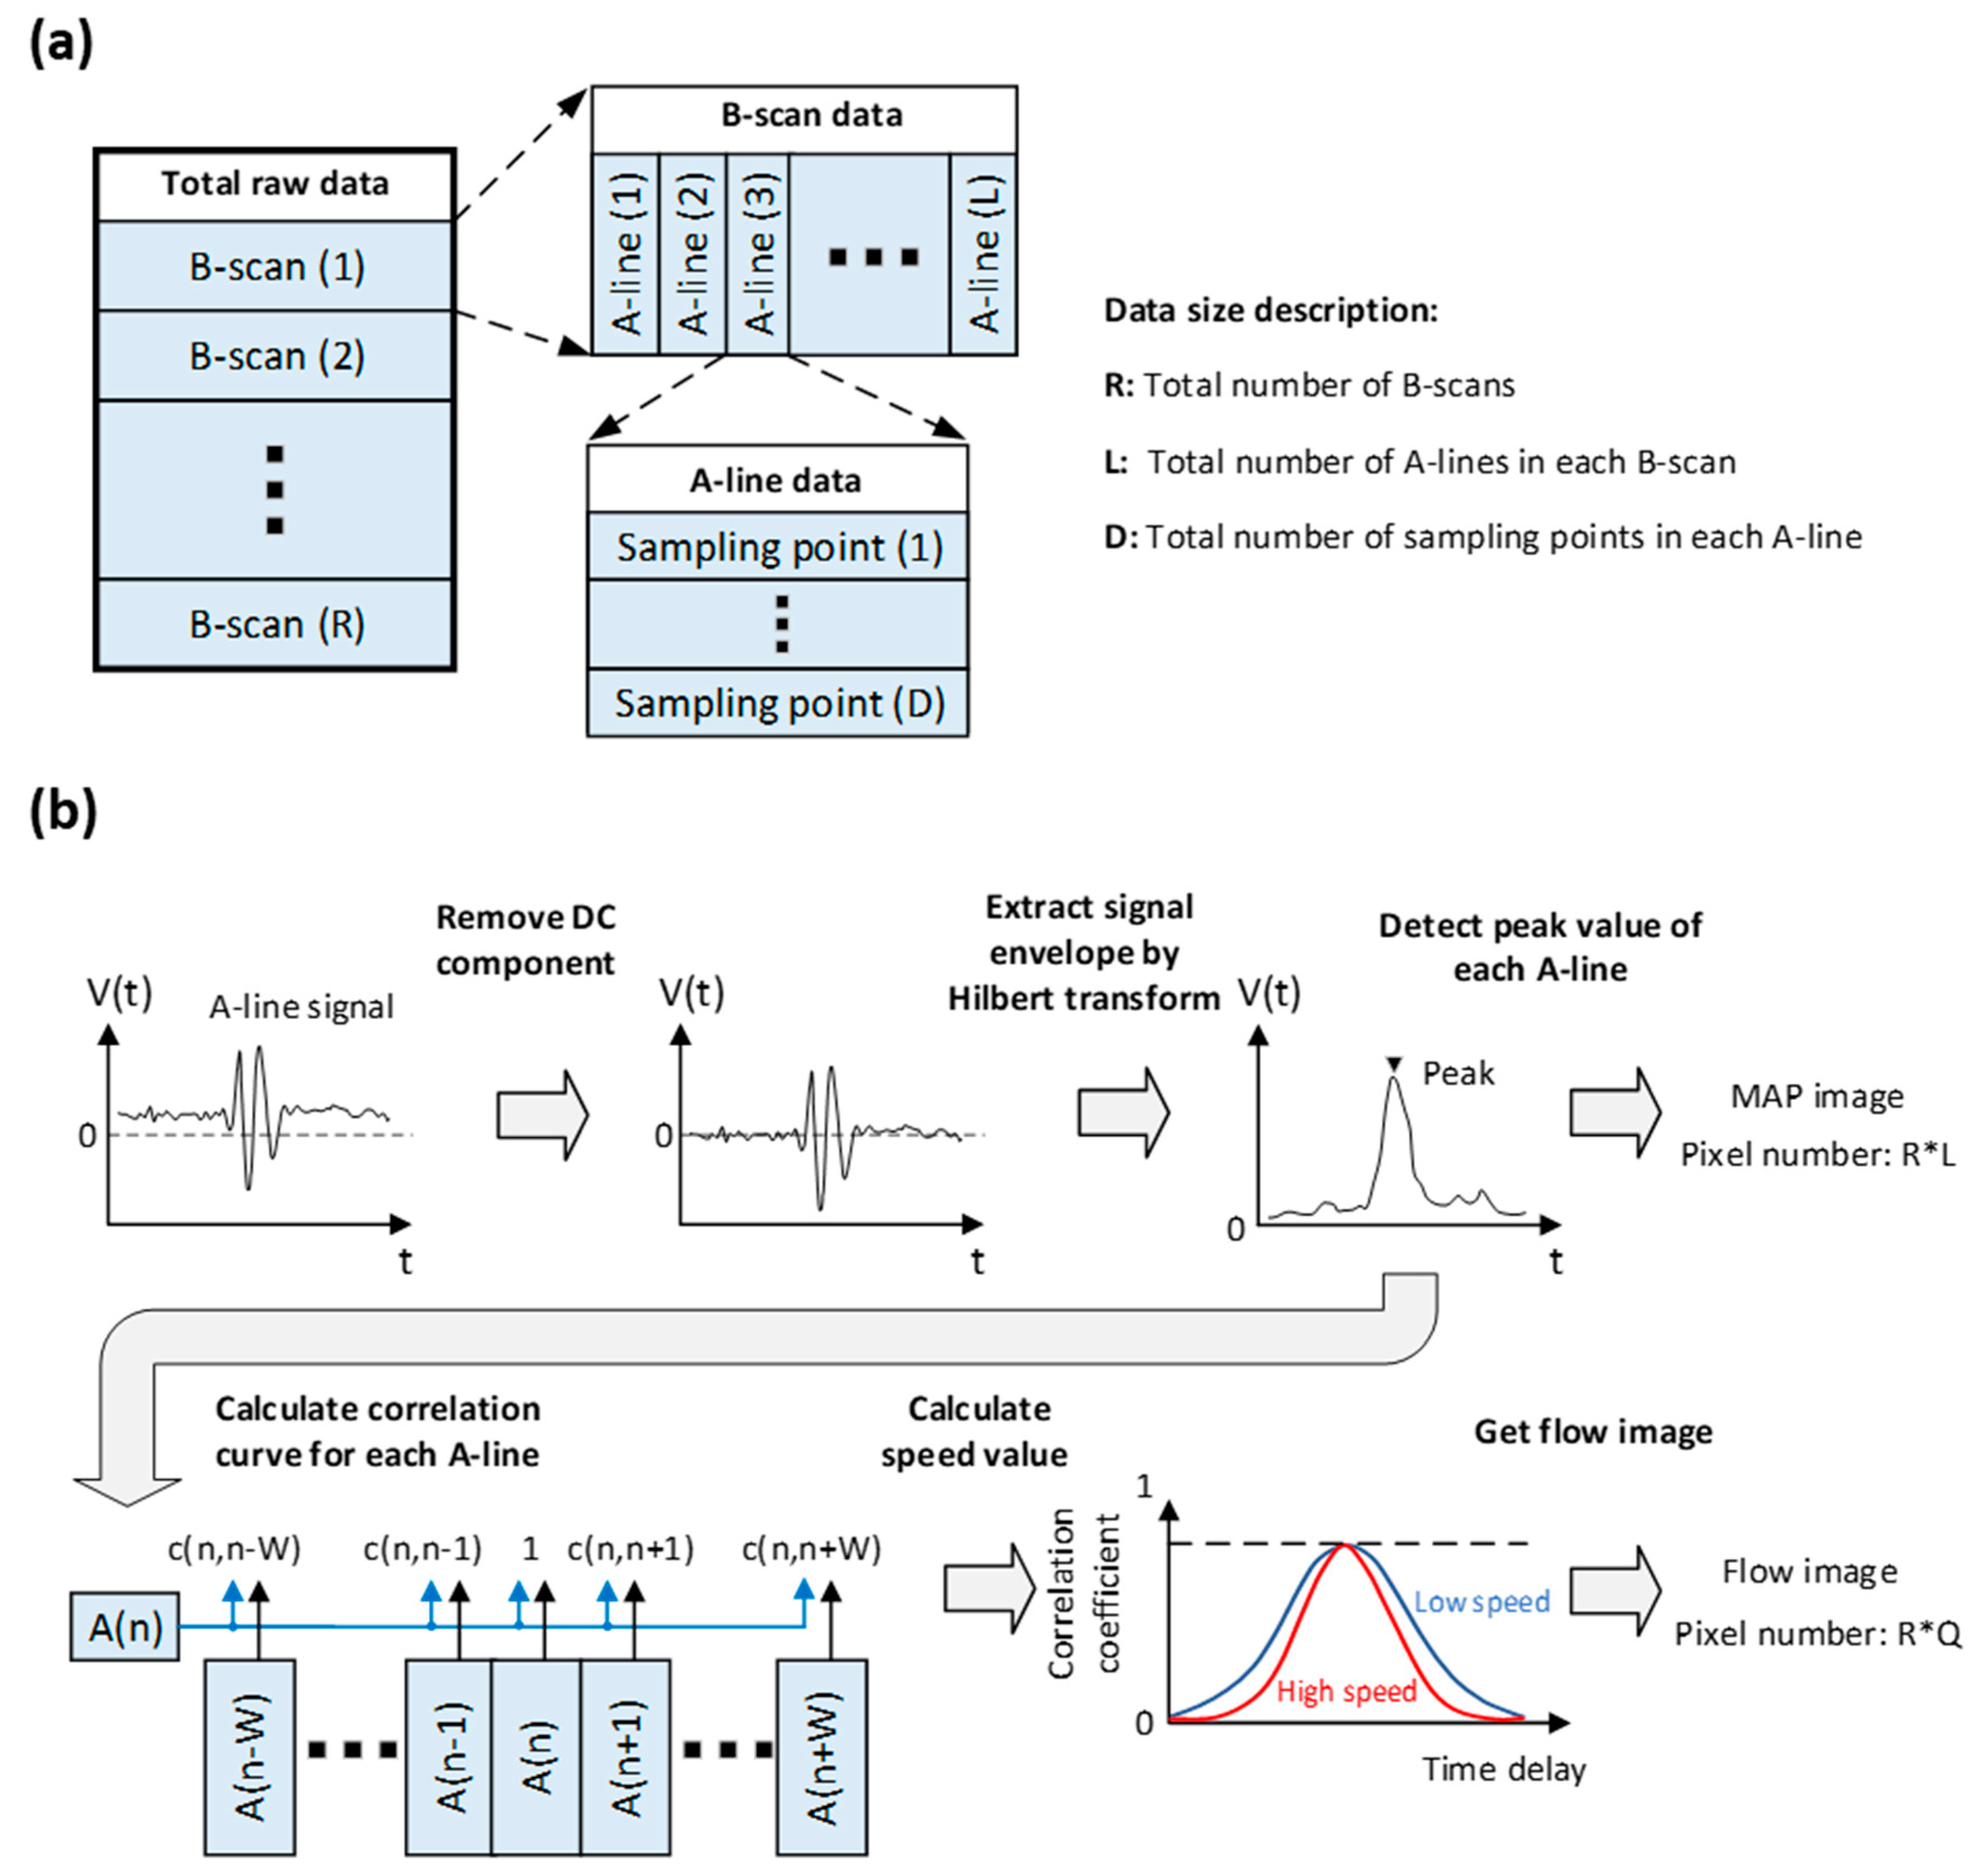
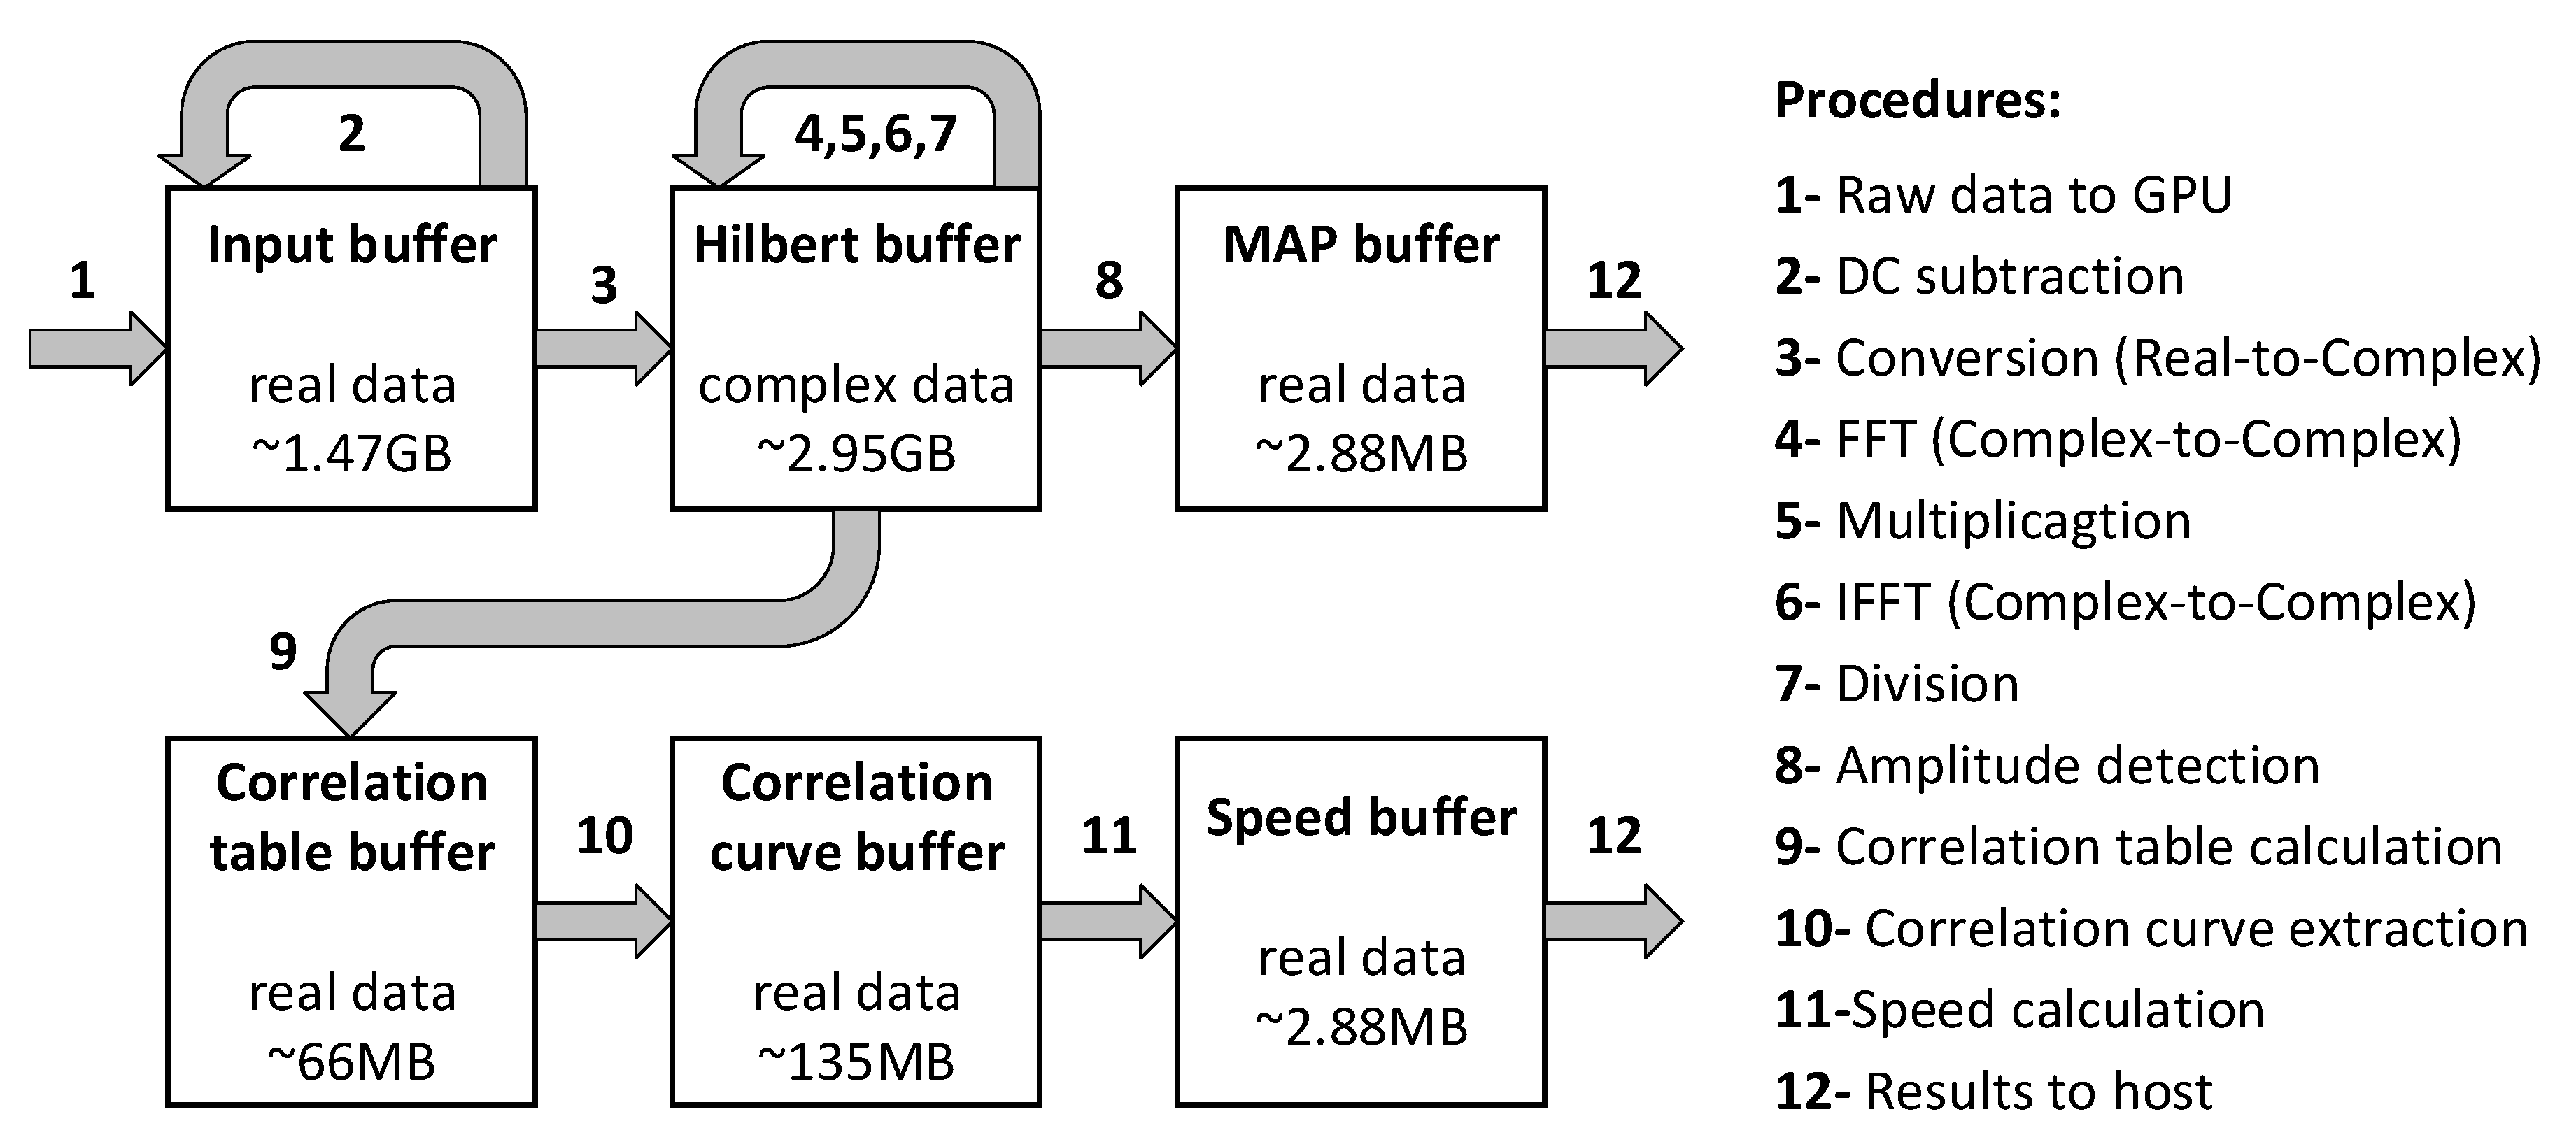
- Read the raw experiment data from the hard disk. As shown in Figure 3a, the number of B-scans in the raw data is marked as R, the number of A-lines in each B-scan is marked as L, and the number of sampling points in each A-line is marked as D, which is even. Each sampling point is a 2-byte integer. For this specific example, R, L and D are 100, 7200 and 512, respectively. Thus, the raw data size is ~737.28 MB.
- Remove the direct current (DC) component of the raw A-line signal. The DC component is a constant value and remains the same for all the A-line signals. It is obtained before the experiment and subtracted from all sampling points at the beginning of the algorithm. For this specific example, the total number of sampling point is 3.69 × 10⁸.
- Extract the signal envelope by Hilbert-transforming the A-line signal. Specifically, the original A-line data is firstly transformed by FFT. Then, the Fourier-transformed signal is multiplied by H(n) as follows:The multiplied signal is then converted back to the time domain via the inverse-FFT [24]. The total number of A-line is marked as N. For this specific example, N equals 7.2 × 10⁵.
- Detect the amplitude of the A-line signal. The peak value of the A-line signal is detected to form a MAP image, which is used to show the vascular structure in the region of interest. Each peak value is a 4-byte float data. For this specific example, the data size of the MAP image is ~2.88 MB.
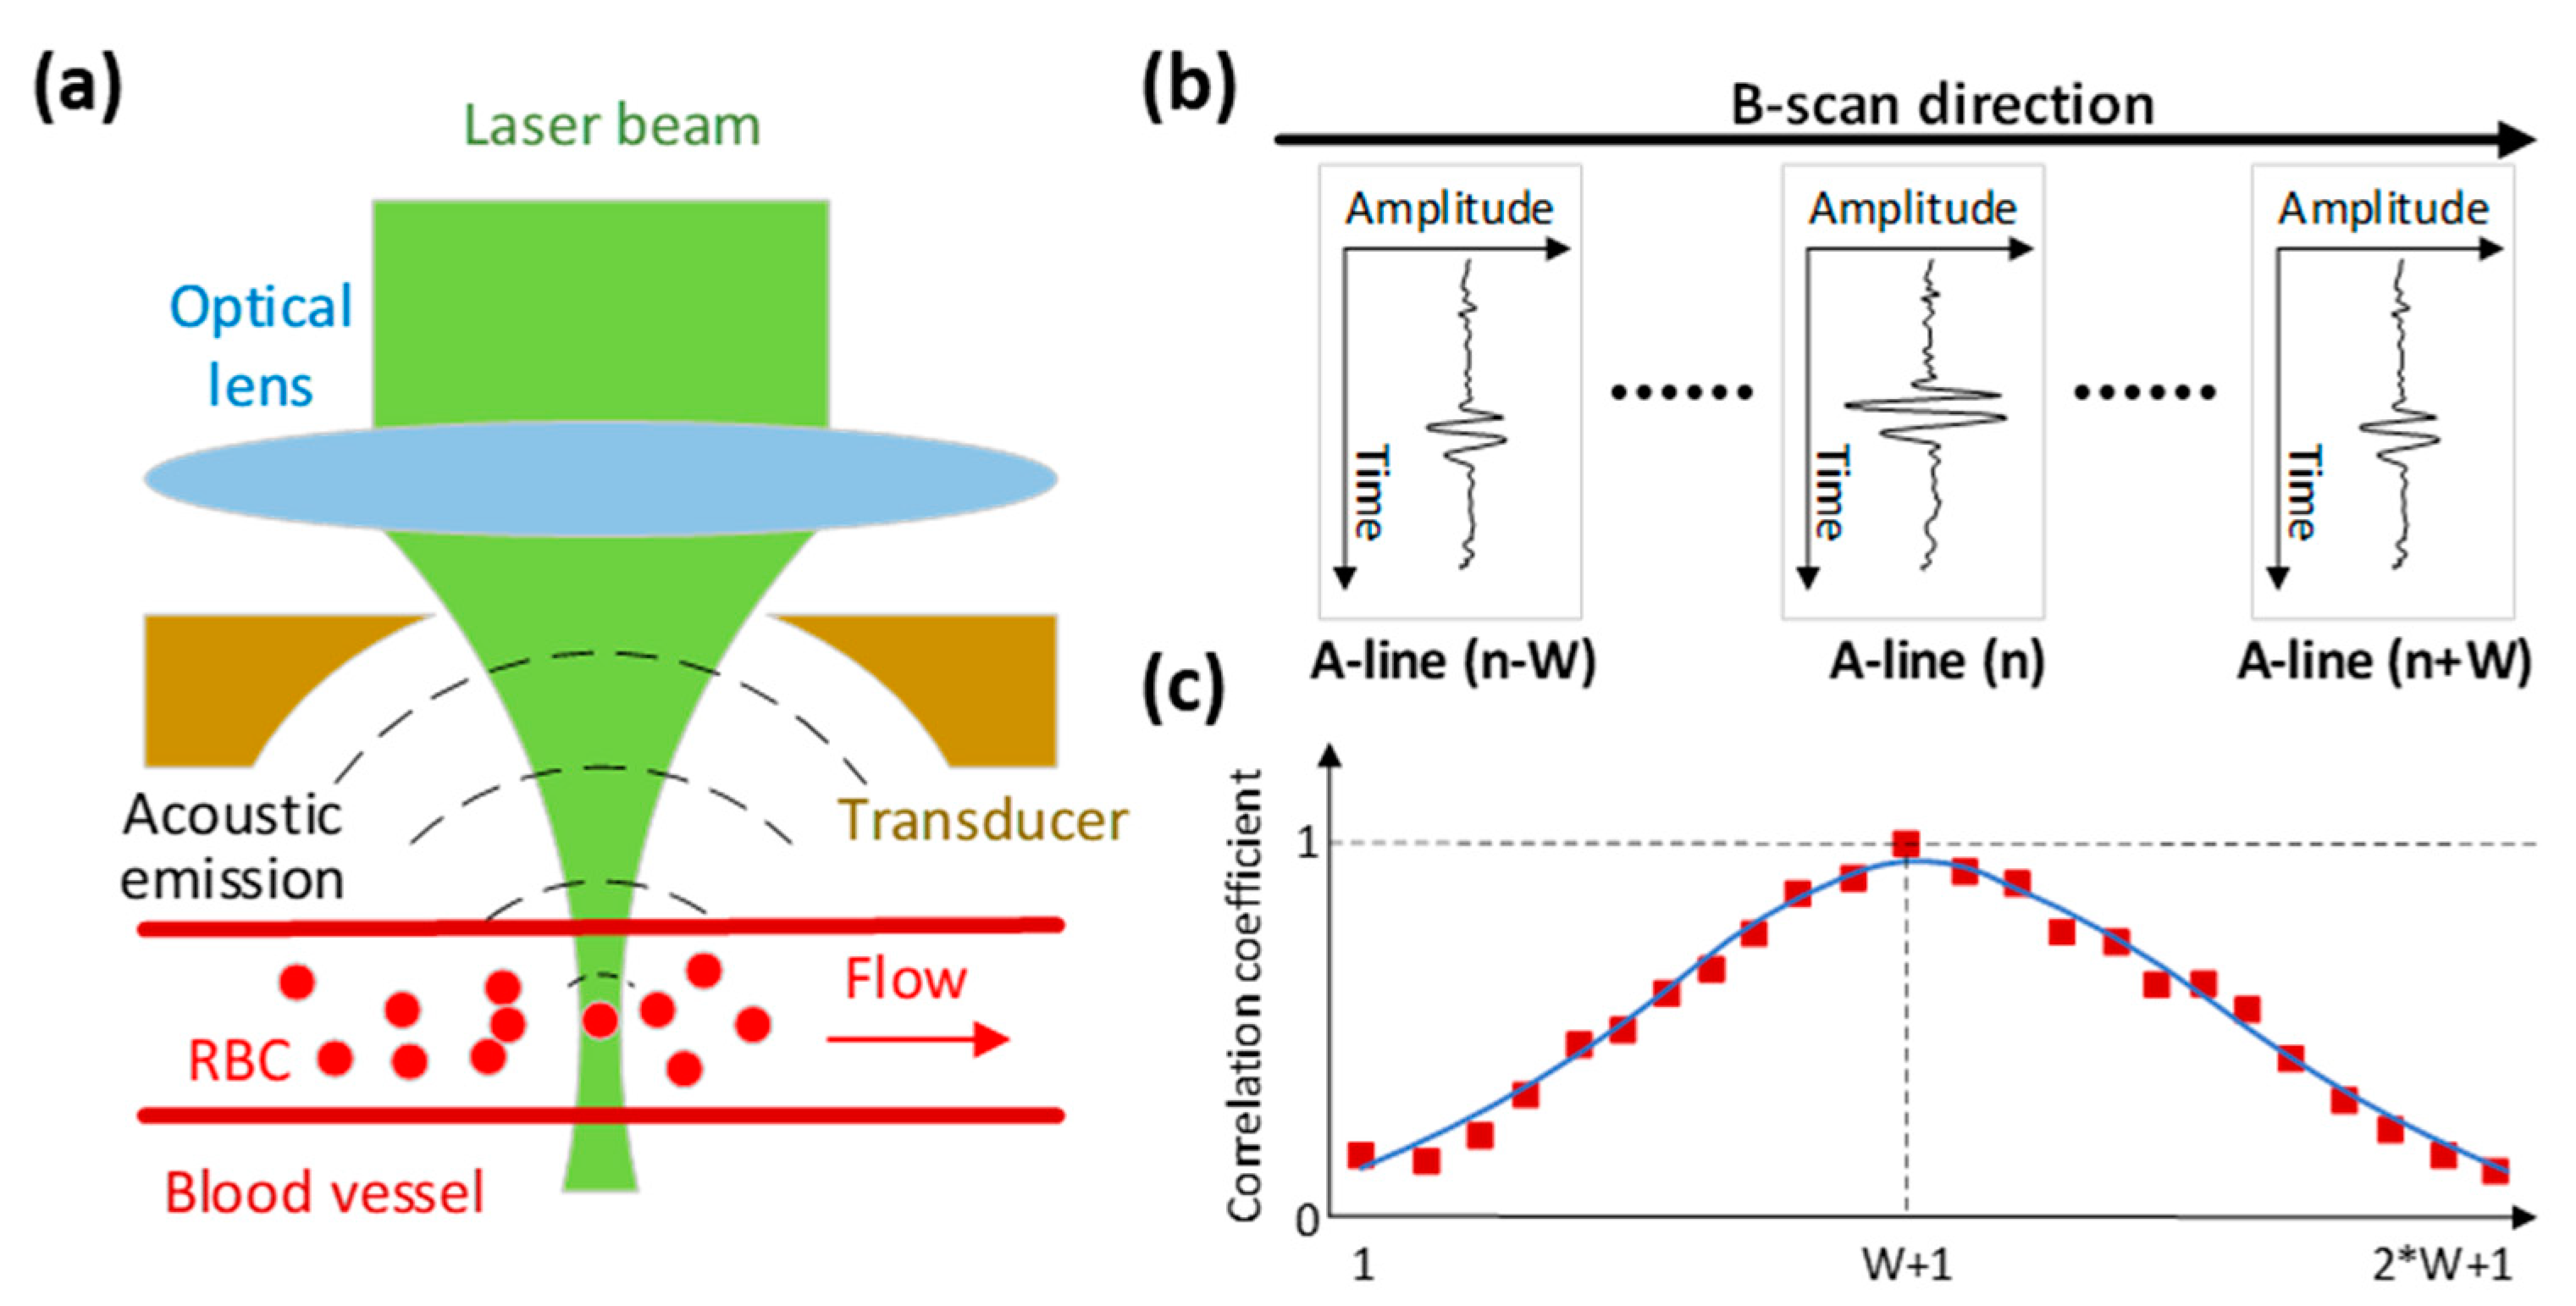
- Calculate the correlation curve. As shown in Figure 3b, for a specific A-line (denoted as A(n)), the correlation curve that consists of a fixed number of points (denoted as c(j,k)) is obtained by correlating itself with the adjacent A-lines. In a B-scan, the total number of correlation curves is denoted as Q. For the first and last W A-lines of each B-scan, a full correlation curve cannot be obtained. As a result, Q equals . For this specific example, W is set to 23 and the total number of correlation curves is 7.154 × 10⁵.
- Calculate the flow speed. Least square method is applied to fit the correlation curve and extract the decay constant, from which the flow speed is derived. As shown in Figure 3b, the faster the decay of the correlation curve, the higher the blood flow speed. The decay constant is linearly proportional to the flow speed and the relationship is calibrated with a phantom [15] before the in vivo experiment. After extracting the flow speed value from each of the correlation curve, the blood flow image can be generated. Each flow speed value is a 4-byte float data. For this specific example, the data size of the flow image is ~2.88 MB.
- Save MAP and flow images to the hard disk.
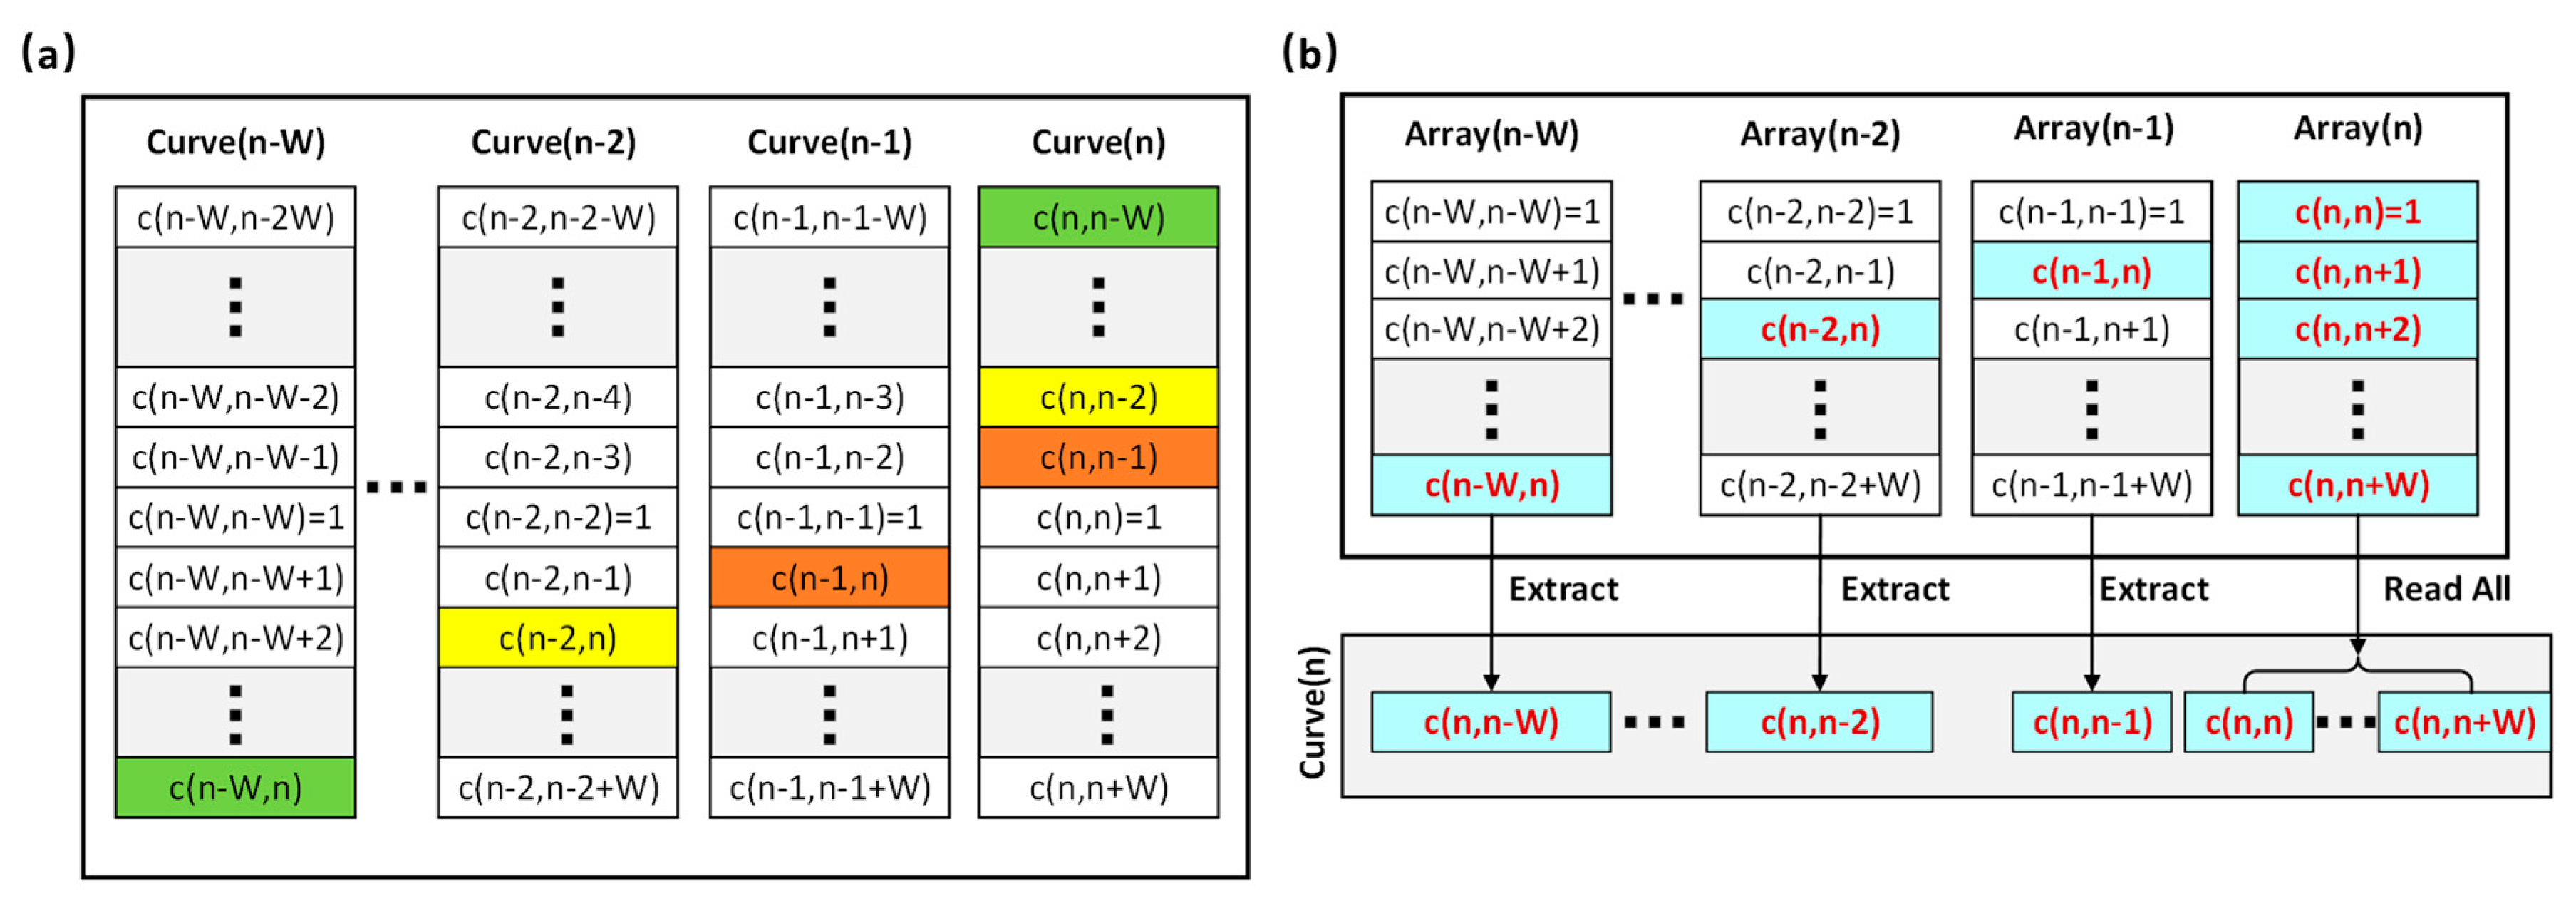
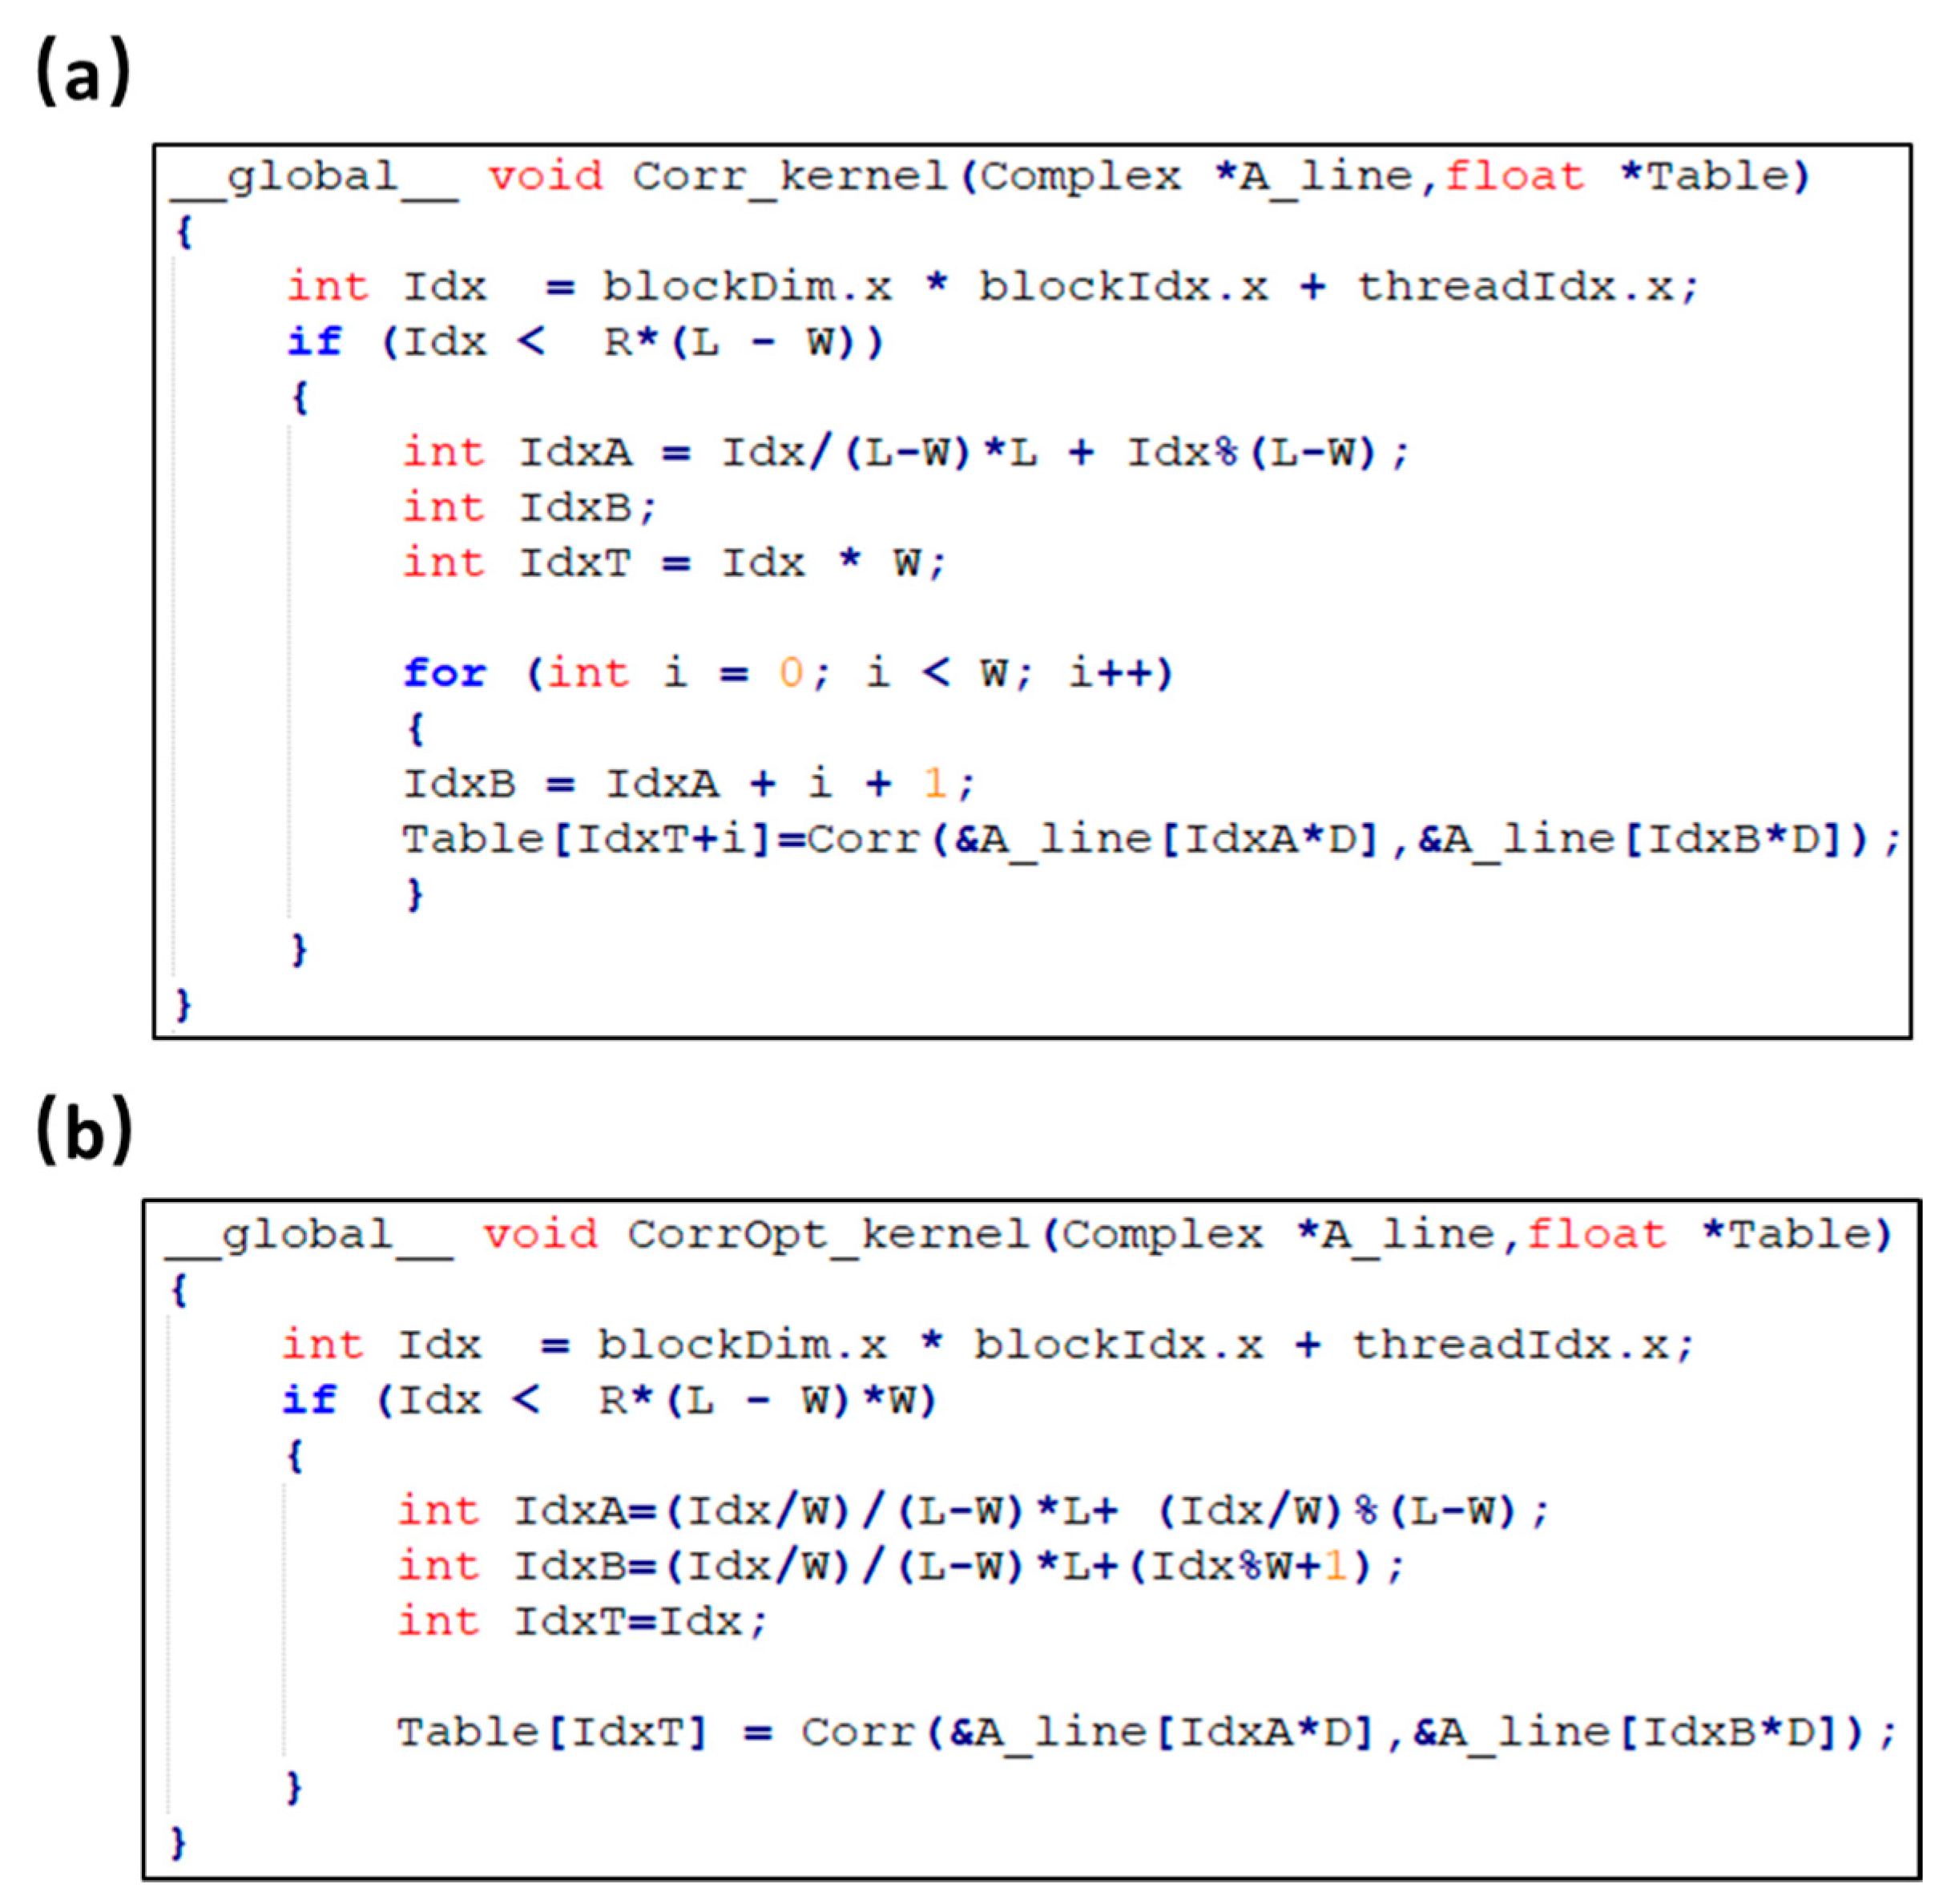
3.2. Optimization of Correlation Curve Calculation
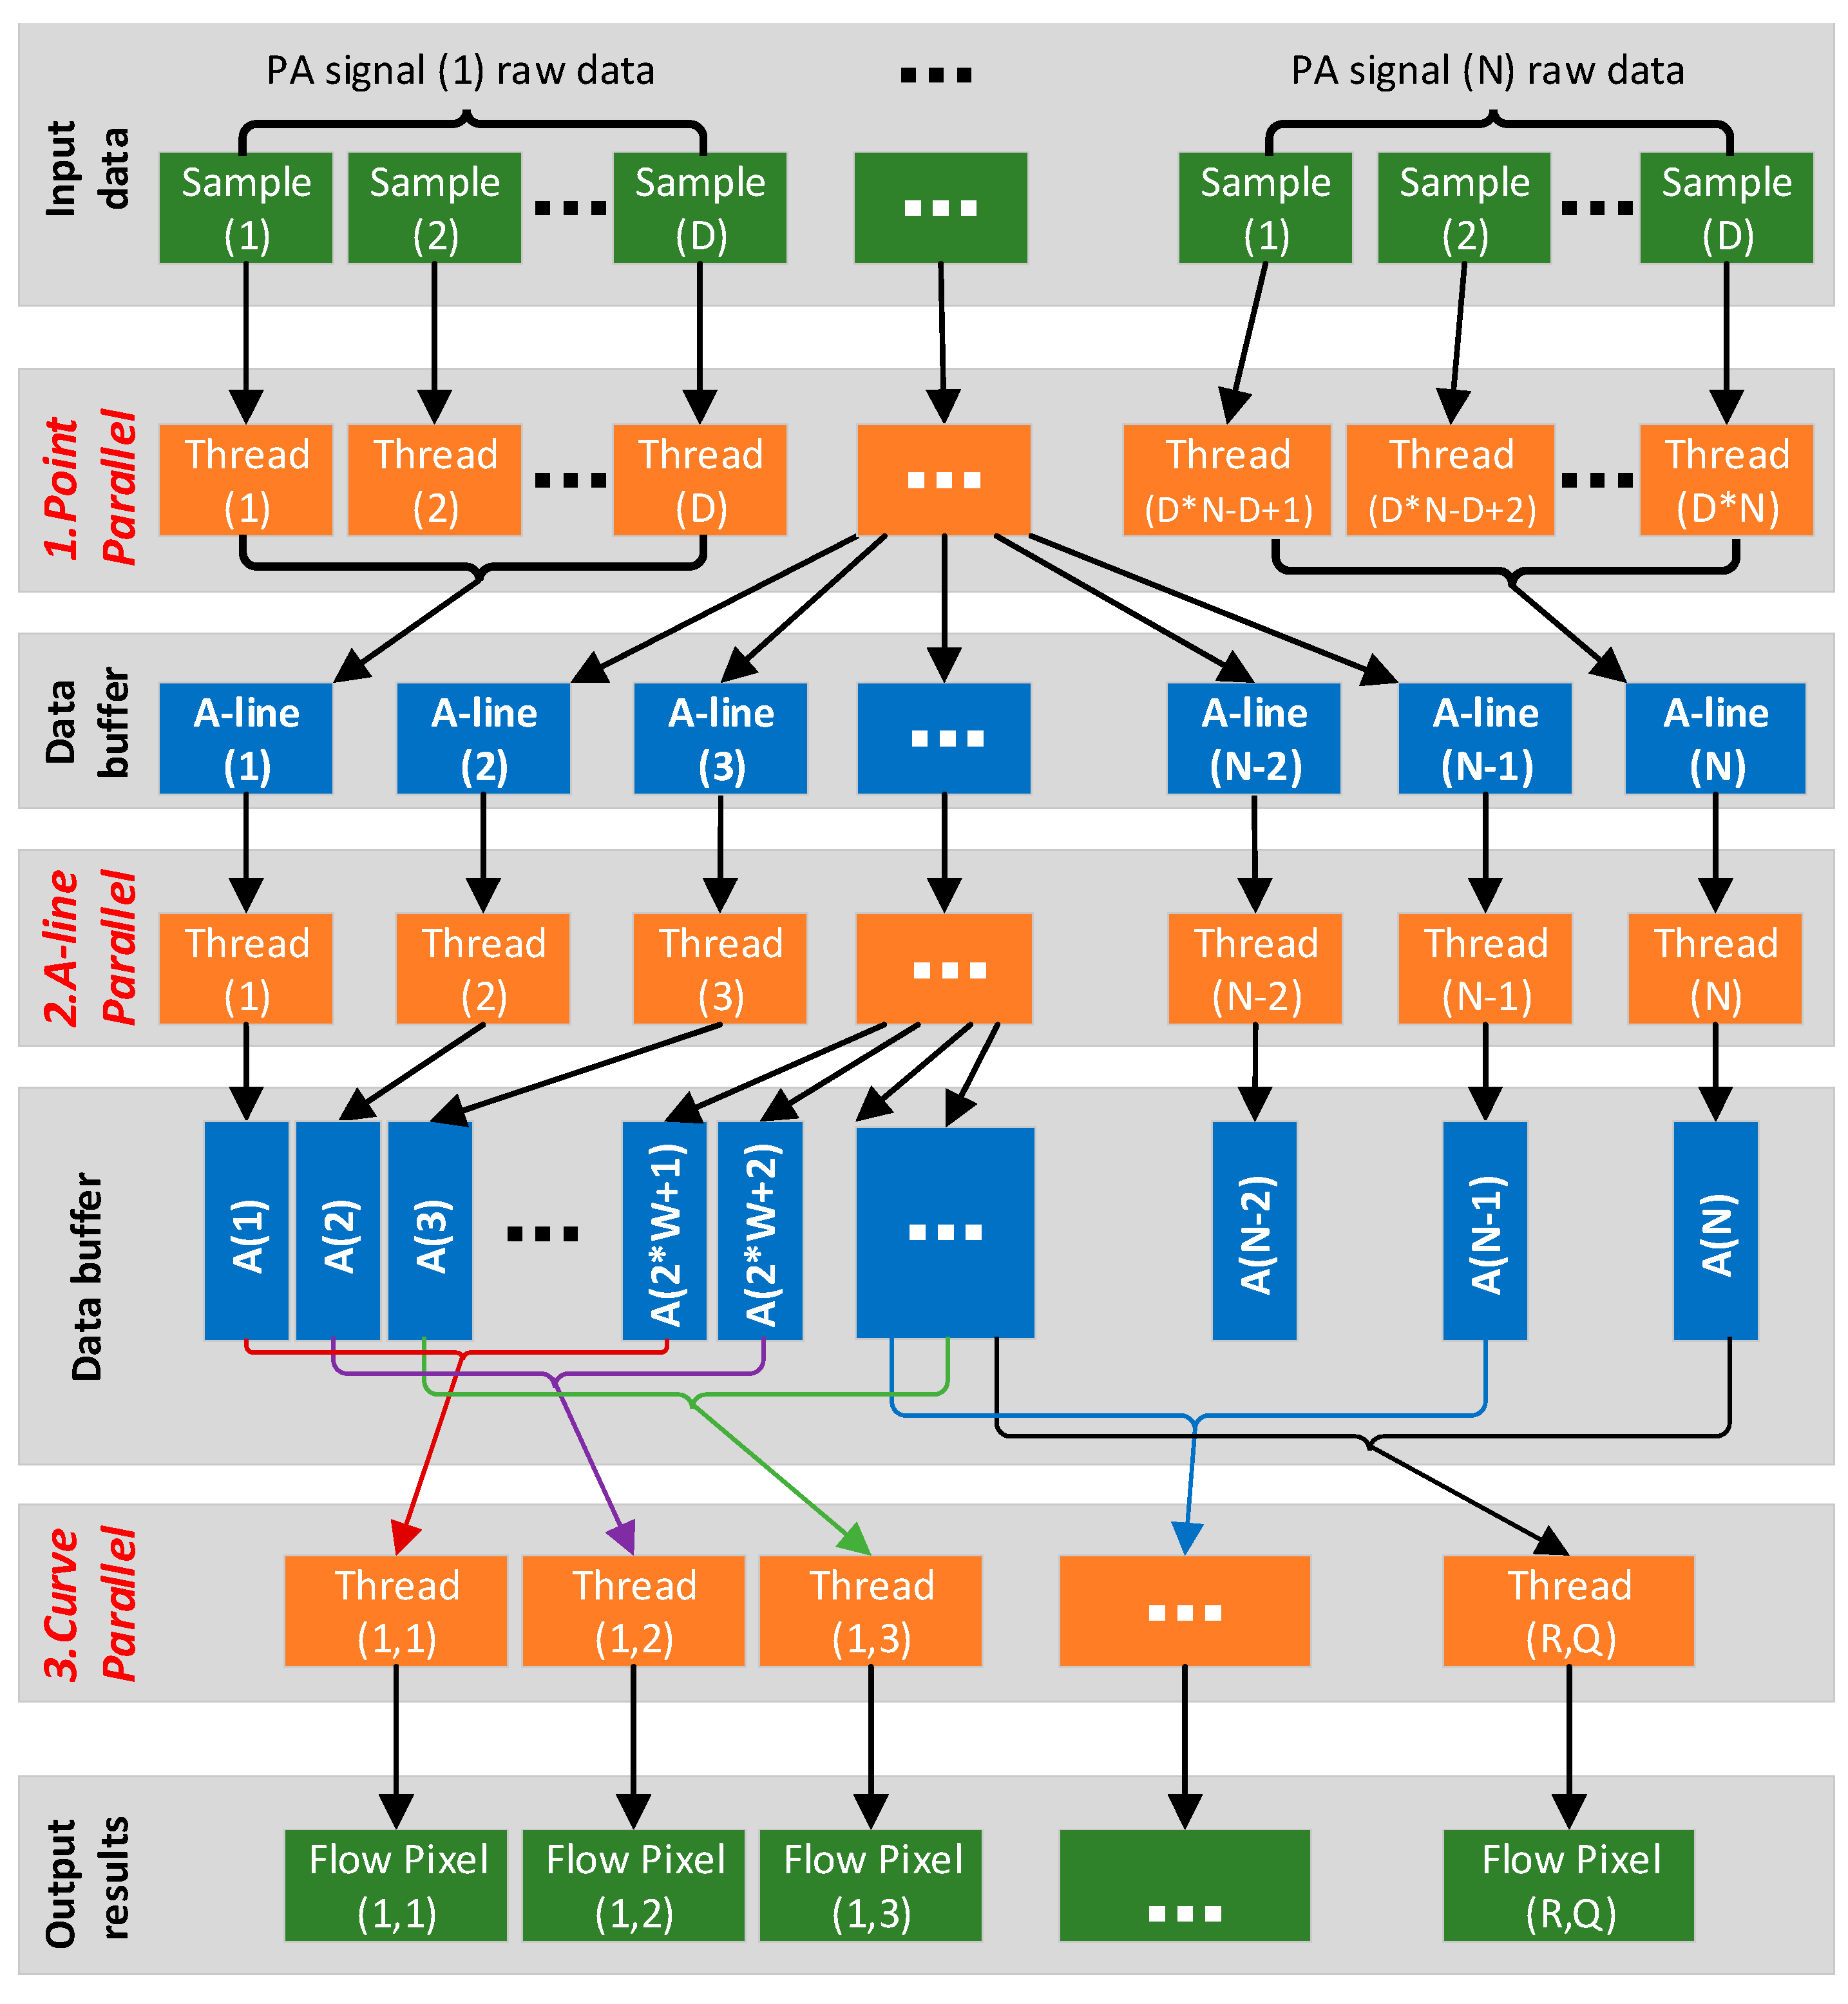
3.3. Parallel Task Setup
4. GPU Implementation and optimization
4.1. Software and Hardware Platform
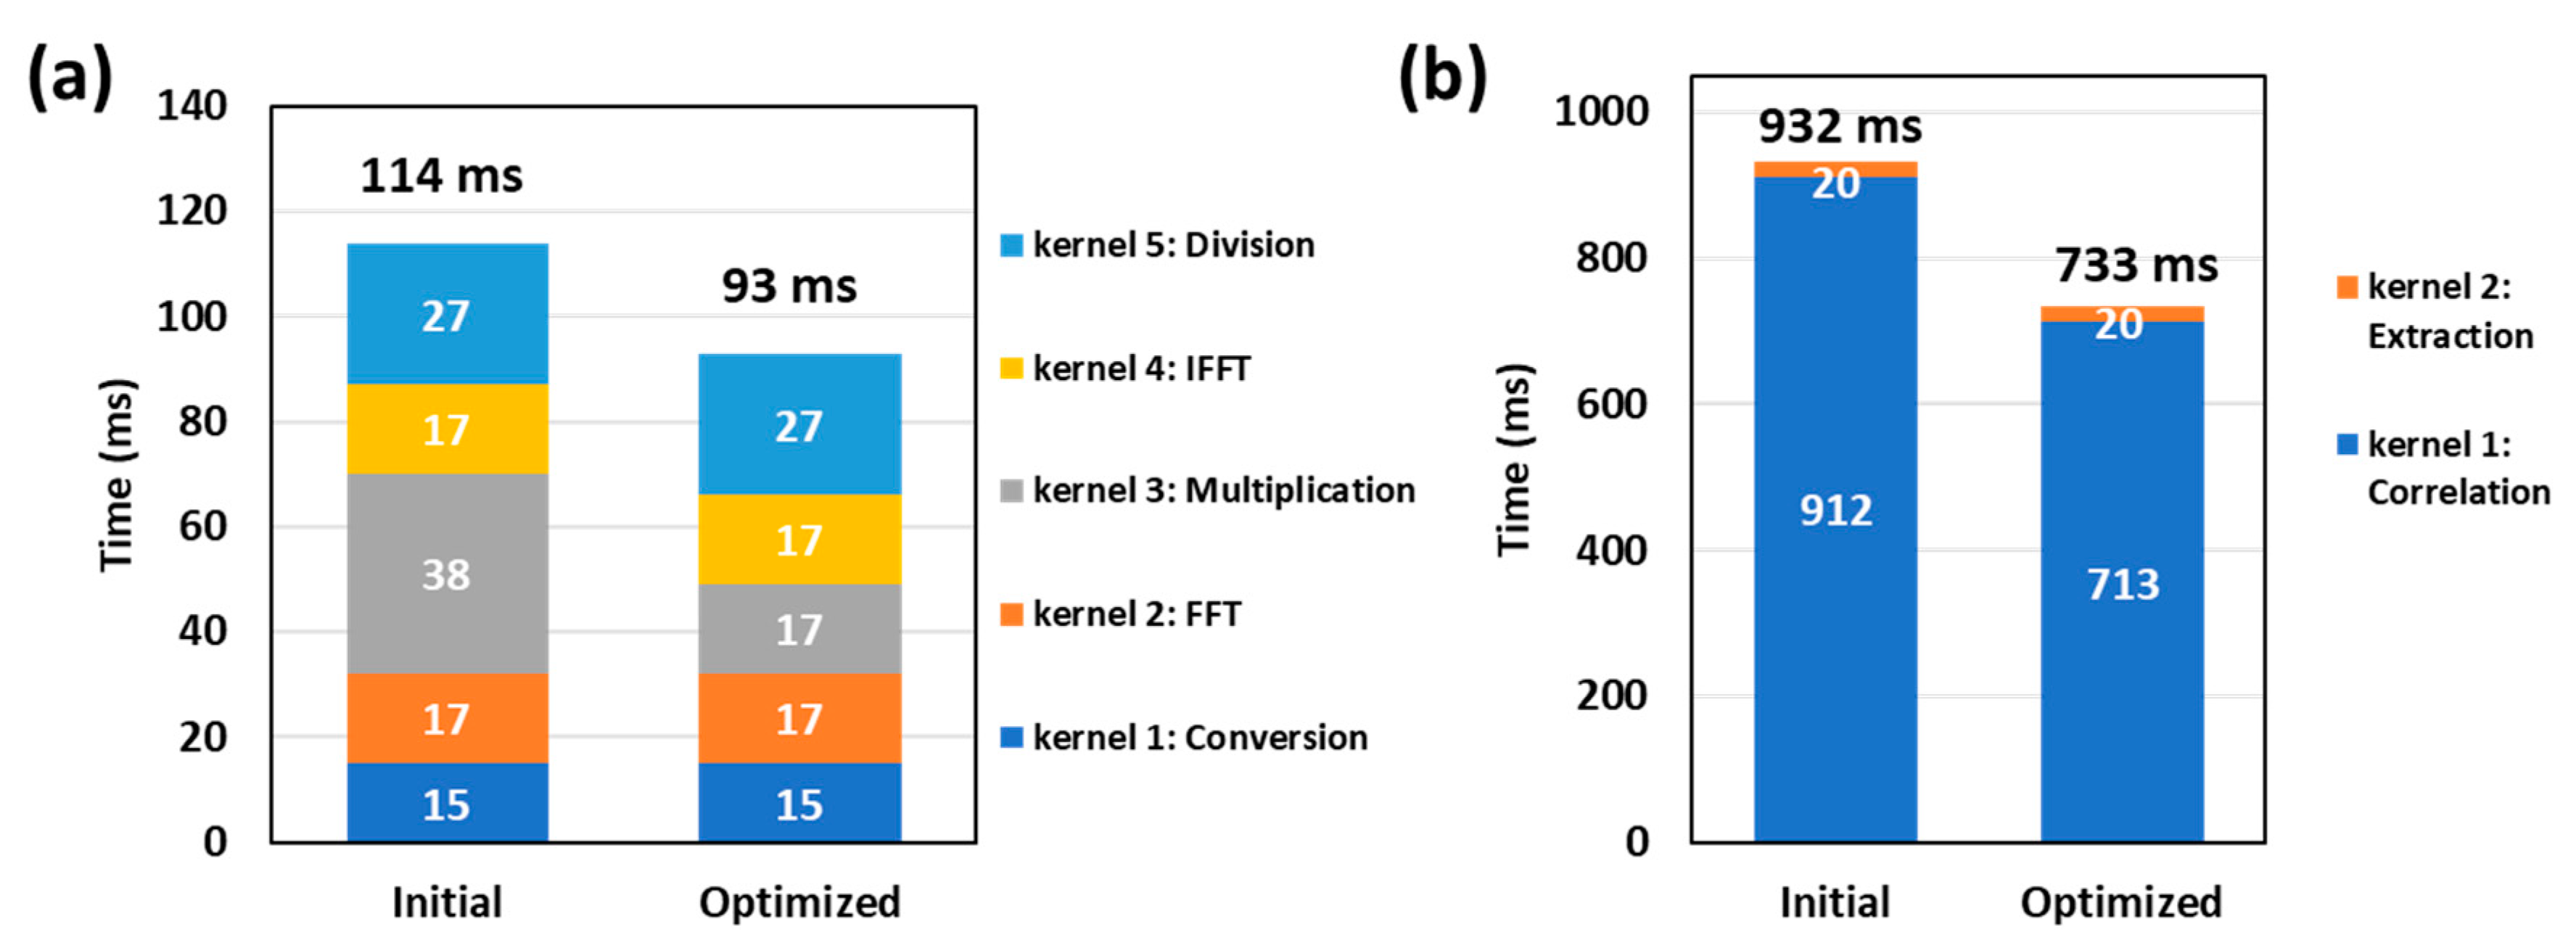
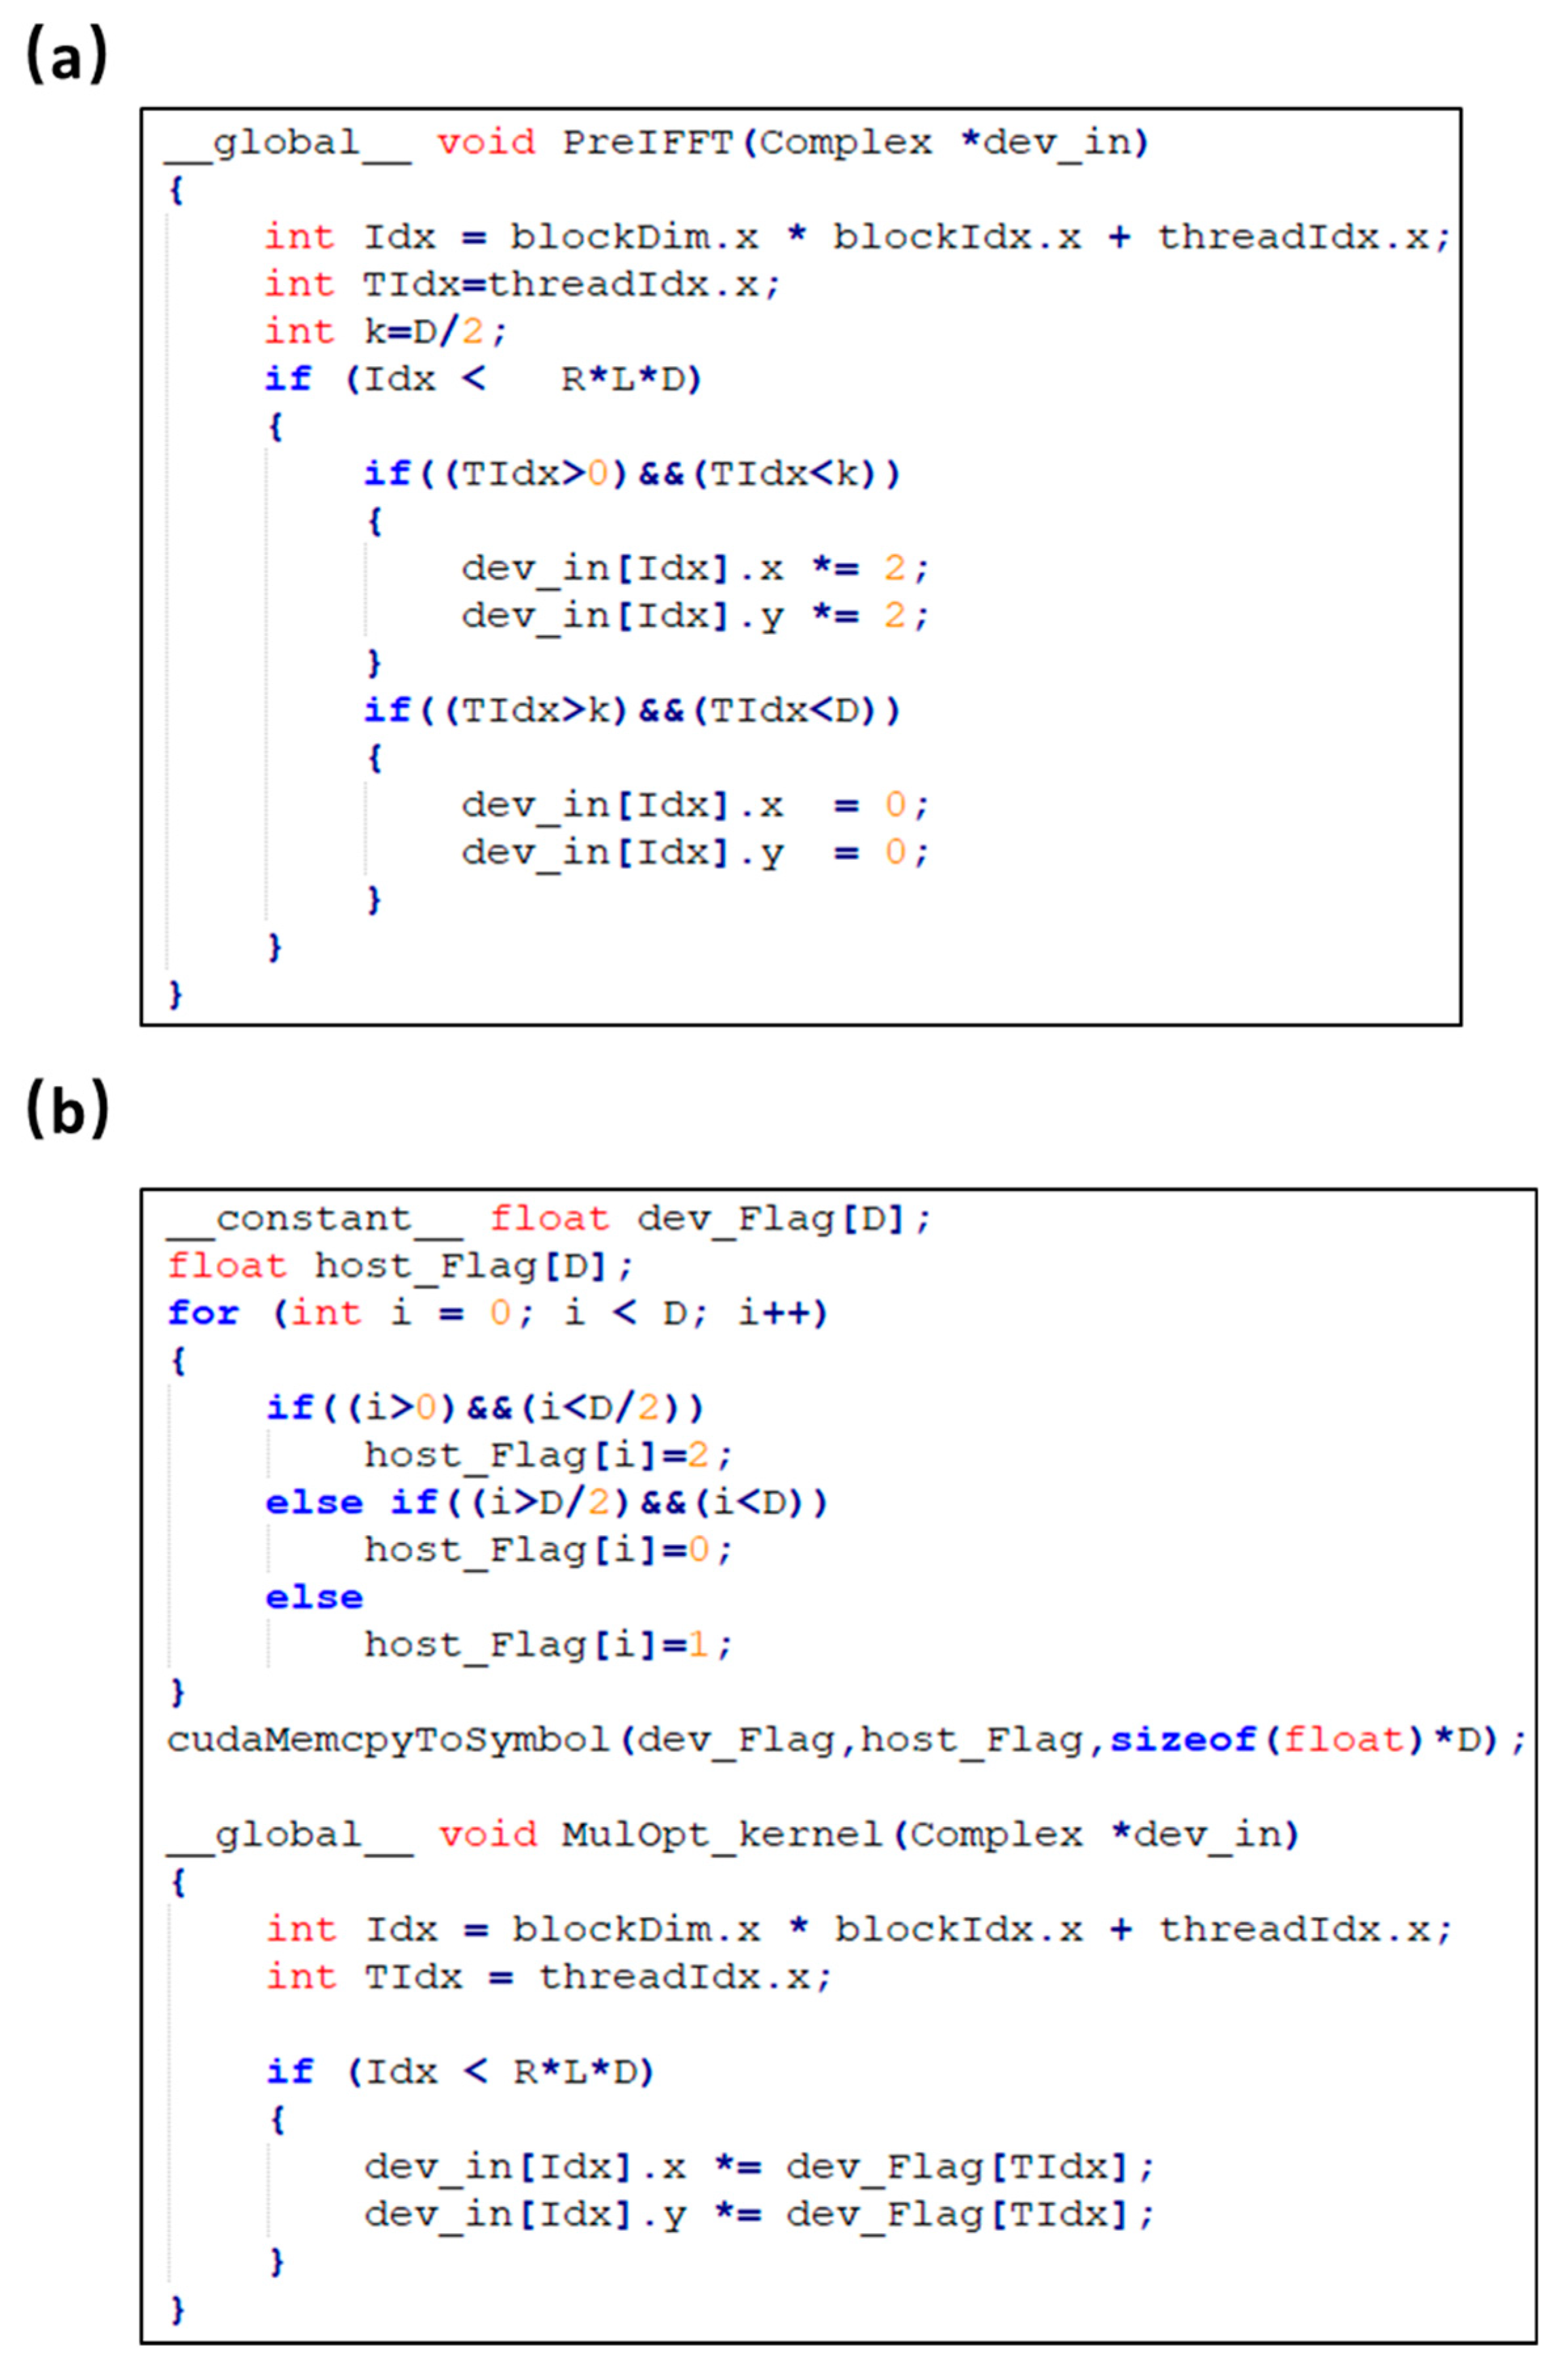
4.2. Initial Implementation
4.3. Optimized Implementation
5. Performance Test
6. Discussion
7. Conclusions
Author Contributions
Funding
Conflicts of Interest
References
- Hu, S. Listening to the Brain With Photoacoustics. IEEE J. Sel. Top. Quantum Electron. 2016, 22, 6800610. [Google Scholar]
- Xia, J.; Yao, J.; Wang, L.V. Photoacoustic tomography: Principles and advances. Prog. Electromagn. Res. Pier. 2014, 147, 1–22. [Google Scholar]
- Cai, C.; Wang, X.; Si, K.; Qian, J.; Luo, J.; Ma, C. Feature coupling photoacoustic computed tomography for joint reconstruction of initial pressure and sound speed in vivo. Biomed. Opt. Express 2019, 10, 3447–3462. [Google Scholar] [CrossRef] [PubMed]
- Cai, C.; Deng, K.; Ma, C.; Luo, J. End-to-end deep neural network for optical inversion in quantitative photoacoustic imaging. Opt. Lett. 2018, 43, 2752–2755. [Google Scholar] [CrossRef] [PubMed]
- Park, K.; Kim, J.Y.; Lee, C.; Jeon, S.; Lim, G.; Kim, C. Handheld photoacoustic microscopy probe. Sci. Rep. 2017, 7, 13359. [Google Scholar] [CrossRef] [PubMed]
- Wang, L.V.; Hu, S. Photoacoustic tomography: In vivo imaging from organelles to organs. Science 2012, 335, 1458–1462. [Google Scholar] [CrossRef] [PubMed]
- Hai, P.; Imai, T.; Xu, S.; Zhang, R.; Aft, R.L.; Zou, J.; Wang, L.V. High-throughput, label-free, single-cell photoacoustic microscopy of intratumoral metabolic heterogeneity. Nat. Biomed. Eng. 2019, 3, 381–391. [Google Scholar] [CrossRef] [PubMed]
- Liu, C.; Liang, Y.; Wang, L. Optical-resolution photoacoustic microscopy of oxygen saturation with nonlinear compensation. Biomed. Opt. Express 2019, 10, 3061. [Google Scholar]
- Okumura, K.; Matsumoto, J.; Iwata, Y.; Yoshida, K.; Yoneda, N.; Ogi, T.; Kitao, A.; Kozaka, K.; Koda, W.; Kobayashi, S.; et al. Evaluation of renal oxygen saturation using photoacoustic imaging for the early prediction of chronic renal function in a model of ischemia-induced acute kidney injury. PLoS ONE 2018, 13, 1–16. [Google Scholar] [CrossRef]
- Liu, Y.; Bhattarai, P.; Dai, Z.; Chen, X. Photothermal therapy and photoacoustic imaging: Via nanotheranostics in fighting cancer. Chem. Soc. Rev. 2019, 48, 2053–2108. [Google Scholar] [CrossRef]
- Yao, J.; Wang, L.V. Photoacoustic Microscopy. Laser Photon Rev. 2013, 7, 201200060. [Google Scholar] [CrossRef] [PubMed]
- Chen, S.-L.; Xie, Z.; Paul, L.C.; Wang, X.; Guo, L.J. In vivo flow speed measurement of capillaries by photoacoustic correlation spectroscopy. Opt. Lett. 2011, 36, 4017–4019. [Google Scholar] [CrossRef] [PubMed]
- Wolf, S.; Arend, O.; Schulte, K.; Ittel, T.H.; Reim, M. Quantification of retinal capillary density and flow velocity in patients with essential hypertension. Hypertension 1994, 23, 464–467. [Google Scholar] [CrossRef] [PubMed]
- Chen, S.-L.; Ling, T.; Huang, S.-W.; Baac, W.H.; Guo, L.J. Photoacoustic correlation spectroscopy and its application to low-speed flow measurement. Opt. Lett. 2010, 35, 1200–1202. [Google Scholar] [CrossRef] [PubMed]
- Ning, B.; Kennedy, M.J.; Dixon, A.J.; Sun, N.; Cao, R.; Soetikno, B.T.; Chen, R.; Zhou, Q.; Shung, K.K.; Hossack, J.A.; et al. Simultaneously photoacoustic microscopy of microvascular anatomy, oxygen saturation, and blood flow. Opt. Lett. 2015, 40, 910–913. [Google Scholar] [CrossRef]
- Cao, R.; Zhang, C.; Mitkin, V.V.; Lankford, M.F.; Li, J.; Zuo, Z.; Meyer, C.H.; Goyne, C.P.; Ahlers, S.T.; Stone, J.R.; et al. Comprehensive Characterization of Cerebrovascular Dysfunction in Blast Traumatic Brain Injury Using Photoacoustic Microscopy. J. Neurotrauma. 2019, 36, 1526–1534. [Google Scholar] [CrossRef]
- Cao, R.; Li, J.; Ning, B.; Sun, N.; Wang, T.; Zuo, Z.; Hu, S. Functional and oxygen-metabolic photoacoustic microscopy of the awake mouse brain. NeuroImage 2017, 150, 77–87. [Google Scholar] [CrossRef]
- Linghu, L.; Wu, J.; Wu, Z.; Wang, X. Parallel computation of EM backscattering from large three-dimensional sea surface with CUDA. Sensors 2018, 18, 3656. [Google Scholar] [CrossRef]
- Yuan, J.; Xu, G.; Yu, Y.; Zhou, Y.; Carson, P.L.; Wang, X.; Liu, X. Real-time photoacoustic and ultrasound dual-modality imaging system facilitated with graphics processing unit and code parallel optimization. J. Biomed. Opt. 2013, 18, 086001. [Google Scholar] [CrossRef]
- Peng, K.; He, L.; Zhu, Z.; Tang, J.; Xiao, J. Three-dimensional photoacoustic tomography based on graphics-processing-unit-accelerated finite element method. Appl. Opt. 2013, 52, 8270–8279. [Google Scholar] [CrossRef]
- Shan, T.; Qi, J.; Jiang, M.; Jiang, H. GPU-based acceleration and mesh optimization of finite-element-method-based quantitative photoacoustic tomography: A step towards clinical applications. Appl. Opt. 2017, 56, 4426–4432. [Google Scholar] [CrossRef] [PubMed]
- Li, M.; Liu, C.; Gong, X.; Zheng, R.; Bai, Y.; Xing, M.; Du, X.; Liu, X.; Zeng, J.; Lin, R.; et al. Linear Array-Based Real-Time Photoacoustic Imaging System with a Compact Coaxial Excitation Handheld Probe for Noninvasive Sentinel Lymph Node Mapping. Biomed. Opt. Express 2018, 9, 1408–1422. [Google Scholar] [CrossRef] [PubMed]
- Rostami, S.R.M.; Mozaffarzadeh, M.; Ghaffari-Miab, M.; Hariri, A.; Jokerst, J. GPU-accelerated Double-Stage Delay-Multiply-and-Sum Algorithm for Fast Photoacoustic Tomography Using LED Excitation and Linear Arrays. Ultrason. Imaging 2019, 41, 301–316. [Google Scholar] [CrossRef] [PubMed]
- Kang, H.; Lee, S.-W.; Lee, E.-S.; Kim, S.-H.; Lee, T.G. Real-time GPU-accelerated processing and volumetric display for wide-field laser-scanning optical-resolution photoacoustic microscopy. Biomed. Opt. Express 2015, 6, 249785. [Google Scholar] [CrossRef] [PubMed]
- Kang, H.; Lee, S.-W.; Park, S.-M.; Cho, S.-W.; Lee, J.Y.; Kim, C.-S.; Lee, T.G. Real-time functional optical-resolution photoacoustic microscopy using high-speed alternating illumination at 532 and 1064 nm. J. Biophotonics 2018, 11, 1–9. [Google Scholar] [CrossRef] [PubMed]
- Sylwestrzak, M.; Szlag, D.; Marchand, P.J.; Kumar, A.S.; Lasser, T. Massively parallel data processing for quantitative tota;l flow imaging with optical coherence microscopy and tomography. Comput. Phys. Commun. 2017, 217, 128–137. [Google Scholar] [CrossRef]


| Parameter | GeForce GTX 1080 Ti |
|---|---|
| CUDA Architecture | Pascal |
| CUDA Computer Capability | 6.1 |
| Clock Rate (GHz) | 1.582 |
| Global Memory (GB) | 11 |
| CUDA Cores | 3584 |
| Multiprocessor Count | 28 |
| SIMD Width | 32 |
| Hardware | CPU | GPU | |||||
|---|---|---|---|---|---|---|---|
| Software 1 | MATLAB Time (ms) | Single-Thread C/C++ | Multi-Thread C/C++ | CUDA | |||
| Time (ms) | Speedup | Time (ms) | Speedup | Time (ms) | Speedup | ||
| Data to GPU | — | — | — | — | — | 60 | — |
| DC subtraction | 371 | 134 | ×2.77 | 37 | ×10.02 | 11 | ×33 |
| Hilbert transform | 13,131 | 19,760 | ×0.66 | 10,978 | ×1.19 | 114 | ×115 |
| Amplitude detection | 9456 | 3877 | ×2.44 | 732 | ×12.92 | 156 | ×61 |
| Correlation calculation | 76,985 | 91,037 | ×0.85 | 71,683 | ×1.07 | 1856 | ×41 |
| 933 (new 2) | ×83 | ||||||
| Speed calculation | 18,740 | 5894 | ×3.18 | 1734 | ×10.81 | 272 | ×68 |
| Data to host | — | — | — | — | — | 2 | — |
| Image Size (mm2) | 1 | 1.5 | 2 | 2.5 | 3 | 3.5 | 4 | |
|---|---|---|---|---|---|---|---|---|
| A-line number (×106) | 0.72 | 1.08 | 1.44 | 1.8 | 2.16 | 2.52 | 2.88 | |
| Data size (GB) | 0.74 | 1.11 | 1.47 | 1.84 | 2.21 | 2.58 | 2.95 | |
| MATLAB 1 Runtime (s) | 123.63 | 201.37 | 263 | 327.68 | 388.02 | 460.7 | 528.03 | |
| Multi-thread C/C++ | Runtime (s) | 86.16 | 124.52 | 168.99 | 213.46 | 260.6 | 305.07 | 350.43 |
| Speedup 3 | ×1.43 | ×1.62 | ×1.56 | ×1.54 | ×1.49 | ×1.51 | ×1.51 | |
| CUDA 2 | Runtime (s) | 1.52 | 2.47 | 3.34 | 4.08 | 5.03 | 5.72 | 6.59 |
| Speedup | ×81.34 | ×81.52 | ×78.74 | ×80.31 | ×77.14 | ×80.54 | ×80.13 | |
© 2019 by the authors. Licensee MDPI, Basel, Switzerland. This article is an open access article distributed under the terms and conditions of the Creative Commons Attribution (CC BY) license (http://creativecommons.org/licenses/by/4.0/).
Share and Cite
Xu, Z.; Wang, Y.; Sun, N.; Li, Z.; Hu, S.; Liu, Q. Parallel Computing for Quantitative Blood Flow Imaging in Photoacoustic Microscopy. Sensors 2019, 19, 4000. https://doi.org/10.3390/s19184000
Xu Z, Wang Y, Sun N, Li Z, Hu S, Liu Q. Parallel Computing for Quantitative Blood Flow Imaging in Photoacoustic Microscopy. Sensors. 2019; 19(18):4000. https://doi.org/10.3390/s19184000
Chicago/Turabian StyleXu, Zhiqiang, Yiming Wang, Naidi Sun, Zhengying Li, Song Hu, and Quan Liu. 2019. "Parallel Computing for Quantitative Blood Flow Imaging in Photoacoustic Microscopy" Sensors 19, no. 18: 4000. https://doi.org/10.3390/s19184000
APA StyleXu, Z., Wang, Y., Sun, N., Li, Z., Hu, S., & Liu, Q. (2019). Parallel Computing for Quantitative Blood Flow Imaging in Photoacoustic Microscopy. Sensors, 19(18), 4000. https://doi.org/10.3390/s19184000