Development of Flexible Dispense-Printed Electrochemical Immunosensor for Aflatoxin M1 Detection in Milk

 ,
,  , and
, and
Abstract
1. Introduction
2. Materials and Methods
2.1. Reagents and Solution
2.2. Procedure
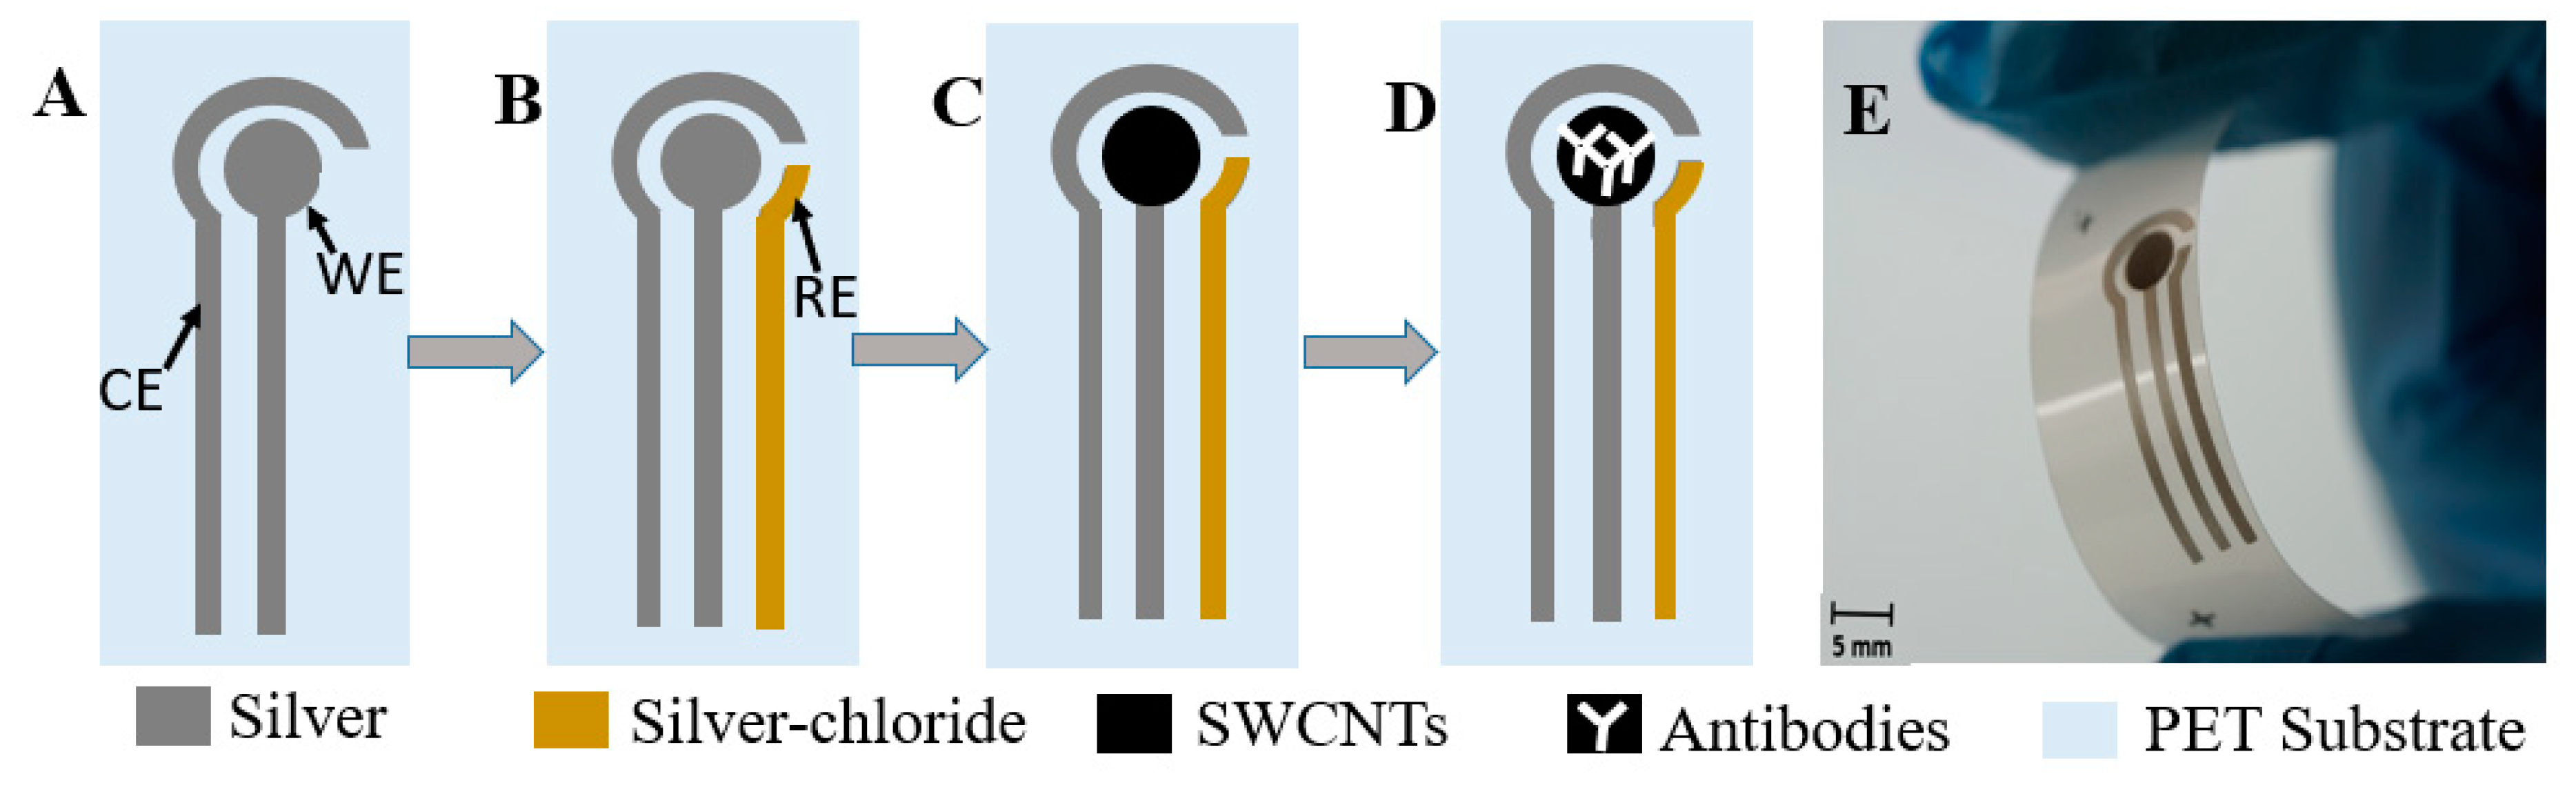
2.2.1. Fabrication
2.2.2. Characterization
2.2.3. Testing
3. Results and Discussion
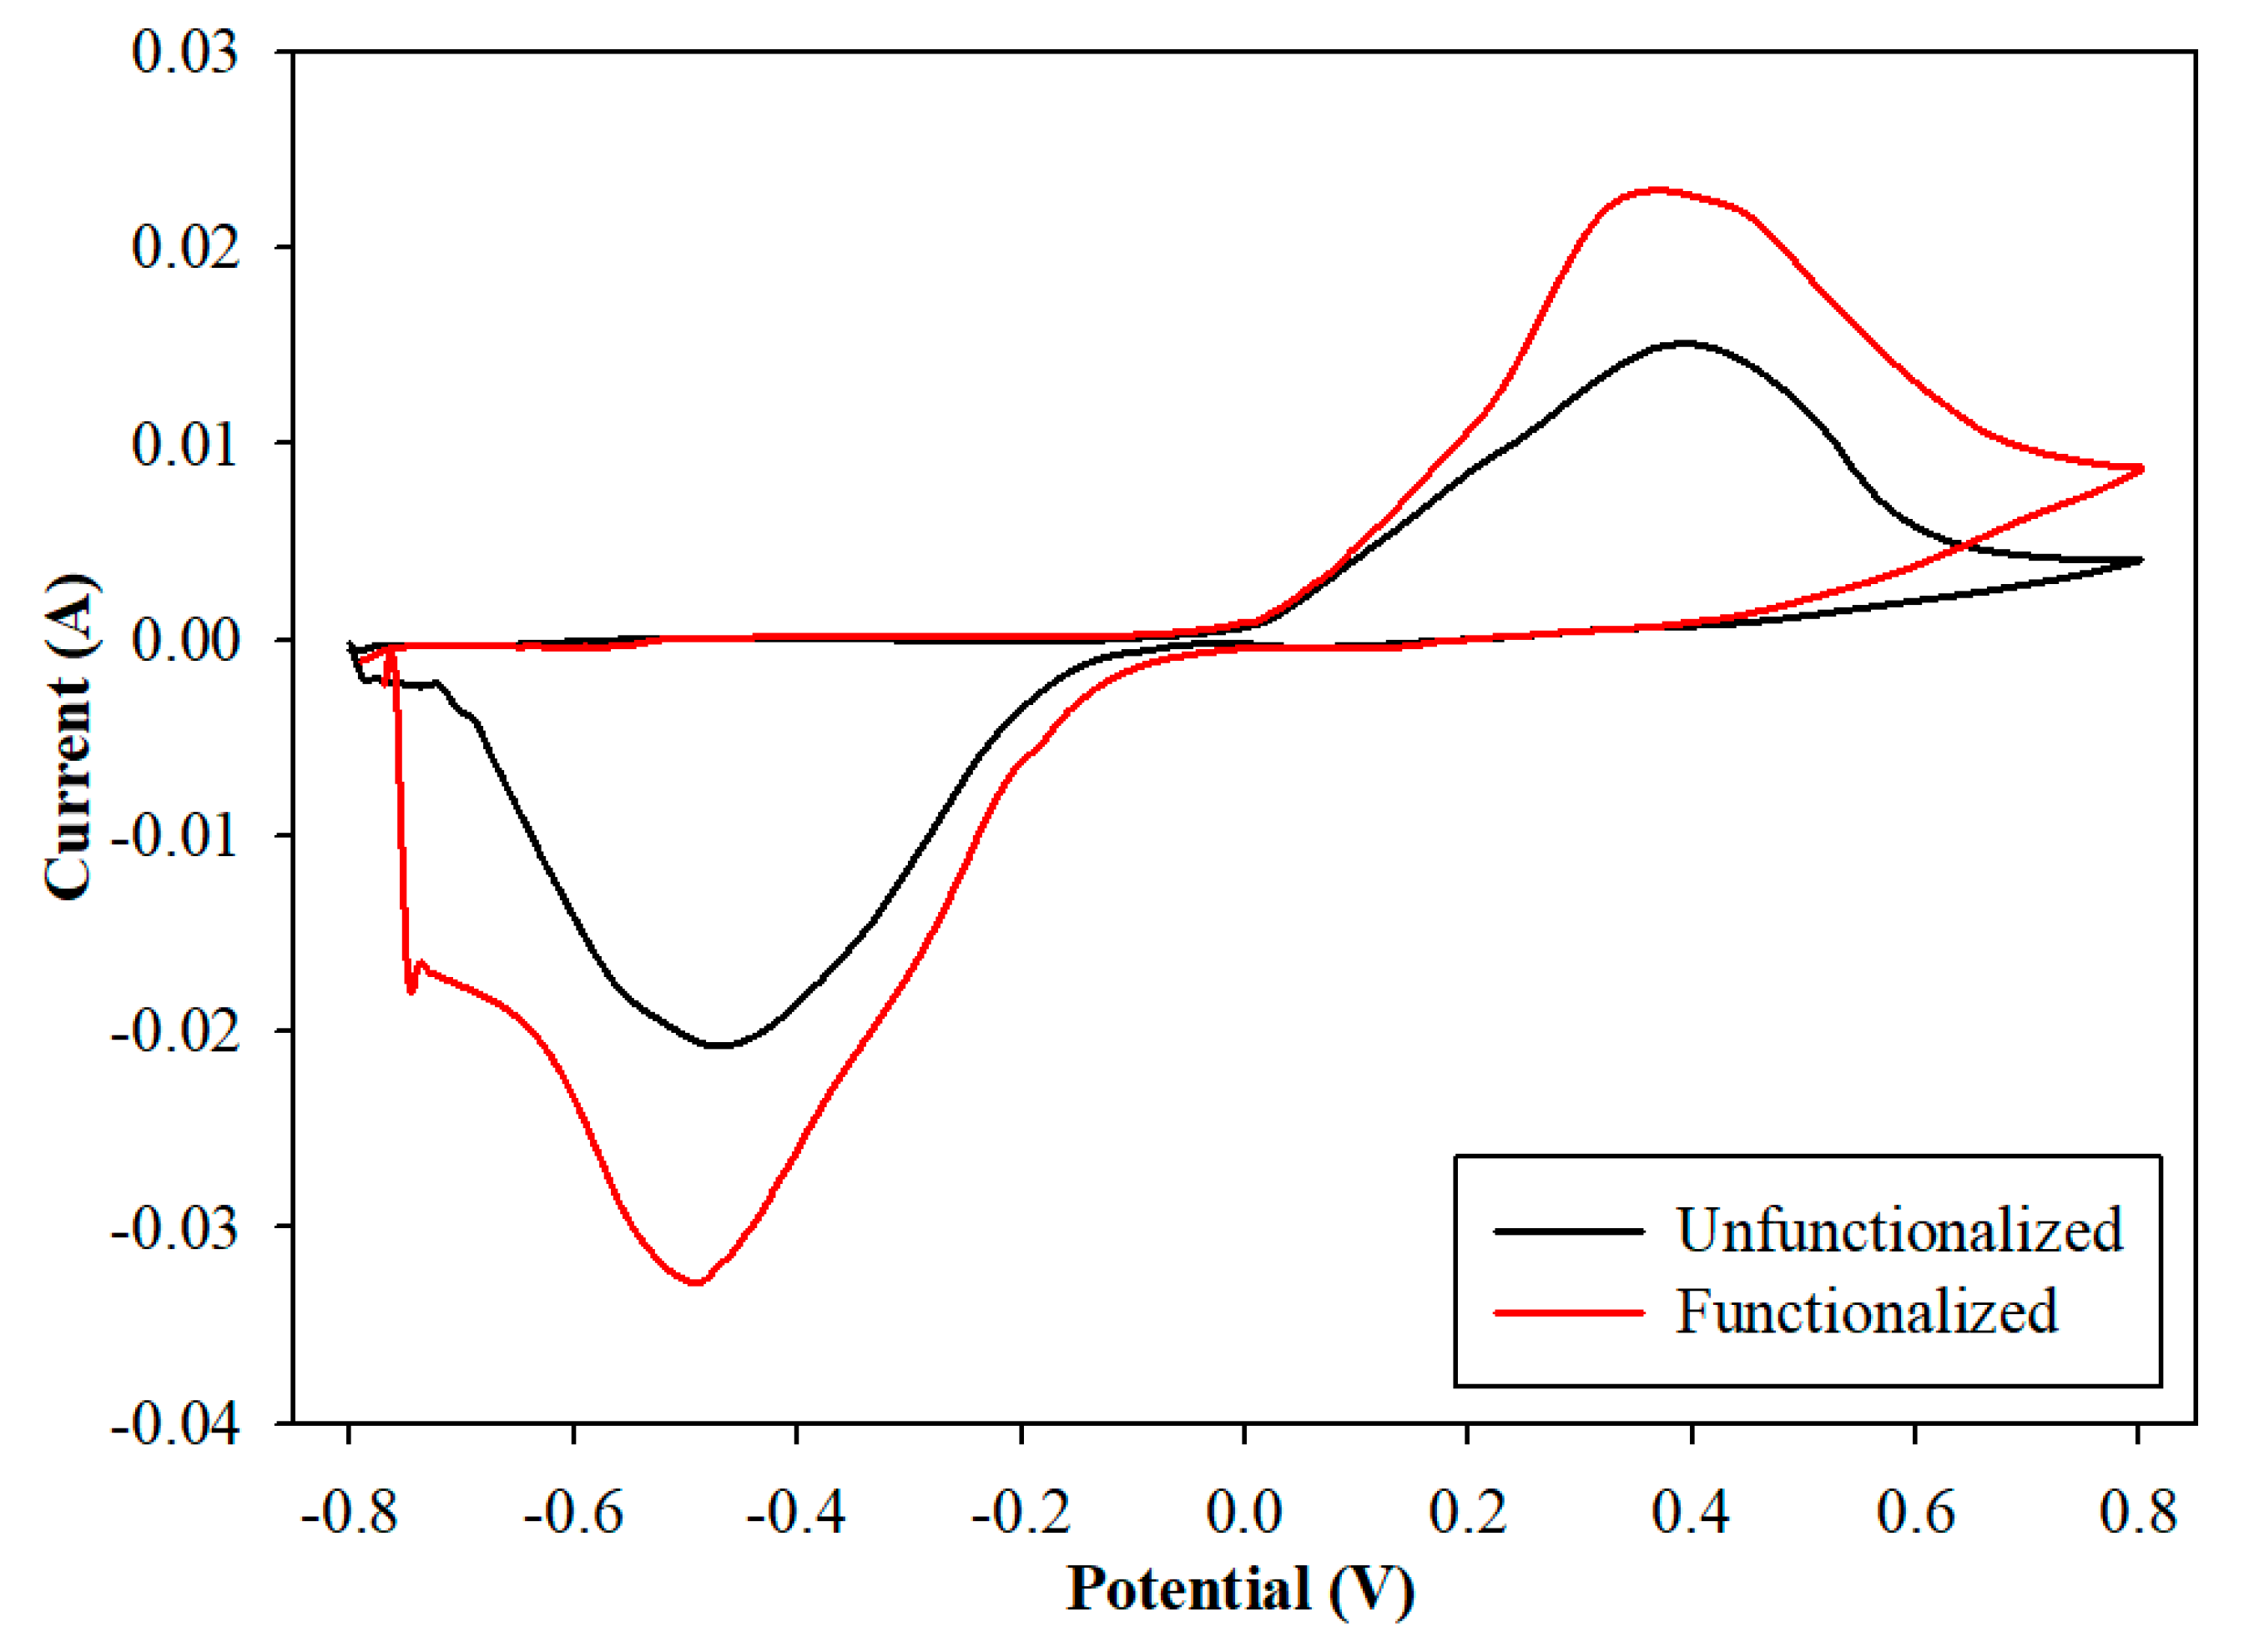
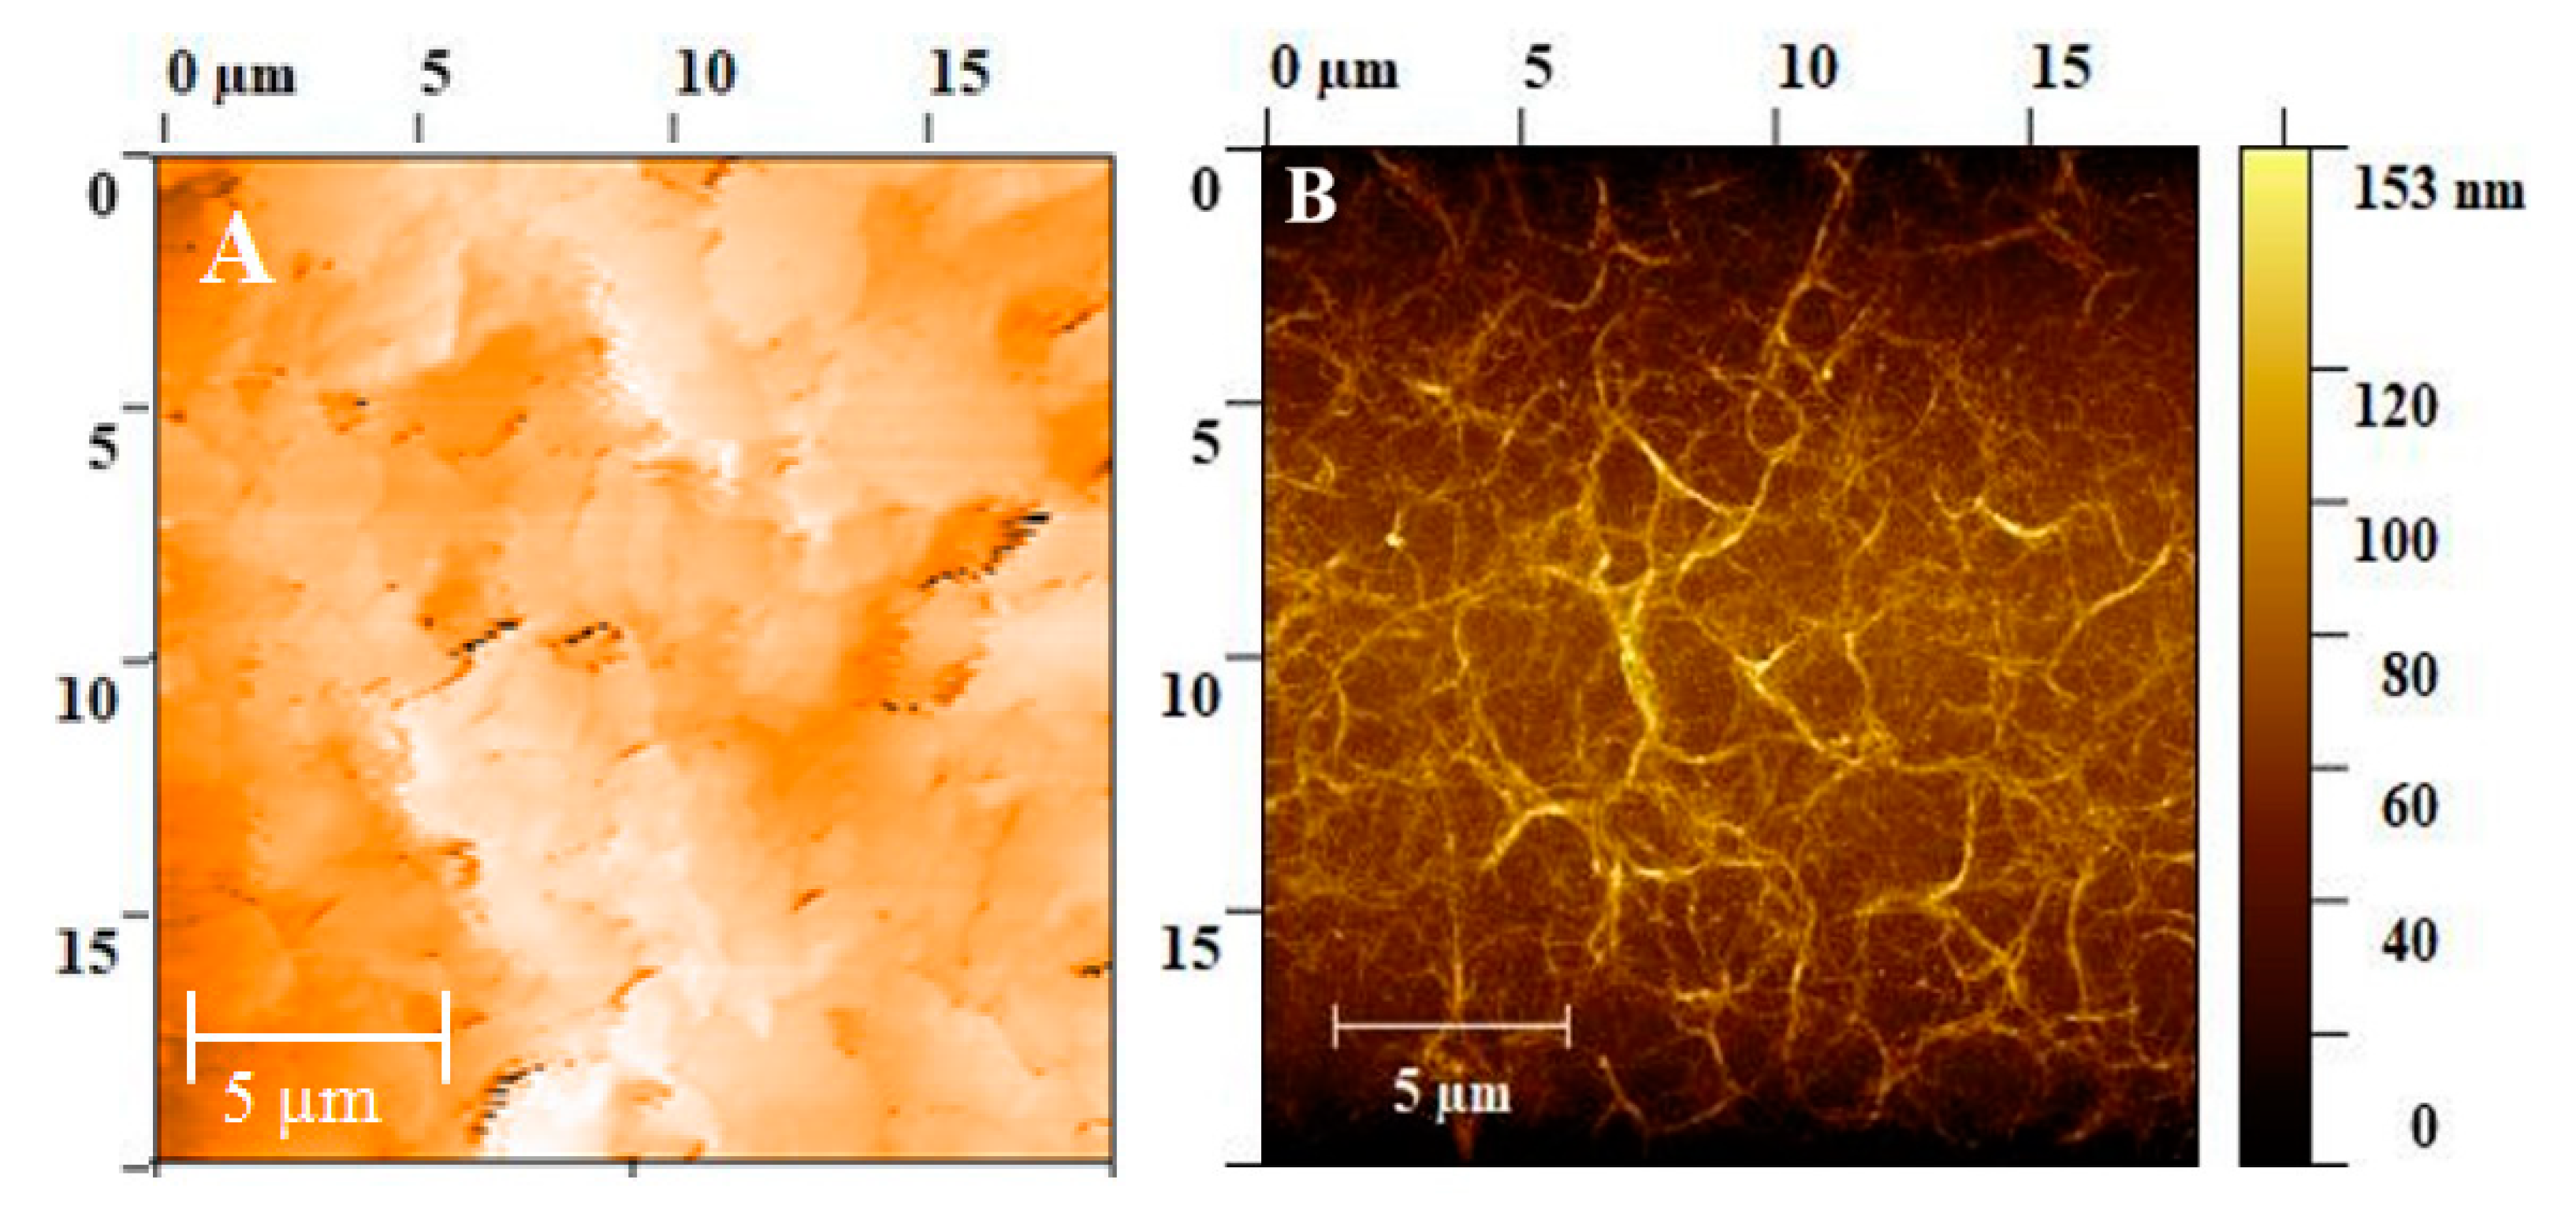
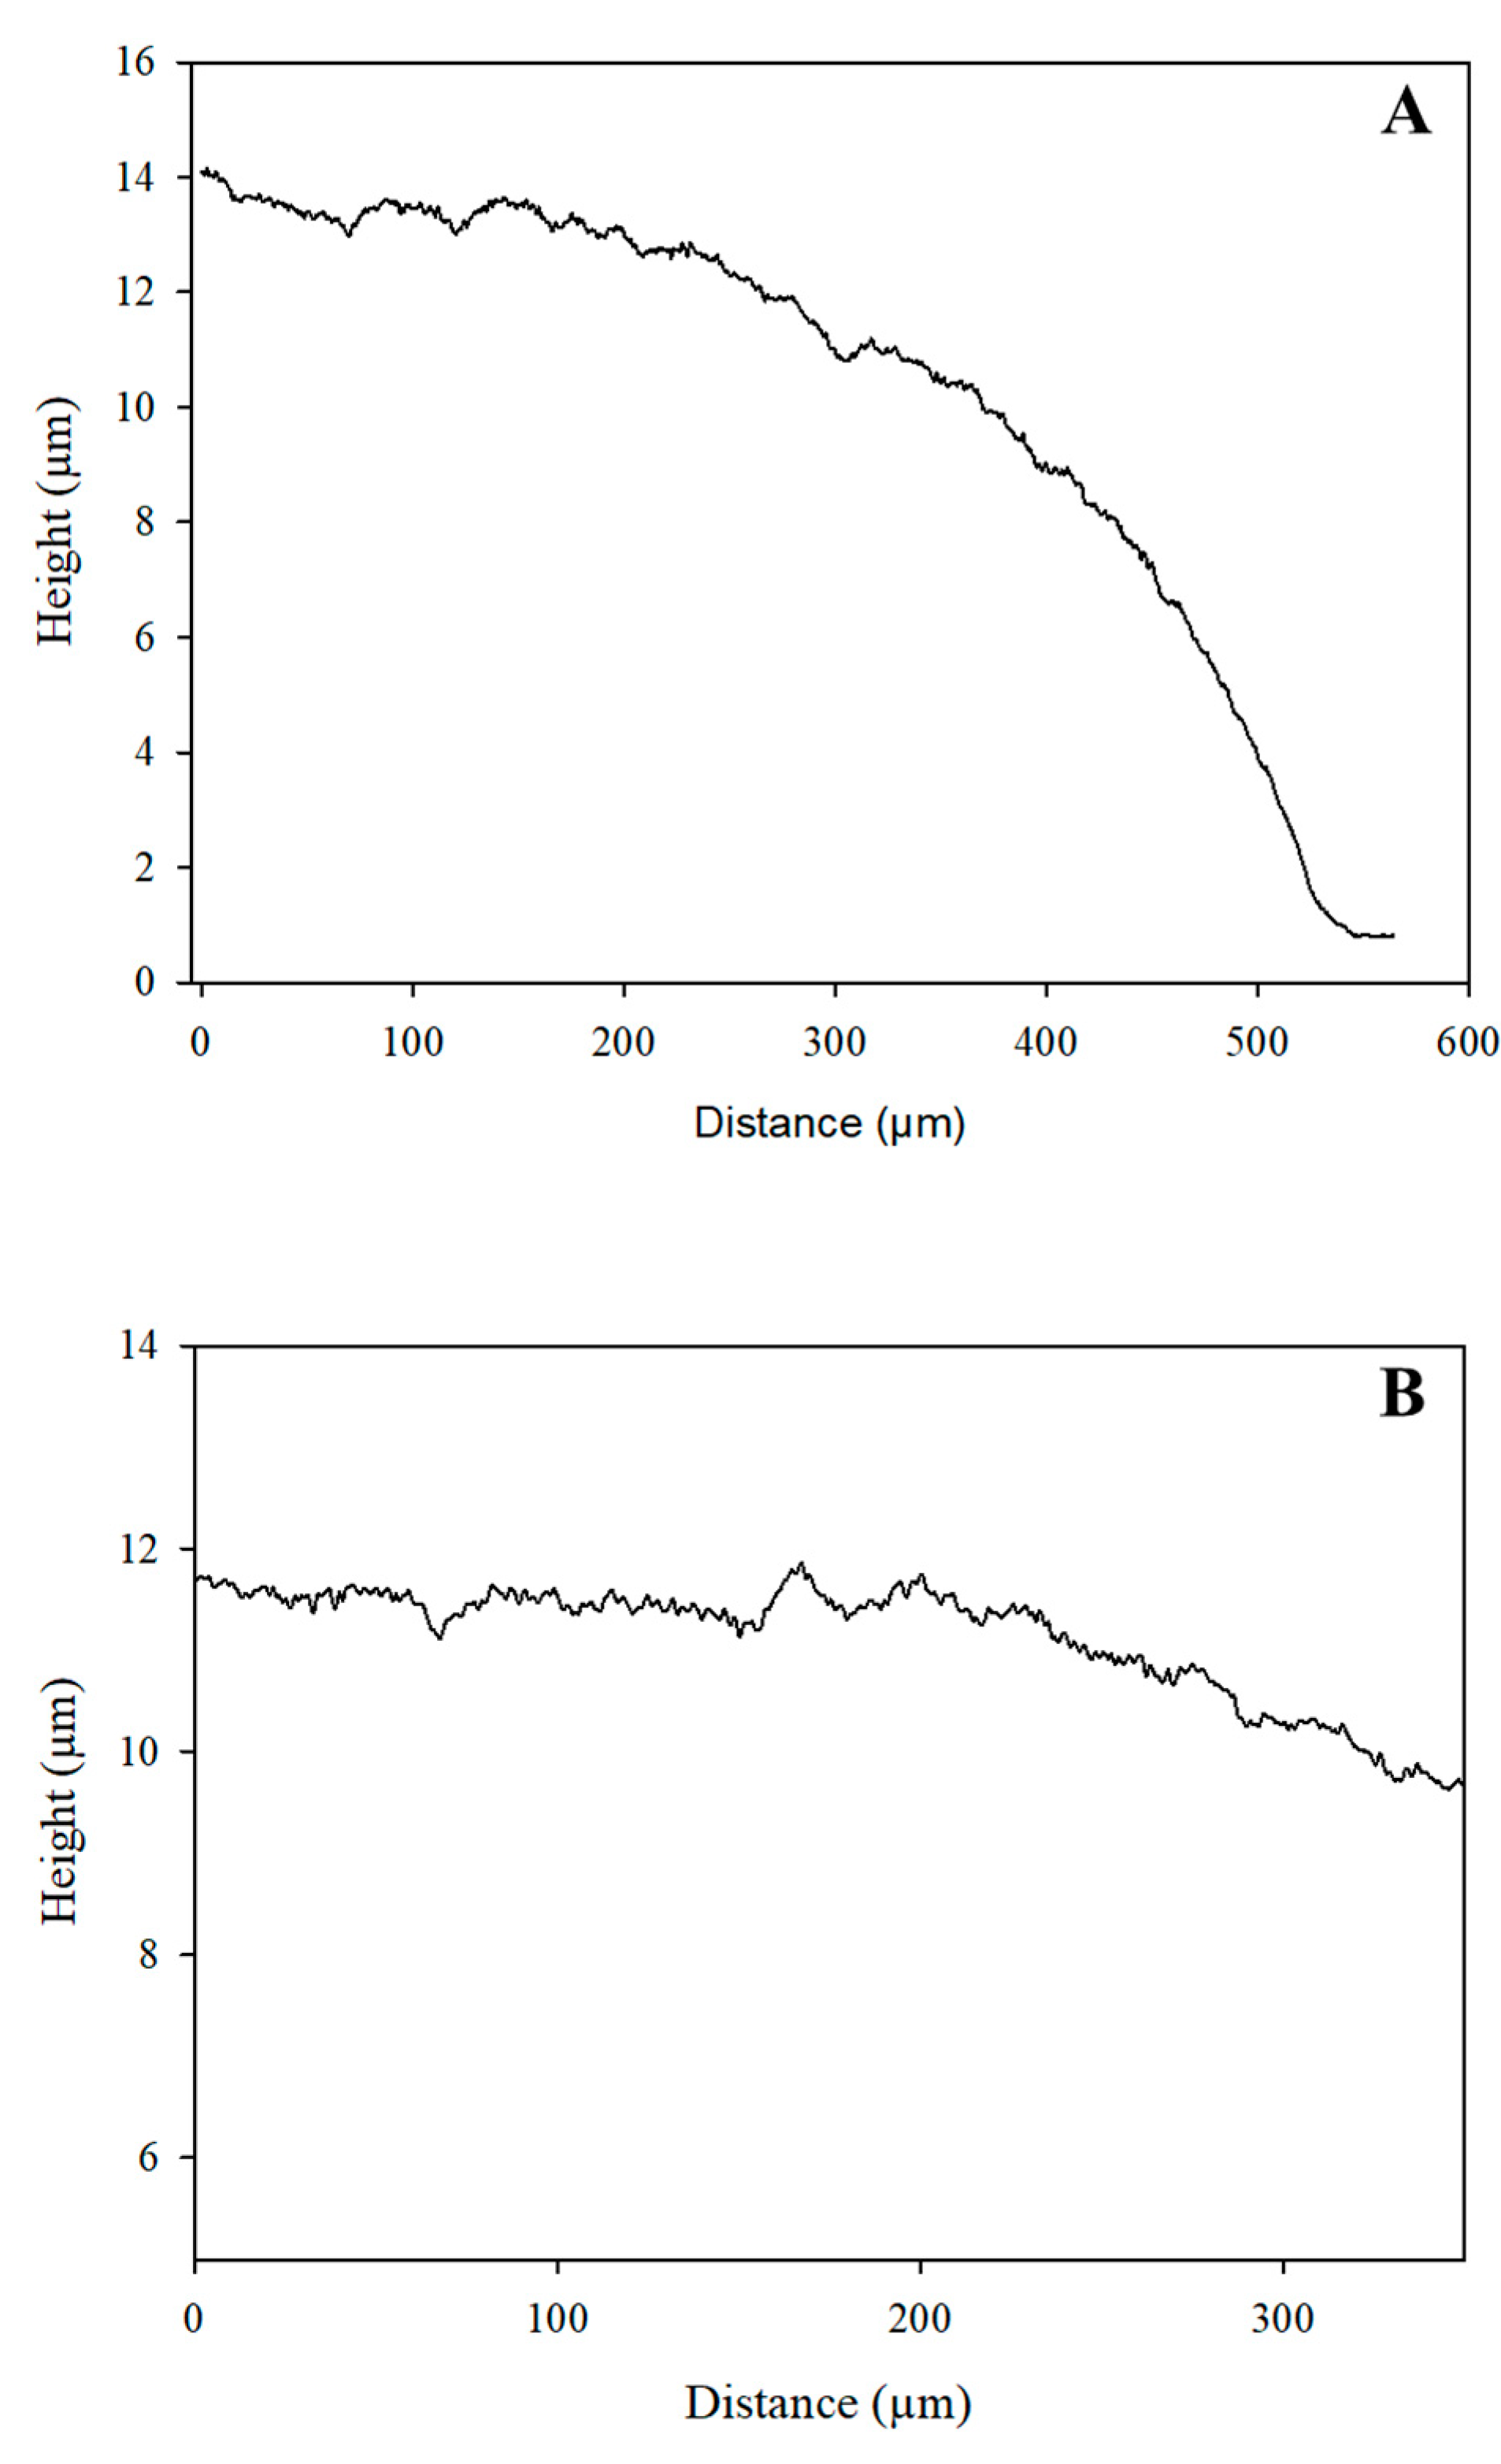
3.1. Characterization of the Electrode
3.2. Testing of the Immunosensor Performance
3.2.1. Testing in a Buffer Solution
3.2.2. Testing in Spiked Milk
4. Conclusions
Author Contributions
Funding
Acknowledgments
Conflicts of Interest
References
- Malhotra, B.D.; Srivastava, S.; Augustine, S. Biosensors for food toxin detection: Carbon nanotubes and graphene. MRS Online Proc. Libr. Arch. 2015, 1725. [Google Scholar] [CrossRef]
- Gurban, A.M.; Epure, P.; Oancea, F.; Doni, M. Achievements and prospects in electrochemical-based biosensing platforms for aflatoxin M1 detection in milk and dairy products. Sensors 2017, 17, 2951. [Google Scholar] [CrossRef] [PubMed]
- Rhouati, A.; Catanante, G.; Nunes, G.; Hayat, A. Label-free aptasensors for the detection of mycotoxins. Sensors 2016, 16, 2178. [Google Scholar] [CrossRef] [PubMed]
- Mosiello, L.; Lamberti, I. Biosensors for Aflatoxins Detection. In Aflatoxins—Detection, Measurement and Control; Italian National Agency for New Technologies, Energy and the Environment (ENEA): Rome, Italy, 2011; pp. 147–160. [Google Scholar]
- Välimaa, A.; Kivistö, A.T.; Leskinen, P.I.; Karp, M.T. A novel biosensor for the detection of zearalenone family mycotoxins in milk. J. Microbiol. Methods 2010, 80, 44–48. [Google Scholar] [CrossRef] [PubMed]
- Cathey, C.G.; Huang, G.; Sarr, A.B.; Clement, B.A. Development and evaluation of a min/column assay for the detection of aflatoxin M 1 in milk. J. Dairy Sci. 1994, 77, 1223–1231. [Google Scholar] [CrossRef]
- Shadjou, R.; Hasanzader, M.; Poor, M.H.; Shadjou, N. Electrochemical monitoring of aflatoxin M1 in milk samples using silver nanoparticles dispersed on α—cyclodextrin—GQDs nanocomposite. J. Mol. Recognit. 2018, 31, e2699. [Google Scholar] [CrossRef] [PubMed]
- Azri, F.A.; Sukor, R.; Yusof, N.A.; Hajian, R. Electrochemical Immunosensor for Detection of Aflatoxin B 1 Based on Indirect Competitive ELISA. Toxins 2018, 10, 196. [Google Scholar] [CrossRef] [PubMed]
- Badea, M.; Micheli, L.; Messia, M.C.; Candigliota, T.; Marconi, E.; Mottram, T.; Velasco-Garcia, M.; Moscone, D.; Palleschi, G. Aflatoxin M1 determination in raw milk using a flow-injection immunoassay system. Anal. Chim. Acta 2004, 520, 141–148. [Google Scholar] [CrossRef]
- Elsanhoty, R.M.; Ahmed, S.; Fawzy, M.; Badr, F.H. Detoxification of aflatoxin M1 in yoghurt using probiotics and lactic acid bacteria. Food Control 2014, 43, 129–134. [Google Scholar] [CrossRef]
- Paniel, N.; Radoi, A.; Marty, J. Development of an electrochemical biosensor for the detection of aflatoxin M1 in milk. Sensors 2010, 10, 9439–9448. [Google Scholar] [CrossRef] [PubMed]
- Sibanda, L.; De Saeger, S.; Van Peteghem, C. Development of a portable field immunoassay for the detection of aflatoxin M1 in milk. Int. J. Food Microbiol. 1999, 48, 203–209. [Google Scholar] [CrossRef]
- Karczmarczyk, A.; Dubiak-szepietowska, M.; Vorobii, M. Sensitive and rapid detection of aflatoxin M1 in milk utilizing enhanced SPR and p (HEMA) brushes. Biosens. Bioelectron. 2016, 81, 159–165. [Google Scholar] [CrossRef] [PubMed]
- Radoi, A.; Targa, M.; Marty, J. Enzyme-Linked Immunosorbent Assay (ELISA) based on superparamagnetic nanoparticles for aflatoxin M1 detection. Talanta 2008, 77, 138–143. [Google Scholar] [CrossRef] [PubMed]
- Battacone, G.; Nudda, A.; Rassu, S.P.; Decandia, M.; Pulina, G. Excretion of aflatoxin M1 in milk of goats fed diet contaminated by aflatoxin B1. J. Dairy Sci. 2012, 95, 2651–2661. [Google Scholar] [CrossRef] [PubMed]
- Kabak, B.; Dobson, A.D.W. Strategies to prevent mycotoxin contamination of food and animal feed: A review. Crit. Rev. Food Sci. Nutr. 2006, 46, 593–619. [Google Scholar] [CrossRef] [PubMed]
- Creppy, E.E. Update of survey, regulation and toxic effects of mycotoxins in Europe. Toxicol. Lett. 2002, 127, 19–28. [Google Scholar] [CrossRef]
- The European commission. Commission regulation (EU) No 165/2010. Off. J. Eur. Union 2010, 50, 8–12. [Google Scholar]
- Pohanka, M.; Jun, D.; Kuca, K. Mycotoxin assays using biosensor technology: A review. Drug Chem. Toxicol. 2007, 30, 253–261. [Google Scholar] [CrossRef]
- Palchetti, I.; Mascini, M. Electroanalytical biosensors and their potential for food pathogen and toxin detection. Anal. Bioanal. Chem. 2008, 391, 455–471. [Google Scholar] [CrossRef]
- Dunne, L.; Daly, S.; Baxter, A.; Haughey, S.; O’Kennedy, R. Surface plasmon resonance Based immunoassay for the detection of aflatoxin B1 using single-Chain antibody fragments. Spectrosc. Lett. 2005, 38, 229–245. [Google Scholar] [CrossRef]
- Parker, C.O.; Tothill, I.E. Development of an electrochemical immunosensor for aflatoxin M1 in milk with focus on matrix interference. Biosens. Bioelectron. 2009, 24, 2452–2457. [Google Scholar] [CrossRef]
- Ar, F.J.; Granero, A.M.; Robledo, N. Electrochemical Biosensors for the Determination of Toxic Substances Related to Food Safety Developed in South America: Mycotoxins and Herbicides. Chemosensors 2017, 5, 23. [Google Scholar] [CrossRef]
- Viswanathan, S.; Radecki, J. Nanomaterials in electrochemical biosensors for food analysis—A review. Pol. J. Food Nutr. Sci. 2008, 58, 157–164. [Google Scholar]
- Yamanaka, K.; Vestergaard, M.D.; Tamiya, E. Printable electrochemical biosensors: A focus on screen-printed electrodes and their application. Sensors 2016, 16, 1761. [Google Scholar] [CrossRef]
- Falco, A.; Cinà, L.; Scarpa, G.; Lugli, P.; Abdellah, A. Fully-sprayed and flexible organic photodiodes with transparent carbon nanotube electrodes. ACS Appl. Mater. Interfaces 2014, 6, 10593–10601. [Google Scholar] [CrossRef]
- Micheli, L.; Grecco, R.; Badea, M.; Moscone, D.; Palleschi, G. An electrochemical immunosensor for aflatoxin M1 determination in milk using screen-printed electrodes. Biosens. Bioelectron. 2005, 21, 588–596. [Google Scholar] [CrossRef]
- Algahtani, F.; Thulasiram, K.B.; Nasir, N.M.; Holland, A.S. Four point probe geometry modified correction factor for determining resistivity. Micro/Nano Mater. Devices Syst. 2013. [Google Scholar] [CrossRef]
- Zaporotskova, I.V.; Boroznina, N.P.; Parkhomenko, Y.N.; Kozhitov, L.V. Carbon nanotubes: Sensor properties: A review. Modern Electron. Mater. 2017, 2, 95–105. [Google Scholar] [CrossRef]
- Arancibia, V.; Penagos-llanos, J.; Nagles, E.; García-beltrán, O.; Hurtado, J.J. Development of a microcomposite with single-walled carbon nanotubes and Nd2O3 for determination of paracetamol in pharmaceutical dosage by adsorptive voltammetry. J. Pharm. Anal. 2019, 9, 62–69. [Google Scholar] [CrossRef]


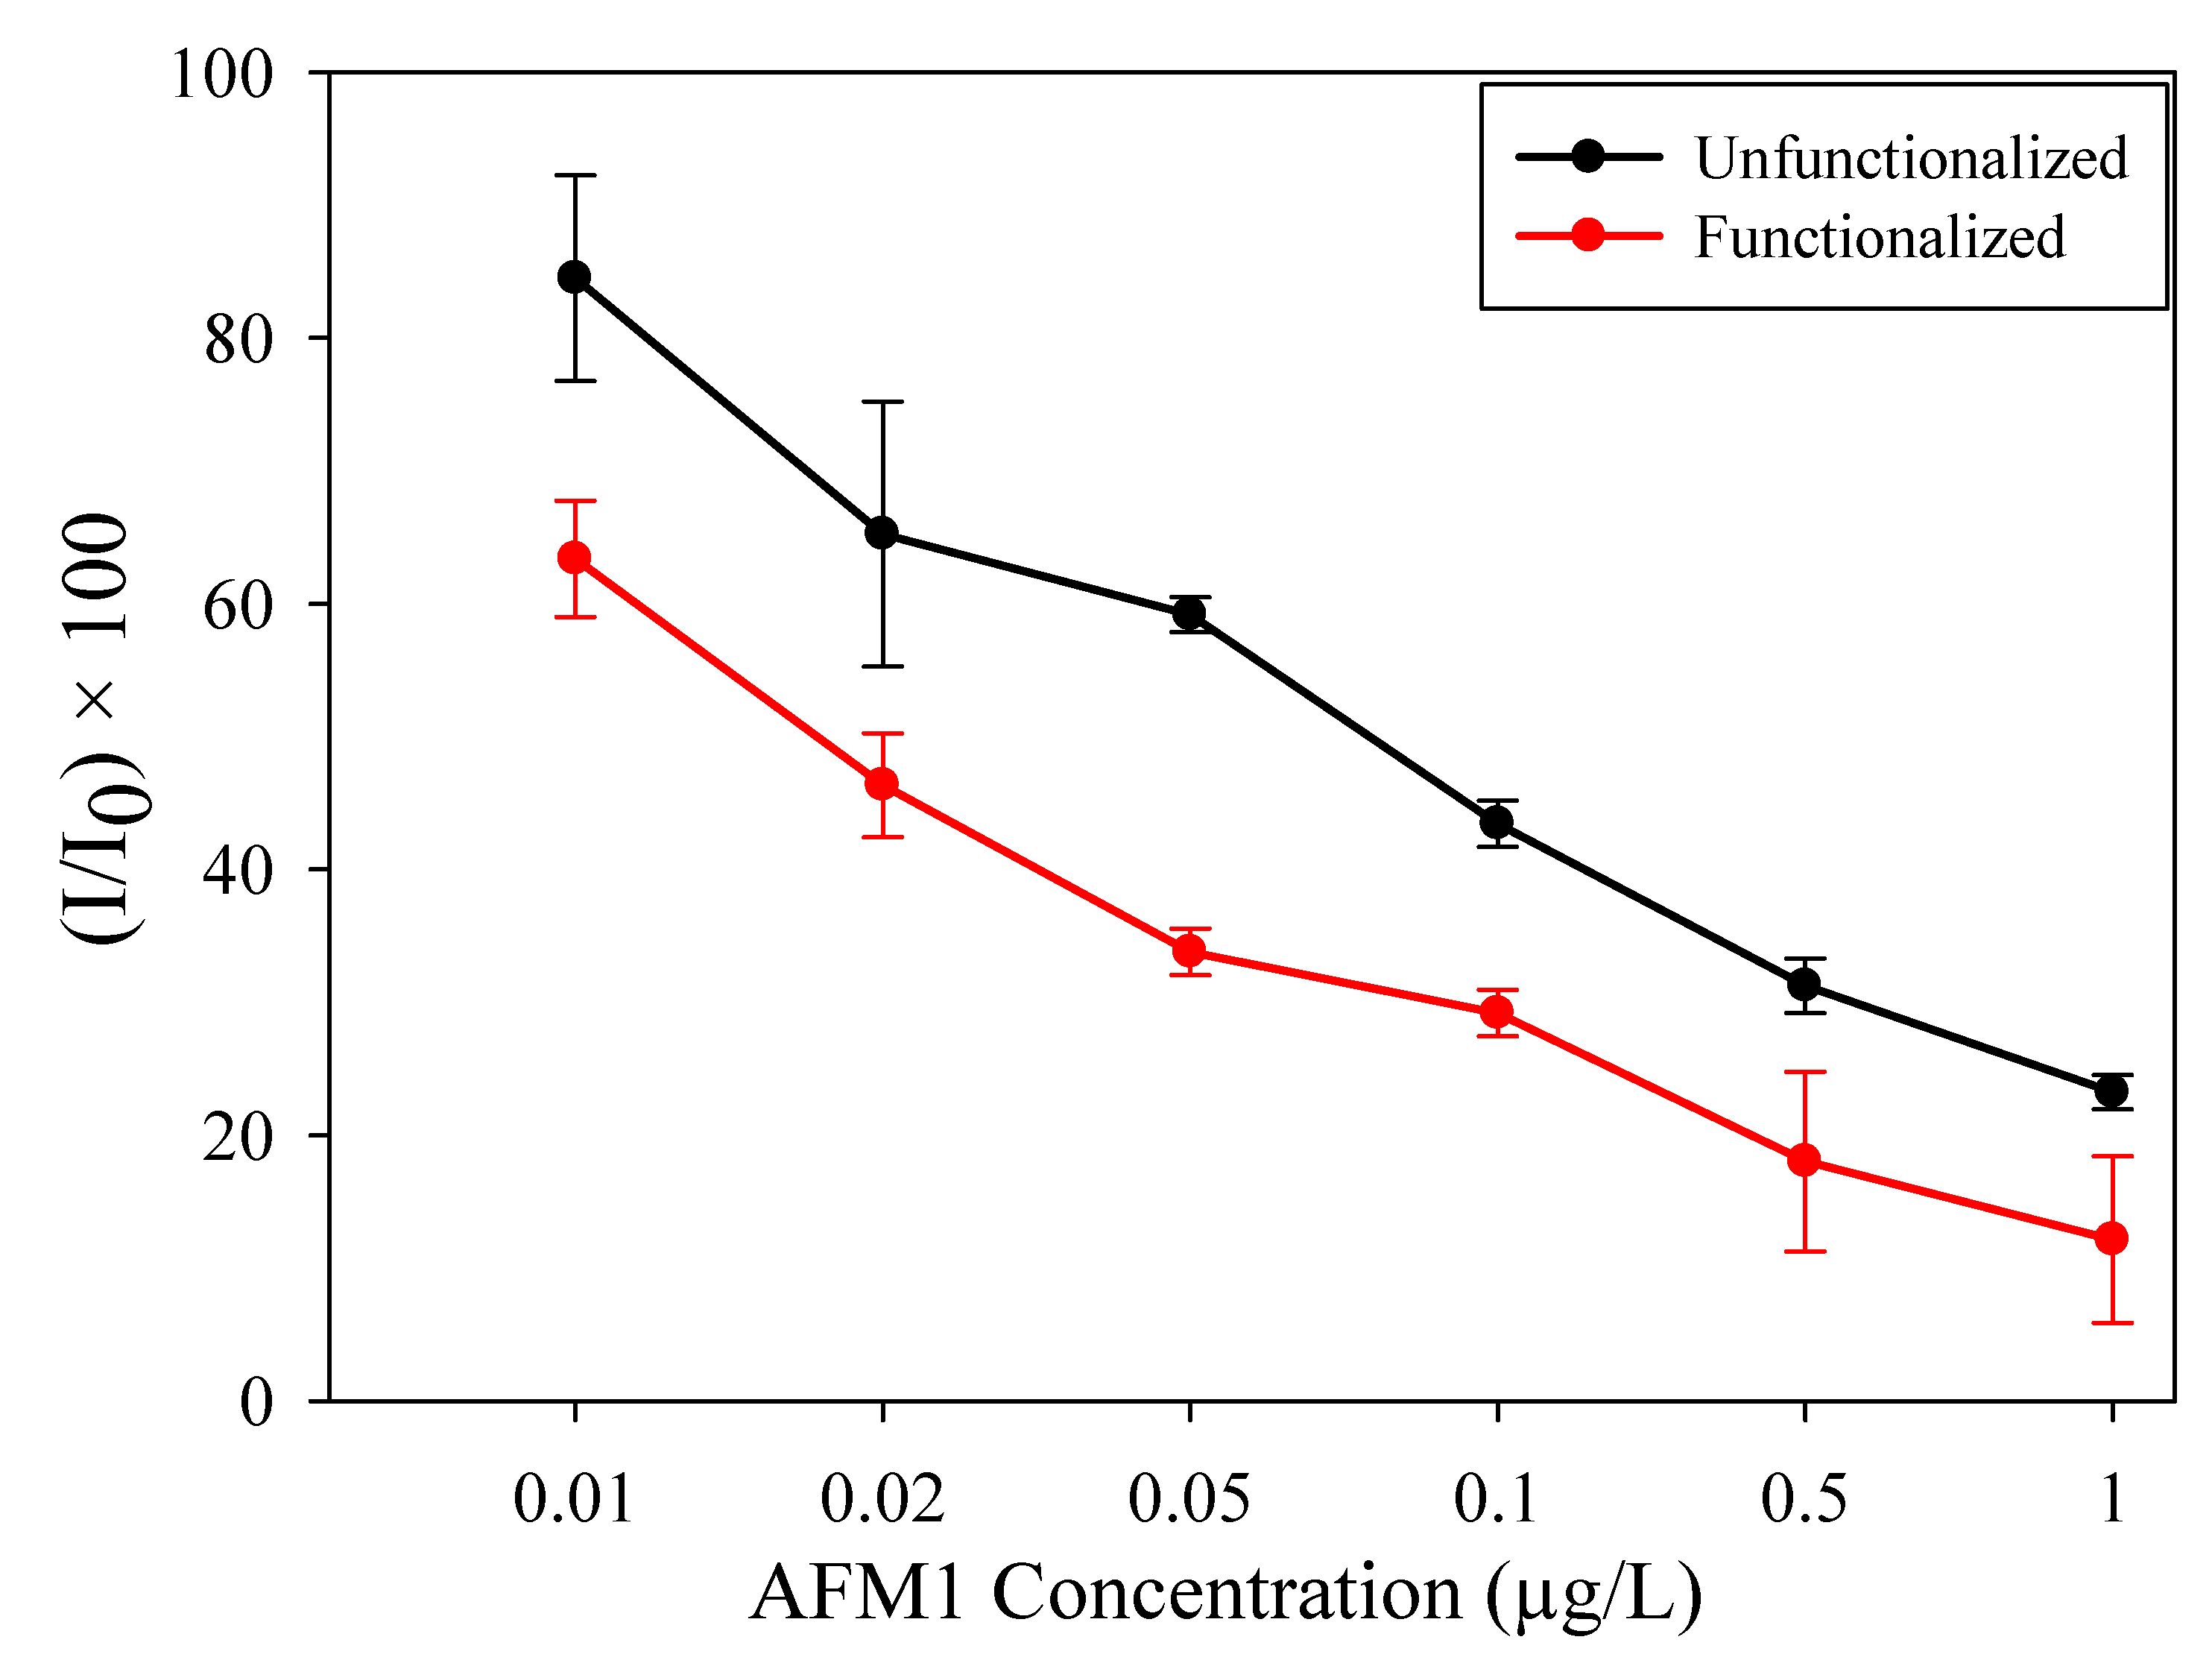
| AFM1 Concentration (µg/L) | Unfunctionalized | Functionalized | ||||
|---|---|---|---|---|---|---|
| Generated Current (µA) | Normalized Current (A/A0) | SD | Generated Current (µA) | Normalized Current (A/A0) | SD | |
| 0.00 | −61.1 | 100.0 | 1.43 × 10⁻⁵ | −92.1 | 100.0 | 1.8 × 10⁻⁵ |
| 0.01 | −52.1 | 84.5 | 3.3 × 10⁻⁵ | −63.2 | 63.4 | 1.05 × 10⁻⁵ |
| 0.02 | −41.4 | 67.7 | 9.37 × 10⁻⁶ | −46.1 | 46.4 | 1.08 × 10⁻⁵ |
| 0.05 | −39.0 | 63.8 | 1.88 × 10⁻⁵ | −33.8 | 33.8 | 8.14 × 10⁻⁶ |
| 0.1 | −26.9 | 44.0 | 1.29 × 10⁻⁵ | −30.2 | 30.2 | 1.28 × 10⁻⁵ |
| 0.5 | −20.8 | 34.1 | 1.11 × 10⁻⁵ | −16.2 | 18.0 | 5.47 × 10⁻⁶ |
| 1.0 | −15.2 | 24.8 | 2.49 × 10⁻⁵ | −13.2 | 12.1 | 2.31 × 10⁻⁶ |
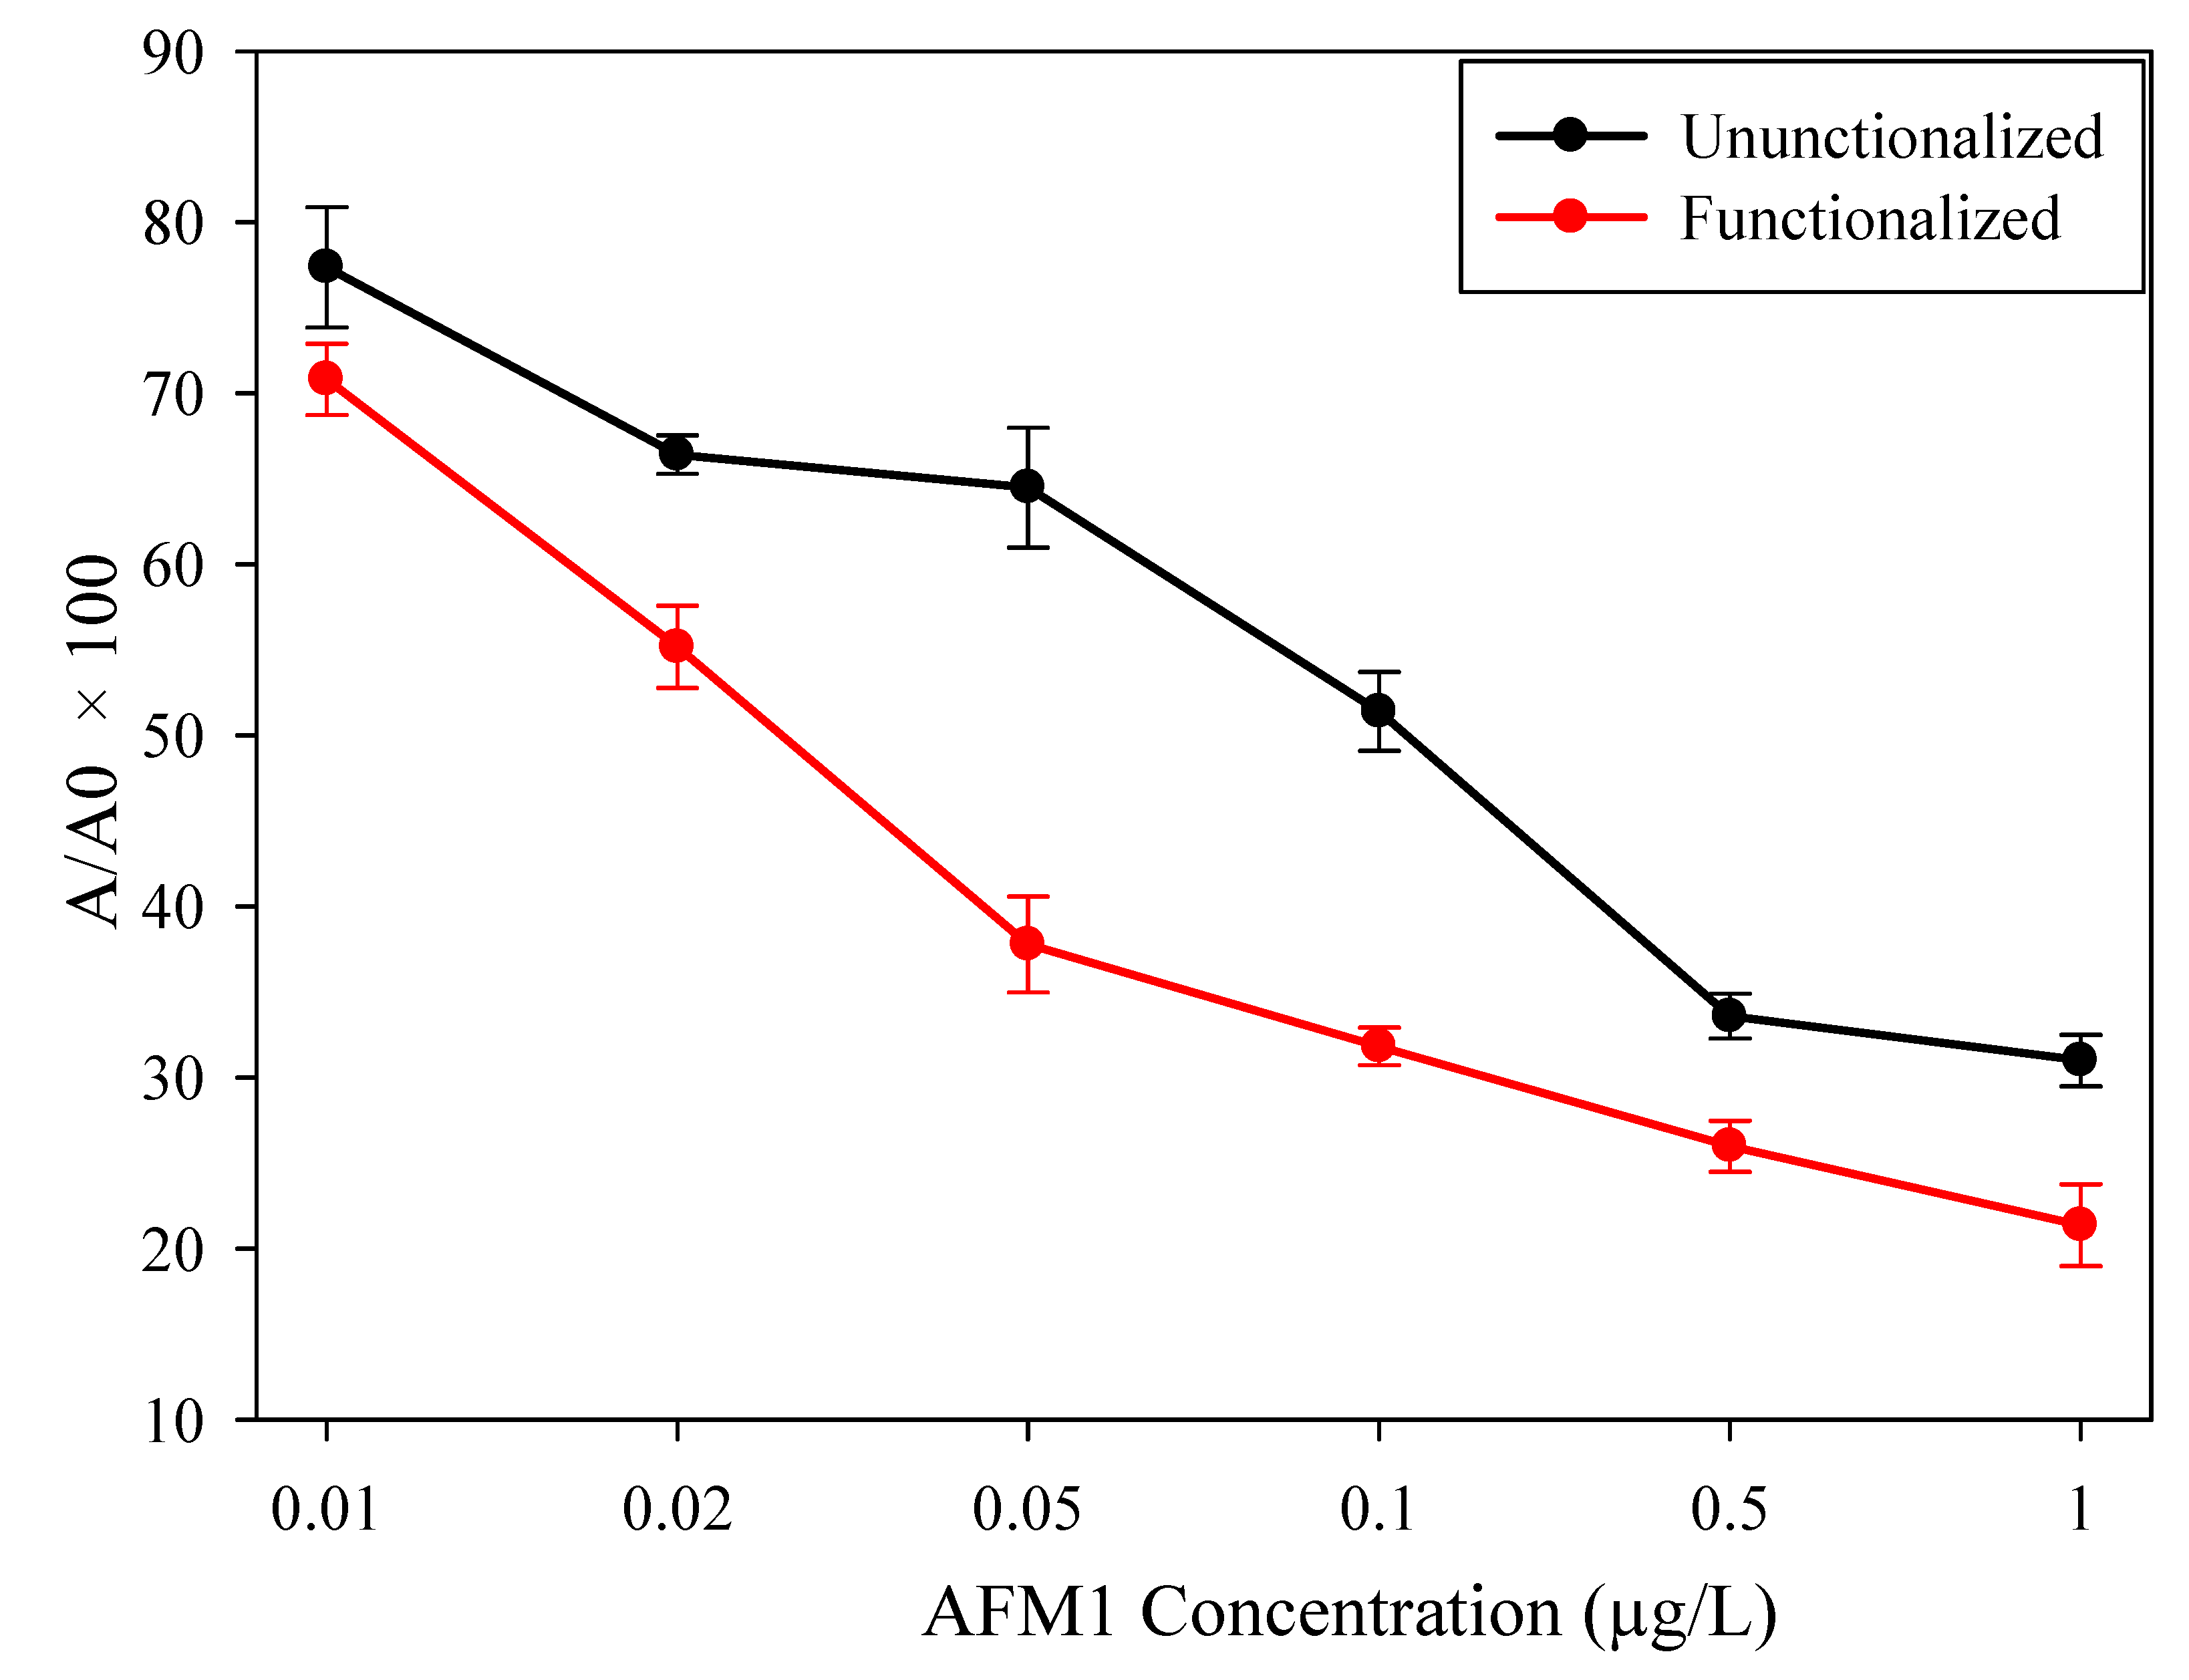
| AFM1 Concentration (µg/L) | Unfunctionalized | Functionalized | ||||
|---|---|---|---|---|---|---|
| Generated Current (µA) | Normalized Current | STD | Generated Current (µA) | Normalized Current | STD | |
| 0.00 | −93.2 | 100.0 | 3.52 × 10⁻⁵ | −90.8 | 100.0 | 2.08 × 10⁻⁵ |
| 0.01 | −72.1 | 78.3 | 1.13 × 10⁻⁶ | −64.3 | 71.2 | 3.17 × 10⁻⁵ |
| 0.02 | −61.9 | 66.5 | 9.83 × 10⁻⁸ | −50.1 | 45.0 | 7.89 × 10⁻⁶ |
| 0.05 | −60.1 | 64.5 | 4.47 × 10⁻⁶ | −34.3 | 37.9 | 4.84 × 10⁻⁵ |
| 0.1 | −47.9 | 51.4 | 1.18 × 10⁻⁵ | −28.9 | 31.9 | 2.15 × 10⁻⁵ |
| 0.5 | −31.3 | 33.6 | 4.81 × 10⁻⁷ | −23.6 | 25.2 | 1.27 × 10⁻⁶ |
| 1.0 | −28.9 | 31.0 | 6.65 × 10⁻⁷ | −19.4 | 21.4 | 2.73 × 10⁻⁵ |
© 2019 by the authors. Licensee MDPI, Basel, Switzerland. This article is an open access article distributed under the terms and conditions of the Creative Commons Attribution (CC BY) license (http://creativecommons.org/licenses/by/4.0/).
Share and Cite
Abera, B.D.; Falco, A.; Ibba, P.; Cantarella, G.; Petti, L.; Lugli, P. Development of Flexible Dispense-Printed Electrochemical Immunosensor for Aflatoxin M1 Detection in Milk. Sensors 2019, 19, 3912. https://doi.org/10.3390/s19183912
Abera BD, Falco A, Ibba P, Cantarella G, Petti L, Lugli P. Development of Flexible Dispense-Printed Electrochemical Immunosensor for Aflatoxin M1 Detection in Milk. Sensors. 2019; 19(18):3912. https://doi.org/10.3390/s19183912
Chicago/Turabian StyleAbera, Biresaw Demelash, Aniello Falco, Pietro Ibba, Giuseppe Cantarella, Luisa Petti, and Paolo Lugli. 2019. "Development of Flexible Dispense-Printed Electrochemical Immunosensor for Aflatoxin M1 Detection in Milk" Sensors 19, no. 18: 3912. https://doi.org/10.3390/s19183912
APA StyleAbera, B. D., Falco, A., Ibba, P., Cantarella, G., Petti, L., & Lugli, P. (2019). Development of Flexible Dispense-Printed Electrochemical Immunosensor for Aflatoxin M1 Detection in Milk. Sensors, 19(18), 3912. https://doi.org/10.3390/s19183912