Article

Real-Time Ozone Sensor Based on Selective Oxidation of Methylene Blue in Mesoporous Silica Films

1
Département de Métrologie des Polluants, Institut National de Recherche et de Sécurité (INRS), 54500 Vandœuvre-lès-Nancy, France
2
Laboratoire de Chimie Physique et Microbiologie pour les Matériaux et l’Environnement (LCPME), UMR 7564 CNRS-Université de Lorraine, 405 rue de Vandœuvre, 54600 Villers-lès-Nancy, France
*
Authors to whom correspondence should be addressed.
Sensors 2019, 19(16), 3508; https://doi.org/10.3390/s19163508
Submission received: 9 July 2019 / Revised: 29 July 2019 / Accepted: 8 August 2019 / Published: 10 August 2019
(This article belongs to the Special Issue Gas Sensors and Smart Sensing Systems)

Abstract

:
Sensitive and selective personal exposure monitors are needed to assess ozone (O3) concentrations in the workplace atmosphere in real time for the analysis and prevention of health risks. Here, a cumulative gas sensor using visible spectroscopy for real-time O3 determination is described. The sensing chip is a mesoporous silica thin film deposited on transparent glass and impregnated with methylene blue (MB). The sensor is reproducible, stable for at least 50 days, sensitive to 10 ppb O3 (one-tenth of the occupational exposure limit value in France, Swiss, Canada, U.K., Japan, and the USA) with a measurement range tested up to 500 ppb, and insensitive to NO2 and to large variation in relative humidity. A model and its derivative as a function of time are proposed to convert in real time the sensor response to concentrations, and an excellent correlation was obtained between those data and reference O3 concentrations. This sensor is based on a relatively cheap sensing material and a robust detection system, and its analytical performance makes it suitable for monitoring real-time O3 concentrations in workplaces to promote a safer environment for workers.

1. Introduction

Ozone (O3) is a powerful oxidizing gas and a strong disinfectant used in different processes, including water treatment, gas purification, textile bleaching, and food industries. In workplaces, O3 is mainly emitted into the atmosphere from the processes of UV radiation and electric arc welding [1]. Another source of exposure in tertiary and service sectors is the extensive use of laser printers and photocopiers [2].
In France, the occupational exposure limits values (OELs) for O3 exposure are 100 ppb and 200 ppb for exposure times of 8 h and 15 min, respectively [3]. These values are consistent with other European or international OELs (see Table S1 in Supporting Information). At an O3 concentration exceeding OELs, exposure becomes hazardous to human health, causing headache, burning eyes, lung damage, and respiratory diseases such as asthma [4]. Therefore, it is necessary to monitor O3 concentrations in workplaces, using a personal monitor that provides real-time measurements of O3 exposure levels with high resolution in both time and concentration. Currently, chemical analysis techniques based on individual sampling on solid adsorbents or filters are used to determine concentrations of O3 [5,6,7,8,9], but delayed analysis of the samples in chemical laboratories is required. These techniques do not provide an alert in real time in the case of high exposure. Moreover, the obtained data are only average concentrations over extended periods.
Recently, numerous O3 sensors have been developed for incorporation into personal O3 samplers. For example, conductivity sensors based on a heated metal oxide semiconductor (HMOS), including ZnO, WO3, SnO2, In2O3, NiO, and CuO [10,11,12,13,14,15,16], have been used to detect O3. The majority of these sensors showed high stability of the baseline and fast response and recovery time with total reversibility. However, O3 sensors based on HMOS suffer from a lack of selectivity in the presence of other gaseous pollutants such as NO2 [17,18].
Electrochemical sensors have also been employed for monitoring air quality in occupational and environmental health applications [19]. They are characterized by their low cost, light weight, and high O3 sensitivity in the range of 5 ppb to 10 ppm. However, changes in relative humidity (RH) can generate a significant variation in the signal of the sensor [20]. Besides this, cross-sensitivity with NO2 remains a major problem to eliminate in the case of electrochemical O3 sensors [21].
Gravimetric sensors based on a quartz crystal microbalance (QCM) coating with 1,4-polybutadiene have shown good performance for indoor O3 applications [22]. The polybutadiene–QCM exhibits an irreversible reaction with O3 with a detection limit below 10 ppb [23] and insignificant interference from NO2, formaldehyde, CO, and phenol. However, polymer-coated quartz was found to be unstable with time [24].
Several UV-based O3 monitors have been developed, such as the 2B Technology 205 Dual Beam Ozone Monitor [25] and the Thermo Scientific Model 49i [26]. These instruments exhibit high sensitivity, selectivity, and reliability. However, the size, cost, and regular calibration needs prevent their use for real-time measurements when portability of the equipment is required. A highly portable O3 monitor called the Personal Ozone Monitor (POM) was recently developed by 2B Technologies [27]. This device based on UV absorbance exhibits accurate (≤2 ppb) O3 measurements and a detection limit of 4.5 ppb. However, the POM detects O3 concentrations less precisely in the presence of other pollutants absorbing in the UV domain, such as toluene, ethylbenzene, and xylenes, and for that reason it would be interesting to perform ozone measurements in the visible wavelength range [28].
Various chemiluminescent sensors have been developed for measuring O3 concentrations in ambient air. Most of these devices are based on the light-emitting reaction of O3 in the presence of an excess of ethylene or NO gas [29,30]. They present a detection limit of 1 ppb, but these devices require a continuous flow of gas supply from a pressurized cylinder, which limits the portability of these instruments. On the other hand, a continuous monitoring system for O3 based on chemiluminescent dye solution has been used. It utilizes ethanol solutions of rhodamine B and gallic acid bubbled with ozonized air. Rhodamine B shows a high specificity for O3 and a detection limit in the ppm range. However, the high level of noise resulting from the bubble systems is a drawback to using this method for personal monitoring [31].
Besides these, simple and compact O3 sensor devices have been developed based on dye fading colorimetry [32]. These sensors use materials that fade upon reaction with O3 and whose concentration can be quantified by absorbance or reflectance spectroscopy, such as curcumin and indigo carmine [33,34,35]. An accumulative and passive O3 sensor was proposed by Yasuko Yamada [36] based on porous glass impregnated with indigo carmine. The detection limit of this sensor chip is 3 ppb for a 1 h exposure, but cross-sensitivity towards 10 ppb of NO2 was observed.
Our aim is to develop an affordable, simple, and portable sensor for O3 monitoring in workplaces, characterized by high sensitivity and selectivity in the presence of other gaseous pollutants. For that purpose, we chose methylene blue (MB), a blue cationic dye that belongs to the phenothiazine family. In previous studies, MB was used to monitor humidity [37,38,39]. The degradation of MB in aqueous solution by O3 was studied by Zhang et al. [40] and by Al Jibouri et al. [41]. In addition, MB dye immobilized on Nafion® film was used for the detection of hydroxyl radicals in the atmosphere [42] but not applied to O3 monitoring. In this work, a real-time O3 sensor is elaborated by using visible spectroscopy as a measurement method and MB adsorbed on mesoporous silica thin film as the sensing material (Figure 1). A test bench was developed and implemented to produce controlled atmospheres for sensor evaluation. The sensor stability, sensitivity, and selectivity to O3 were investigated. Finally, a model and its derivative as a function of time were evaluated to convert in real time the sensor response to a concentration.

2. Materials and Methods

2.1. Chemicals and Reagents

All chemicals were used without further purification: tetraethoxysilane (TEOS, 98%, Alfa Aesar, Thermo Fisher, kandel, Germany), cetyltrimethylammonium bromide (CTAB, 99%, Acros, Thermo Fisher Scientific, Geel, Belgium), absolute ethanol (C2H5OH, 99.8%, Sigma-Aldrich, Merck, St. Quentin Fallavier, France), and hydrochloric acid (HCl, 36%, Prolabo, VWR, Paris, France) were used for the preparation of mesoporous silica films on glass microscope slides (Rogo Sampaic) previously washed with sodium hydroxide (NaOH, 1 M, Alfa Aesar, Thermo Fisher, kandel, Germany). Methylene blue (>82%, Fluka, Fisher Scientific, Illkirch, France) was used as the O3 sensing material. All solutions were prepared with high-purity water (18 MΩ.cm) from a Millipore Milli-Q® water purification system (Millipore SAS, Molsheim, France).

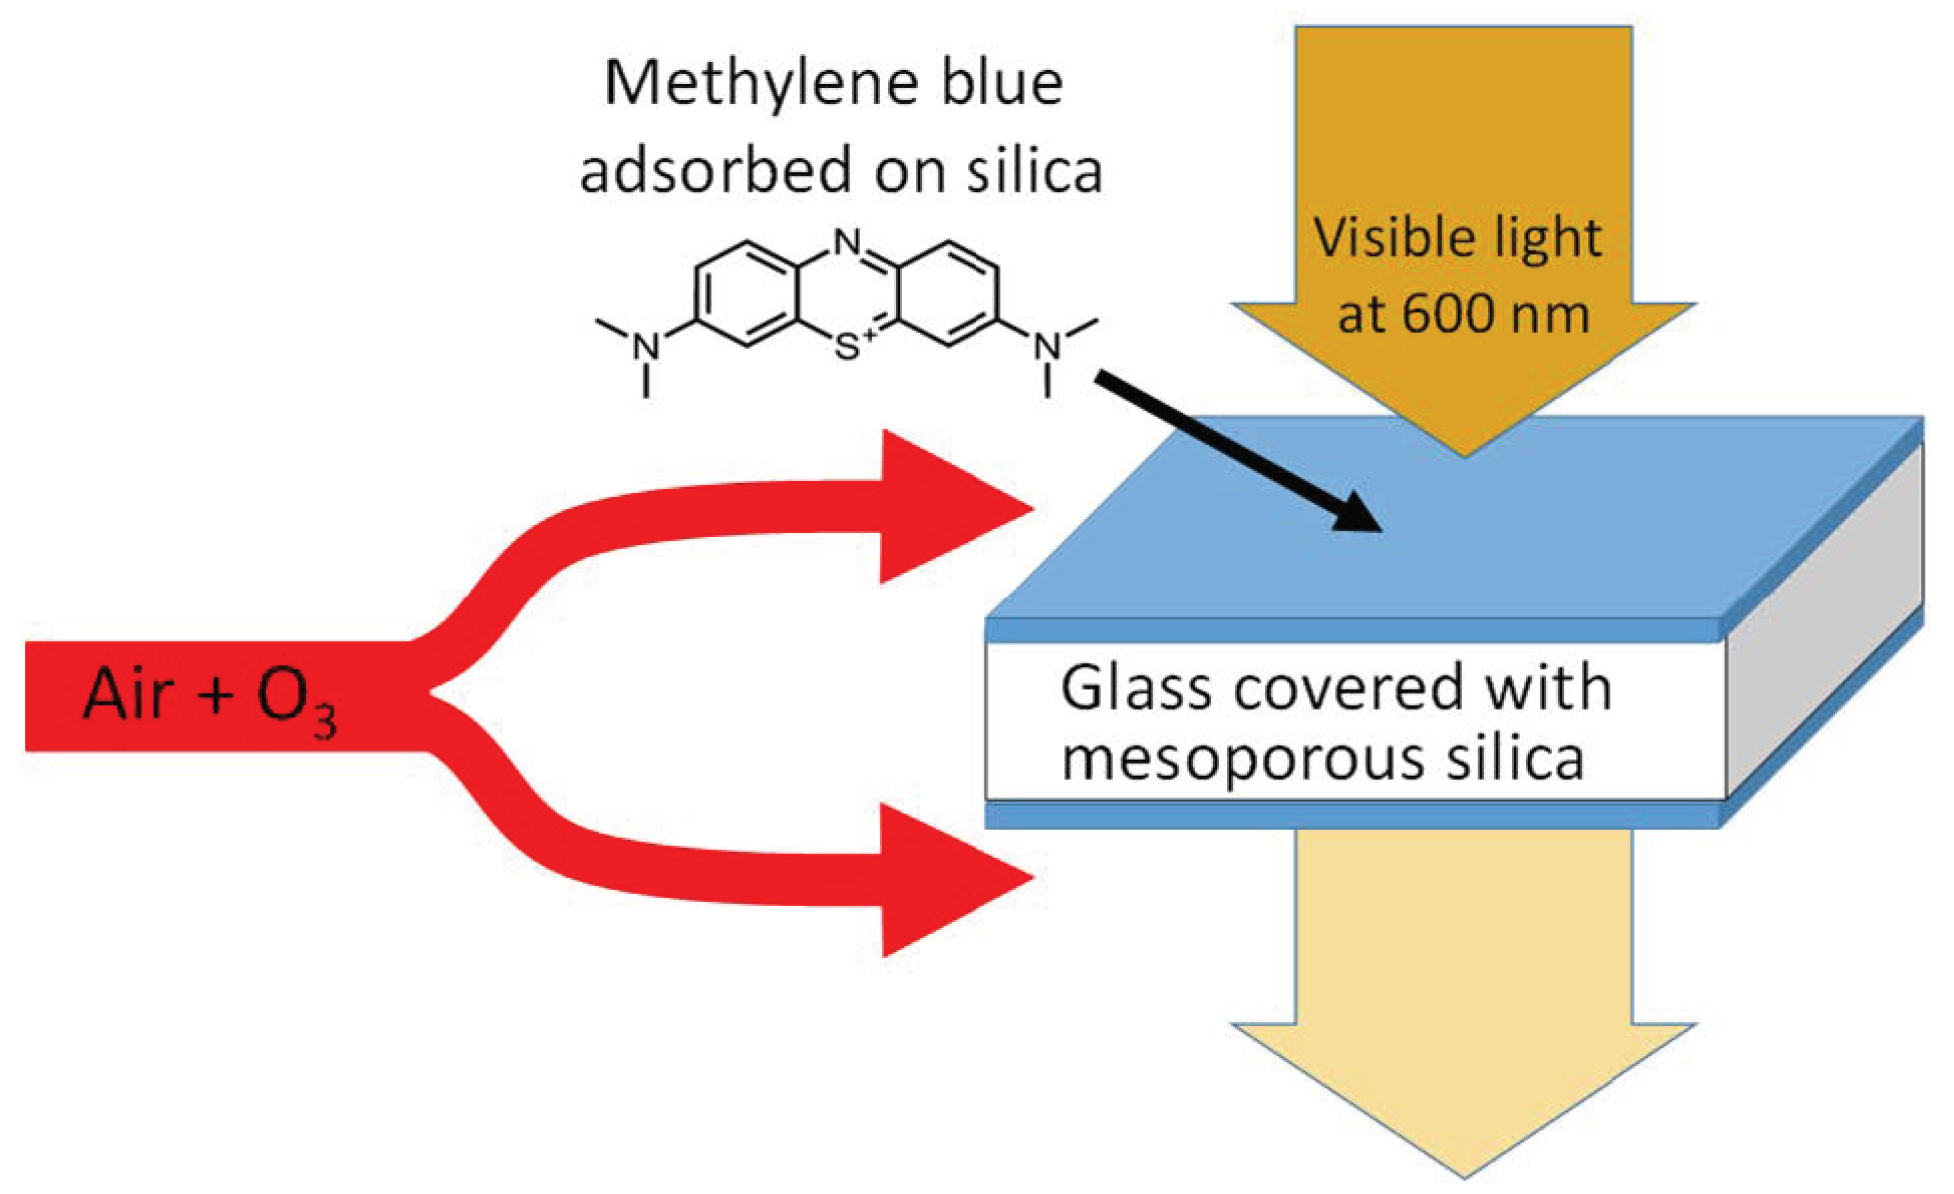
2.2. Sensor Chip Preparation

Mesoporous silica was prepared with CTAB as the surfactant template and according to the procedure previously reported by Etienne et al. [43]. The initial solution was prepared as follows: A quantity of 0.51 g of CTAB was dissolved in 0.9 g of water and 11.66 g of ethanol with stirring for 30 min at room temperature. Then, 2.23 g of TEOS was slowly added into that solution. After that, 0.04 ml of HCl (1 mol L−1) was directly added to the mixture. The final reactant molar ratios were 1TEOS/20C2H5OH/5H2O/0.004HCl/0.14CTAB. The solution was aged at room temperature in sealed vessels for three days before deposition on glass plates of 1 mm thickness. Prior to use, substrates were shaped into squares of 8 mm × 9 mm and washed successively with a 1 mol L−1 solution of NaOH and deionized water. The mesoporous silica film was deposited on glass by dip-coating at a withdrawal speed of 2.5 mm s−1 and under 50% RH. Then, the film was stabilized at 130 °C for 48 h and calcined at 450 °C for 5 h before use. Figure S1 reports the typical mesostructure that was achieved. In addition, the film thickness determined by profilometry was 181 ± 11 nm (N = 8) (Table S2). Methylene blue was absorbed on mesoporous silica by immersion for 1 min into a 3 mmol L−1 solution of MB, followed by rinsing with deionized water. After drying at room temperature, a blue film was obtained. The sensing chips were stored in plastic vessels laminated with aluminum.

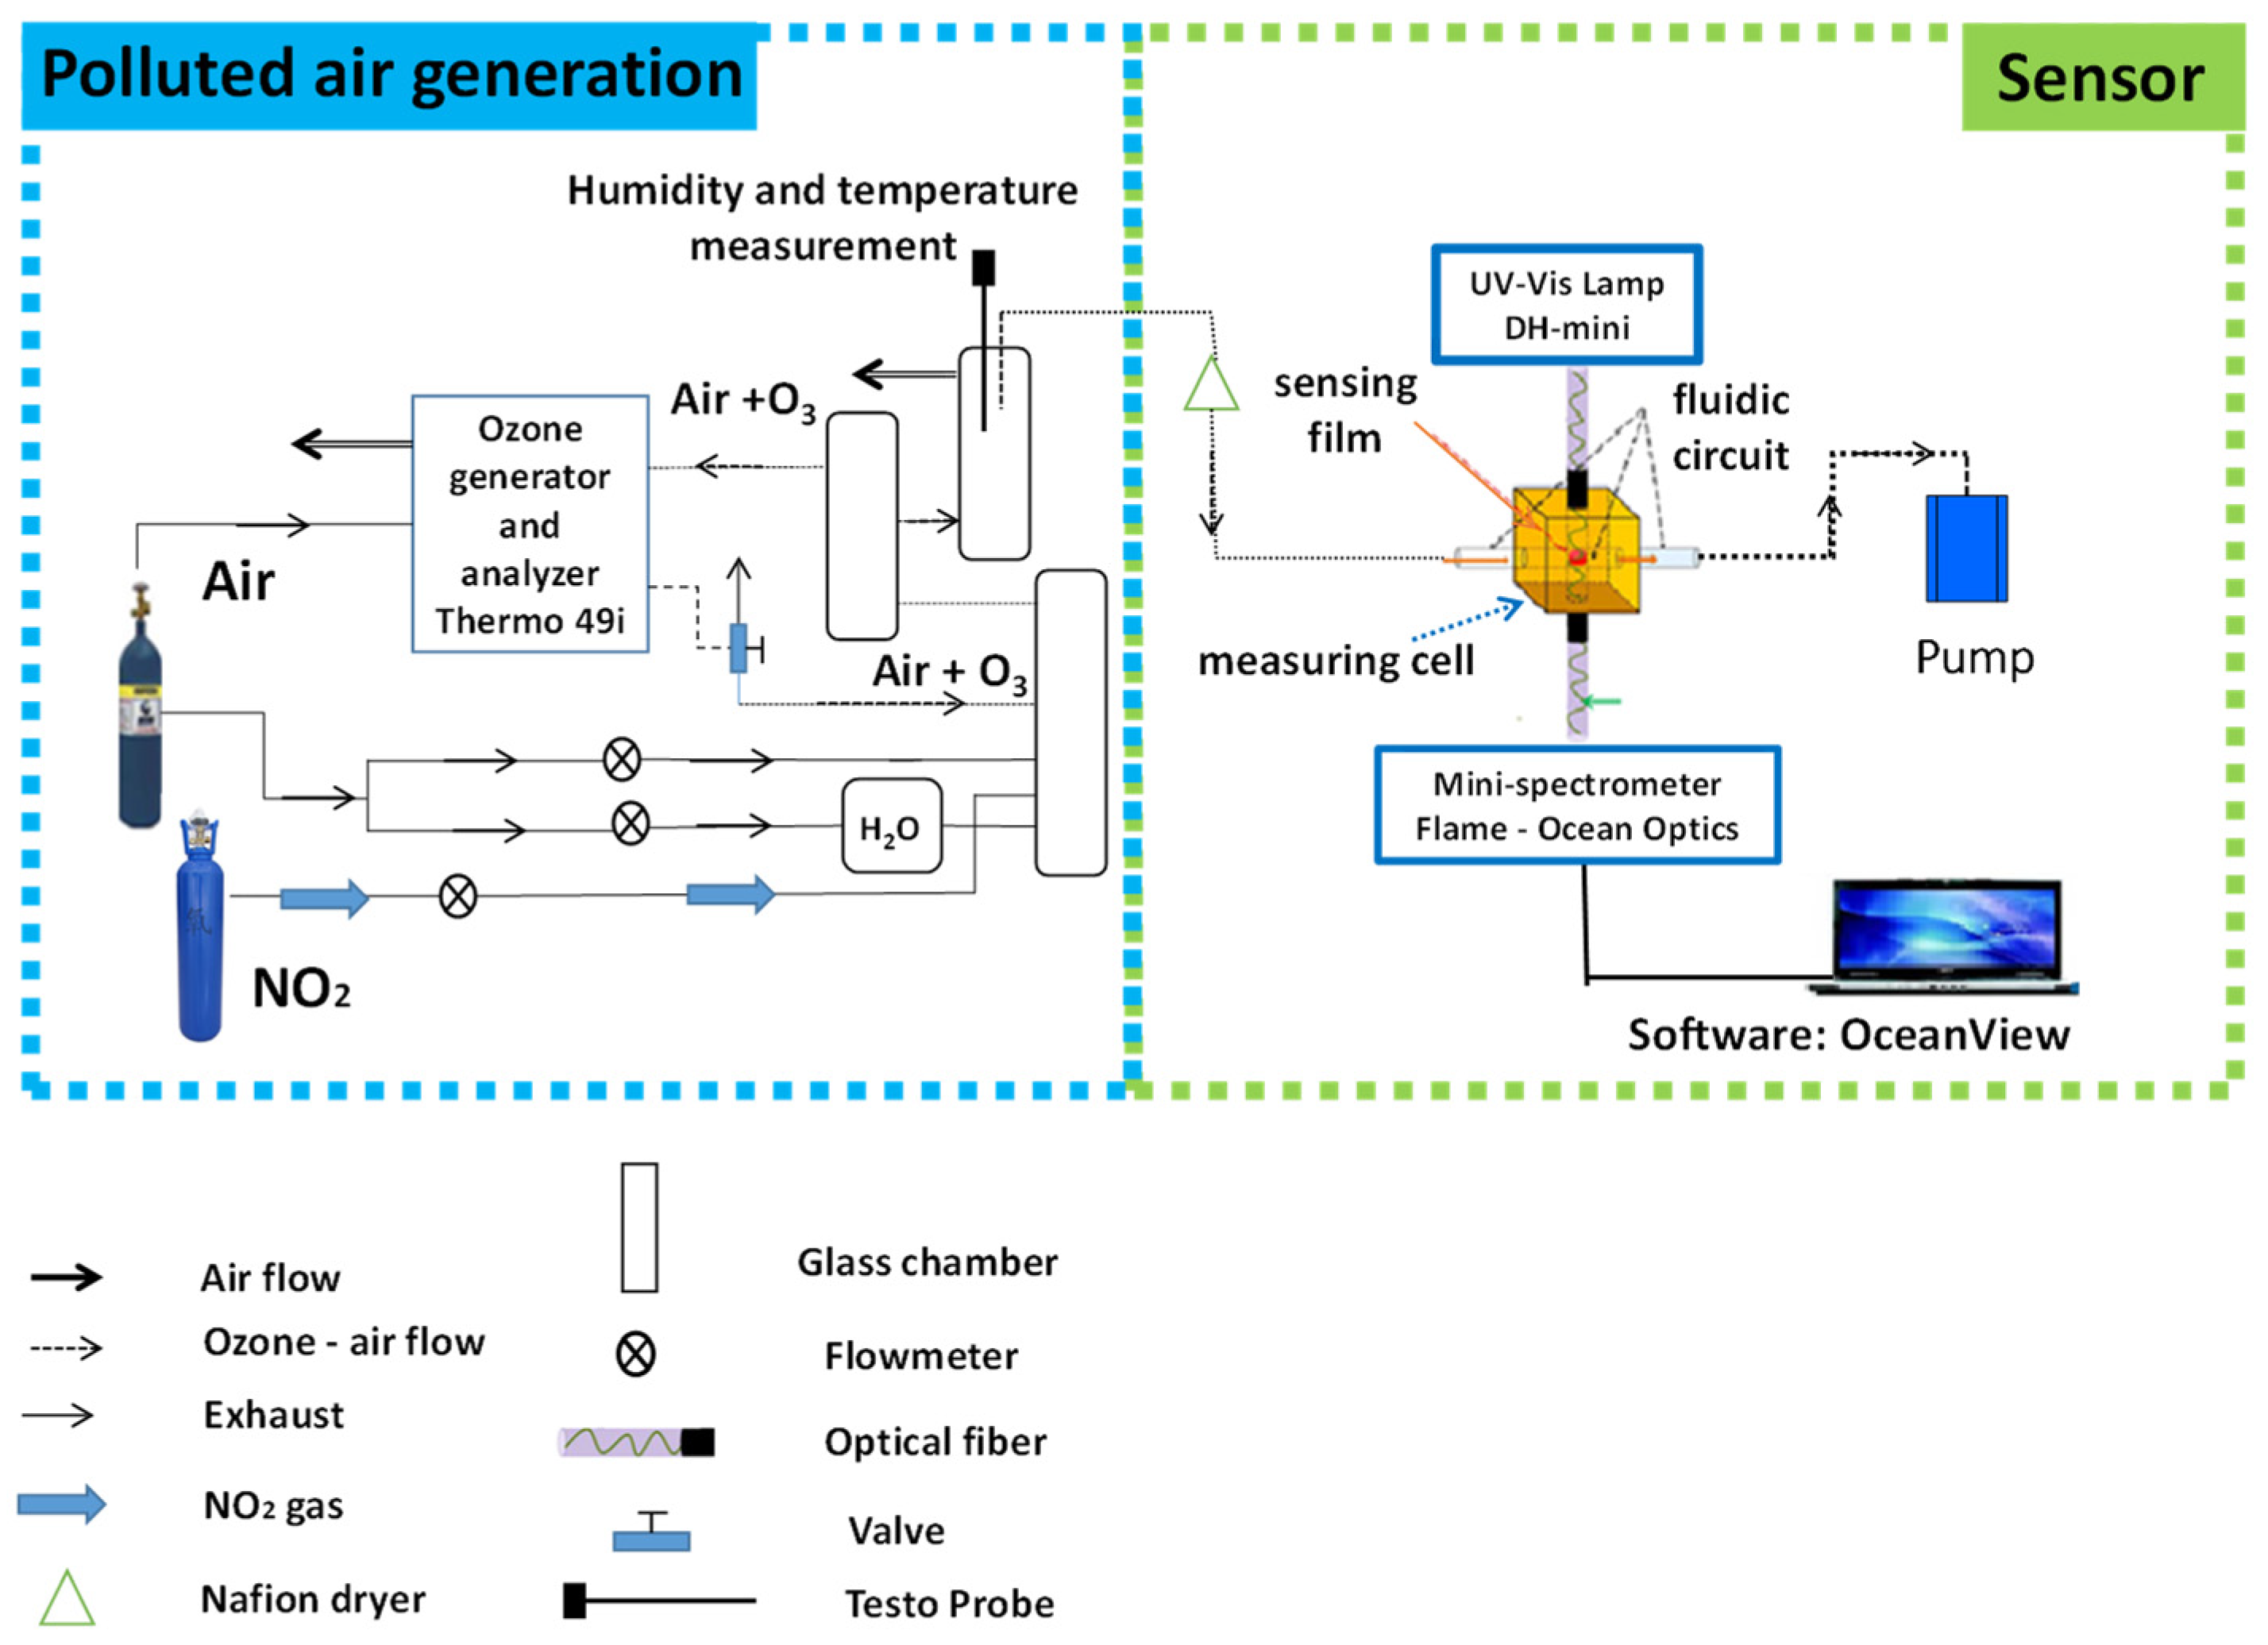
2.3. Experimental Setup

The setup used in this work is detailed in Figure 2. It was composed of a polluted air generator connected to the sensor. Gas mixtures containing different O3 concentrations were prepared in a cylindrical glass chamber (1.5 L in volume). O3 was generated by passing a flow of dry air through an O3 generator (Thermo Scientific Model 49i UV Photometric O3 Analyzer); the O3 monitor was also used for the control of O3 concentrations in all experiments. Two mass flow controllers were used to dilute O3 gas in purified air in order to achieve lower O3 concentrations (10–100 ppb) in order to be in the range of the concentrations usually measured in workplaces. Humidification to various degrees was controlled by bubbling an adjustable portion of the dilution air through a water bubbler. A Testo435 portable sensor was placed in the glass chamber to monitor the temperature and the relative humidity. The developed sensor was inserted into a 8 mm width and 1 mm thickness slot within a brass measuring cell [44] under different O3 concentrations. A pump was used to ensure continuous flow of O3 between 50 and 400 mL min−1 inside the measuring cell. The pump was connected to the sampling cell with a Teflon tube. The measuring cell was exposed continuously to visible light emitted from a DH-mini Ocean Optics source. A portable Ocean Optics Flame mini-spectrometer with optical fiber was employed to measure in situ material absorption at a fixed wavelength during the O3 exposure trials. the absorption signal was recorded using OceanView spectroscopy software. An interference study with NO2 was carried out using the same experimental setup previously described. Known concentrations of NO2 were directly generated from a calibration gas cylinder (GasDetect, 27 ppm) and delivered to the mixing glass chamber via Teflon tubing. In addition, a calibrated mass flow controller was used to dilute NO2 in purified air.

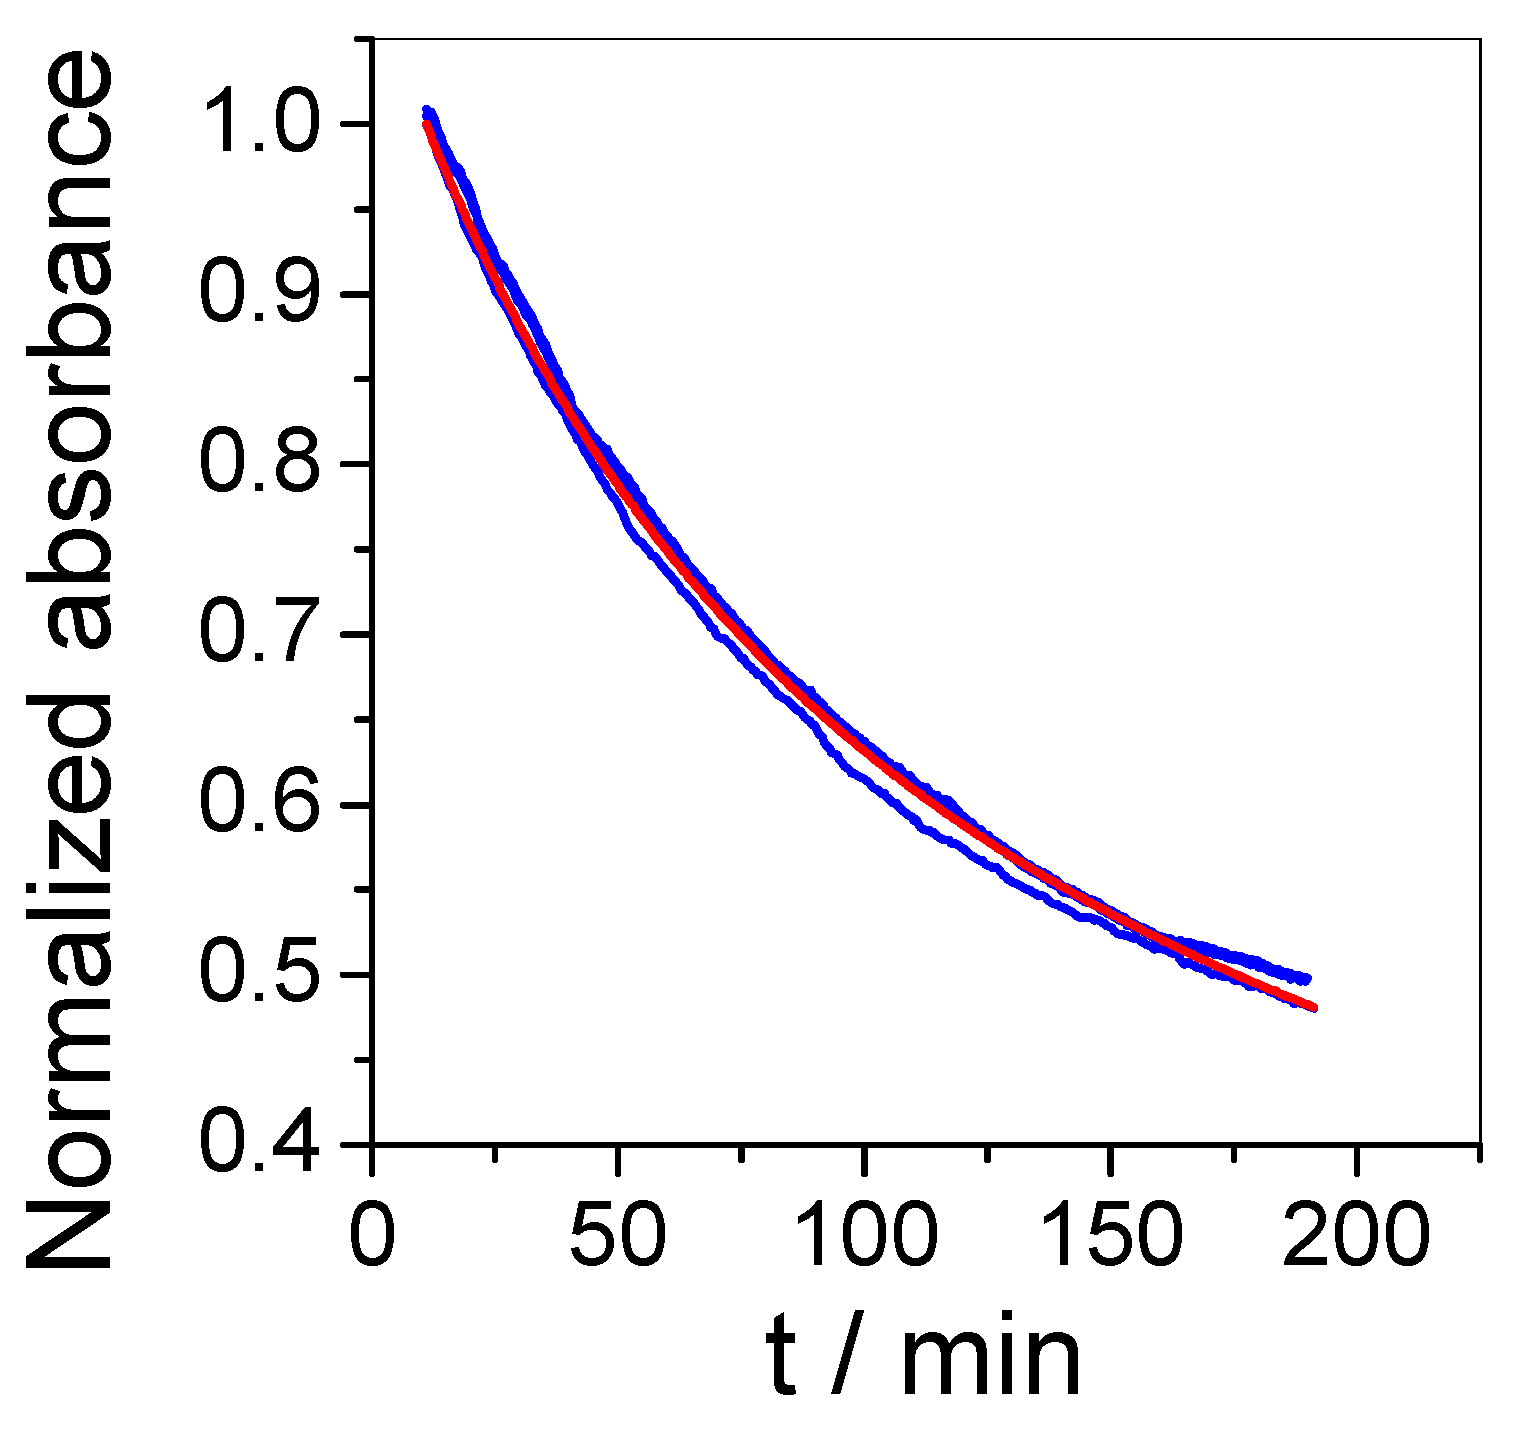
2.4. Mathematical Model

A simple mathematical model was applied to fit with the experimental results by using Equation (1) derived from the pseudo-second-order kinetic equation [45]. This equation takes into account both the rate-limited surface reaction and mass transfer by diffusion in a complex medium:
A t = [ ( A t 0 A i n f ) ( 1 + k 0 [ O 3 ] t ( A t 0 A i n f ) ) ] +   A i n f
where A t represents the absorbance at sampling time t (min); A t 0 is the initial absorbance at initial time t 0 (min); A i n f is the absorbance after an infinite O3 sampling time; [ O 3 ] represents the ozone concentration measured by the O3 analyzer (ppb); and k 0 is the rate constant of the reaction (ppb−1 min−1).
Moreover, the model previously presented was also applied to predict absorbance variations during O3 exposure at different concentrations. In this case, Equation (2) was used, where A c a l c represents the calculated absorbance at sampling time t.
A c a l c = [ ( A t 0 A i n f ) ( 1 + k 0 ( t t 0 ) ( A t 0 A i n f ) [ O 3 ] ) ] +   A i n f
Additionally, the O3 concentration detected by the developed sensor was calculated by applying Equation (3):
C s e n s o r = [ ( A t 0 A t ) ( A t A i n f ) k 0 ( A t 0 A i n f ) ( t t 0 ) ]
where C s e n s o r represents the O3 concentration detected by the sensor (ppb).
Finally, we also evaluated the application of the derivative as a function of time (Equation (4)) for concentration determination.
( A ( t ) ) t = k 0 ( A t 0 A i n f ) 2 C s e n s o r ( 1 + k 0 ( A t 0 A i n f ) ( t t 0 ) C s e n s o r ) 2

3. Results and Discussion

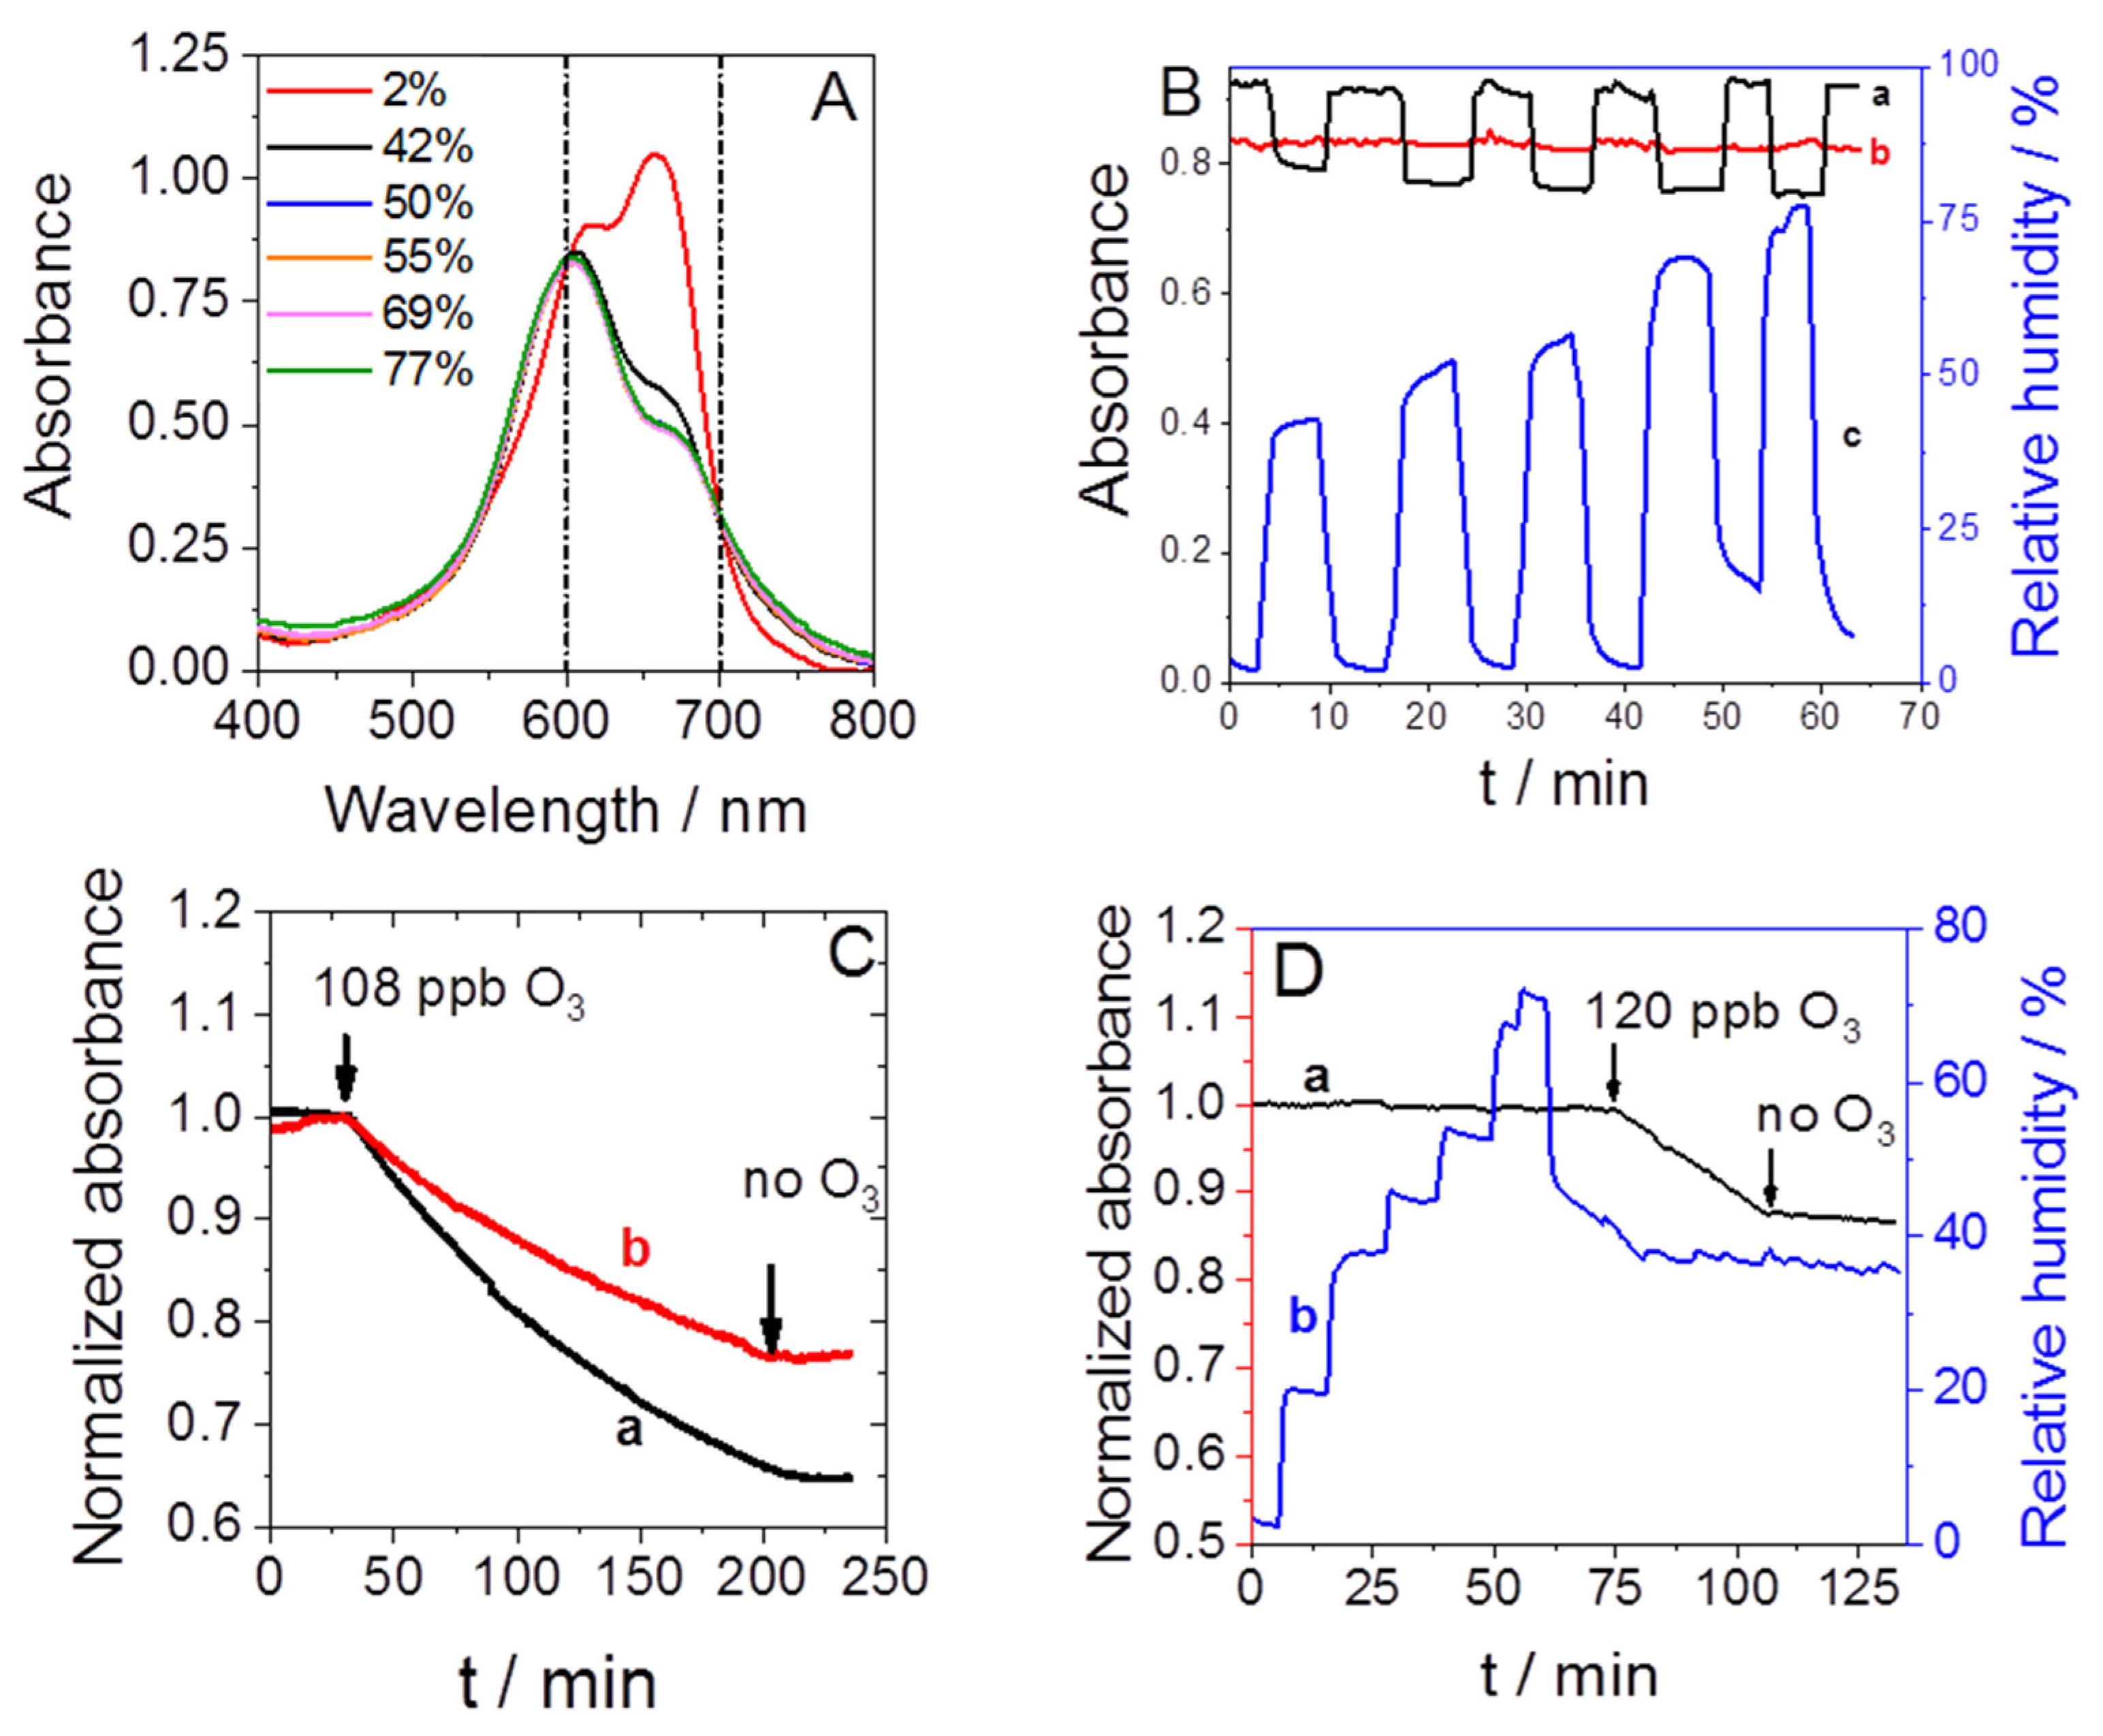
3.1. Preliminary Studies

The visible spectra of methylene blue adsorbed in mesoporous silica show two characteristic absorption peaks of MB at 620 and 665 nm (Figure 3A), similar to the literature [38]. Preliminary tests were performed to evaluate the sensor response as a function of humidity. When the relative humidity was varied between 2% and 77%, a significant decrease in absorbance was observed at these two wavelengths (Figure 3A), in agreement with previous reports [46]. On the contrary, the absorbance increased at 560 nm and at wavelengths higher than 700 nm. Two isosbestic points were found at 600 and 700 nm for which negligible absorbance variation was observed when the humidity was changed. Figure 3B demonstrates the critical influence of the wavelength on the sensitivity to humidity (see curve (c) for the amplitude of the relative humidity in this experiment). While the absorbance changed dramatically when the measurement was done at 620 nm (curve (a)), only limited variations in the absorbance were observed at 600 nm (curve (b)). So, it is possible, by working at 600 nm, to follow the absorbance of methylene blue in the presence of variable relative humidity.
However, humidity also affects the reaction rate of ozone with methylene blue. In another preliminary experiment done at 620 nm and at 50 mL min-1, the sensor was exposed to 108 ppb of O3 in the presence of 1% (Figure 3C, curve (a)) or 40% relative humidity (Figure 3C, curve (b)) for almost three hours. The sensor detected O3 in both conditions, but the absorbance decreased more rapidly in dry air than in humid air. We can model the sensor response with Equation (1), and the rate constant of MB discoloration (k0) allows a quantitative assessment of its sensitivity. In a humid atmosphere, the rate constant is 5.61 × 10⁻⁵ ppb-1 min−1, while it is almost 2 times higher in dry air at 1.08 × 10⁻⁴ ppb−1 min−1 (note that discoloration was homogenous over the all absorbance spectra of MB, so the conclusion of this set of experiments does not depend on the wavelength of measurement). The sensitivity of the sensor was achieved thanks to the reaction between MB adsorbed on porous silica and reactive oxygen species produced from O3 molecules diffusing inside the mesopores of the thin film. The mechanism involves the production of hydroxyl radicals [47]. Tertiary amines are converted to primary amines, and the central ring of the native molecule opens [48]. These reactions are probably responsible for the irreversible discoloration. At 40% relative humidity, the mesopores are partially filled with water [49] which slows down the transfer of the reactive species and modifies the conditions of these reactions. Two strategies can be considered at this step of the sensor development. First, absorbance and air humidity can be monitored simultaneously in order to adjust in real time the sensitivity of the sensor given by k0 during the measurement, so as to determine the O3 concentrations. The second strategy that we applied in this work is to significantly decrease the relative humidity in the air before analysis. This can be achieved by using an efficient gas dryer between the sampling source and the detection cell (see the Supplementary Information associated with Figure S2). Air containing 50% to 75% RH (Figure S2, curve (a)) was thereby dried to a level of humidity close to 5% (5.5 ± 1.6) in a single pass (Figure S2, curve (b)).
We applied this air drier in the following O3 exposure trials using a sampling rate of 350 mL min−1, and furthermore, all measurements were done at the wavelength of 600 nm, which is not sensitive to minor variations in relative humidity. Figure 3D reports one illustrative experiment, in which the sensor was exposed to various relative humidity levels between 2% and 72% before exposure for a duration of 30 min to 120 ppb of O3 at about 36% relative humidity. The normalized absorbance was stable as a function of time when the humidity was changed dramatically and decreased only when ozone was present in the analyzed air (first arrow at 74 min); it stopped decreasing when O3 was not present (second arrow at 106 min).
The response to O3 was reproducible and stable with time, as illustrated in Figure 4 which reports three measurements made in the presence of 120 ppb ozone and 36% relative humidity for three hours with sensors prepared from the same batch and analyzed at Days 1, 2, and 50. All measurements show good correlation with the model curve calculated using Equation (2) considering k0 = 8.1 × 10⁻⁵ ppb−1 min−1.

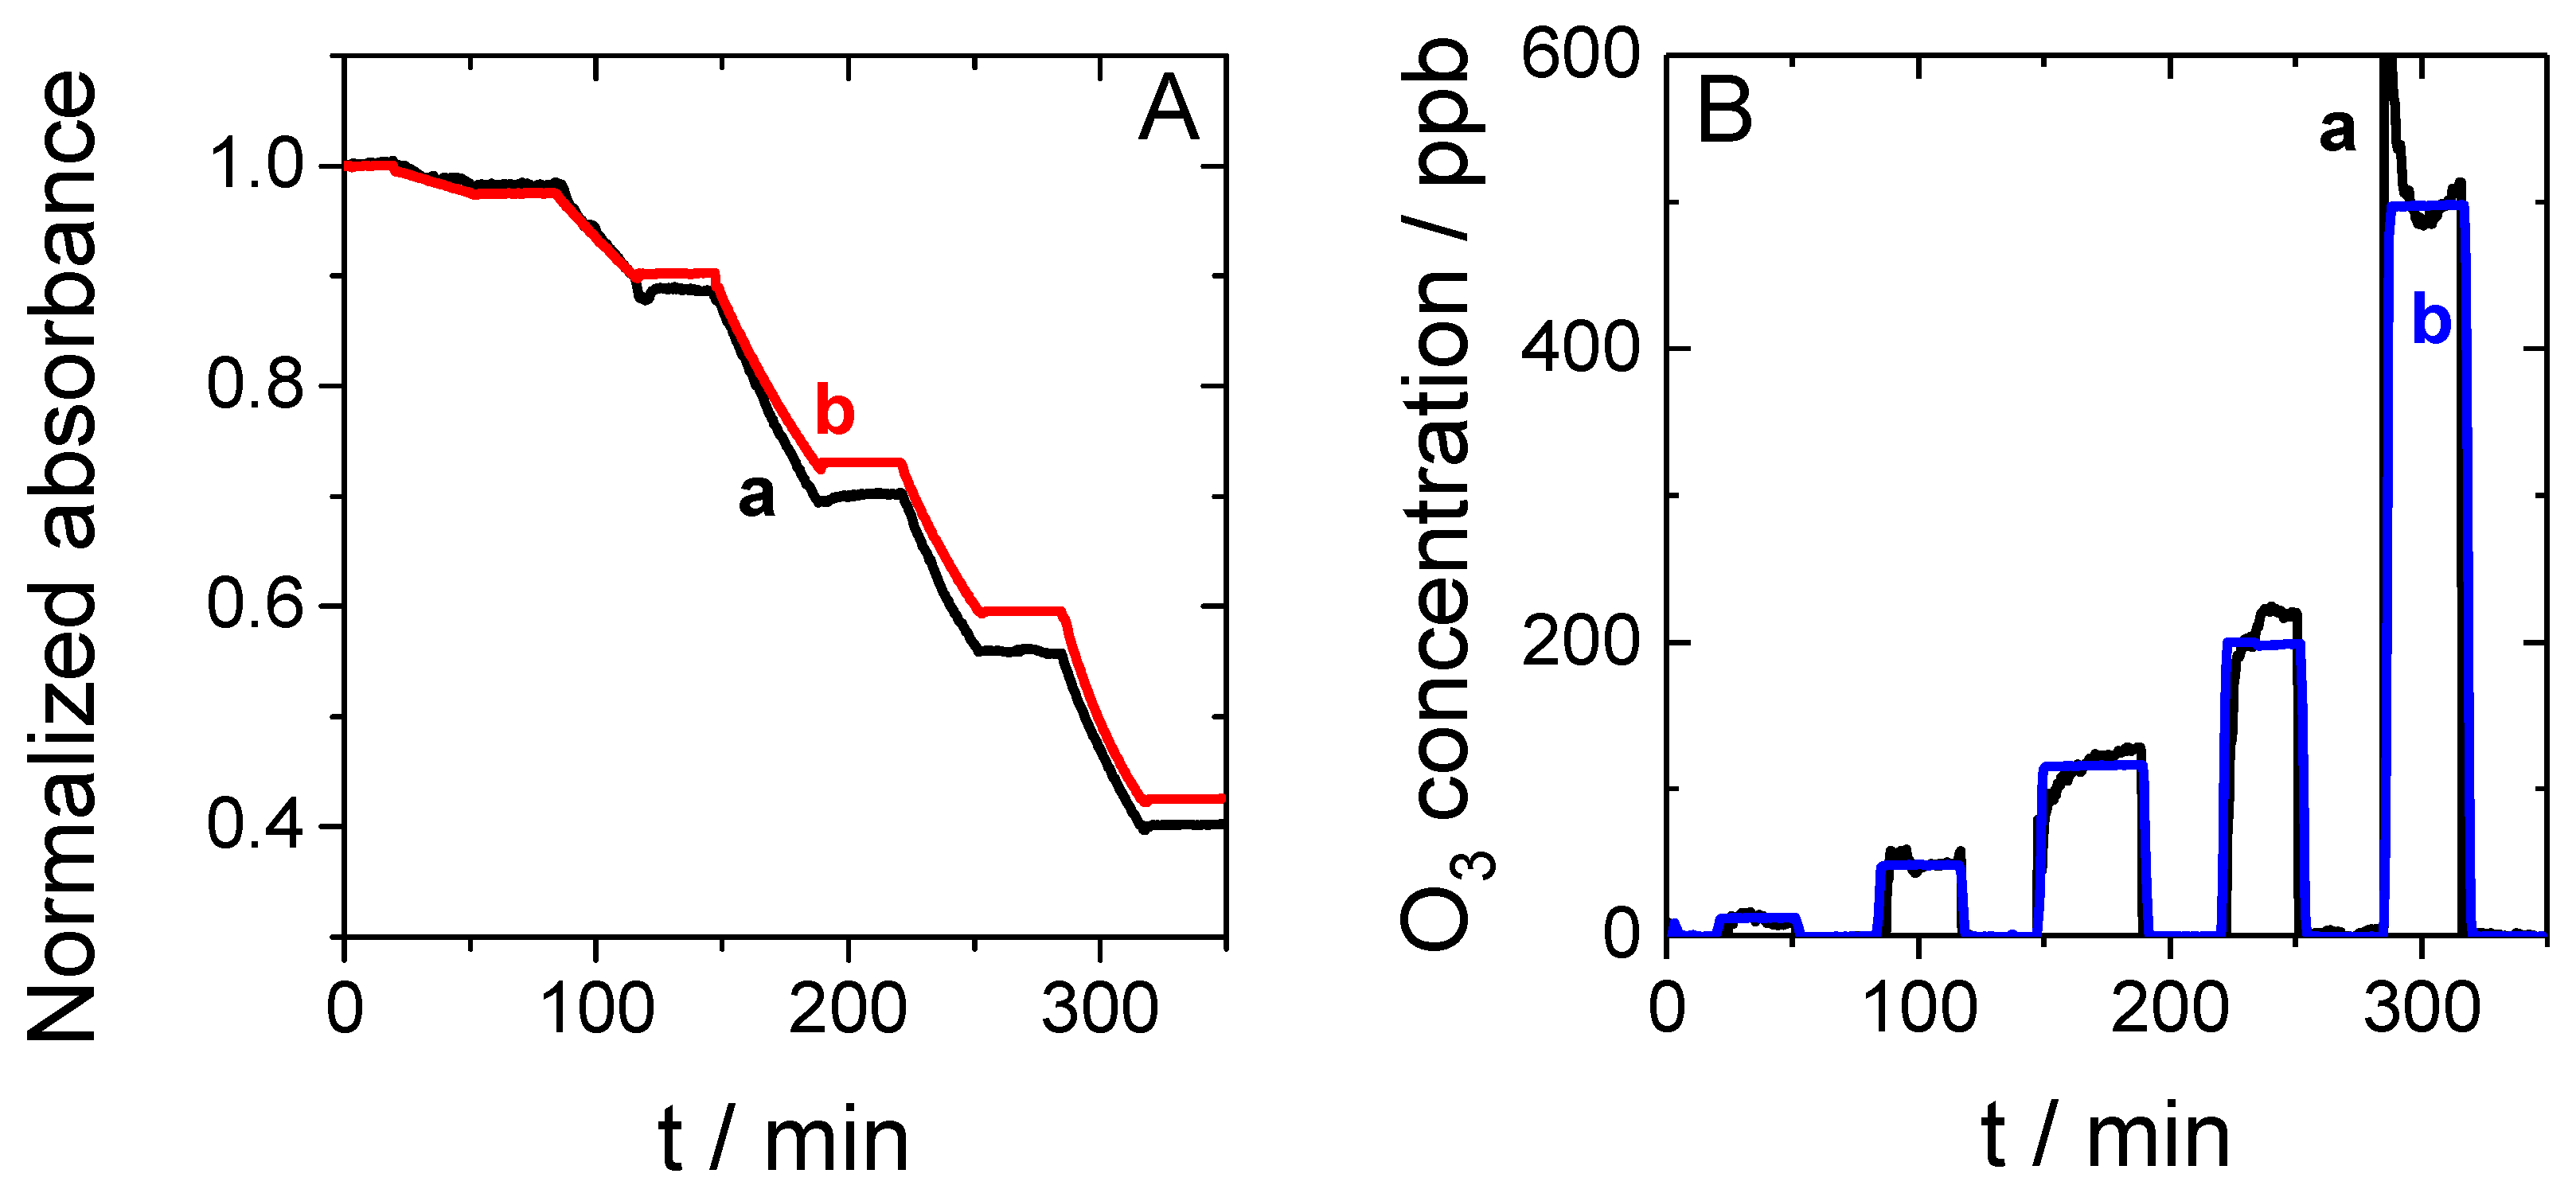
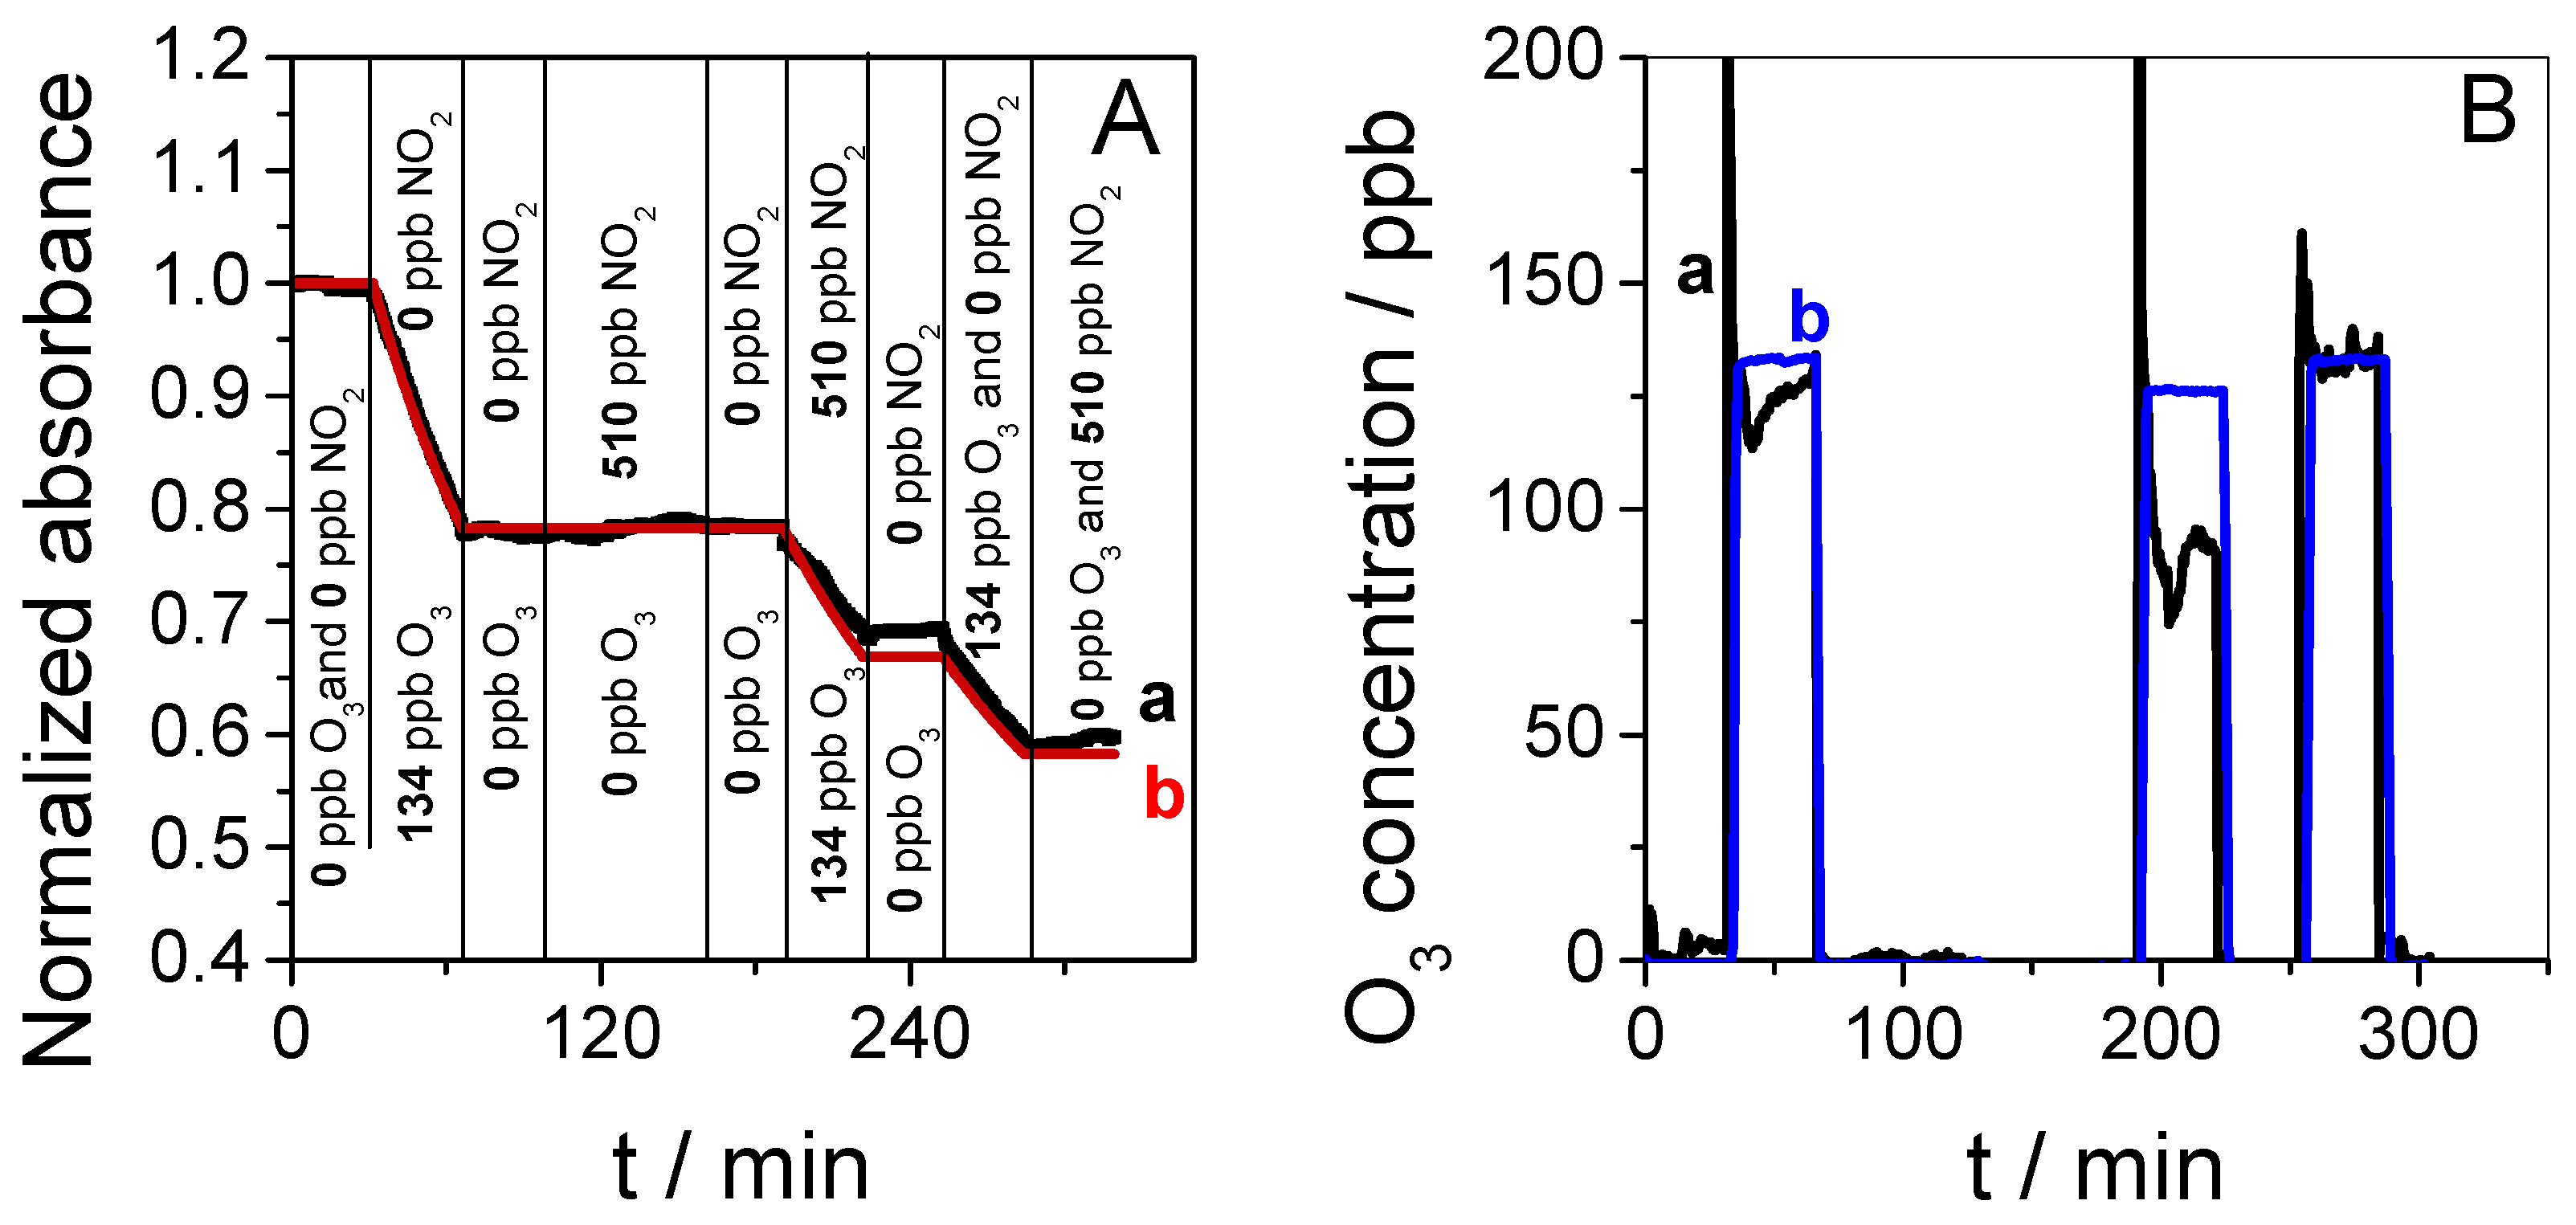
3.2. Sensor Sensitivity and Selectivity

The performance of the sensor was then evaluated in the presence of O3 concentrations ranging from 10 to 500 ppb. Figure S3 reports the gradual discoloration of the sensor chip composed of MB adsorbed on a mesoporous silica thin film when it was exposed to O3. Only a decrease of absorbance was observed, and no other absorption peak appeared in the visible wavelength window during O3 exposure. Figure 5A reports the evolution of the normalized absorbance as a function of time while the O3 concentration was varied stepwise from 10 to 500 ppb in the presence of 36% relative humidity.
Each exposure lasted 30 min and was followed by 30 min without O3. The absorbance decreased in the presence of O3 and did not vary in the absence of O3. Curve (a) presents the experimental data and curve (b) shows the model derived from Equation (2). Moreover, we evaluated the possibility to determine the concentration of O3 directly from the sensor response using Equation (3). Figure 5B reports the comparison of the sensor response as a function of time with the controlled concentration given by the O3 analyzer (see Figure 2 to visualize the position of this analyzer versus the sensor in the setup). As can be observed, a good correlation was found between the generated O3 concentration (curve (b)) and the sensor response (curve (a)) up to 10 ppb, i.e., far below the OEL for O3, which is 100 ppb for 8 h monitoring and 200 ppb for 15 min monitoring. In conclusion, the sensor provides sufficient sensitivity and measurement range (tested here up to 500 ppb) for O3 monitoring in working environments. Moreover, it provides a rapid warning for the exposed worker and temporally resolved data on O3 concentrations.
In addition to sensor sensitivity, it is important to evaluate cross-sensitivity resulting from gaseous pollutant compounds. The measurement of O3 in occupational environments is mainly affected by other oxidizing gases such as NO2 and sulfur dioxide (SO2) [50,51]. In the following interference testing, the cross-sensitivity versus NO2 was evaluated. Experiments were carried out by exposing the sensors to 510 ppb of NO2. The selected NO2 concentration is based on the OEL fixed in the recommendation for NO2 by the Scientific Committee on Occupational Exposure Limits (SCOEL) [52].
Figure 6A shows the normalized absorbance variation at 600 nm as a function of time when the sensor was exposed to 134 ppb of O3 followed by exposure to 510 ppb of NO2 and, finally, to a mixture of 134 ppb O3 and 510 ppb NO2. The sensor showed a significant response during each exposure to O3 (1st at 30 min, 2nd at 190 min, and 3rd at 250 min). Oppositely, no response was observed when the sensor was exposed to 510 ppb from 100 to 160 min and after 294 min. Thus, NO2 did not interfere in the detection of O3.
Figure 6B reports the O3 concentration determined with Equation (3) during this complex scenario. The ozone concentration measured by the sensor (curve (a)) and the concentration measured by an O3 analyzer (curve (b)) fitted well when O3 was introduced alone in air. However, when 134 ppb O3 was generated in the presence of 510 ppb NO2, the concentration determined at the sensor was close to 90 ppb. Interestingly, the concentration determined with the O3 analyzer was also lower than expected—only 125 ppb was measured. In the gas mixture, the NO2 concentration was 5 times larger than that of O3. In these conditions, the reaction between the two molecules induces the formation of NO3 and N2O5 according to Reaction 1 followed by Reaction 2 [53,54].
NO 2 + O 3 NO 3 + O 2    ( 1 ) NO 3 + NO 2 N 2 O 5    ( 2 ) 2 NO 2 + H 2 O H NO 3 + H NO 2    ( 3 )
Furthermore, the presence of HNO3 resulting from Reaction 3 between NO2 and humidity is also possible. As a result, the initial O3 concentration generated is partly consumed by the formation of other gaseous species. In the experimental setup reported in Figure 2, the O3 analyzer was positioned in the fluidic system far before the sensor, and it is very possible that the real O3 concentration measured by the sensor is lower than that measured by the O3 analyzer because of the additional time needed for gas transfer leading to higher reaction progress before detection. To conclude, NO2 was not detected by the sensor based on methylene blue in mesoporous silica thin film, and the accuracy of the determination of O3 in the presence of NO2 depends essentially on the fluidic length between the sampling source and the detector, which must be as short as possible.

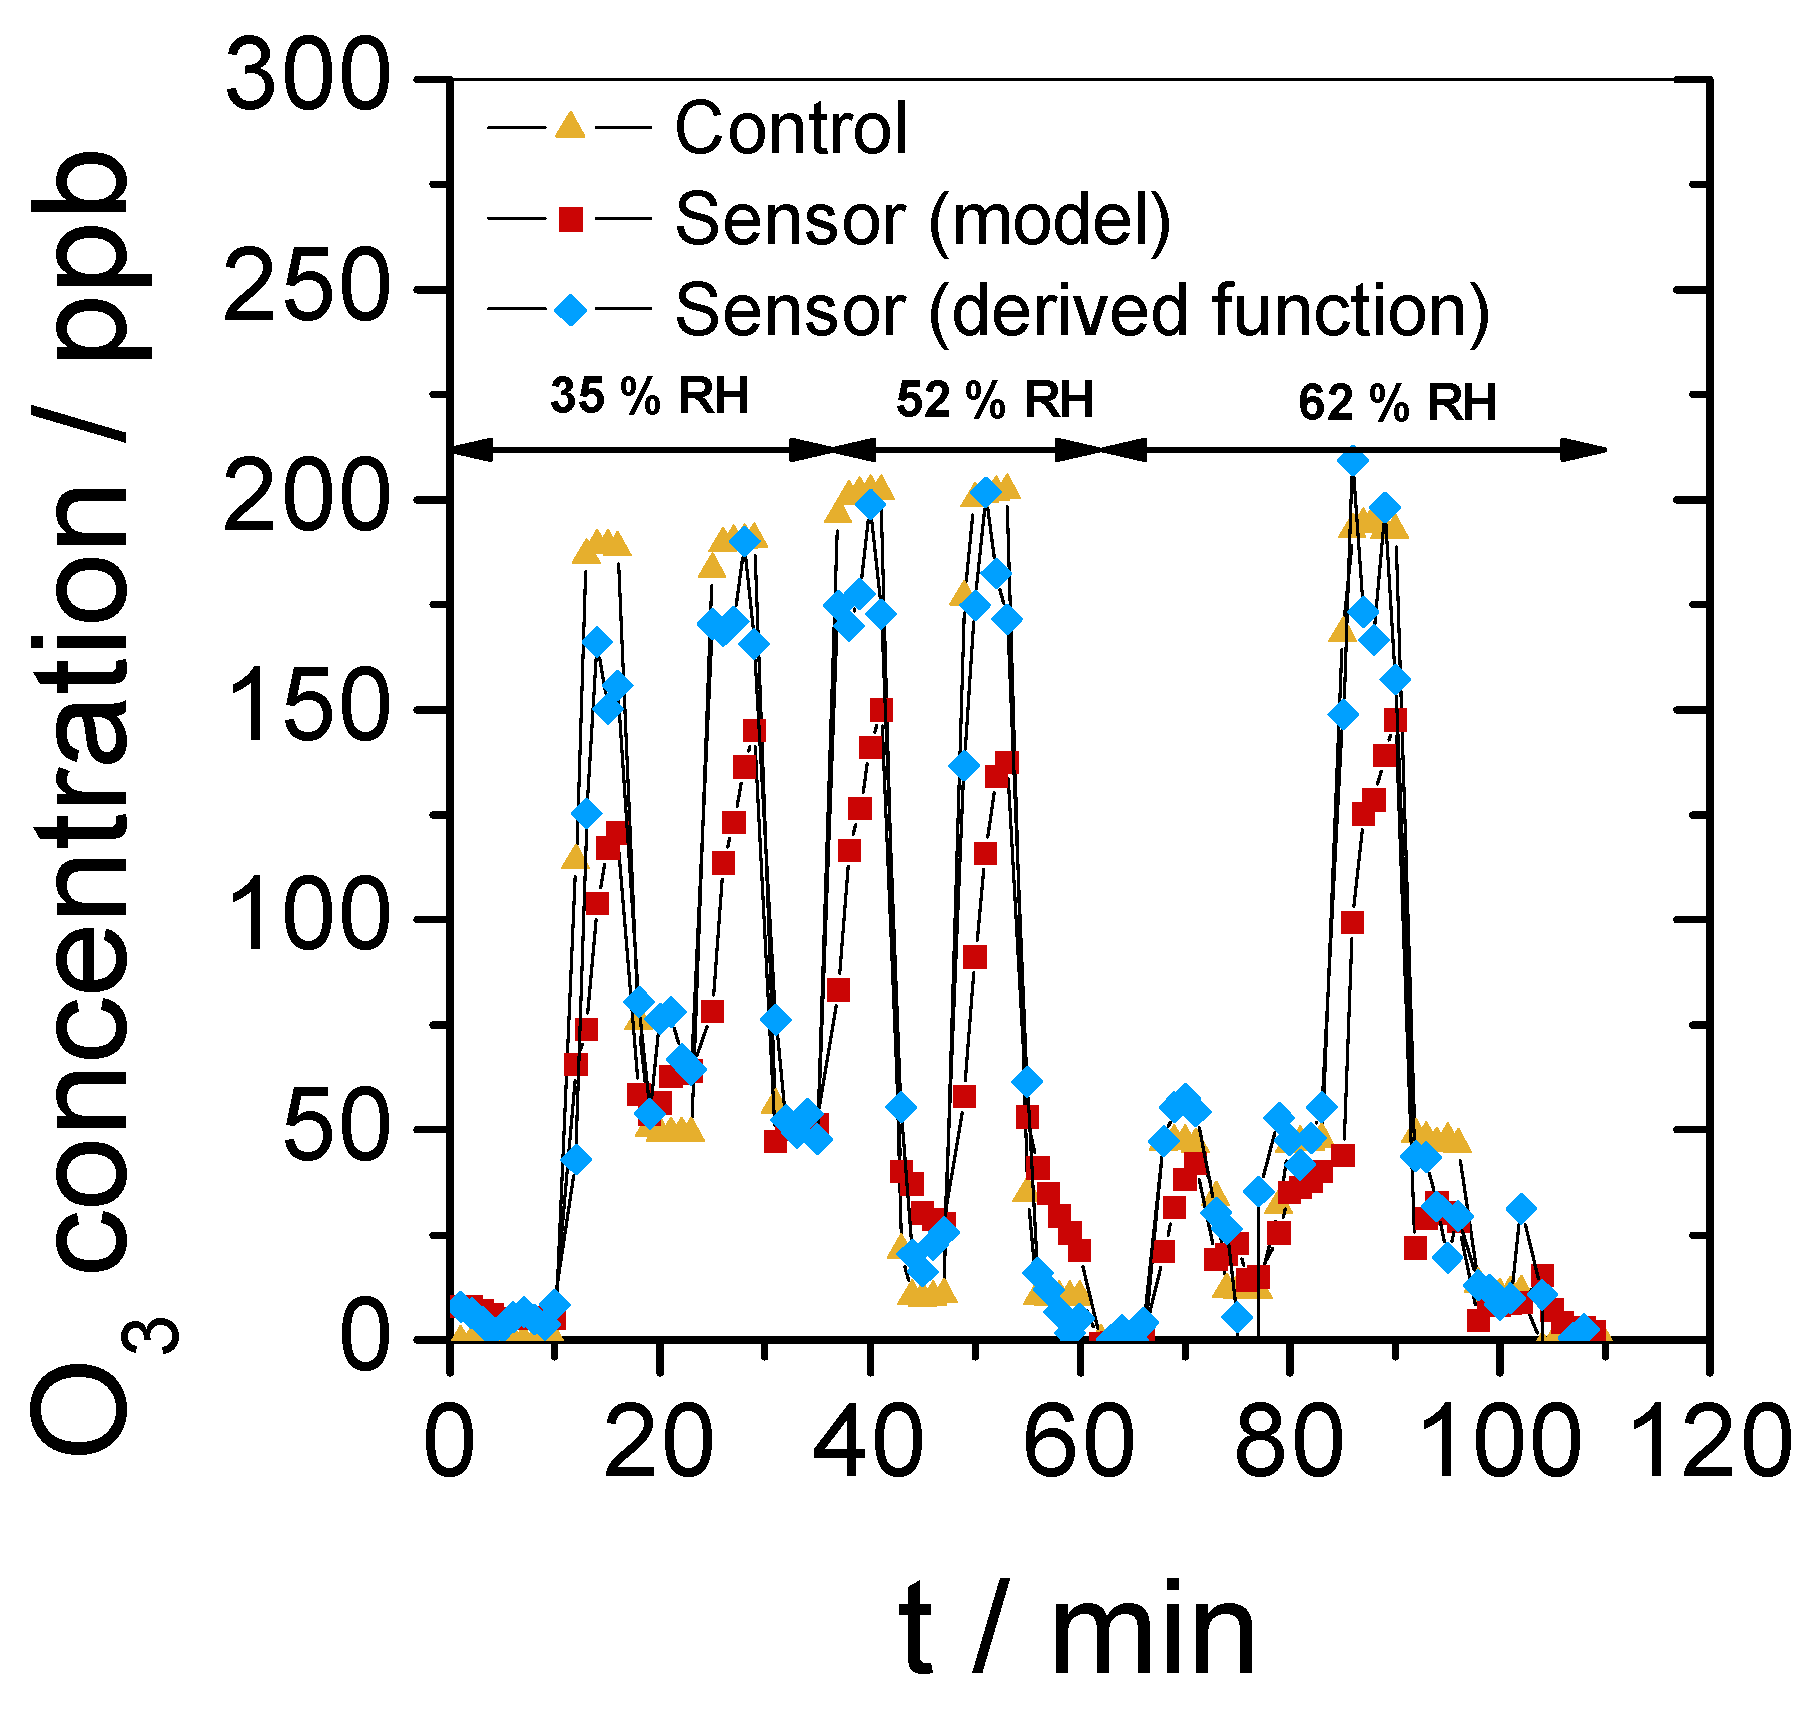
3.3. Application of the Sensor in a Complex Scenario

To finalize this study, we evaluated the sensor in a more complex scenario during which both relative humidity (from 35% to 52% and 62%) and O3 concentration (from 10 to 200 ppb) were varied every five- to ten-minute period for almost two hours (Figure 7). The normalized absorbance profile of this experiment and the model absorbance curve, calculated according to Equation (2), can be found in Figure S4. The sensor response was first determined by applying Equation (3) to the experimental absorbance data and then compared to the concentration given by the O3 analyzer used here as a control. The low concentrations of O3, below 60 ppb, were well determined, but a significant difference was observed between the expected concentration (control) and the sensor response at this relatively short time scale, resulting in an error of about 30%. The reason for this could be that the time requested to reach a constant value of O3 concentration in the measuring setup is not negligible when a short exposure time is used. Oppositely, concentration steps of 30 min were accurately determined (Figure 5 and Figure 6). Moreover, Equation (3), used to convert absorbance to concentration, is potentially sensitive to a cumulative shift in the absorbance value, leading then to errors in the determination of O3 concentrations. These limits were overpassed by treating data with the derivative as a function of time, given in Equation (4). This method allows us to achieve rapid determination of the concentration that was introduced in air (see the blue triangle curve in Figure 7) and to prevent cumulative errors. Finally, this experiment confirmed that the water content in air from 35% to 62% relative humidity does not produce any interference in the O3 determination. We tested the derivative of the absorbance as a function of time for the treatment of data collected with different concentrations of O3 (Figure S5) and in the presence of NO2 (Figure S6). Despite the large noise, essentially due to the data collection parameters that were not optimal, it is clear that the method allows rapid determination of concentrations in these different conditions.

4. Conclusions

In this study, a real-time optical O3 sensor based on methylene blue adsorbed in a mesoporous silica thin film was successfully developed. The device includes a Nafion® dryer to eliminate the interference of water. At 600 nm, the sensor exhibited interesting performance: it showed significant sensitivity at low O3 concentrations up to 10 ppb, good reproducibility and stability up to 50 days in the absence of O3, and no direct interference by NO2. The derivative of the absorbance as a function of time was proposed to reach a fast and accurate response to changes in O3 concentration. The next step in this research is the miniaturization of the sensor for analytical performance evaluation in workplaces and real-time monitoring of O3 exposure that will contribute to a safer working environment. The sensor will operate at a wavelength close to 600 nm and will integrate air sampling in a portable device.

Supplementary Materials

The following are available online at https://www.mdpi.com/1424-8220/19/16/3508/s1.

Author Contributions

Conceptualization, C.G., M.H., E.L., B.C., M.G. and M.E.; Data curation, C.G. and M.H.; Formal analysis, M.H.; Investigation, C.G., B.C. and M.G.; Methodology, M.H.; Project administration, E.L.; Supervision, M.H., M.G. and M.E.; Validation, M.H., E.L., M.G. and M.E.; Visualization, C.G., M.G. and M.E.; Writing—original draft, C.G.; Writing—review & editing, M.G. and M.E.

Funding

This research was funded by the National Institute for Research and Safety INRS—France.

Acknowledgments

The authors wish to thank Jaafar Ghanbajaa (Institut Jean Lamour, Nancy, France) for the TEM analysis.

Conflicts of Interest

The authors declare no conflict of interest.

References

  1. Singer, B.C.; Coleman, B.K.; Destaillats, H.; Hodgson, A.T.; Lunden, M.M.; Weschler, C.J.; Nazaroff, W.W. Indoor secondary pollutants from cleaning product and air freshener use in the presence of ozone. Atmos. Environ. 2006, 40, 6696–6710. [Google Scholar] [CrossRef]
  2. Wang, H.; He, C.; Morawska, L.; McGarry, P.; Johnson, G. Ozone-initiated particle formation, particle aging, and precursors in a laser printer. Environ. Sci. Technol. 2012, 46, 704–712. [Google Scholar] [CrossRef] [PubMed]
  3. Inrs Fiche Toxicologique n°43: Ozone. Available online: http://www.inrs.fr/publications/bdd/fichetox/fiche.html?refINRS=FICHETOX_43 (accessed on 9 August 2019).
  4. Kampa, M.; Castanas, E. Human health effects of air pollution. Environ. Pollut. 2008, 151, 362–367. [Google Scholar] [CrossRef] [PubMed]
  5. Demirel, G.; Özden, Ö.; Döǧeroǧlu, T.; Gaga, E.O. Personal exposure of primary school children to BTEX, NO2and ozone in Eskişehir, Turkey: Relationship with indoor/outdoor concentrations and risk assessment. Sci. Total Environ. 2014, 473–474, 537–548. [Google Scholar] [CrossRef] [PubMed]
  6. Liard, R.; Zureik, M.; Le Moullec, Y.; Soussan, D.; Glorian, M.; Grimfeld, A.; Neukirch, F. Use of personal passive samplers for measurement of NO2, NO, and O3 levels in panel studies. Environ. Res. 1999, 81, 339–348. [Google Scholar] [CrossRef] [PubMed]
  7. Bernard, N.L.; Gerber, M.J.; Astre, C.M.; Saintot, M.J. Ozone measurement with passive samplers: Validation and use for ozone pollution assessment in Montpellier, France. Environ. Sci. Technol. 1999, 33, 217–222. [Google Scholar] [CrossRef]
  8. Surgi, M.R.; Hodgeson, J.A. 10,10′-Dimethyl-9,9′-biacridylidene Impregnated Film Badge Dosimeters for Passive Ozone Sampling. Anal. Chem. 1985, 57, 1737–1740. [Google Scholar] [CrossRef]
  9. Geyh, A.S.; Wolfson, J.M.; Koutrakis, P.; Mulik, J.D.; Avol, E.L. Development and evaluation of a small active ozone sampler. Environ. Sci. Technol. 1997, 31, 2326–2330. [Google Scholar] [CrossRef]
  10. Acuautla, M.; Bernardini, S.; Gallais, L.; Fiorido, T.; Patout, L.; Bendahan, M. Ozone flexible sensors fabricated by photolithography and laser ablation processes based on ZnO nanoparticles. Sens. Actuators B Chem. 2014, 203, 602–611. [Google Scholar] [CrossRef]
  11. Vallejos, S.; Khatko, V.; Aguir, K.; Ngo, K.A.; Calderer, J.; Gràcia, I.; Cané, C.; Llobet, E.; Correig, X. Ozone monitoring by micro-machined sensors with WO3 sensing films. Sens. Actuators B Chem. 2007, 126, 573–578. [Google Scholar] [CrossRef]
  12. Korotcenkov, G.; Blinov, I.; Brinzari, V.; Stetter, J.R. Effect of air humidity on gas response of SnO2 thin film ozone sensors. Sens. Actuators B Chem. 2007, 122, 519–526. [Google Scholar] [CrossRef]
  13. Korotcenkov, G.; Cerneavschi, A.; Brinzari, V.; Vasiliev, A.; Ivanov, M.; Cornet, A.; Morante, J.; Cabot, A.; Arbiol, J. In2O3 films deposited by spray pyrolysis as a material for ozone gas sensors. Sens. Actuators B Chem. 2004, 99, 297–303. [Google Scholar] [CrossRef]
  14. Kang, G.; Zhu, Z.; Tang, B.H.; Wu, C.H.; Wu, R.J. Rapid detection of ozone in the parts per billion range using a novel Ni–Al layered double hydroxide. Sens. Actuators B Chem. 2017, 241, 1203–1209. [Google Scholar] [CrossRef]
  15. Bejaoui, A.; Guerin, J.; Zapien, J.A.; Aguir, K. Theoretical and experimental study of the response of CuO gas sensor under ozone. Sens. Actuators B Chem. 2014, 190, 8–15. [Google Scholar] [CrossRef]
  16. Thirumalairajan, S.; Mastelaro, V.R.; Escanhoela, C.A. In-Depth Understanding of the Relation between CuAlO 2 Particle Size and Morphology for Ozone Gas Sensor Detection at a Nanoscale Level. ACS Appl. Mater. Interfaces 2014, 6, 21739–21749. [Google Scholar] [CrossRef]
  17. Sizun, T.; Bouvet, M.; Chen, Y.; Suisse, J.; Barochi, G.; Rossignol, J. Differential study of substituted and unsubstituted cobalt phthalocyanines for gas sensor applications. Sens. Actuators B. Chem. 2011, 159, 163–170. [Google Scholar] [CrossRef]
  18. Brunet, J.; Pauly, A.; Mazet, L.; Germain, J.P.; Bouvet, M.; Malezieux, B. Improvement in real time detection and selectivity of phthalocyanine gas sensors dedicated to oxidizing pollutants evaluation. Thin Solid Films 2005, 490, 28–35. [Google Scholar] [CrossRef] [Green Version]
  19. Ashley, K. Developments in electrochemical sensors for occupational and environmental health applications. J. Hazard. Mater. 2003, 102, 1–12. [Google Scholar] [CrossRef]
  20. Pang, X.; Shaw, M.D.; Lewis, A.C.; Carpenter, L.J.; Batchellier, T. Electrochemical ozone sensors: A miniaturised alternative for ozone measurements in laboratory experiments and air-quality monitoring. Sens. Actuators B Chem. 2017, 240, 829–837. [Google Scholar] [CrossRef] [Green Version]
  21. Knake, R.; Hauser, P.C. Sensitive electrochemical detection of ozone. Anal. Chim. Acta 2002, 459, 199–207. [Google Scholar] [CrossRef]
  22. Muller, J.B.A.; Smith, C.E.; Newton, I.; Percival, C.J. Evaluation of coated QCM for the detection of atmospheric ozone. Analyst 2011, 136, 2963–2968. [Google Scholar] [CrossRef]
  23. Black, D.R.; Harley, R.A.; Hering, S.V.; Stolzenburg, M.R. A new, portable, real-time ozone monitor. Environ. Sci. Technol. 2000, 34, 3031–3040. [Google Scholar] [CrossRef]
  24. Fog, H.M.; Rietz, B. Piezoelectric crystal detector for the monitoring of Ozone in working environments.pdf. Anal. Chem. 1985, 57, 2638–2643. [Google Scholar] [CrossRef]
  25. 2BTechnologies Ozone Monitor. Available online: https://twobtech.com/docs/manuals/model_202_revH.pdf (accessed on 9 August 2019).
  26. Fisher, T. UV Photometric O3 Analyzer Model 49i. Available online: https://www.thermofisher.com/order/catalog/product/49i (accessed on 9 August 2019).
  27. Andersen, P.C.; Williford, C.J.; Birks, J.W. Miniature personal ozone monitor based on UV absorbance. Anal. Chem. 2010, 82, 7924–7928. [Google Scholar] [CrossRef]
  28. Sagona, J.A.; Weisel, C.P.; Meng, Q. Accuracy and practicality of a portable ozone monitor for personal exposure estimates. Atmos. Environ. 2018, 175, 120–126. [Google Scholar] [CrossRef]
  29. Grosjean, D.; Harrison, J. Response of Chemiluminescence NO, Analyzers and Ultraviolet Ozone Analyzers to Organic Air Pollutants. Environ. Sci. Technol. 1985, 19, 862–865. [Google Scholar] [CrossRef]
  30. Warren, G.J.; Babcock, G. Portable ethylene chemiluminescence ozone monitor. Rev. Sci. Instrum. 1970, 41, 280–282. [Google Scholar] [CrossRef]
  31. Ray, J.D.; Stedman, D.H.; Wendel, G.J. Fast Chemiluminescent Method for Measurement of Ambient Ozone. Anal. Chem. 1986, 58, 598–600. [Google Scholar] [CrossRef]
  32. Ando, M. Recent advances in optochemical sensors for the detection of H2, O2, O3, CO, CO2 and H2O in air. TrAC Trends Anal. Chem. 2006, 25, 937–948. [Google Scholar] [CrossRef]
  33. Bergshoeff, G.; Lanting, R.W.; Van Ham, J.; Prop, J.M.G.; Reijnders, H.F.R. Spectrophotometric Determination of Ozone in Air with Indigo Disulphonate. Analyst 1984, 109, 1165–1169. [Google Scholar] [CrossRef]
  34. Alexy, M.; Voss, G.; Heinze, J. Optochemical sensor for determining ozone based on novel soluble indigo dyes immobilised in a highly permeable polymeric film. Anal. Bioanal. Chem. 2005, 382, 1628–1641. [Google Scholar] [CrossRef]
  35. Grosjean, D.; Hisham, M.W.M. A passive sampler for atmospheric ozone. J. Air Waste Manag. Assoc. 1992, 42, 169–173. [Google Scholar] [CrossRef]
  36. Maruo, Y.Y. Measurement of ambient ozone using newly developed porous glass sensor. Sens. Actuators B 2007, 126, 485–491. [Google Scholar] [CrossRef]
  37. Zanjanchi, M.A.; Sohrabnezhad, S. Evaluation of methylene blue incorporated in zeolite for construction of an optical humidity sensor. Sens. Actuators B Chem. 2005, 105, 502–507. [Google Scholar] [CrossRef]
  38. Fernández-Ramos, M.D.; Ordóñez, Y.F.; Capitán-Vallvey, L.F.; De Vargas-Sansalvador, I.M.P.; Ballesta-Claver, J. Optical humidity sensor using methylene blue immobilized on a hydrophilic polymer. Sens. Actuators B Chem. 2015, 220, 528–533. [Google Scholar] [CrossRef]
  39. Ishizaki, R.; Katoh, R. Fast-response humidity-sensing films based on methylene blue aggregates formed on nanoporous semiconductor films. Chem. Phys. Lett. 2016, 652, 36–39. [Google Scholar] [CrossRef]
  40. Zhang, J.; Lee, K.H.; Cui, L.; Jeong, T. Degradation of methylene blue in aqueous solution by ozone-based processes. J. Ind. Eng. Chem. 2009, 15, 185–189. [Google Scholar] [CrossRef]
  41. Al jibouri, A.K.H.; Wu, J.; Upreti, S.R. Continuous ozonation of methylene blue in water. J. Water Process Eng. 2015, 8, 142–150. [Google Scholar] [CrossRef]
  42. Iwamori, S.; Nishiyama, N.; Oya, K. A colorimetric indicator for detection of hydroxyl radicals in atmosphere using a methylene blue dye based on nafion film. Polym. Degrad. Stab. 2016, 123, 131–136. [Google Scholar] [CrossRef] [Green Version]
  43. Etienne, M.; Quach, A.; Grosso, D.; Nicole, L.; Sanchez, C.; Walcarius, A. Molecular Transport into Mesostructured Silica Thin Films: Electrochemical Monitoring and Comparison between p 6 m, P6 3/mmc, and Pm 3 n Structures. Chem. Mater. 2007, 19, 844–856. [Google Scholar] [CrossRef]
  44. Hamdi, K.; Hébrant, M.; Martin, P.; Galland, B.; Etienne, M. Mesoporous silica nanoparticle film as sorbent for in situ and real-time monitoring of volatile BTX (benzene, toluene and xylenes). Sens. Actuators B Chem. 2016, 223, 904–913. [Google Scholar] [CrossRef]
  45. Plazinski, W.; Dziuba, J.; Rudzinski, W. Modeling of sorption kinetics: The pseudo-second order equation and the sorbate intraparticle diffusivity. Adsorption 2013, 19, 1055–1064. [Google Scholar] [CrossRef]
  46. Mills, A.; Hawthorne, D.; Burns, L.; Hazafy, D. Novel temperature-activated humidity-sensitive optical sensor. Sens. Actuators B Chem. 2017, 240, 1009–1015. [Google Scholar] [CrossRef] [Green Version]
  47. Staehelln, J.; Hoigne, J. Decomposition of Ozone in Water in the Presence of Organic Solutes Acting as Promoters and Inhibitors of Radical Chain Reactions. Environ. Sci. Technol. 1985, 19, 1206–1213. [Google Scholar] [CrossRef]
  48. Huang, F.; Chen, L.; Wang, H.; Yan, Z. Analysis of the degradation mechanism of methylene blue by atmospheric pressure dielectric barrier discharge plasma. Chem. Eng. J. 2010, 162, 250–256. [Google Scholar] [CrossRef]
  49. Boissiere, C.; Grosso, D.; Lepoutre, S.; Nicole, L.; Bruneau, A.B.; Sanchez, C. Porosity and mechanical properties of mesoporous thin films assessed by environmental ellipsometric porosimetry. Langmuir 2005, 21, 12362–12371. [Google Scholar] [CrossRef]
  50. Izumi, K.; Utiyama, M.; Maruo, Y.Y. A porous glass-based ozone sensing chip impregnated with potassium iodide and α-cyclodextrin. Sens. Actuators B Chem. 2017, 241, 116–122. [Google Scholar] [CrossRef]
  51. Aleixandre, M.; Del Carmen Horrillo, M.; Gerboles, M.; Spinelle, L.; Bonavitacola, F. Comparison of Tin Dioxide Ozone Sensor Operated in On/Off Switching Temperature Cycles and at Constant Temperature. Chem. Eng. Trans. 2016, 54, 49–54. [Google Scholar]
  52. European Commission (EC). Recommendation from the Scientific Committee on Occupational Exposure Limits (SCOEL) for Nitrogen Dioxide. Available online: https://www.google.com.hk/url?sa=t&rct=j&q=&esrc=s&source=web&cd=4&ved=2ahUKEwjH8bz2nvfjAhXbxosBHQ2cAzAQFjADegQIAxAC&url=http%3A%2F%2Fec.europa.eu%2Fsocial%2FBlobServlet%3FdocId%3D12432%26langId%3Den&usg=AOvVaw14WVsmj6Vff1fsg_aWeZv2 (accessed on 9 August 2019).
  53. Wu, C.H.; Morris, E.D.; Niki, H. The reaction of nitrogen dioxide with ozone. J. Phys. Chem. 1973, 77, 2507–2511. [Google Scholar] [CrossRef]
  54. Wang, H.; Zhuang, Z.; Sun, C.; Zhao, N.; Liu, Y.; Wu, Z. Numerical evaluation of the effectiveness of NO2 and N2O5 generation during the NO ozonation process. J. Environ. Sci. 2016, 41, 51–58. [Google Scholar] [CrossRef]
Figure 1. Principle of the sensor. A glass slide is covered on both sides with a mesoporous silica thin film on which methylene blue is adsorbed. Visible light at 600 nm is absorbed by this colored material. Exposure to O3 in the atmosphere leads to an immediate degradation of the dye. The kinetic of absorbance decrease is immediately translated to a concentration.
Sensors 19 03508 g001
Figure 2. Schematic diagram of the experimental setup.
Sensors 19 03508 g002
Figure 3. (A) Absorbance of methylene blue in the mesoporous silica in the presence of 2%, 42%, 50%, 55%, 69%, and 77% relative humidity in air. (B) Absorbance of methylene blue in the mesoporous silica measured as a function of time at 620 nm (a, black) and 600 nm (b, red) while the relative humidity varied from 2% to 77% (c, blue). (C) Variation of the normalized absorbance in the presence of 108 ppb O3 as a function of time in air with 1% (a) or 40% RH (b). (D) Sensor response as a function of time, relative humidity, and O3 concentration in air (a), and the amplitude of the relative humidity variation as a function of time during the experiment (b).
Sensors 19 03508 g003
Figure 4. Experimental (blue) and model (red) curves of the normalized absorbance as a function of time in the presence of 120 ppb for three sensors analyzed at Day 1, Day 2, and Day 50 (k0 = 8.1 × 10⁻⁵ ppb−1 min−1 and Ainf = 0.137 ± 0.003).
Sensors 19 03508 g004
Figure 5. (A) Experimental (a, black) and model (b, red) curves showing the normalized absorbance as a function of time in the presence of increasing concentrations of O3 from 12 to 500 ppb. (B) O3 concentration measured as a function of time with the O3 sensor (a, black) and controlled values given by a benchtop O3 analyzer (b, blue).
Sensors 19 03508 g005
Figure 6. (A) Experimental (a, black) and model (b, red) curves showing the normalized absorbance as a function of time in the presence of 0 or 134 ppb of O3 and 0 or 510 ppb NO2. (B) O3 concentration measured as function of time with the O3 sensor (a, black) and controlled values given by a benchtop O3 analyzer (b, blue). The test was performed at 24 °C, with air at 50% RH passing through the Nafion® tube at a flow rate of 350 mL min-1 and using a sampling time of 30 min.
Sensors 19 03508 g006
Figure 7. O3 concentration measured as function of time with a benchtop O3 analyzer for control (triangle) and the sensor using Equation (3) (square) or the derivative as a function of time (Equation (4), lozenge). In this scenario, the O3 concentration was varied every five to ten minutes from 0 to 10 or 50 or 200 ppb, and the relative humidity in air was changed from 35% to 52% and, finally, 62%.
Sensors 19 03508 g007

