Article

Fusion of Near-Infrared and Raman Spectroscopy for In-Line Measurement of Component Content of Molten Polymer Blends

1
National Engineering Research Center of Novel Equipment for Polymer Processing, South China University of Technology, Guangzhou 510640, China
2
Key Laboratory of Polymer Processing Engineering of Ministry of Education, South China University of Technology, Guangzhou 510640, China
3
Guangdong Provincial Key Laboratory of Technique and Equipment for Macromolecular Advanced Manufacturing, South China University of Technology, Guangzhou 510640, China
*
Author to whom correspondence should be addressed.
Sensors 2019, 19(16), 3463; https://doi.org/10.3390/s19163463
Submission received: 9 July 2019 / Revised: 3 August 2019 / Accepted: 5 August 2019 / Published: 8 August 2019
(This article belongs to the Special Issue Multisensor Systems and Signal Processing in Analytical Chemistry)

Abstract

:
Spectral measurement techniques, such as the near-infrared (NIR) and Raman spectroscopy, have been intensively researched. Nevertheless, even today, these techniques are still sparsely applied in industry due to their unpredictable and unstable measurements. This paper put forward two data fusion strategies (low-level and mid-level fusion) for combining the NIR and Raman spectra to generate fusion spectra or fusion characteristics in order to improve the in-line measurement precision of component content of molten polymer blends. Subsequently, the fusion value was applied to modeling. For evaluating the response of different models to data fusion strategy, partial least squares (PLS) regression, artificial neural network (ANN), and extreme learning machine (ELM) were applied to the modeling of four kinds of spectral data (NIR, Raman, low-level fused data, and mid-level fused data). A system simultaneously acquiring in-line NIR and Raman spectra was built, and the polypropylene/polystyrene (PP/PS) blends, which had different grades and covered different compounding percentages of PP, were prepared for use as a case study. The results show that data fusion strategies improve the ANN and ELM model. In particular, mid-level fusion enables the in-line measurement of component content of molten polymer blends to become more accurate and robust.

Graphical Abstract

1. Introduction

The modified polymer generally possesses much better physical or chemical properties when compared with the virgin polymer, and therefore has found wide applications in industry. Polymer blending is one of the most commonly used polymer modification methods [1]. The properties of polymer blends are determined dominantly by the component content. Therefore, accurate and reliable technology is required for measuring the component content for ensuring the performance of the blending polymer. Nowadays, the measurement tasks are commonly accomplished off-line by methods, such as nuclear magnetic resonance [2] and thermogravimetric analysis [3]. Unfortunately, the post-processing examinations are incapable of identifying the unexpected changes of the component content timely, and the late reminder may lead to substantial scraps and pollutions. Because of these, the researchers and the polymer processing industry have paid growing attention to the in-situ measurement of the component content.
Spectroscopic techniques that are based on ultraviolet, infrared (IR), Raman, and fluorescence spectroscopy are commonly applied by analytical chemists to obtain qualitative and quantitative information of materials [4,5,6,7]. When combined with the fiber optics, these techniques allow for the on-line, in-line, or at-line measurement further. In the polymer field, there have been some reports of in-situ spectral measurement devices for polymer processing. Ingo et al. [8] developed an in-line measurement system of near-infrared (NIR), Raman, and ultrasound in polymer melt extrusion. Coates et al. [9] developed an in-process vibrational spectroscopy and ultrasound measurement system in polymer melt extrusion, and this system pump polymer melt out of the extruder, which collects spectrum in the outside channel. Jr et al. [10] developed an in-process measurement system of polymer chemical reaction in a microreactors. In real-time measurement system of polymer, spectroscopic have been widely applied in polymer synthesis [10,11] and the properties of polymer, such as particle size distribution [12], rheological properties [13], and component content [8,9,14,15,16]. However, for enriching the application of in-situ spectroscopy measurement of polymer properties (e.g., low-filled polymers), can the measuring accuracy be further improved?
Data fusion is defined as a combination of multiple sources to obtain improved information, which may improve the accuracy of the spectral analysis [17]. Generally, the data fusion methods can be categorized into three levels: low-level, intermediate-level (Mid-level), and high-level [17]. Low-level fusion is a concatenation of all the raw data, mid-level is a concatenation of extracted features of each raw data, and high-level fusion is the fusion of the results that were obtained from individual models [18]. Up to now, the data fusion has been applied to the spectral characterization in various fields. Dearing et al. [19] adopted the fused data of Raman, infrared, and nuclear magnetic resonance spectra to character the crude oil products. The result shows that the root mean square error of prediction (RMSEP) of model built by the fused data is lower than the model built by the separate spectra. Comino et al. [20] fused the data of NIR and X-ray fluorescence spectroscopy to analyze olive leaf and determine crop nutritional status. Two fusion strategy, feature fusion (Mid-level fusion) that is based on principal component scores, and measurement fusion (Low-level fusion) are applied. The prediction accuracy of nutrients is significantly promoted by applying the data fusion strategy and the feature fusion is superior to the measurement fusion.
IR spectroscopy is absorption spectrum, while Raman spectroscopy is the scattering spectrum. IR spectroscopy yields information pertaining to hydrogen bonding and asymmetric polar groups while Raman spectroscopy offers information pertaining to the molecular backbone as well as symmetrical non-polar groups [19]. The information that is contained in these two spectroscopy techniques has some complementarity. Therefore, this paper investigated the possibility to fuse the NIR spectroscopy and the Raman spectroscopy in order to find a reliable and accurate technique for in-situ measuring the component content of molten polymer blends. To achieve this aim, first, a data acquisition (DAQ) system was developed for synchronously collecting NIR and Raman spectroscopy of molten polymer during the extrusion. Subsequently, the data fusion, including the low-level fusion and the mid-level fusion, was applied for NIR and Raman spectra. Subsequently, three modelling methods, including a traditional linear model, namely the partial least squares (PLS) regression, a traditional nonlinear model, namely the artificial neural network (ANN), and a new simple and fast learning algorithm, namely the extreme learning machine (ELM) [21], were utilized for mapping the fused spectroscopic to the component content. Ultimately, the polypropylene/polystyrene (PP/PS) blends with different grades and different blending ratios were prepared for experimental verification.

2. Materials and Methods

2.1. Sample Preparation

In practical industrial production, the same polymers always have differences between grades, and it is not possible to use a single grade of plastic to prepare the blend. Thus, in this study, the used polymers were PP of three different grades and PS of two different grades, as shown in Table 1. Thirty-seven different blend samples, including 10 calibration samples and 27 prediction samples, were prepared and the details are exhibited in Table 2. These samples were firstly prepared by melt blending in a twin-screw extruder (Plasti-Corder Lab-Station, Brabender Technologie, Duisburg, Germany) at 200 °C and 150 rpm, then by air, and finally cut into pellets through a pelletizer.

2.2. In-Line Spectra Collection

Driven by a single-screw extruder (MESI-20, POTOP, Guangzhou, China) that was operated at a constant screw speed of 50 rpm, the PP/PS blends melts extruded through the sampling cell at a constant rate. The spectra data of PP/PS blends melts were collected in the sampling cell, which was a 25 mm width and 4 mm height slit channel at 210 °C. Figure 1 displays the measurement scheme. The in-line measurement system consisted of a sampling cell for spectral data collecting, two temperature and pressure resistant shells for protecting NIR and Raman optical probes, a Halogen source (QSPEC LS-3000, BIAOQI, Guangzhou, China), a Raman laser (Laser785-5HSB, QSPEC, Guangzhou, China) that was set at 400 mW, a NIR spectrometer (QUEST 512, Ocean Optics Inc., Orlando, FL, USA), a Raman spectrometer (QE65 Pro, Ocean Optics Inc., Orlando, FL, USA), a NIR fiber probe (QR400-7-VIS-NIR, Ocean Optics Inc., Orlando, FL, USA), a Raman fiber probe (The Raman Probe II, In Photonics, Los Angeles, CA, USA), and one computer. In-line NIR spectra of molten PP/PS blends were all collected from 1000–1600 nm, with a spectral resolution of 3.1 nm, and the Raman spectra were 1600–600 cm−1 with a spectral resolution of 4 cm−1. The NIR and Raman spectra of PP/PS molten blend of each ratio were all simultaneously collected 50 times, and the time duration of NIR and Raman for a single scan were 6 s.

2.3. Data Modeling

After the sampling, all of the collected data were imported into MATLAB for analysis. Pre-processes are usually required before the chemometric bi-linear modeling [22], which can increase the signal-to-noise ratio (SNR) and improve the multivariate regression model. In this paper, the baseline correction, the maximum and minimum normalization, as well as the nine-point smoothing were applied for pre-processing. Afterwards, the PLS, ANN, and ELM calibration model were built. The parameters of PLS and ELM model were optimized using cross-validation, and the number of hidden nodes in the ANN model was calculated by empirical formula as the following [23].
s = log 2 n
where s represents the number of hidden nodes and n represents the number of input data. In this case, n equaled 500, so the number of hidden nodes in the ANN model was 9.

2.4. Performance of Model

The performance of models was evaluated by the below criteria. The root mean-square error of calibration (RMSEC) is computed as:
R M S E C = i = 1 n ( y i , a c t u a l y i , p r e d i c t e d ) 2 n
where y i , a c t u a l and y i , p r e d i c t e d represents the actual value and predicted value, respectively. Here, n is the sample number of calibration sets.
When it comes to the prediction set, the root mean-square error of prediction (RMSEP) is given by:
R M S E P = i = 1 m ( y i , a c t u a l y i , p r e d i c t e d ) 2 m
where m is the number of the prediction set. Usually, the model performs better at lower RMSEC and RMSEP values.
The coefficient of determination (R2) is used to estimate the entire correlation between the spectral data and concentration. It is calculated via:
R 2 = 1 i = 1 m ( y i , a c t u a l y i , p r e d i c t e d ) 2 i = 1 m ( y i , a c t u a l y i , a c t u a l ¯ ) 2
where y i , a c t u a l ¯ represents the actual average value. Given the same range of ratios, the accuracy of the model will increase when R2 approaches 1.
The average value of each ratio’s standard deviation in the prediction results is applied to evaluate the robustness of the model, and it is calculated via:
S ¯ = i = 1 n S n
where S represents the standard deviation, n represents the number of ratios, and the S is calculated via:
S = i = 1 m ( y i , p r e d i c t e d y i , p r e d i c t e d ¯ ) 2 m
where y i , p r e d i c t e d ¯ represents the predicted average value of a single ratio and m is the sample number of a single ratio in the prediction sets. Usually, S ¯ reveals the undulation of data and a smaller S ¯ indicates that the model become more robust.

3. Result and Discussion

3.1. Analysis of Spectra

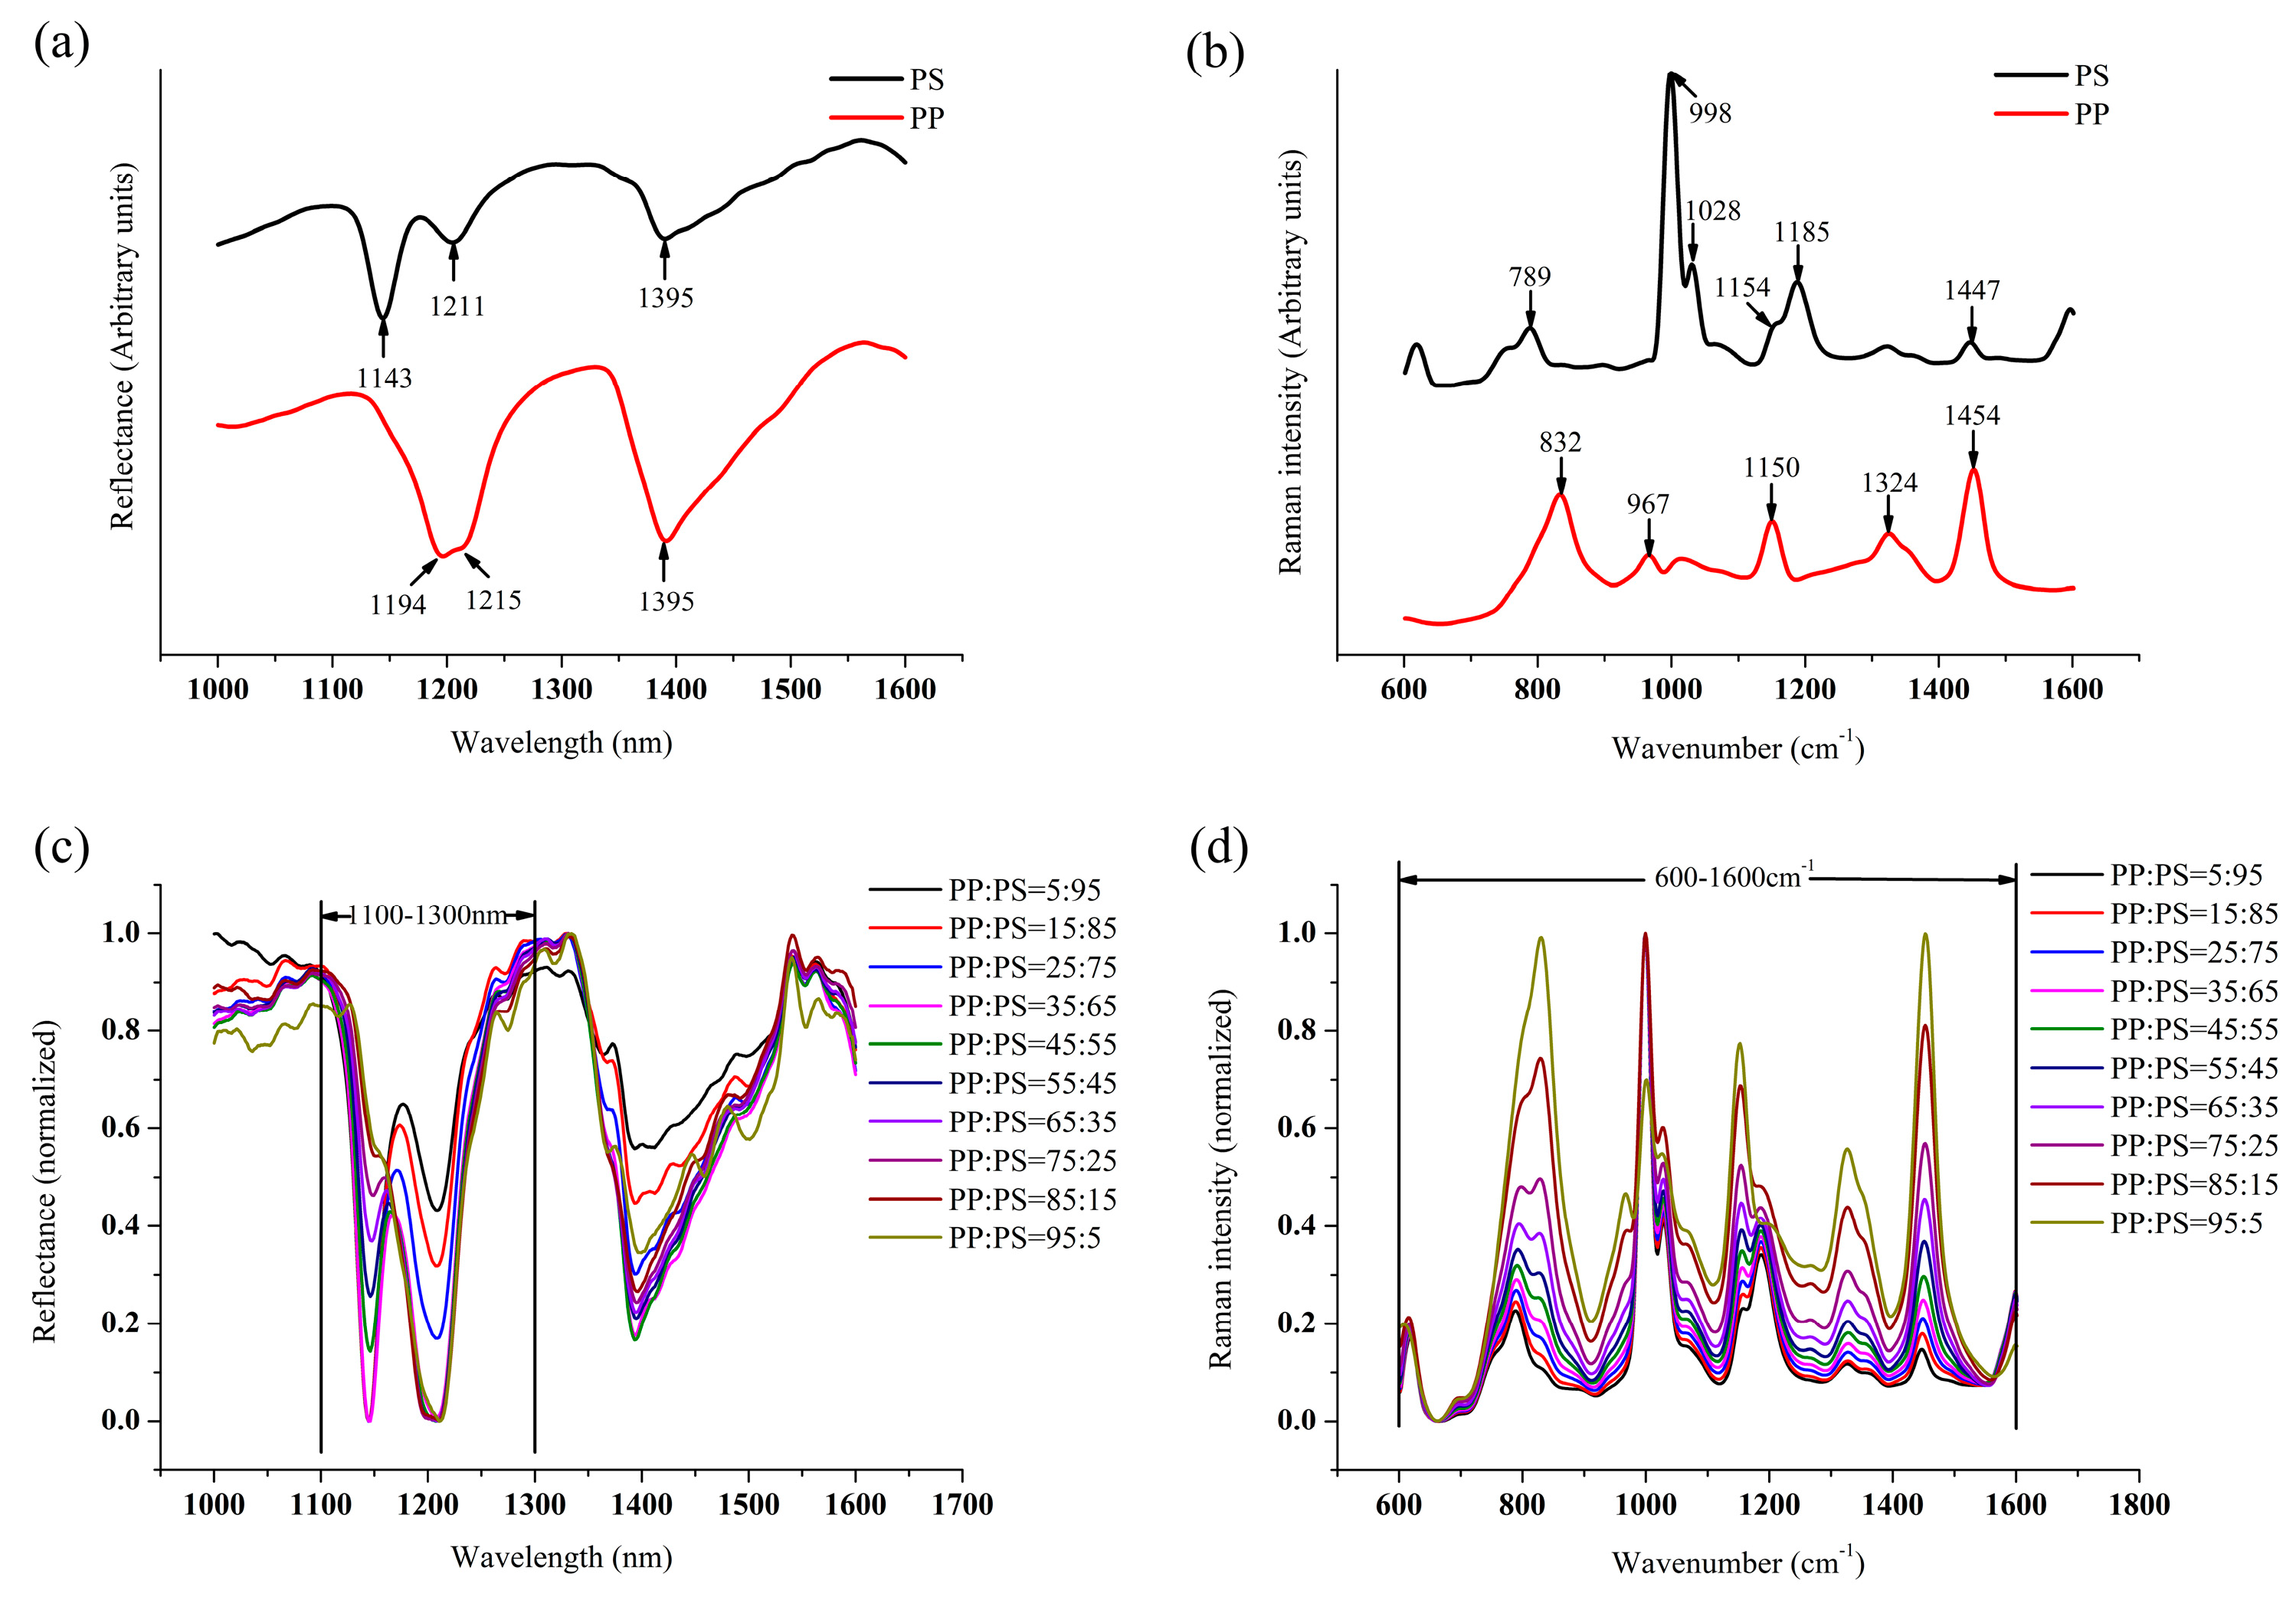
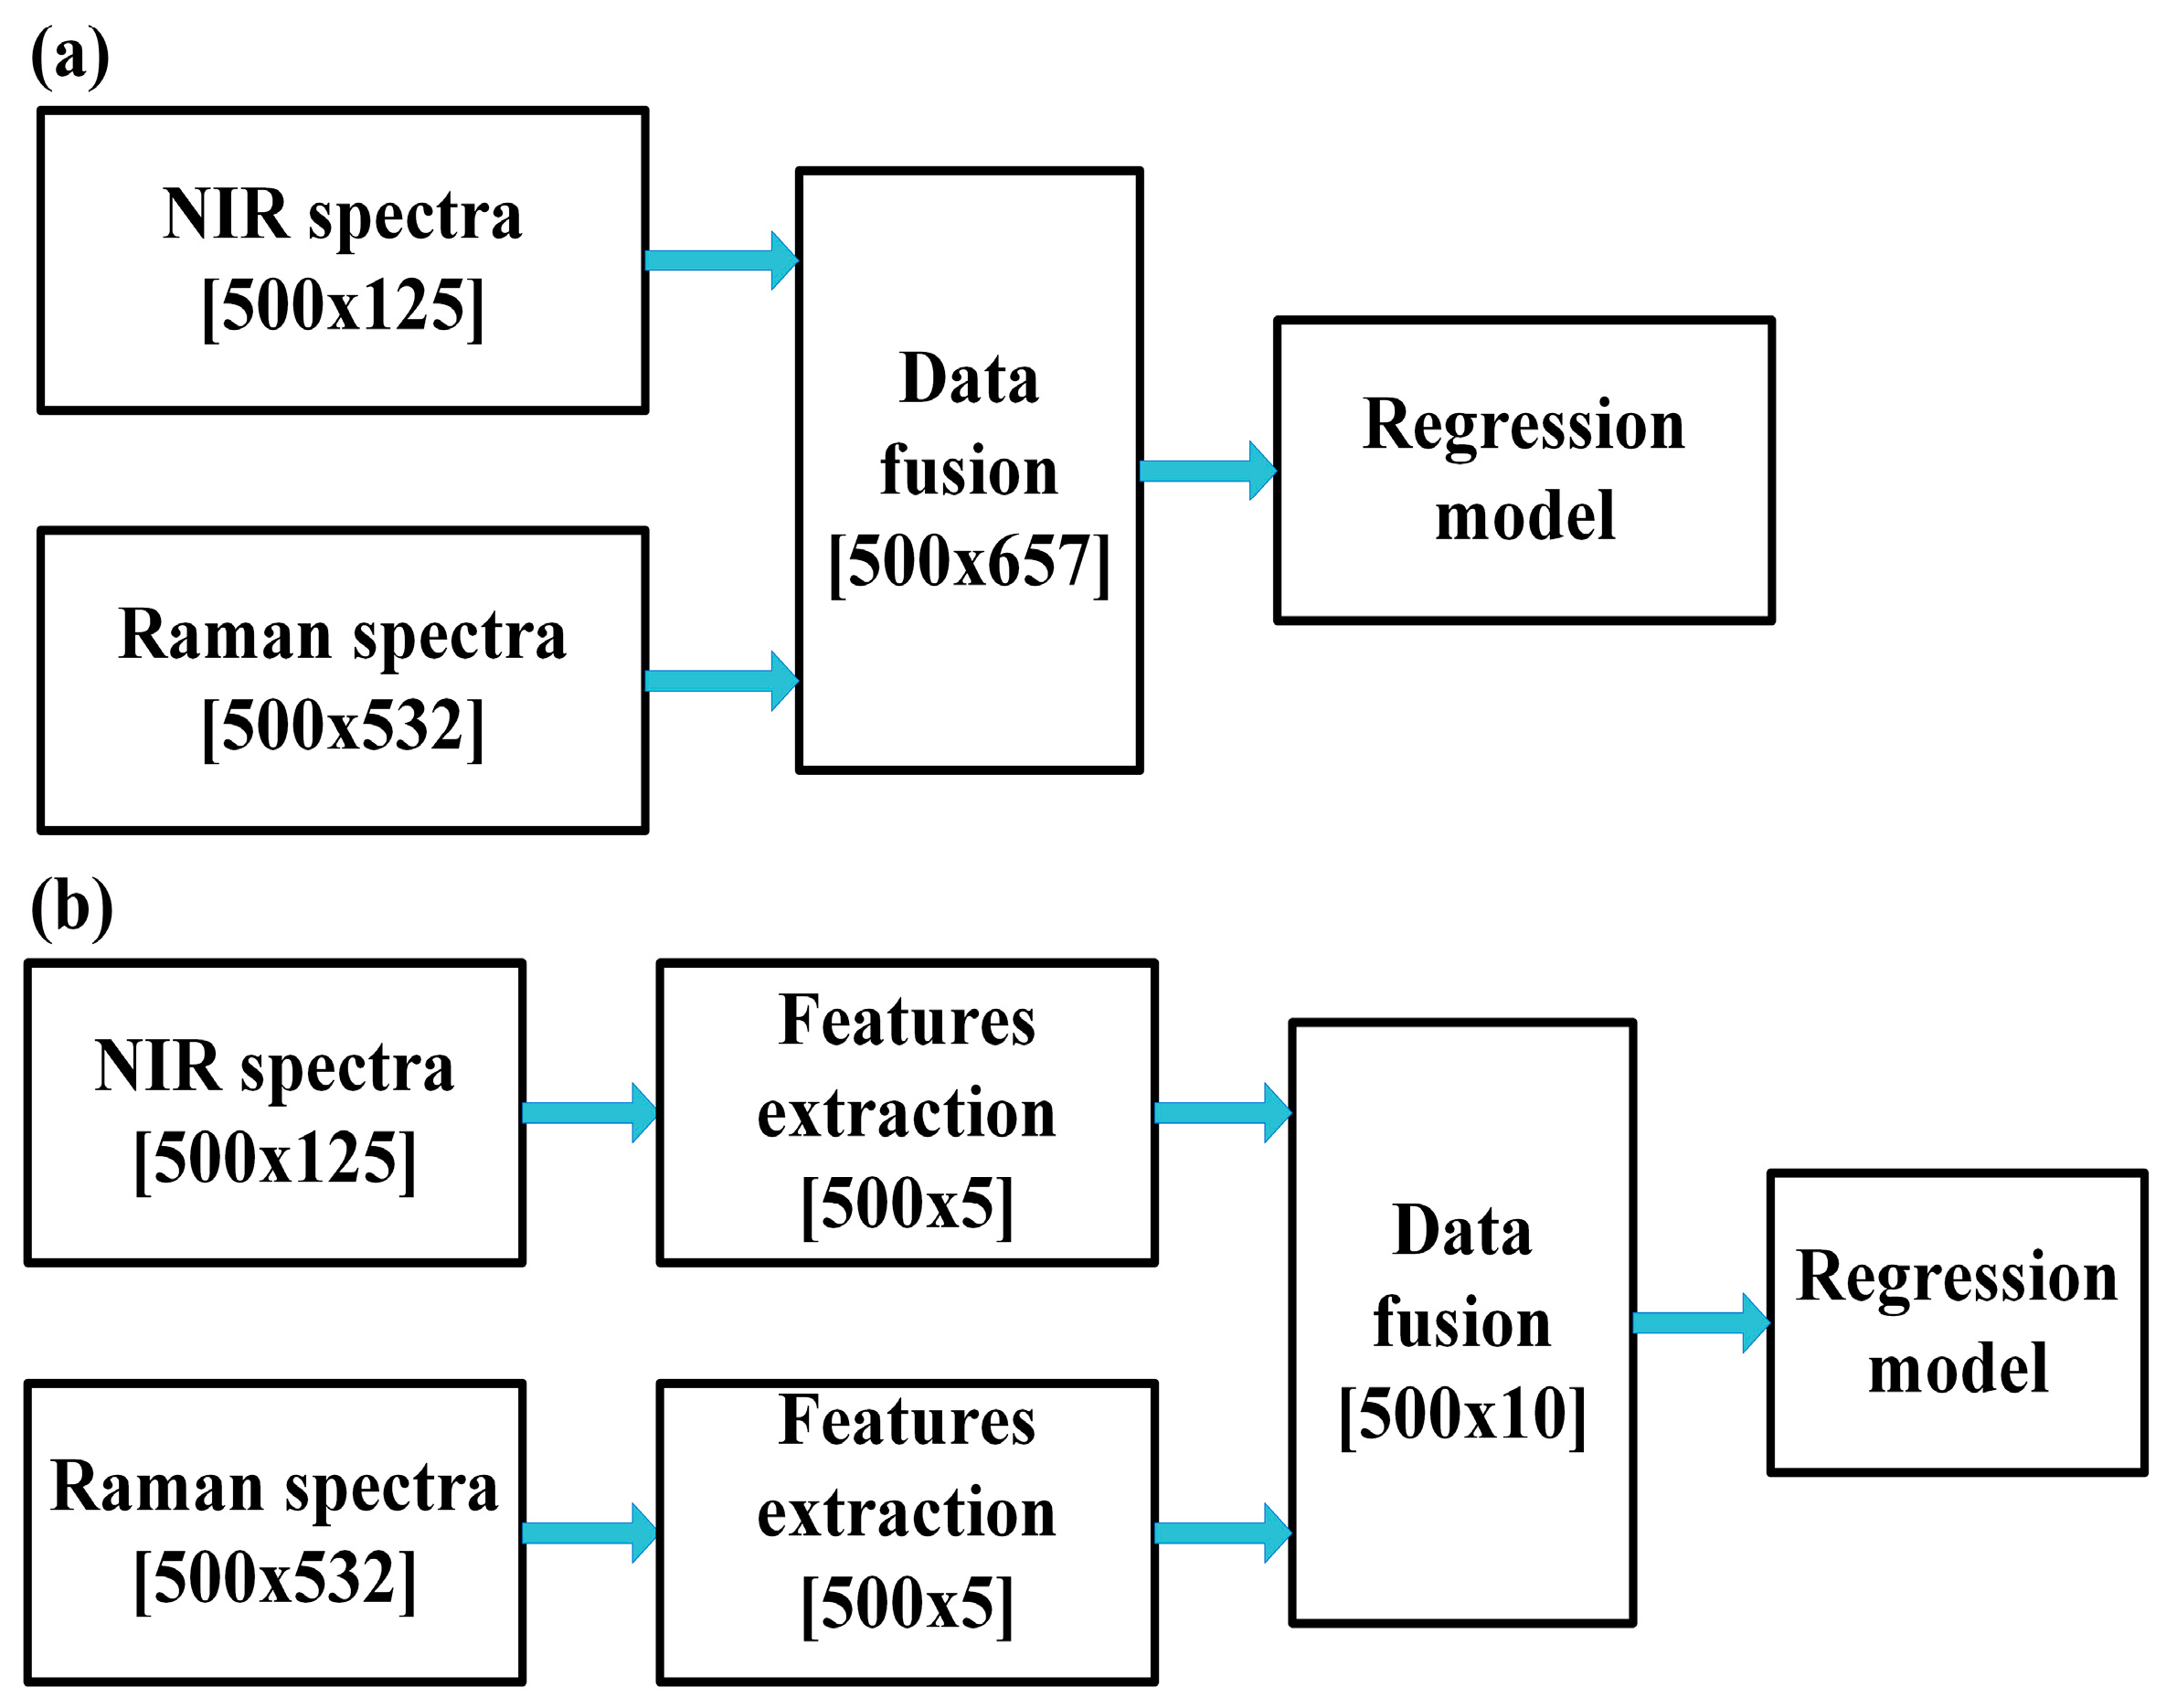
The NIR and Raman spectra of virgin PP and PS melt are shown in Figure 2a,b respectively. The featured wavelength and wavenumber are marked in the figures and assigned in Table 3 [24,25]. Figure 2c,d show the in-line NIR and Raman spectra (the average of 50 spectra) after the pre-process of calibration sets. It can be seen that both the NIR and Raman spectra change regularly with the change of the blending ratio. The peak of PP decreases gradually with the decreasing PP content, and then be covered by the peak of PS. The NIR spectrum has a lot of noise despite smoothing Due to the complex environment in the extruder. Therefore, the NIR spectra ranging from 1100 nm to 1300 nm and the Raman spectra from 1600 cm−1 to 600 cm−1, which contain most of the feature information, are extracted to build the model. The extracted NIR and Raman spectra are concatenated to form the low-level fused data because the normalization process has been performed. The mid-level fused data is produced by the connection of extracted features that are gained by principal component analysis (PCA). Choosing the number of components by the high fraction of variation explained is one of the most frequently-used method [26]. In this study, the explained variance of first five principal components is 99.9%, which indicates that five principal components can represent the original data well. Therefore, five principal components are utilized to represent the spectral data. The schematic of both two fusion strategies is shown in Figure 3; 500 is the number of samples and 125 and 532 are the dimensions of NIR and Raman spectra, respectively.

3.2. Comparison of Models

Table 4 summarizes the validation results. Obviously, there are significant differences in the prediction results for different prediction sets, and the prediction result is worse when the grade of polymer in the prediction set is different from that in the calibration set. In the comparison of three calibration models, it can be clearly seen that the prediction results of non-linear models ANN and ELM are much more accurate than that of the PLS linear model, except the results of prediction set 3 using individual NIR spectra as the inputs, and the performance of ELM model is a little better than the ANN model. The prediction results of PLS models that are based on Raman data are very poor due to the nonlinearity of Raman spectra.
From the viewpoint of prediction, based on the ANN and ELM models, except for the result of ELM on prediction set 3, the RMSEP is lower and R2 is closer to 1 when the low and mid-level fusion are applied, especially for prediction set 2 and set 3. This confirms that the data fusion strategy is satisfactorily applied, and prediction results of ANN and ELM model become more accurate. PLS linear models built by low and mid-level fused data are affected by the nonlinearity of the Raman spectra, so the prediction results of it for prediction set 3 (low-level fusion: R2 = 0.9607, RMSEP = 5.1196 wt. %; mid-level fusion: R2 = 0.9554, RMSEP = 5.4502 wt. %) show a lower degree of accuracy and higher RMSEP than the prediction results of the PLS model that was built by individual NIR spectra (R2 = 0.9904, RMSEP = 2.5311 wt. %). The results of the PLS models are not discussed below, due to the nonlinearity of Raman spectra.
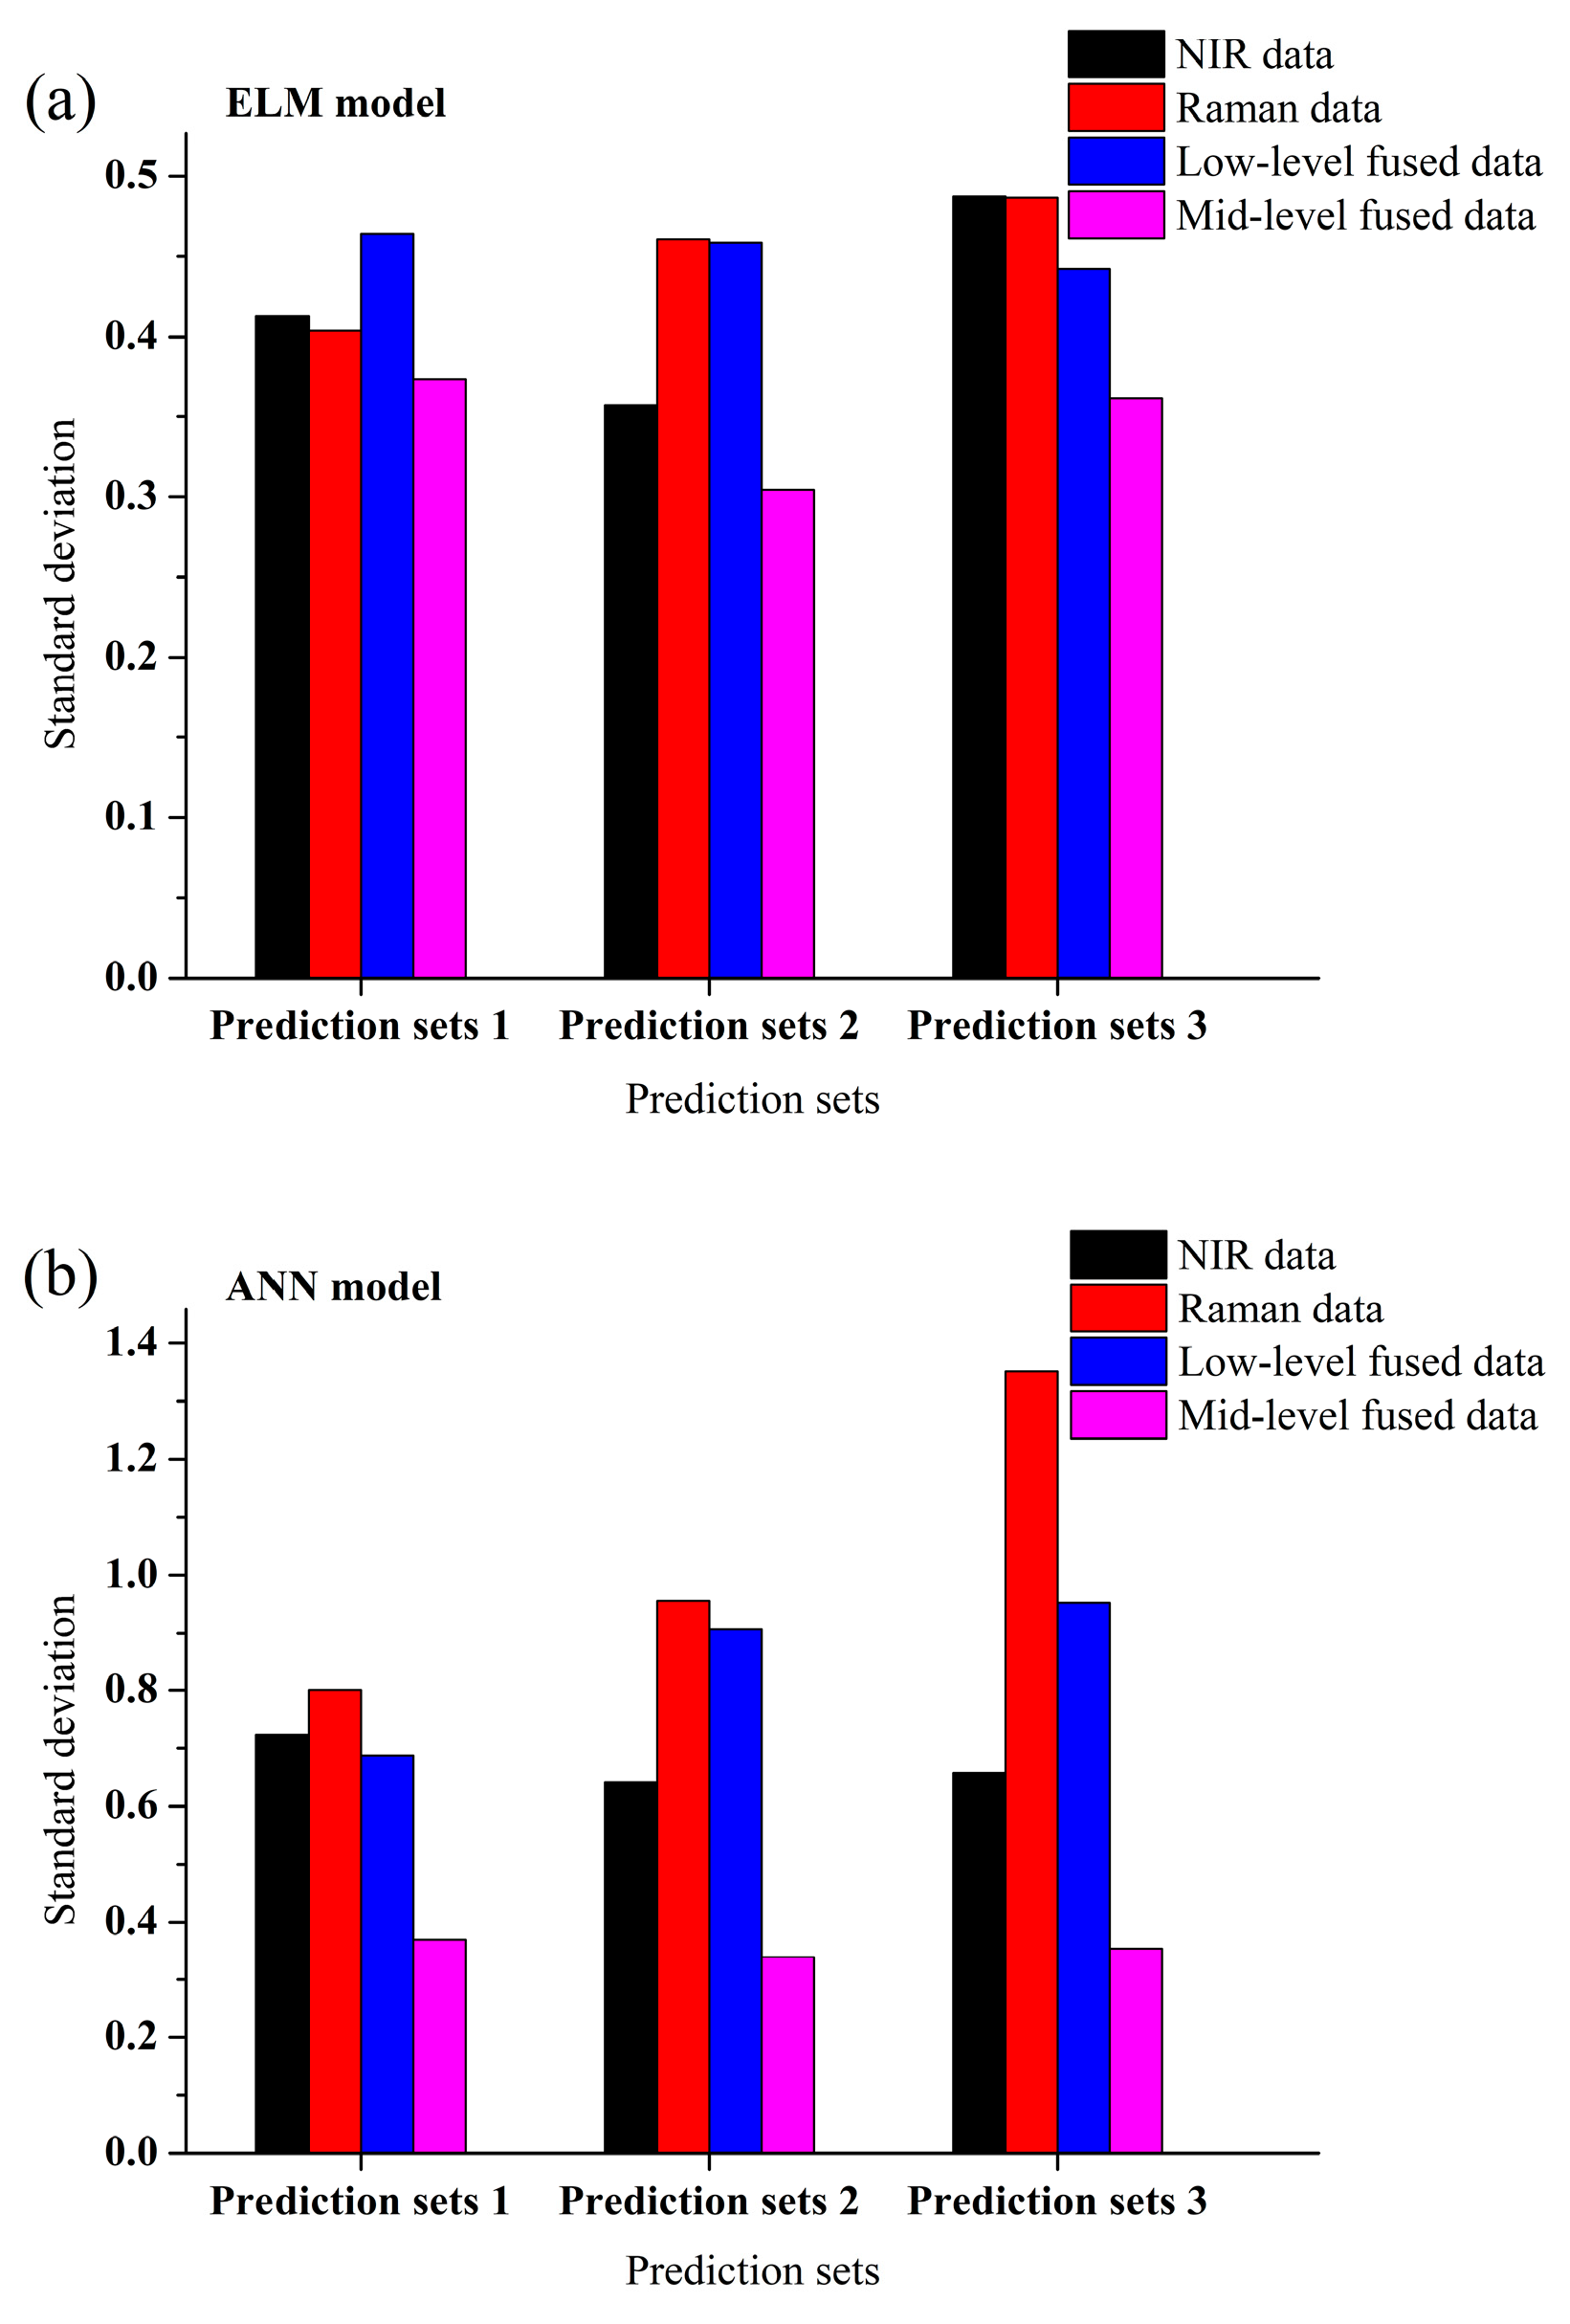
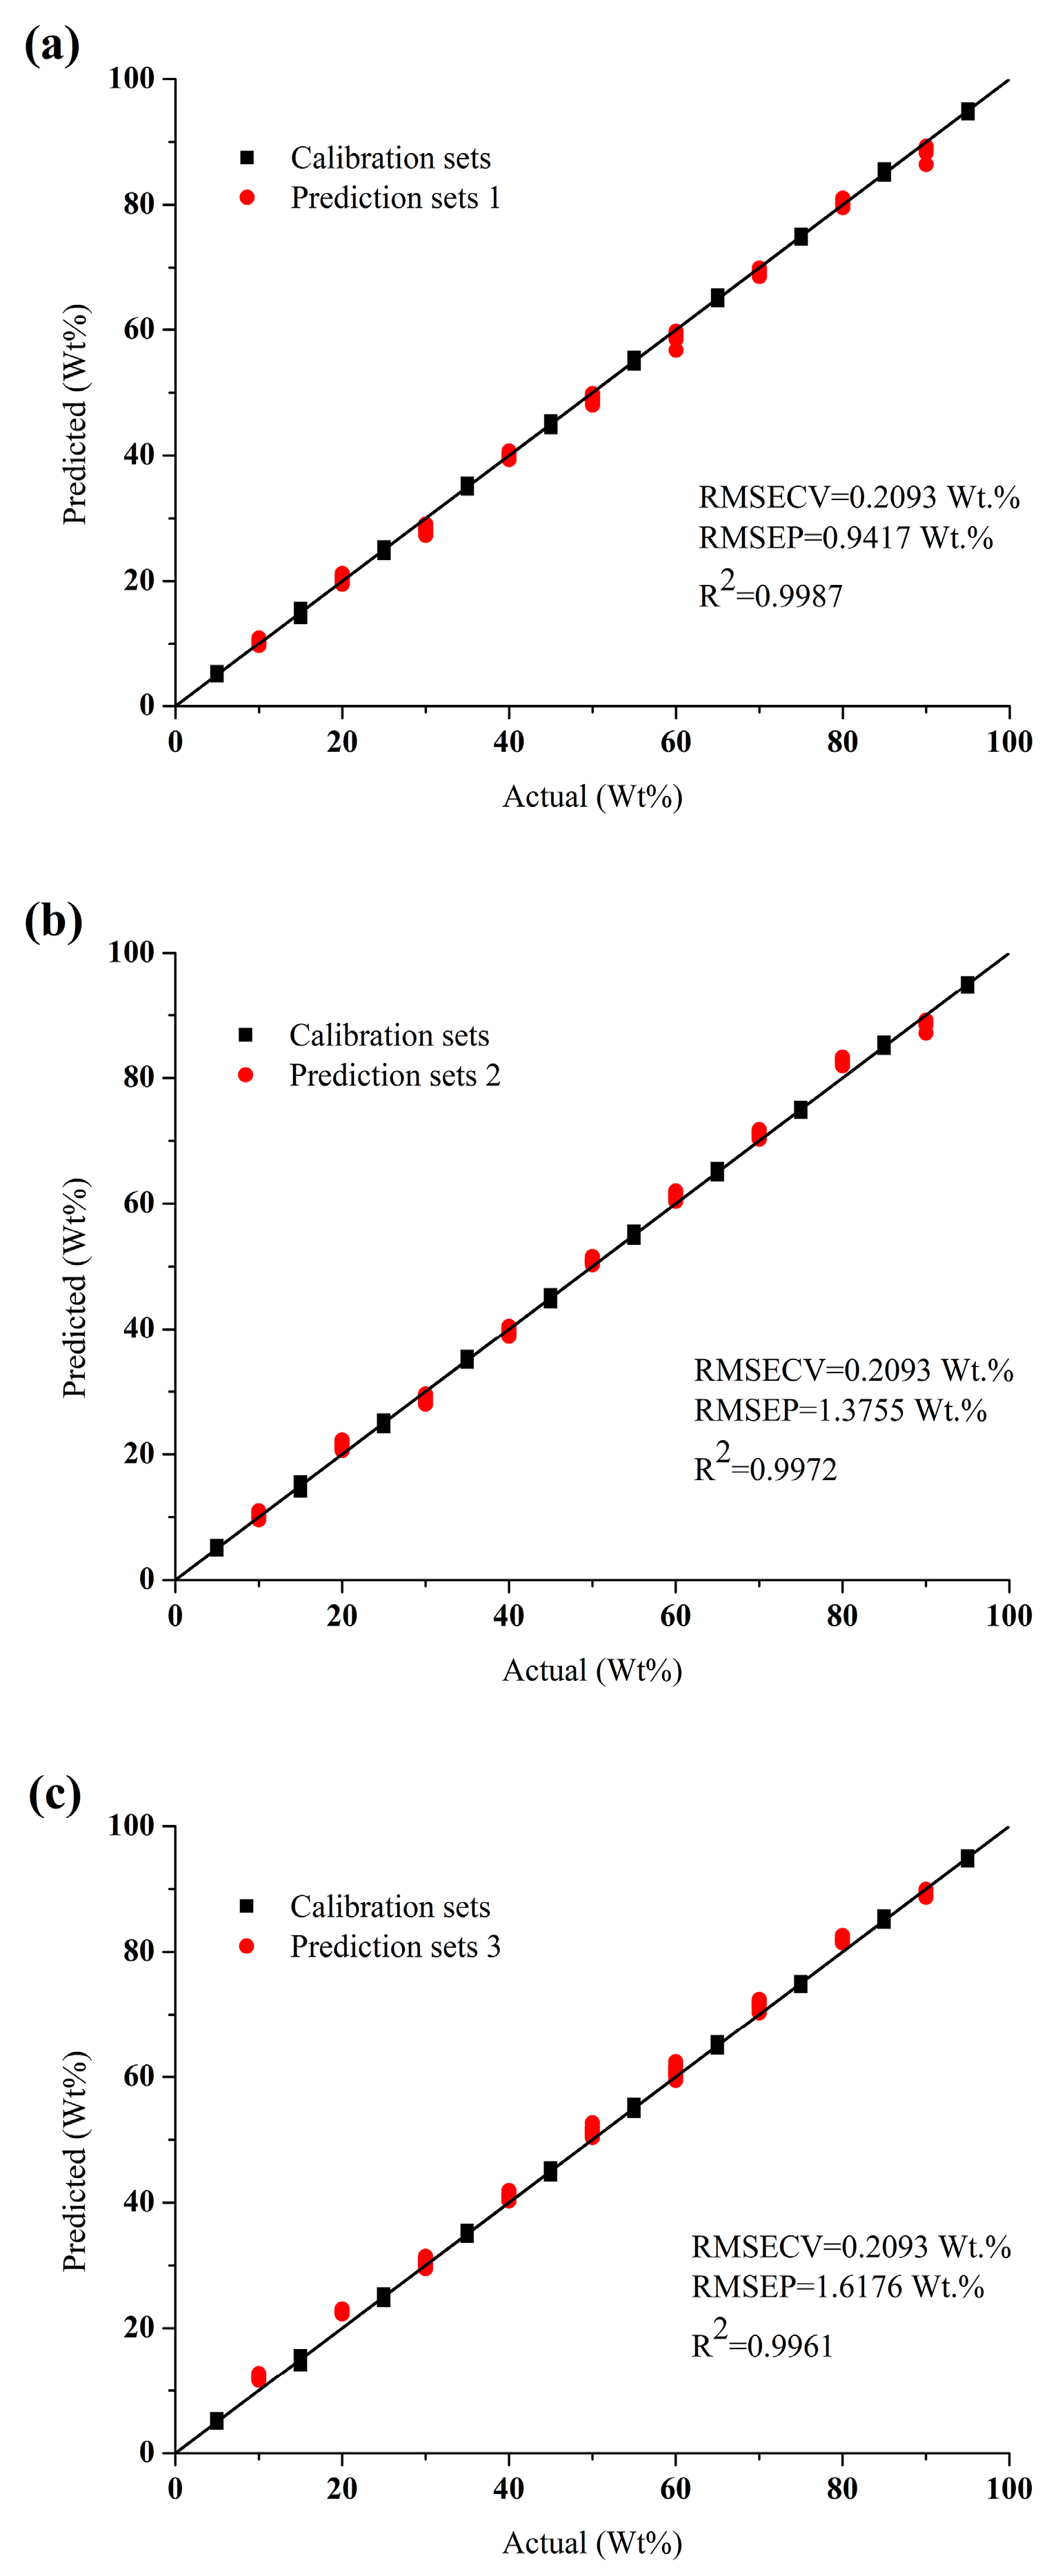
Figure 4 shows the predicted error distribution of ANN and ELM models while using different data as inputs in order to show the superiority of the data fusion strategy more intuitively. Whether in ANN model or ELM model, as compared with the predicted results of models built by individual spectra, the error distribution is narrower and error is smaller by applying data fusion strategies, which means that the analysis accuracy is improved. The standard deviation of ELM and ANN models using different data as inputs are shown in Figure 5. Whether in the ANN model or ELM model, as compared with the standard deviation of models built by individual spectra, the standard deviation is reduced when the mid-level fusion is applied. It is the PCA step during the mid-level fusion that reduces the undulation of data. The adoption of the mid-level fusion can further improve the robustness of model when compared with the low-level fusion. Hence, considering both accuracy and robustness, mid-level fusion is more suitable for in-line measurement of component content of molten polymer. The optimal model is the ANN model built from mid-level fused data as shown in Figure 6. The RMSEC is 0.2093 wt. % and the R2 and the RMSEP for prediction set 1, set 2 and set 3 are 0.9987 and 0.9417 wt. %, 0.9972 and 1.3755 wt. %, 0.9961 and 1.6176 wt. %.

4. Conclusions

In this study, a combination of NIR and Raman spectroscopy using data fusion strategy is researched, which aimed for an enhanced in-line measurement of component content of molten polymer blends. As for the nonlinear regression model, the benefit of the data fusion strategy in the present study is clear, because the prediction result is more accurate, especially when different grades of polymer blends are inspected.
The mid-level fusion strategy dose further improves the robustness of predictions when compared with the low-level fusion of the NIR and Raman spectroscopy. Therefore, the nonlinear regression model adopting the mid-level fused data as input can greatly improve the in-line measurement of component content of molten polymer blends while considering both accuracy and robustness. That then provides the metrological basis for process optimization and control in plastics industrial applications.

Author Contributions

S.Z. research design, literature retrieval, data collection and analysis, manuscript writing; Z.S. resources, review and editing; S.S. supervision, review and editing; M.W. supervision, review and editing; G.J. conceptualization, review and editing.

Funding

This research was funded by the National Key R&D Program of China (grant 2017YFB0307603), the National Instrumentation Program of China (grant 2012YQ230043) and the General Program of National Natural Science Foundation of China (grant 11572129).

Conflicts of Interest

There are no conflict of interest.

References

  1. Robeson, L.M. Application of Polymer Blends: Emphasis on Recent Advances. Polym. Eng. Sci. 2010, 24, 587–597. [Google Scholar] [CrossRef]
  2. Spiess, H.W. NMR Methods for Solid Polymers. Annu. Rev. Mater. Res. 1991, 21, 131–158. [Google Scholar] [CrossRef]
  3. Kamenskii, M.G.; Molchanov, Y.M. application of the method of thermogravimetric analysis fordetermination of the contents of components in organicplastics. Mech. Compos. Mater. 1981, 17, 242–245. [Google Scholar] [CrossRef]
  4. Baeten, V.; Dardenne, P. Spectroscopy: Developments in instrumentation and analysis. Grasas Y Aceites 2002, 53, 45–63. [Google Scholar] [CrossRef]
  5. Kong, J.; Yu, S. Fourier transform infrared spectroscopic analysis of protein secondary structures. Acta Biochim. Biophys. Sin. 2007, 39, 549–559. [Google Scholar] [CrossRef] [PubMed]
  6. Cho, B.K. Spectroscopic Techniques for Nondestructive Quality Inspection of Pharmaceutical Products: A Review. J. Biosyst. Eng. 2015, 40, 394–408. [Google Scholar] [Green Version]
  7. Teixeira, A.M.; Sousa, C. A review on the application of vibrational spectroscopy to the chemistry of nuts. Food Chem. 2019, 277, 713–724. [Google Scholar] [CrossRef]
  8. Alig, I.; Fischer, D.; Lellinger, D.; Steinhoff, B. Combination of NIR, Raman, Ultrasonic and Dielectric Spectroscopy for In Line Monitoring of the Extrusion Process. Macromol. Symp. 2005, 230, 51–58. [Google Scholar] [CrossRef]
  9. Coates, P.D.; Barnes, S.E.; Sibley, M.G.; Brown, E.C.; Edwards, H.G.M.; Scowen, I.J. In-process vibrational spectroscopy and ultrasound measurements in polymer melt extrusion. Polymer 2003, 44, 5937–5949. [Google Scholar] [CrossRef]
  10. Jr, C.A.C.; Pontier, A.; Durand, J.; Pinto, J.C.; Prat, L. Real time monitoring of the quiescent suspension polymerization of methyl methacrylate in microreactors—Part 1. A kinetic study by Raman spectroscopy and evolution of droplet size. Chem. Eng. Sci. 2015, 131, 340–352. [Google Scholar]
  11. Brun, N.; Chevrel, M.C.; Falk, L.; Hoppe, S.; Durand, A.; Chapron, D.; Bourson, P. Contribution of Raman Spectroscopy to In Situ Monitoring of a High-Impact Polystyrene Process. Chem. Eng. Technol. 2014, 37, 275–282. [Google Scholar] [CrossRef]
  12. Reis, M.M.; Araújo, P.H.H.; Sayer, C.; Giudici, R. Evidences of correlation between polymer particle size and Raman scattering. Polymer 2003, 44, 6123–6128. [Google Scholar] [CrossRef]
  13. Hansen, M.G.; Vedula, S. In-line fiber-optic near-infrared spectroscopy: Monitoring of rheological properties in an extrusion process. Part I. J. Appl. Polym. Sci. 1998, 68, 859–872. [Google Scholar] [CrossRef]
  14. Batra, J.; Khettry, A.; Hansen, M.G. In-line monitoring of titanium dioxide content in poly (ethylene terephthalate) extrusion. Polym. Eng. Sci. 1994, 34, 1767–1772. [Google Scholar] [CrossRef]
  15. Dumitrescu, O.R.; Baker, D.C.; Foster, G.M.; Evans, K.E. Near infrared spectroscopy for in-line monitoring during injection moulding. Polym. Test. 2005, 24, 367–375. [Google Scholar] [CrossRef]
  16. Barnes, S.E.; Sibley, M.G.; Edwards, H.G.M.; Coates, P.D. Process monitoring of polymer melts using in-line spectroscopy. Trans. Inst. Meas. Control. 2007, 29, 453–465. [Google Scholar] [CrossRef]
  17. Castanedo, F. A review of data fusion techniques. Sci. World J. 2013, 2013, 704504. [Google Scholar] [CrossRef]
  18. Márquez, C.; López, M.I.; Ruisánchez, I.; Callao, M.P. FT-Raman and NIR spectroscopy data fusion strategy for multivariate qualitative analysis of food fraud. Talanta 2016, 161, 80–86. [Google Scholar] [CrossRef]
  19. Dearing, T.I.; Thompson, W.J.; Rechsteiner, C.E.; Marquardt, B.J. Characterization of Crude Oil Products Using Data Fusion of Process Raman, Infrared, and Nuclear Magnetic Resonance (NMR) Spectra. Appl. Spectrosc. 2011, 65, 181–186. [Google Scholar] [CrossRef]
  20. Comino, F.; Ayora-Cañada, M.J.; Aranda, V.; Díaz, A.; Domínguez-Vidal, A. Near-infrared spectroscopy and X-ray fluorescence data fusion for olive leaf analysis and crop nutritional status determination. Talanta 2018, 188, 676–684. [Google Scholar] [CrossRef]
  21. Huang, G.B.; Zhu, Q.Y.; Siew, C.K. Extreme learning machine: Theory and applications. Neurocomputing 2006, 70, 489–501. [Google Scholar] [CrossRef]
  22. Rinnan, Å.; Berg, F.V.D.; Engelsen, S.B. Review of the most common pre-processing techniques for near-infrared spectra. Trends Anal. Chem. 2009, 28, 1201–1222. [Google Scholar] [CrossRef]
  23. Mirchandani, G.; Cao, W. On hidden nodes for neural nets. IEEE Trans. Circuits Syst. 1989, 36, 661–664. [Google Scholar] [CrossRef]
  24. Workman, J. Practical Guide to Interpretive Near-Infrared Spectroscopy; CRC Press: Boca Raton, FL, USA, 2007. [Google Scholar]
  25. Dong, K.; Rao, Z.F.; Yang, X.Y.; Lin, J.C.; Zhang, P.X. Determination of Several Plastic by Raman Spectroscopy. China Plast. Ind. 2011, 39, 67–70. [Google Scholar]
  26. Bro, R.; Smilde, A.K. Principal component analysis. Anal. Methods 2014, 6, 2812–2831. [Google Scholar] [CrossRef] [Green Version]
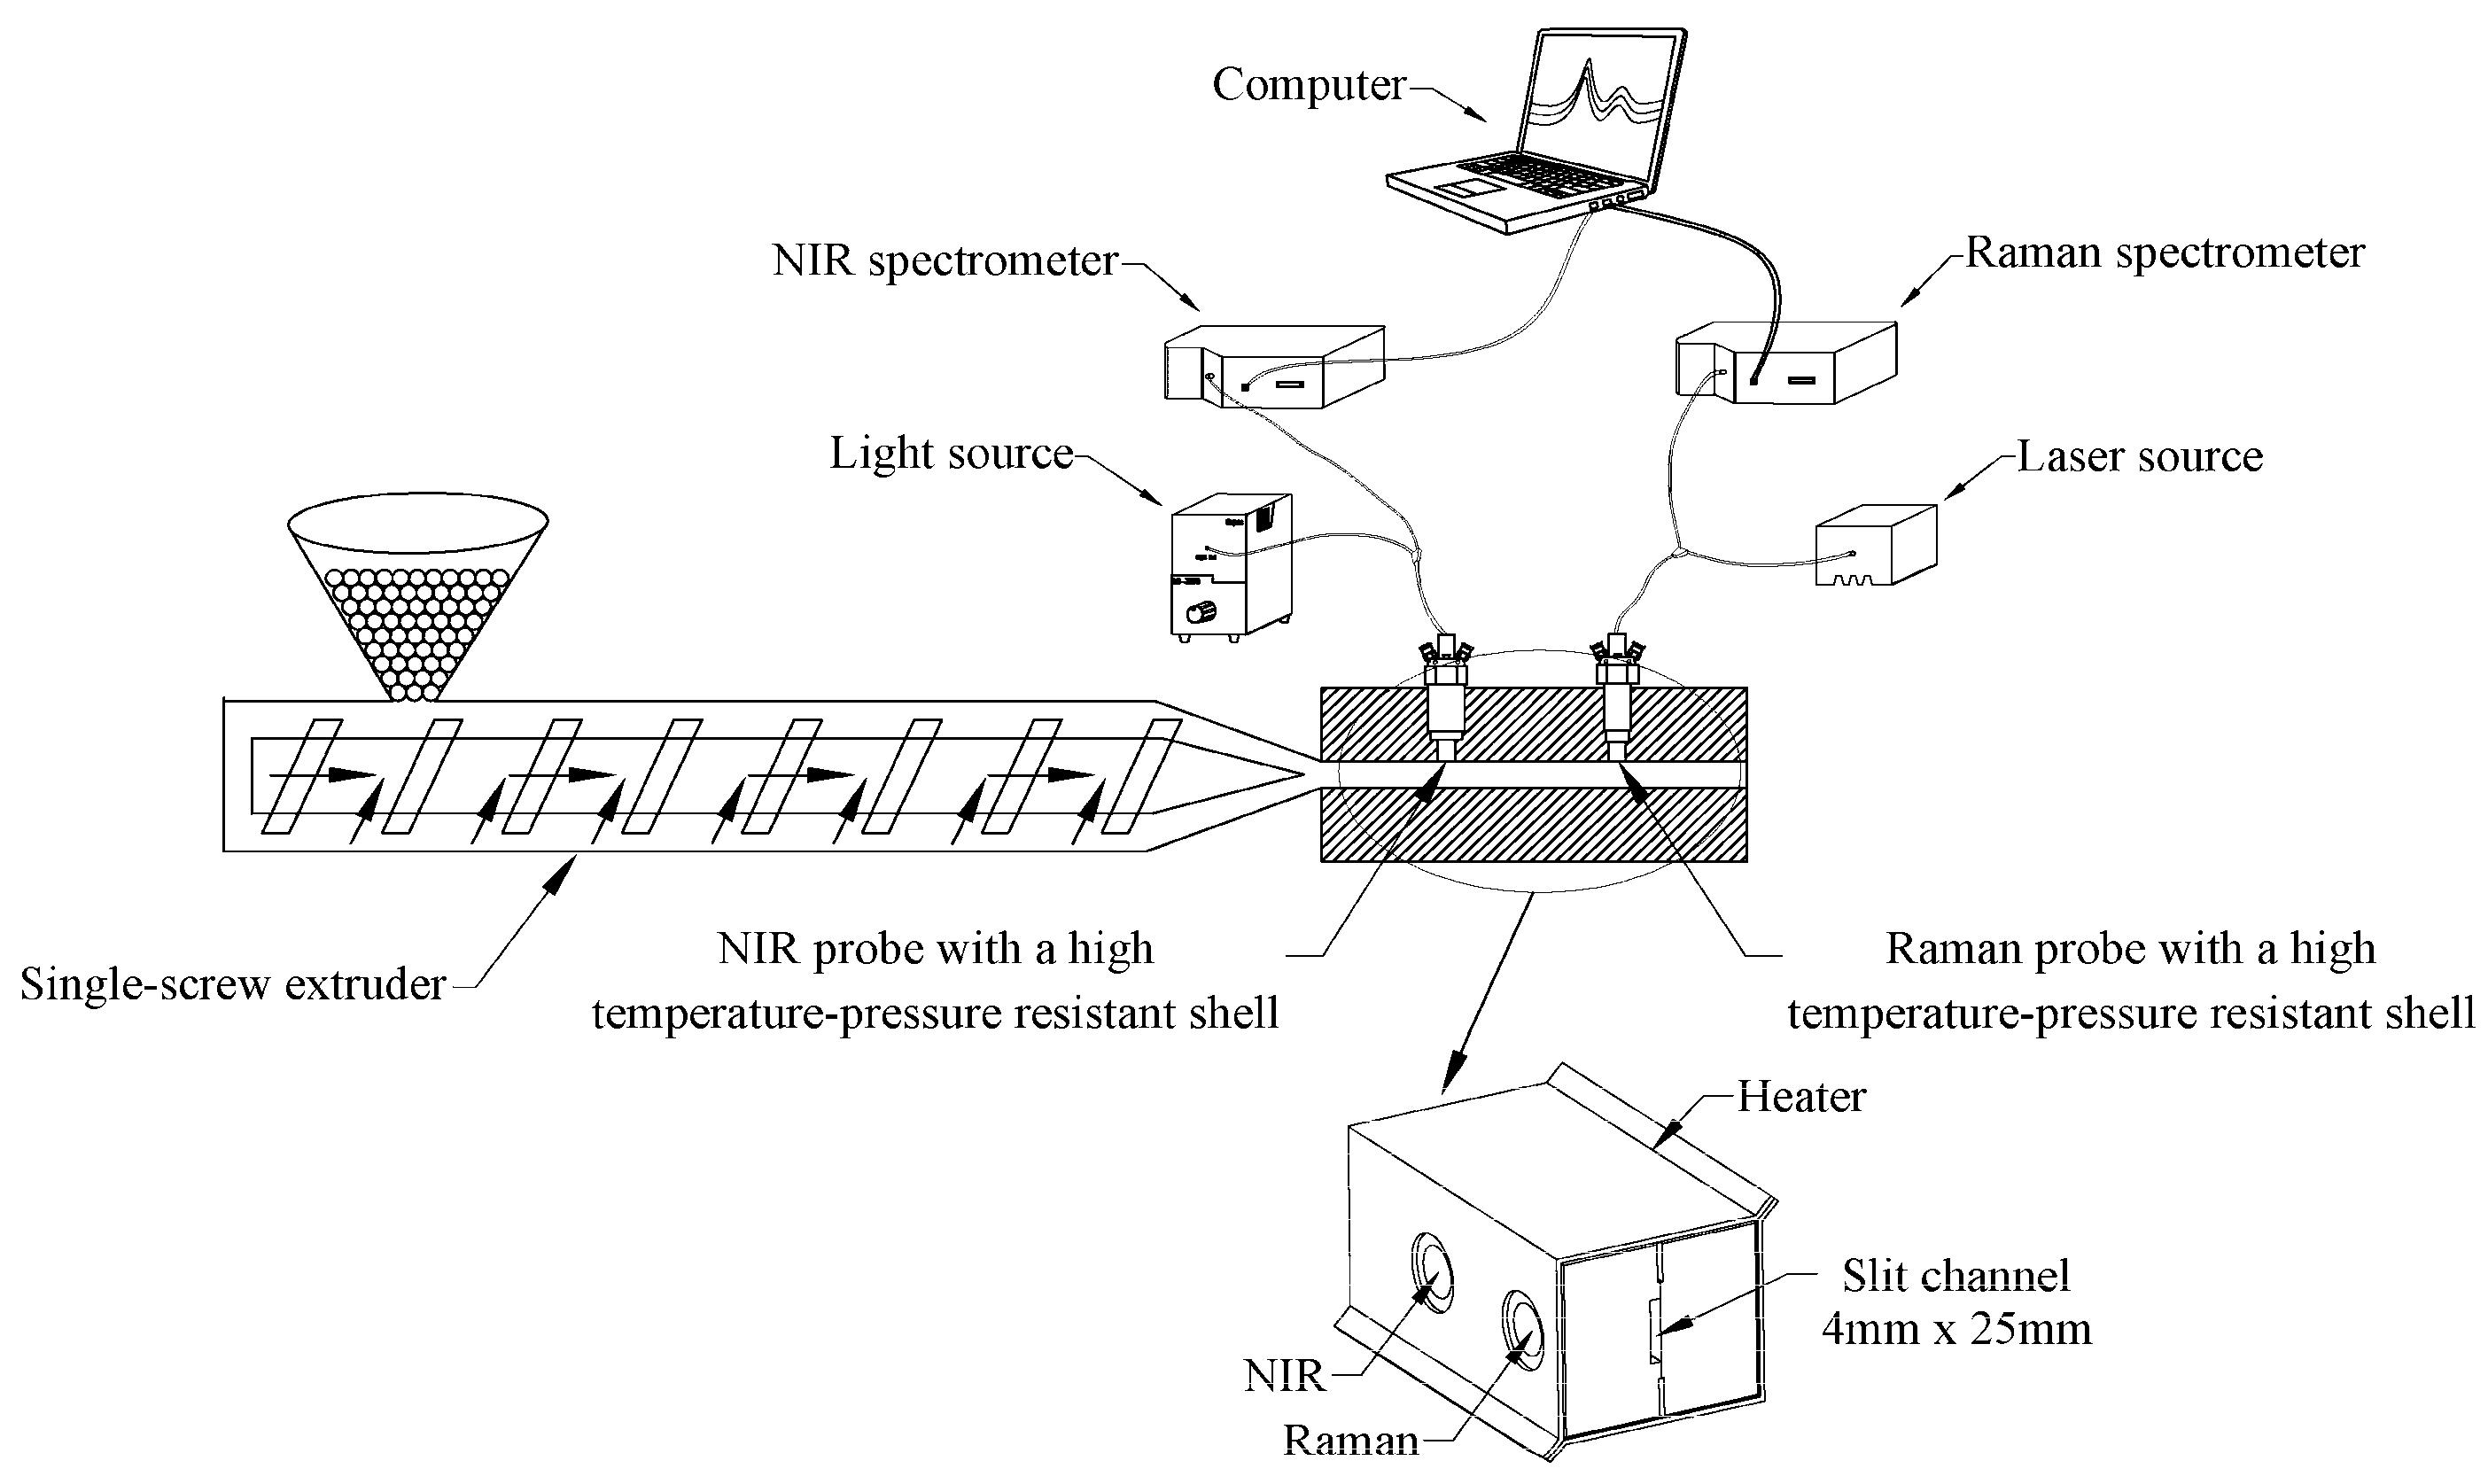
Figure 1. Schematic diagram of in-line near-infrared (NIR) and Raman spectroscopy measurement system.
Sensors 19 03463 g001
Figure 2. (a) Raw NIR spectra of polypropylene (PP) and polystyrene (PS), (b) Raw Raman spectra of PP and PS, (c) In-line NIR spectra of calibration sets, and (d) In-line Raman spectra of calibration sets.
Sensors 19 03463 g002
Figure 3. The schematic of (a) low-level fusion and (b) mid-level fusion.
Sensors 19 03463 g003
Figure 4. Predicted error of (a) extreme learning machine (ELM) and (b) artificial neural network (ANN) models using different data as inputs.
Sensors 19 03463 g004
Figure 5. Standard deviation of (a) ELM and (b) ANN models while using different data as inputs.
Sensors 19 03463 g005
Figure 6. The optimal model based on calibration and (a) prediction set 1, (b) prediction set 2, (c) prediction set 3 using the mid-level fused data as inputs.
Sensors 19 03463 g006
Table 1. The details of materials.
MaterialGradesDensity (g/cm3)Melt Flow Index (g/10 min)
PPEP548R-Basell0.90521
HP741T-Basell0.960
7033N-Exxon Mobil0.98
PS158K-BASF1.053.15
PG33-QIMEI1.058
Table 2. The details of sample set.
SetsGradesPP Contents
Calibration setsPP-EP548R/PS-158KFrom 95 to 5 wt. % at 10 wt. % intervals
Prediction sets 1PP-EP548R/PS-158KFrom 90 to 10 wt. % at 10 wt. % intervals
Prediction sets 2PP-HP741T/PS-158KFrom 90 to 10 wt. % at 10 wt. % intervals
Prediction sets 3PP-7033N/PS-PG33From 90 to 10 wt. % at 10 wt. % intervals
Table 3. Band assignments of in-line NIR and Raman spectra of PP and PS.
ComponentNIR Band (nm)AssignmentRaman Band (cm−1)Assignment
PP1194Methyl C-H1454-CH2- scissoring
1215/1395Methylene C-H1324-CH2- twisting
1150C-C skeleton stretching
967/832-CH3 rocking
PS1143Aromatic C-H1447-CH- asymmetric bending
1211/1395Methylene C-H1185C-Ph asymmetric stretching
1154/789C-Ph asymmetric stretching
1028C-C asymmetric stretching in the benzene ring
998Benzene ring breathing
Table 4. Summary of model validation results.
Data SourceSetsPLS ModelANN ModelELM Model
R2RMSEP/wt.%R2RMSEP/wt.%R2RMSEP/wt.%
NIR spectraPrediction set 10.9916 (11) a2.37250.9978 (9)1.22110.9984 (99)1.0241
Prediction set 20.9858 (11)3.07950.9916 (9)2.38190.9928 (99)2.1863
Prediction set 30.9904 (11)2.53110.9794 (9)3.50720.9854 (99)3.1249
Raman spectraPrediction set 10.8335 (5)10.53650.9954 (9)1.69180.9986 (78)0.9789
Prediction set 20.0049 (5)25.75590.9836 (9)3.13080.9917 (78)2.3571
Prediction set 30.7095 (5)13.91660.9929 (9)2.23240.9974 (78)1.3133
Low-level fused dataPrediction set 10.9963 (8)1.60110.9983 (9)1.08770.9994 (124)0.6583
Prediction set 20.9939 (8)2.02000.9973 (9)1.29110.9986 (124)0.9507
Prediction set 30.9607 (8)5.11960.9946 (9)1.83880.9955 (124)1.7408
Mid-level fused dataPrediction set 10.9945 (9)1.91590.9987 (9)0.94170.9985 (47)0.9923
Prediction set 20.9909 (9)2.45950.9972 (9)1.37550.9970 (47)1.4142
Prediction set 30.9554 (9)5.45020.9961 (9)1.61760.9958 (47)1.6803
a Values in parenthesis are the number of latent variables of PLS or neurons of hidden layer.